More
    Home Blog Page 12

    pump.fun vs Believe: Best Solana Launchpad 2026?

    0

    pump.fun made the memecoin launchpad category a real business, printing hundreds of millions in fees at its peak. Believe took a very different angle: reply to a tweet, and your token is live on Solana in seconds. In 2026 both are still going, but the mix of who they serve and how much they earn has shifted hard. This guide breaks down fees, features, mechanics, security, and who each one is actually good for right now.

    Quick Verdict (TL;DR)

    • Winner for pure memecoin volume: pump.fun. It still runs the largest bonding-curve pipeline on Solana, has its own DEX (PumpSwap), and remains the default place where casual traders hunt fresh tickers.
    • Winner for creators and social launches: Believe. Launching a token by replying to an X post is genuinely novel, the 50/50 creator revenue share is the most creator-friendly economics in the category, and the crowd skews toward founders, indie builders, and internet-native brands.
    • Best for high-conviction buyers who want deeper post-graduation liquidity: Believe, since graduated tokens migrate to Meteora with dynamic fee LPs rather than sitting on an in-house DEX.
    • Best for degens sniping the first ten minutes: pump.fun, because volume, tooling, and audience size still favor it.

    If you only care about which platform is bigger, pump.fun wins on raw numbers. If you care about which platform is more interesting in 2026, Believe is the story.

    Overview: What Each Platform Actually Is

    pump.fun is the OG Solana memecoin launchpad. Anyone can deploy a token in a few clicks. Trading happens on a bonding curve first, and once the token hits a target market cap it “graduates” to a real AMM pool. In March 2025 the team launched their own DEX, PumpSwap, so graduated tokens now migrate there by default instead of Raydium. That vertical integration means pump.fun captures fees across the entire lifecycle: bonding curve, migration, and post-grad trading.

    Believe (formerly launchcoin.io, founded by Ben Pasternak) is a Solana launchpad that lives inside X (Twitter). To create a token, you reply to a specific @launchcoin post with a ticker. The backend deploys the token on Solana automatically. No wallet, no gas, no bonding curve interface. Once a Believe token crosses ~$100,000 in market cap, it graduates off the bonding curve and migrates into Meteora, a Solana liquidity protocol. The ecosystem token, LAUNCHCOIN, sits at the center of the platform’s fee model.

    Same category, wildly different funnels. pump.fun optimizes for volume of launches and speed of speculation. Believe optimizes for social distribution and creator alignment.


    pump.fun official Open Graph brand image
    Believe / LAUNCHCOIN logo

    Feature Deep Dive

    Token creation experience

    On pump.fun, you fill out a form: name, ticker, image, optional links. Sign with a wallet, pay ~0.02 SOL, and the token is live on a bonding curve. Total time from idea to tradable token: under a minute, but you need a Solana wallet and some SOL.

    On Believe, you tweet a reply to @launchcoin with your desired ticker. The bot replies with a live token link within seconds. Total time: about ten seconds, and you do not need a wallet at any point. That is a meaningfully lower barrier for non-crypto-native creators.

    Trading mechanics

    Bonding curve mechanics illustration

    Both use a dynamic bonding curve for the pre-graduation phase. Early buyers get lower prices, and the price rises as more tokens are bought. On pump.fun, a token graduates when its curve fills at roughly $69k market cap (about 86 SOL of purchases). On Believe, the graduation threshold is higher at roughly $100k market cap, and the migration destination is Meteora rather than an in-house DEX.

    Under 2% of tokens ever created on pump.fun have graduated across its lifetime, and in mid-2026 the graduation rate collapsed to roughly 0.26% (per DEXTools reporting). Believe’s graduation rate is proportionally higher, but on a much smaller absolute base of tokens.

    Post-graduation destination

    This is where the strategic split shows up most clearly. pump.fun keeps graduated tokens in-house on PumpSwap, which launched with 0.25% swap fees (0.20% to LPs, 0.05% to protocol) and later added creator revenue sharing. Believe pushes graduates to Meteora’s dynamic AMM pools, which have deeper liquidity for larger trades and rebate mechanics that favor active LPs.

    If you like a walled-garden lifecycle, pump.fun is cleaner. If you prefer graduated tokens landing in the broader Solana DeFi stack, Believe fits better.

    Creator economics

    pump.fun runs a Dynamic Fee Model introduced in January 2026 that lets creators earn a slice of trading fees, and the exact percentage moves with token performance. The system is optimized for a small number of very high-volume winners.

    Believe splits trading fees 50/50 with the token creator. Every trade on your token pays you daily, as long as you have linked your X account. That is the most creator-favorable split in the launchpad category, and it explains why Believe attracts founders and creators who see the token as a product rather than a lottery ticket.

    Social distribution

    pump.fun tokens travel through the Solana degen ecosystem: Telegram channels, sniper bots, chart-watch communities. Believe tokens travel through X itself, since every launch is by definition a tweet. That means Believe tokens can go viral inside the same feed where they were created. It is a genuinely different growth loop.

    Fees & Pricing

    Both platforms take a cut on every trade, and both have layered fees beyond the headline number. Here is the practical breakdown.

    • pump.fun bonding curve swap fee: ~1% per trade (with a portion routable to creators under the Dynamic Fee Model).
    • PumpSwap post-graduation fee: 0.25% (0.20% LP, 0.05% protocol), plus optional creator revenue share.
    • pump.fun token creation cost: ~0.02 SOL upfront.
    • Believe bonding curve swap fee: ~1% per trade, with 50% flowing to the token creator daily.
    • Believe token creation cost: Effectively free from the user’s perspective (no wallet interaction required to launch).
    • Meteora post-graduation fees: Variable, set by dynamic fee LP pools that adjust to volatility.

    Priority fees, Jito tips, and Solana network fees apply on both platforms during high-congestion periods, so the effective all-in cost of a trade can be materially higher than the 1% swap fee alone.

    Side-by-Side Comparison
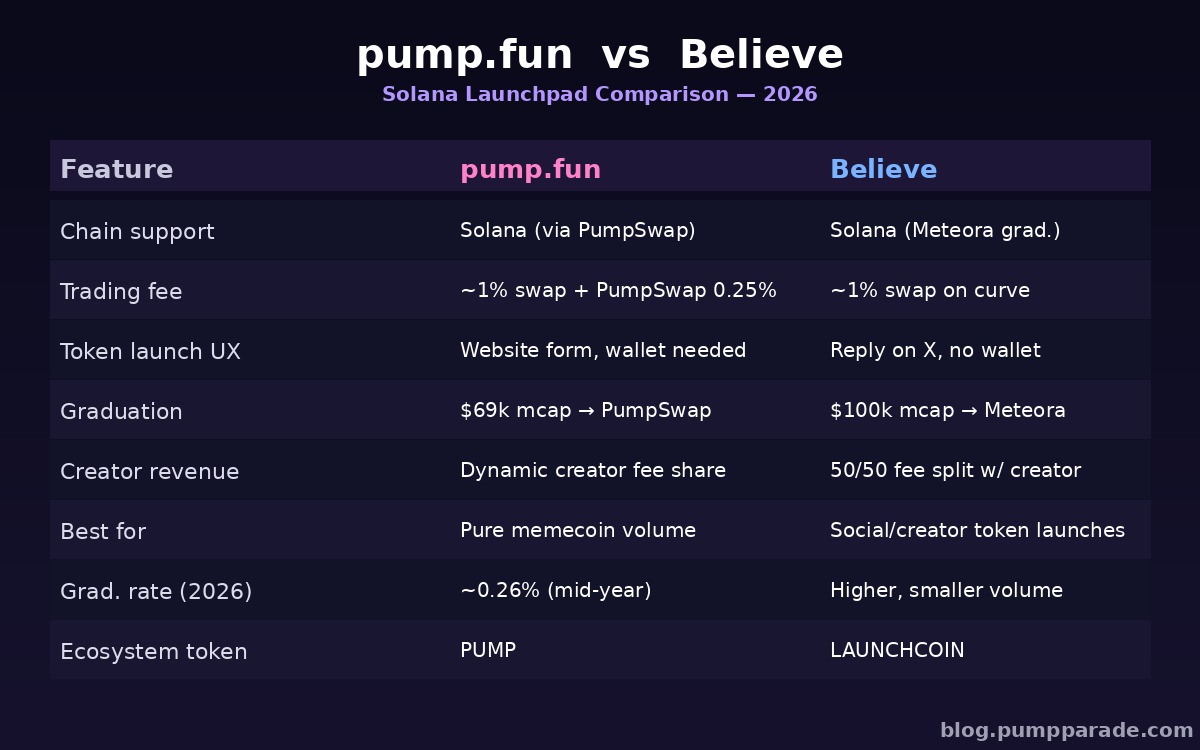
    pump.fun vs Believe feature and fee comparison table

    Pros & Cons

    pump.fun

    Pros:

    • Largest launchpad on Solana by cumulative volume and cumulative fees.
    • Vertically integrated with PumpSwap, so graduated tokens keep the fee cycle in-house.
    • Massive audience of degens, snipers, and copy traders means real liquidity from day one on the curve.
    • PUMP token gives the platform a formal on-chain expression that market participants can trade around.
    • Dynamic Fee Model rewards creators of tokens that actually attract volume.

    Cons:

    • Requires a Solana wallet with SOL to launch or trade, which is friction for non-crypto creators.
    • Graduation rate collapsed to ~0.26% in mid-2026, so most tokens never make it off the curve.
    • Revenue and fees are down sharply from the 2025 peak, reflecting broader memecoin fatigue.
    • The signal-to-noise ratio for new listings is brutally low.

    Believe

    Pros:

    • Zero-wallet, tweet-to-launch UX. Truly novel and truly frictionless for non-crypto users.
    • 50/50 creator revenue share is the most creator-aligned economics in the category.
    • Graduated tokens land in Meteora, which gives them deeper post-graduation liquidity than a walled-garden DEX.
    • Attracts a different, higher-signal user base: indie founders, internet-brand builders, X-native creators.
    • v2 beta’s Human Sentiment Market adds a real product surface beyond raw memecoin trading.

    Cons:

    • Volume and audience are a fraction of pump.fun’s, so early liquidity on Believe curves is thinner.
    • Depending on X for the launch surface concentrates platform risk (rate limits, policy changes, bot suspensions).
    • Fewer tooling and analytics integrations compared to the pump.fun ecosystem.
    • The bonding curve threshold to graduate ($100k mcap) is higher than pump.fun’s ($69k mcap), so it takes more buying to migrate.

    Security & Trust

    Both platforms are non-custodial for traders: trades happen on Solana against the bonding curve smart contract or the post-graduation AMM. Neither holds user funds. Both use Solana’s standard finality and confirmation guarantees.

    Token security is a different story. Because both platforms allow anyone to launch a token in seconds, the ratio of rug-adjacent or joke tokens to serious projects is very high. On pump.fun, mint authority, freeze authority, and LP burn status are visible in third-party tools like Birdeye and DexScreener, and experienced traders check these before every buy. On Believe, the launch flow strips out some technical customization, which reduces certain rug vectors but also makes tokens more homogeneous.

    The infrastructure risk is different too. pump.fun runs its own website, in-house DEX, and token architecture. Believe leans on Meteora for post-graduation liquidity and on X for launch surface. If X changes API rules or suspends the launch bot, Believe’s launch pipeline is materially exposed. If PumpSwap fails, pump.fun’s graduated tokens have a fallback route to Raydium and other Solana DEXs, but the default flow is disrupted.

    User Experience

    pump.fun’s website is dense and information-heavy. Live tokens scroll past in real time, charts update instantly, and every listing shows curve progress, holders, and top traders. If you already speak degen, it feels like home. If you do not, it feels like Bloomberg for memecoins.

    Believe’s UX is deliberately minimal. The primary interface is X itself: you see a token launch as a tweet in your feed, and clicking through takes you to the Believe page with a chart and a buy button. That is a very different mental model. It rewards social discovery over screen-watching.

    Mobile is where Believe’s design choice pays off. Because launches happen in tweets, and buying is a light in-app or web action, the entire loop works comfortably on a phone. pump.fun is usable on mobile but really wants a desktop with multiple tabs open.

    Verdict

    Rating:

    • pump.fun: 4.0 / 5 for memecoin launchpad category leadership, docked for declining metrics and low signal.
    • Believe: 4.2 / 5 for genuine product innovation, creator alignment, and a differentiated growth loop, docked for smaller audience and X-dependency risk.

    If you are a trader looking for the most volume and the deepest sniper meta, use pump.fun. If you are a builder, founder, or creator who wants to launch a token as an actual product with real economics, use Believe. The best answer for most people is not to pick one, it is to know when to use each.

    For a broader look at how the launchpad category is evolving, check our Moonshot review and our PUMP token price analysis.

    FAQ

    Is Believe safer than pump.fun?
    Neither platform is inherently safer. Both are non-custodial and both let anyone launch any token. Believe reduces some rug-adjacent options by simplifying the launch flow. pump.fun exposes more of the underlying token setup, which is fine for informed traders and dangerous for beginners.

    Do I need a wallet to use Believe?
    Not to launch a token. You can create a token by replying to @launchcoin on X. To trade a token, you do need a Solana wallet with SOL.

    What happens when a token graduates?
    On pump.fun, graduated tokens migrate to PumpSwap, the in-house DEX. On Believe, graduated tokens migrate to Meteora, which offers dynamic AMM pools with deeper liquidity for larger trades.

    Which platform pays creators more?
    Believe pays creators more directly. It splits trading fees 50/50 with the token creator, distributed daily. pump.fun’s Dynamic Fee Model shares fees with creators but the exact percentage varies based on token narrative and volume.

    Can I use Believe outside of X?
    The primary launch flow is via X replies. Trading and viewing tokens happens on the Believe web app. If you want to launch without X, you cannot use Believe today.

    This article is for informational purposes only and is not financial advice. Memecoin trading is high-risk and most tokens on both platforms will go to zero. Do your own research before buying or launching any token.
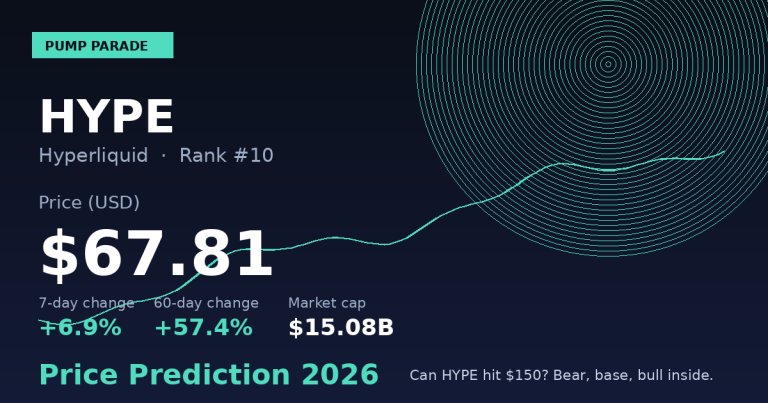
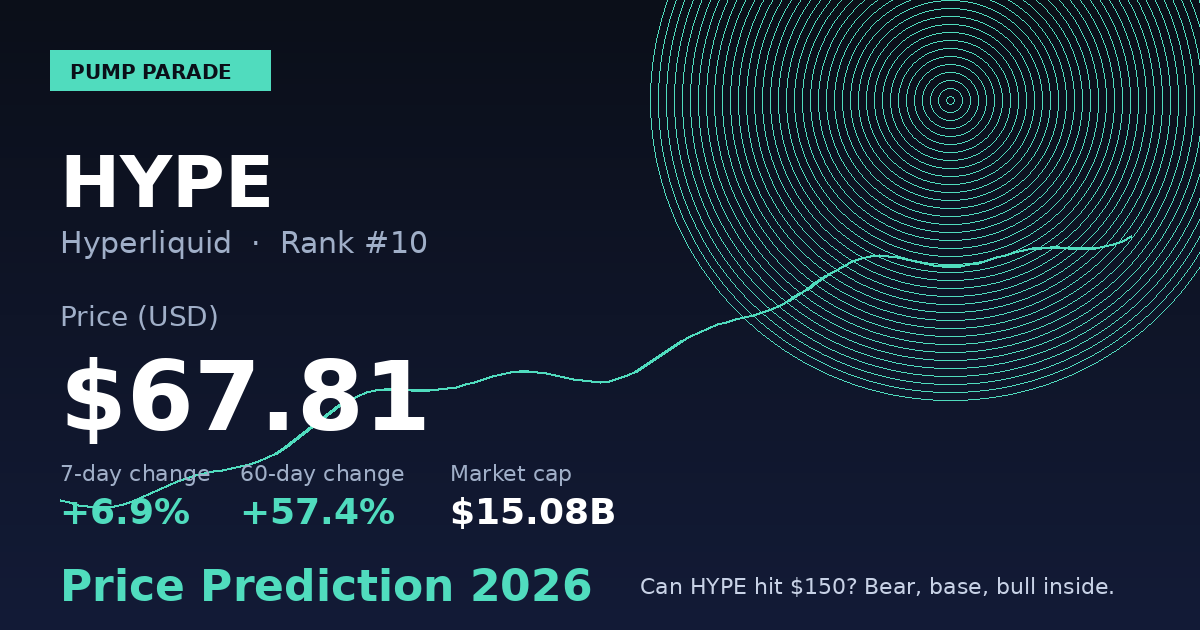
    Hyperliquid (HYPE) Price Prediction 2026: Can HYPE Hit $150?

    Hyperliquid trades at $67.81, up nearly 7% over the last week and 57% over the last two months. The perpetual futures exchange now sits at a $15 billion market cap, ranked tenth in crypto. Yet Arthur Hayes is publicly targeting $150 by August, a level that would double the token in six weeks. That is the tension every Hyperliquid HYPE price prediction 2026 model has to resolve.

    The setup is unusual. A $645 million core-contributor unlock landed on July 6, and the price barely moved. The reason is mechanical: Hyperliquid’s Assistance Fund already holds about 45.65 million HYPE, roughly 4.6 times the size of that unlock, and the protocol routes 97 to 99 percent of trading fees into open-market HYPE buybacks. So while other Layer 1s bleed against their unlock cliffs, HYPE has a structural bid absorbing supply.

    This article breaks down where HYPE trades now, what could push it to $100 and $150, what could send it back to $40, how it stacks up against Jupiter and dYdX, and what specific triggers would flip our view. All numbers are current as of writing, all catalysts are named, and no target is repeated without a condition attached.

    Key Takeaways

    • HYPE trades at $67.81 with a $15.08B market cap, 11.6% below its June 16 all-time high of $76.70.
    • The buyback engine repurchases roughly 7% of market cap per year, funded by 97 to 99% of trading fees.
    • Three US spot HYPE ETFs are now trading with $172M+ in combined net inflows, per SoSoValue data.
    • Bull case: $150 if the buyback stays intact and HyperEVM traction accelerates. Bear case: $38 if unlocks meet volume decay and ETF outflows.
    • Base case for year-end 2026: $85 to $105, contingent on holding the $60 support and clearing $76.70 on volume.
    • The real risk isn’t the July 6 unlock: it’s the string of monthly 9.92M HYPE unlocks that run through 2027-2028.
    Hyperliquid HYPE price prediction 2026 hero graphic showing current price $67.81 with buyback catalyst hook

    Where does Hyperliquid trade today?

    Before we get to price targets, the numbers. Hyperliquid is not a speculative small-cap. It is a top-ten asset by market cap with real revenue, real users, and a fully diluted valuation that already reflects significant expectations.

    Metric Value
    Price $67.81
    24h change -0.3%
    7-day change +6.9%
    30-day change +8.0%
    60-day change +57.4%
    Market cap $15.08B
    Fully diluted valuation $64.77B
    24h volume $389.7M
    Market cap rank #10
    All-time high $76.70 (June 16, 2026)
    % from ATH -11.6%
    Circulating supply 222.4M HYPE
    Max supply 1,000,000,000 HYPE

    Two numbers matter more than the rest. The $64.77B FDV means the market is already pricing HYPE as if most of that billion-token supply exists, even though only 22% has unlocked. That is the bear whisper under every green candle. The $15.08B market cap on $389M of daily volume is a healthy volume-to-cap ratio for a top-ten asset, and much of that volume is on its own platform, generating fees that flow back into buybacks.

    Why is HYPE consolidating just below its all-time high?

    HYPE topped $76.70 on June 16, then pulled back into the mid-$60s and has traded in a $63 to $71 band for three weeks. Two things caused the pullback and two things have kept the floor firm.

    The pullback drivers were the July 6 unlock overhang and profit-taking after a 57% two-month rip. Traders who bought under $50 in April took gains ahead of the vesting event. Nothing unusual there.

    What has kept HYPE from breaking lower is more interesting. First, the Assistance Fund keeps buying every hour of every day, roughly $2 million of mechanical HYPE demand at recent fee levels. Second, spot ETF flows have stayed positive, with SoSoValue showing $172M in net inflows across the three US products. Third, the July 6 unlock actually cleared without a supply flush, because the Assistance Fund reserve is 4.6x the unlock size and the market knew it. That is a rare setup for a token vesting event.

    The Bull Case: Three Real Catalysts

    1. The buyback engine is a structural bid

    This is the number that keeps coming up in every serious HYPE thesis. Hyperliquid routes 97 to 99% of trading fees into open-market HYPE purchases. Buybacks totaled roughly $317M in Q3 2025, $255M in Q4 2025, and about $192M in Q1 2026. The Motley Fool noted the team is buying back around 7% of market cap per year, roughly four to five times what Ethereum or BNB return to holders. Over 41 million HYPE tokens have already been burned or removed from circulation, worth over $1 billion at current prices.

    If quarterly buybacks resume the Q3-Q4 pace as perpetual volume recovers, mechanical demand alone could offset most of the remaining 2026 unlock supply. That is the mathematical spine of any $100-plus target.

    2. HyperEVM and product expansion

    Hyperliquid is no longer a single perpetuals venue. HyperEVM opened the door to independent apps building on Hyperliquid infrastructure, and a new social trading app now routes perpetual futures through Hyperliquid, expanding reach into retail flows. Over 200 perpetual markets are live, from majors to long-tail. Prediction markets and options are the next expected rails. Each new fee source compounds the buyback.

    3. Spot ETF flows plus institutional pipes

    Three US spot HYPE ETFs are live and pulling positive inflows, according to SoSoValue. Recent data shows $116M in 24-hour net bridged inflows into the protocol. That is fresh institutional capital, and it plugs into a token where 99% of fees route to buybacks. This is the flywheel Arthur Hayes is betting on when he sets his $150 target. If ETFs keep steady inflows through Q3, the bid gets thicker just as unlocks are absorbed by the Assistance Fund.

    The Bear Case: What Could Break HYPE

    1. Unlocks are monthly and run for years

    The July 6 unlock was 9.92 million HYPE, worth roughly $645M. There is another 9.92 million on August 6. Then September. Then every month, through 2027 and into 2028. Tokenomist data shows only around 22% of the 1 billion max supply has unlocked as of mid-2026. If perpetual volume falls and buybacks shrink to $100M per quarter, the Assistance Fund reserve depletes faster than new HYPE enters. That is a compounding bear scenario few HYPE bulls model honestly.

    2. Regulatory pressure from CME, ICE, and Singapore

    CME and ICE, two of the largest US derivatives venues, urged US regulators to review Hyperliquid over manipulation and sanctions risks. Singapore added HYPE to its Investor List, a soft restriction. This is what regulatory friction looks like at the top: incumbents complain when a decentralized upstart eats their lunch. But the risk to price is real. A meaningful US enforcement action could delist ETFs, freeze new institutional inflows, and force perpetual volume back onto centralized venues.

    3. Competition from Jupiter, dYdX, and future forks

    Hyperliquid does not have a moat by patent, only by execution. Solana-native perp DEXs like Jupiter continue to grow. dYdX is rebuilding on its own chain. Aster and Ostium are competing on specific product niches. If HYPE’s flywheel slows and fees redistribute, the buyback shrinks proportionally. This is the real threat: not a single competitor killing HYPE, but a slow fee dilution that starves the engine.

    Hyperliquid HYPE Price Prediction 2026: Targets by Timeframe

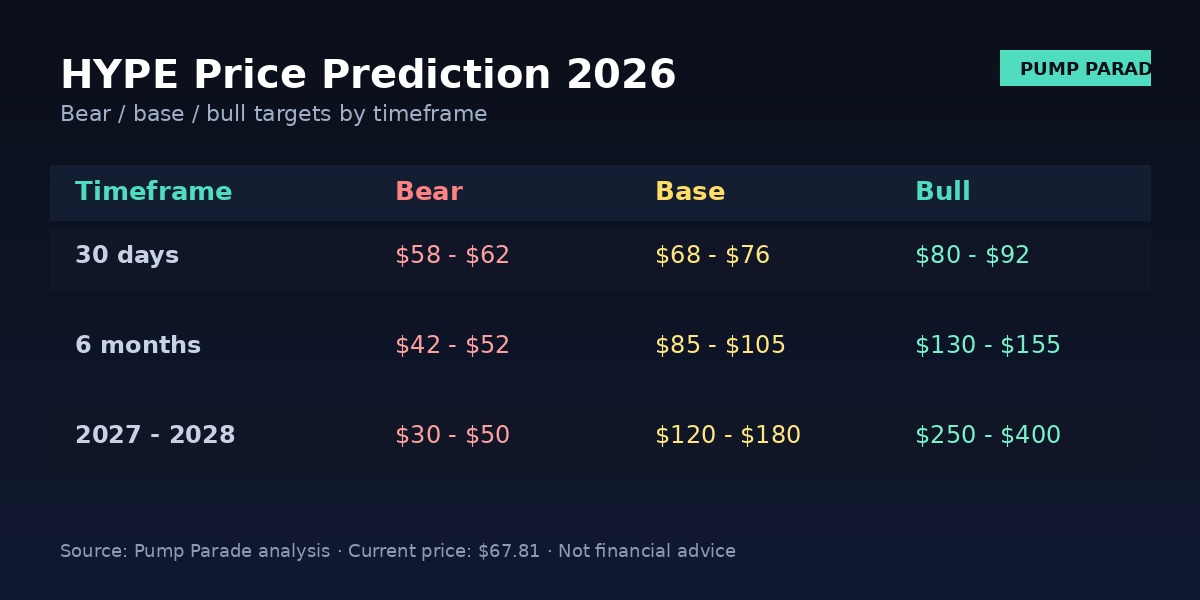
    Hyperliquid HYPE price prediction 2026 targets table bear $45 base $95 bull $150

    Every target below has a condition. If the condition does not hold, the number does not hold. That is how forecasts should work.

    30-day outlook (through early August 2026)

    • Bear: $58 to $62. If macro softens or the August 6 unlock triggers pre-emptive selling.
    • Base: $68 to $76. Range trade continues, ETF flows stay positive, no macro shock.
    • Bull: $80 to $92. Break above $76.70 ATH on volume, with the ETF flow narrative accelerating.

    6-month outlook (through January 2027)

    • Bear: $42 to $52. Requires two-quarter volume decline plus a US regulatory action.
    • Base: $85 to $105. Buyback maintains pace, HyperEVM ships incremental products, ETF assets grow to $500M+.
    • Bull: $130 to $155. Arthur Hayes’ target range. Requires ETFs above $1B, options and prediction markets going live at scale, and macro tailwind.

    Long-term (2027-2028)

    • Bear: $30 to $50. Fee compression from competition plus multiple years of unlocks unabsorbed by buybacks.
    • Base: $120 to $180. Hyperliquid becomes the dominant on-chain derivatives venue with a maturing product suite.
    • Bull: $250 to $400. Category-defining outcome. Requires institutional derivatives migrating on-chain and HYPE capturing the fee stream.

    For comparison, CoinCodex’s algorithmic model currently projects HYPE between $70 and $110 through year-end 2026. That is inside our base case. Bitwise, one of the ETF issuers, has publicly discussed HYPE at $100+ as a reasonable 2026 outcome.

    How does Hyperliquid compare to Jupiter and dYdX?

    Every perp DEX token pitches a buyback story. The details are where they diverge. If you want the full Solana perp DEX picture, our Jupiter JUP 2026 outlook covers the closest competitor in more depth.

    Metric Hyperliquid (HYPE) Jupiter (JUP) dYdX (DYDX)
    Market cap rank #10 Mid-tier Mid-tier
    Fee share to token 97-99% ~50% to JUP Partial staking rewards
    Chain Hyperliquid L1 + HyperEVM Solana dYdX Chain (Cosmos)
    Product breadth Perps, spot, EVM apps Aggregation, perps, DCA Perps only
    Institutional access 3 US spot ETFs live No ETF No ETF
    Buyback funding Trading fees direct Protocol revenue Insurance fund
    Primary risk Multi-year unlock schedule Solana-cycle correlation Volume migration to competitors

    The differentiator is fee share. When 97 to 99% of every dollar of Hyperliquid trading fees goes into HYPE buybacks, the token behaves like an equity in a cash-flowing business. Compare that to Ethena’s yield economics in our ENA 2026 breakdown, or the buyback dynamics we covered in the AERO 2026 analysis. Different mechanisms, same underlying question: does the token capture value, or does the protocol?

    What could change the HYPE thesis?

    Three specific triggers would move us off the current base case.

    Trigger 1: Quarterly buyback drops below $100M. That would signal fee compression from competition or a volume cycle low. If Q3 2026 buybacks come in under $100M, we would cut the base case by 20 to 25 percent.

    Trigger 2: Aggregate ETF assets exceed $1B by Q4 2026. That is roughly a 6x from current levels. If it happens, the bull case moves from tail scenario to base scenario and $130-plus becomes the target.

    Trigger 3: A specific US enforcement action against Hyperliquid or its ETFs. This is the most binary outcome. A settlement or restraining order would likely cut HYPE by 30 to 50 percent in the near term and push the six-month target into the $40 to $55 range.

    Frequently Asked Questions

    Is Hyperliquid a good investment in 2026?

    Hyperliquid has legitimate fundamentals rare in crypto: real revenue, a mechanical buyback tied to fees, and a top-ten market cap. It is a defensible thesis for investors who understand perpetual futures and can tolerate a multi-year unlock schedule. It is not appropriate for investors seeking low volatility or already at maximum crypto exposure.

    Will HYPE reach $100 in 2026?

    HYPE hitting $100 requires a roughly 47% move from $67.81 and depends on three things: buybacks staying above $150M per quarter, ETF flows staying net positive, and Hyperliquid holding perpetual volume market share. Prediction markets in mid-2026 leaned toward HYPE clearing $80, with fewer than half betting on $100. Reasonable but not guaranteed.

    Will HYPE reach $150 by August 2026?

    Arthur Hayes set a public $150 target for August 2026. That implies a 121% move in six weeks, which would require ETF inflows accelerating, a decisive break of the $76.70 ATH, and macro tailwinds all firing together. Possible in a strong crypto rally, but historically rare. Treat it as an upside scenario, not a base case.

    What is the biggest risk to HYPE holders?

    The multi-year unlock schedule is the underrated risk. Monthly 9.92M HYPE unlocks continue through 2027 and 2028. If Hyperliquid loses perpetual volume share to Jupiter, dYdX, or a new competitor, buybacks shrink while unlocks stay constant. That is the compounding bear case.

    How does HYPE make money for holders?

    HYPE holders benefit primarily through buybacks. Hyperliquid routes 97 to 99% of trading fees into open-market HYPE purchases via the Assistance Fund. Those tokens are effectively removed from circulation, tightening supply. There is no direct dividend, but the buyback pace has been running near 7% of market cap per year, higher than most Layer 1s return to holders.

    Can HYPE hit a new all-time high in 2026?

    The June 16, 2026 all-time high was $76.70. Given HYPE is currently 11.6% below that level and consolidating, a new ATH is plausible if ETF flows continue and buyback pace holds. The technical path requires clearing $73 on volume, then absorbing sellers at $76.70. Analysts note that a break above $76 to $77 with volume opens the path to $90 and $100.

    The Honest Take

    Hyperliquid is one of the cleaner fundamental stories in crypto right now. The buyback mechanic is not marketing, it is a routing rule enforced by the protocol. The ETFs are not vaporware, they are trading products with real inflows. The unlocks are the tension, not a killshot, because the Assistance Fund sits 4.6x above the July unlock size.

    That said, the FDV is $64B, which means the market has already priced significant success. A $150 print by August requires everything going right at once, and that includes macro. A $40 print by Q1 2027 requires a volume collapse plus regulatory shoe drop, and neither is our base case. Somewhere in between, closer to $85 to $105 by year-end, is where the risk-adjusted math points.

    If you own HYPE, watch quarterly buyback totals, watch ETF net inflows weekly, and watch whether HyperEVM ships products that pull external fees onto the platform. If you are looking to enter, the range of $60 to $65 has been a repeated bid zone this quarter. A decisive close under $58 would break that structure.

    The bull case is real. The bear case is real. The pop-culture “$150 or bust” framing is not how serious money thinks about a top-ten asset. Neither is “unlock apocalypse.” Both extremes miss the actual mechanic driving HYPE’s price: fees in, buybacks out, and a supply schedule the market can see coming.

    Disclaimer: This article is for informational and educational purposes only and should not be construed as financial, investment, or trading advice. Cryptocurrency markets are highly volatile, and past performance does not guarantee future results. The price predictions and analyses presented here are based on AI models, technical indicators, and available data at the time of writing, they are not guarantees. Always conduct your own research (DYOR) and consult with a qualified financial advisor before making any investment decisions. Pump Parade and its authors do not assume liability for financial losses incurred based on information provided in this article.

    Ethena (ENA) Price Prediction 2026: Can ENA Hit $0.25?

    0

    Ethena (ENA) is trading at $0.0728 as of July 8, 2026, sitting less than 4% above its all-time low of $0.0702 printed on June 30. The token is down 16.8% over the past 30 days, 43.5% over 60 days, and a brutal 71.2% year-over-year. The Ethena price prediction 2026 question is no longer whether ENA can push higher, it is whether the fee switch vote, Converge Network activation, and institutional iUSDe rollout can arrive fast enough to offset a heavy 2026 unlock schedule.

    There is a real story underneath the chart. USDe is still the largest synthetic dollar in DeFi. Coinbase Ventures and Janus Henderson have entered the cap table on the open market in the last six weeks. A governance vote to activate the fee switch, first proposed in November 2024, has finally cleared its risk committee gate.

    Here is what the data says about where ENA goes from here.

    Key Takeaways

    • ENA prints all-time lows on July 2 unlock. The 40.63M token release from the Foundation tranche and a 171.88M cliff scheduled for later this month remain the largest single overhang on price.
    • Fee switch is the swing catalyst. The risk committee confirmed all success metrics have been met. A governance vote could redirect protocol revenue toward ENA buybacks and sENA staker rewards as soon as Q3 2026.
    • Converge Network is Ethena’s long-tail bet. Built with Securitize, ENA becomes the validator staking asset for an institutional-grade RWA and stablecoin L1.
    • Regulatory risk is now on the tape. Germany’s BaFin has barred USDe from EU users under MiCA. Any US follow-through would cap the bull case fast.
    • Base-case target for 2026: $0.11. Bull case runs to $0.18 on fee switch activation plus a broader risk-on tape. Bear case: $0.048 if unlocks meet weak demand.

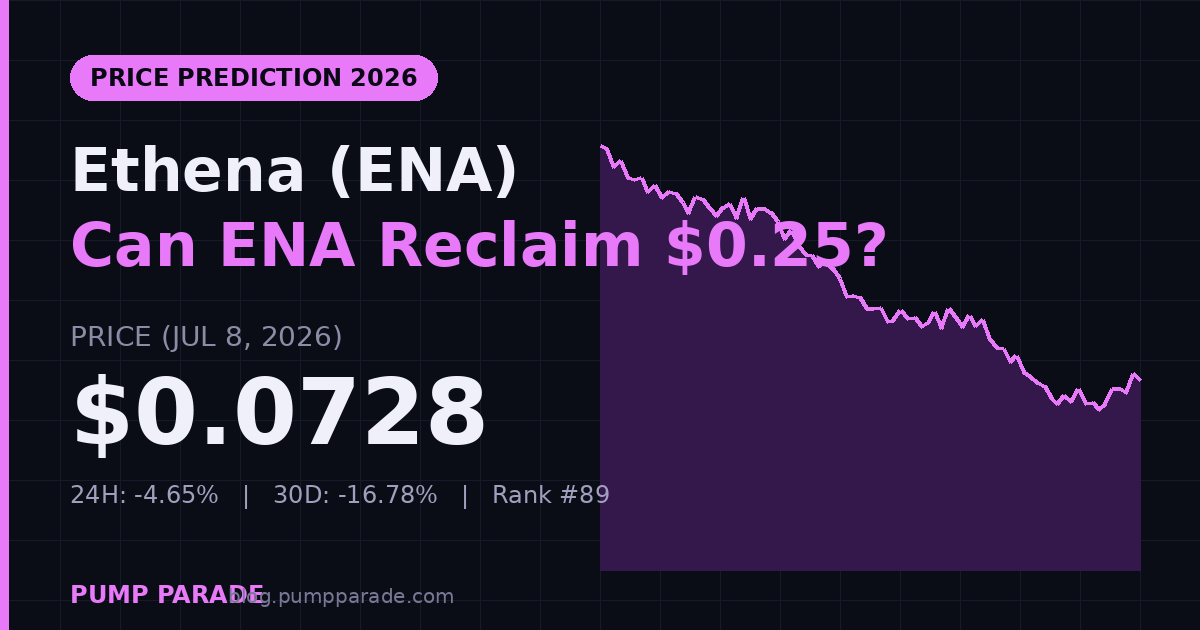
    Ethena (ENA) price prediction 2026 hero graphic showing current price $0.0728, fee switch and Converge catalyst

    Where Ethena (ENA) Stands Today

    Before we get to targets, here is the market picture in one snapshot. Data is pulled from CoinGecko and cross-referenced with on-chain figures at time of writing.

    Metric Value
    Current Price $0.0728
    24h Change -4.65%
    7-Day Change +1.76%
    30-Day Change -16.78%
    Market Cap $696M
    24h Volume $103M
    Market Cap Rank #89
    All-Time High $1.52 (April 2024)
    % From ATH -95.2%
    Circulating / Total Supply 9.56B / 15B (63.7%)

    Two numbers matter most here. The 95.2% drawdown from ATH tells you sentiment is broken. The 63.7% circulating supply ratio tells you why: more than 5 billion tokens are still scheduled to unlock, and every cliff release lands on a bid that has been shrinking for months.

    Why Is ENA Trading Near All-Time Lows?

    The narrative around Ethena has not fallen apart. The numbers behind it have compressed.

    Gross protocol revenue dropped 32% quarter over quarter in Q1 2026 to $65.06 million. Total value locked has fallen roughly $130 million since early March. Daily active users are down to about 1,200, the lowest reading since December. The revenue engine of Ethena is delta-neutral funding rates on ETH and BTC perps, and a chopping crypto tape with tight basis spreads is exactly the environment where that engine underperforms.

    On top of soft fundamentals, the token schedule is doing real damage. A 40.63 million ENA release from the Foundation allocation hit on July 2. A 171.88 million cliff for Core Contributors is set for later this month. Cliff vesting, where tokens release all at once rather than linearly, concentrates sell pressure into narrow windows. When those windows arrive during a distribution phase in the broader market, price tends to overshoot lower.

    Then there is the regulatory hit. In April, Germany’s BaFin barred USDe from being offered to EU users under MiCA, ruling that its delta-hedged, yield-bearing structure cannot meet the 1:1 reserve requirement. That decision does not close US markets, but it puts a marker down on the compliance conversation that iUSDe is trying to answer.

    The Bull Case for Ethena

    Three catalysts underpin the constructive view for ENA into late 2026.

    The Fee Switch Vote

    The Ethena Risk Committee has confirmed that all success metrics defined in the November 2024 fee switch proposal have been met. A governance vote is expected in Q3 2026 to activate a mechanism that would redirect a share of protocol revenue toward open-market ENA buybacks and rewards for sENA stakers. In plain terms, this converts ENA from a pure governance token into a cash-flow-linked asset. Standard Chartered has floated $15 billion USDe supply as the level at which a fee switch would materially re-rate ENA. Watch that number.

    Converge Network Activation

    Ethena is co-building the Converge Network with Securitize, an institutional-grade Layer 1 designed for regulated stablecoin and RWA settlement. On Converge, ENA is the staking asset for the Converge Validator Network, giving the token a second, structural source of demand independent of the fee switch. The chain is targeted for full activation in 2026, and every incremental institutional issuer that migrates settlement to Converge tightens the loop between ENA supply and validator security.

    Institutional Adoption via iUSDe

    iUSDe is the compliance-wrapped version of USDe designed for banks, asset managers, and RWA platforms. It ships with transfer restrictions, custody integrations, and reporting standards those institutions require. Coinbase Ventures disclosed a spot ENA purchase and a USDC-related partnership on June 2. Janus Henderson’s ANTIK venture followed on June 9 with a position and plans for regulated investment products including ETPs. If iUSDe supply follows the same trajectory USDe did in 2024, ENA has a demand story the market has not yet priced.

    The Bear Case for Ethena

    The other side of this trade is well populated.

    Massive Supply Dilution Through 2027

    Only 63.7% of ENA’s 15 billion total supply is in circulation. The rest unlocks in tranches through April 2027, with several cliff releases larger than 100 million tokens still ahead. At current prices, a single 171.88M cliff represents roughly 1.8% of circulating supply hitting the market in one shot. Buybacks funded by the fee switch would need to run at a multi-million-dollar weekly pace just to absorb the schedule, and current protocol revenue does not clear that hurdle without a demand recovery.

    Regulatory Headwinds

    BaFin’s MiCA ruling is a live risk template. If a US regulator, most plausibly the SEC or CFTC, labels USDe as an unregistered security or a synthetic swap, the funding-rate engine that powers protocol revenue takes an immediate hit. iUSDe is designed to be the answer, but its adoption curve is measured in quarters, not weeks. In the interim, headline risk sits on top of the price.

    Declining Protocol Revenue

    Revenue down 32% QoQ. USDe supply off its $14.5B peak. sUSDe yield now competing with Sky’s savings rate, Aave’s stablecoin markets, and Ondo’s tokenized Treasury rails at similar or better risk-adjusted returns. Funding rates on perpetuals compress in ranging markets, and until crypto majors trend, Ethena’s flagship product runs on thinner margins.

    Ethena Price Prediction 2026: Can ENA Reclaim $0.25?

    Here is how our hybrid model, on-chain flow data, and outside analyst targets stack up across three timeframes.

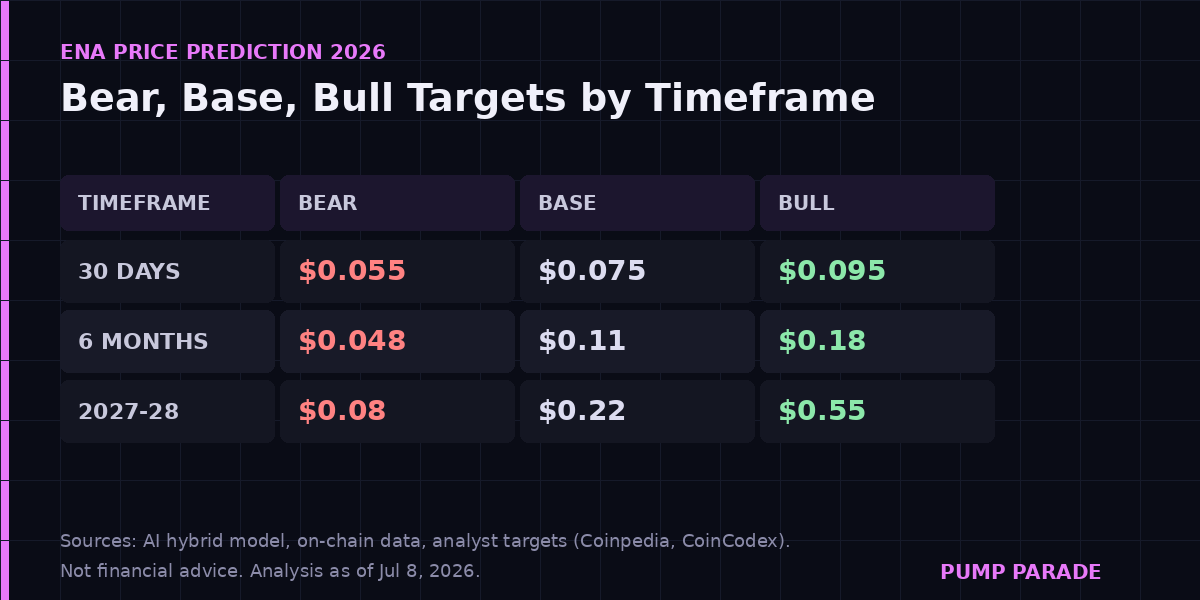
    Ethena (ENA) price prediction 2026 targets table showing bear $0.048, base $0.11, bull $0.18 at 6 months

    Short-Term (30 Days)

    Bear: $0.055. Base: $0.075. Bull: $0.095. The July unlock cliff dominates near-term price action. A bear tag of $0.055 lines up with the 1.618 Fibonacci extension of the June breakdown. Base case assumes range consolidation between $0.070 and $0.085 as unlocked supply gets distributed. Bull case requires the fee switch vote to be formally scheduled, which would give traders a defined date to front-run.

    Mid-Term (6 Months)

    Bear: $0.048. Base: $0.11. Bull: $0.18. This is the window that matters for the Ethena price prediction 2026 thesis. Fee switch activation is the swing factor. If it passes and USDe supply reclaims $8B, our model assigns a 42% probability to a base-case retest of the $0.11 to $0.13 zone. Bull case requires fee switch plus iUSDe adoption from at least two institutional partners. For context, CoinCodex projects a maximum of $0.325 for 2026, while Coinbase’s model output sits at $0.11 on a 5% growth assumption.

    Long-Term (2027-2028)

    Bear: $0.08. Base: $0.22. Bull: $0.55. By late 2027, all ENA tokens will have unlocked and the supply overhang lifts. The base case assumes Converge Network is generating meaningful validator revenue and USDe supply has stabilized around $10B. Bull case aligns with Coinpedia’s optimistic $1.50 scenario being partly realized, though our model views that as low probability without a full crypto bull cycle.

    How Does Ethena Compare to Sky (Formerly MakerDAO)?

    The closest competitor to Ethena in the yield-bearing dollar category is Sky, the rebranded MakerDAO ecosystem that issues USDS. Sky’s USDS overtook USDe in stablecoin market cap earlier this year. Here is the head-to-head.

    Metric Ethena (USDe) Sky (USDS)
    Stablecoin Supply ~$5.9B ~$10.8B
    Collateral Model Delta-neutral (spot + short perps) Overcollateralized (ETH, RWA vaults)
    Yield Source Funding rates + ETH staking Sky Savings Rate (RWA-backed)
    Governance Token Market Cap $696M (ENA) ~$1.8B (SKY)
    Fee Switch / Revenue Share Pending Q3 2026 vote Active (Sky Savings)
    Regulatory Standing (EU) USDe barred by BaFin Under review, no formal action
    Crash History Survived 2024-2025 cycle only Multiple cycles since 2019

    The uncomfortable truth: Sky is bigger, older, and structurally simpler. Ethena’s advantage is yield ceiling and product velocity. USDe pays double-digit APY in favorable funding environments; USDS’s savings rate is set by governance and typically runs lower. For DeFi power users and yield hunters, ENA still has the higher-upside setup. For risk-averse allocators, Sky’s collateral model is easier to defend. If you want a deeper look at the DeFi lending side of this comparison, our Aave (AAVE) 2026 price prediction covers the third leg of this stool.

    What Would Change Our View on ENA?

    Three scenario triggers, in order of importance.

    1. Fee switch vote passes and gets an activation date. A confirmed on-chain implementation timeline would flip our base case from $0.11 toward $0.14 to $0.16. If the vote fails or is delayed into 2027, base moves down to $0.085.

    2. USDe supply reclaims $10B. Standard Chartered has called $10B the threshold at which fee switch economics start to matter for ENA. A move back above $10B, particularly on iUSDe demand rather than degen recycling, would justify a bull case retest of $0.18.

    3. US regulator action on synthetic dollars. Any SEC or CFTC statement that treats USDe like an unregistered security opens the trap door. Under that scenario, the bear target of $0.048 becomes a base case, and $0.03 comes into play.

    Frequently Asked Questions

    Will Ethena (ENA) reach $1 in 2026?

    Reaching $1 in 2026 would require ENA to rally more than 13x from current levels. That is possible only under a full crypto bull cycle, successful fee switch activation, and USDe supply doubling from here. Our model assigns roughly a 5% probability to that outcome. Most analyst consensus, including CoinCodex and Coinbase, points to a 2026 range of $0.10 to $0.35.

    Is Ethena (ENA) a good investment in 2026?

    ENA is a high-risk, high-asymmetry setup. It has strong fundamentals in USDe supply and a real catalyst path through the fee switch and Converge. It also has 5 billion tokens still to unlock and a live regulatory question. It fits a small, conviction-based position in a diversified portfolio for risk-tolerant investors, not a size allocation.

    What is the Ethena fee switch and when will it activate?

    The fee switch is a governance mechanism that redirects a share of protocol revenue to ENA buybacks and sENA staker rewards. The risk committee confirmed all success metrics in September 2025. A binding governance vote is expected in Q3 2026, with activation possible within 30 days of a successful vote.

    What is the difference between USDe and Sky’s USDS?

    USDe holds its peg through a delta-neutral strategy: long spot ETH or BTC and short an equivalent perpetual futures position. USDS is overcollateralized with ETH, USDC, and real-world-asset vault tokens. USDe generates higher yields but carries perpetual funding risk. USDS is more conservative and has survived multiple crypto crashes since 2019.

    Why did BaFin ban Ethena USDe in Europe?

    Germany’s BaFin ruled that USDe cannot be offered to EU users under the MiCA framework because its delta-hedged, yield-bearing structure does not meet the 1:1 reserve requirement for stablecoins. The ban applies to European users only. iUSDe, Ethena’s compliance-wrapped institutional version, is designed to answer questions like this one.

    The Honest Take

    Ethena in July 2026 is a story of fundamentals fighting supply. The product works. USDe still leads the synthetic dollar category. Coinbase and Janus Henderson are voting with capital, not tweets. The fee switch is one governance vote away from turning ENA into a revenue-linked asset. That is the bull case, and it is real.

    The bear case is also real. Cliff unlocks land into thin volume. Protocol revenue has softened. BaFin has shown that regulators can move faster than product teams. Down 95% from ATH is not a floor by itself; it is a data point.

    Our base case for the Ethena price prediction 2026 is $0.11 by year end, with an asymmetric bull case toward $0.18 if the fee switch activates on time. A pass or delay on the vote, and $0.048 to $0.06 becomes the range. This is not a “back up the truck” setup. It is a “small conviction position with a defined thesis and clear invalidation levels” setup. For a broader look at DeFi bluechips through 2026, our Lido DAO (LDO) 2026 outlook and the Ondo (ONDO) $1 breakout thesis pair well with this one.

    Cross-reference the numbers with live CoinGecko data and the official Ethena protocol documentation before sizing anything.

    Disclaimer: This article is for informational and educational purposes only and should not be construed as financial, investment, or trading advice. Cryptocurrency markets are highly volatile, and past performance does not guarantee future results. The price predictions and analyses presented here are based on AI models, technical indicators, and available data at the time of writing. They are not guarantees. Always conduct your own research (DYOR) and consult with a qualified financial advisor before making any investment decisions. Pump Parade and its authors do not assume liability for financial losses incurred based on information provided in this article.


    Raydium Review 2026: Fees, Features & Verdict

    0

    If you spend any time on Solana, you have swapped through Raydium whether you noticed it or not. Every time a fresh token launches on pump.fun and graduates to the open market, its first real liquidity pool lives on Raydium. Every time Jupiter routes an order through the deepest venue for a mid-cap Solana coin, Raydium is often the leg doing the work. And yet, five years after launch, most traders still cannot tell you how Raydium actually makes money, how its fees stack up against Orca or Meteora, or whether the app is the fastest way to swap in 2026. This deep dive answers all of that.

    We put Raydium under a microscope: TVL, real fee revenue, product surface, security history, wallet support, and the parts of the UI that either delight or frustrate. Read this before you route another dollar of size through a Solana AMM.

    Quick Verdict: Should You Use Raydium in 2026?

    Yes, for most Solana traders and liquidity providers. Raydium is the largest Solana-native AMM by TVL at roughly $920 million, and it is the default habitat for new token launches. If you swap Solana memes, provide liquidity to volatile pairs, or want to launch your own pool without asking for permission, Raydium is essentially unavoidable. Our verdict is 8.7 / 10. It loses points for a UI that still buries advanced settings, thin support for non-Solana chains, and the fact that Jupiter often out-routes it on final execution price. But as a base layer of Solana DeFi, it remains best in class.

    Official Raydium Solana AMM interface

    What Is Raydium?

    Raydium is an automated market maker and decentralized exchange built natively on Solana. It launched in early 2021 as one of the first serious AMMs on the chain, and it has since evolved from a Serum orderbook hybrid into a multi-pool ecosystem with four distinct product lines: the original AMM v4 constant-product pools, a newer Concentrated Liquidity Market Maker (CLMM) that mirrors the Uniswap v3 style, a Constant Product Market Maker (CPMM) for permissionless pool creation with standard SPL tokens, and LaunchLab, its native token launchpad.

    You use Raydium if you want to swap any Solana token, provide liquidity for yield, farm RAY emissions, or create a new pool for a fresh token. It is not a wallet, not a lending market, and not an aggregator. It is the venue, and the plumbing.

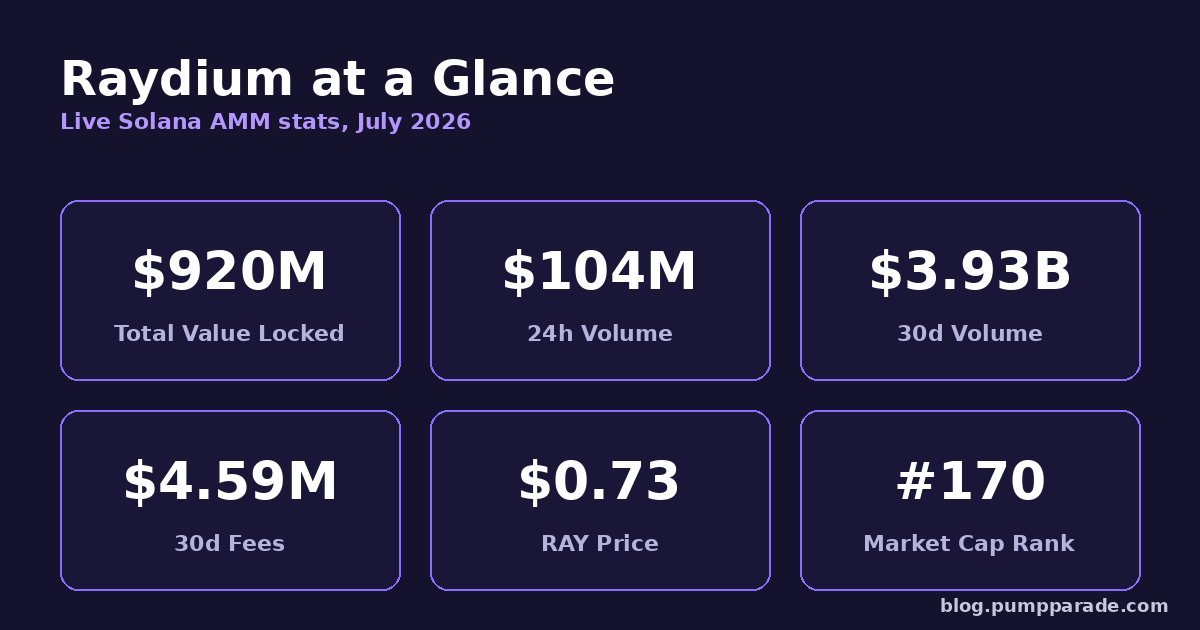
    Raydium by the Numbers

    Data points below are pulled from DeFiLlama and CoinGecko as of this week and give a fair snapshot of Raydium’s current scale.

    • Total Value Locked: ~$920 million on Solana, plus ~$28 million in RAY staking
    • 24-hour trading volume: ~$104 million
    • 7-day trading volume: ~$757 million
    • 30-day trading volume: ~$3.93 billion
    • 30-day protocol fees: ~$4.59 million
    • Annualized fee run-rate: north of $50 million
    • Lifetime fees generated: ~$1.42 billion
    • RAY token price: ~$0.73, market cap rank #170
    • Circulating supply: ~269 million of 555 million max

    Raydium key stats snapshot for 2026

    Those are not tiny numbers. Raydium routinely sits inside the top five DEXs by fees across all chains, and it is consistently the number one AMM on Solana by both TVL and volume. When Solana has a hot memecoin week, Raydium fees spike into the top-three across all of crypto, briefly beating Uniswap on daily revenue.

    Features Deep Dive

    1. AMM v4 (Legacy Pools)

    The classic Raydium experience: constant-product pools with a 0.25% swap fee, of which 0.22% goes to LPs and 0.03% is used to buy back RAY. These pools power a huge share of long-tail Solana liquidity, especially for memecoins that graduated from pump.fun. If you swap a token that launched in the last 12 months on Solana, odds are your route touches at least one AMM v4 pool.

    2. Concentrated Liquidity (CLMM)

    Raydium’s CLMM lets LPs concentrate capital inside a chosen price range, which dramatically improves capital efficiency for correlated pairs like SOL/USDC or wSOL/mSOL. Fee tiers are configurable at 0.01%, 0.05%, 0.25%, and 1%, which mirrors Uniswap v3’s tier structure but with slightly different defaults. If you are farming SOL/USDC or a stable-stable pair, CLMM is where you want to be.

    3. CPMM (Permissionless)

    The CPMM is Raydium’s answer to “let anyone create a pool for any SPL token in five clicks.” It supports Token-2022 extensions, has cheaper pool-creation costs than AMM v4, and does not require an OpenBook market ID, which was a friction point on the older program. This is the pool type most new token launches use in 2026.

    4. Farms and Staking

    Every LP position on Raydium can be staked in a farm to earn dual rewards: RAY plus whatever the pool’s launcher chooses to bootstrap with. Solo RAY staking earns a share of protocol buybacks. Yields on stablecoin farms typically sit in the 6% to 12% APR range, while volatile pairs can push north of 40% during memecoin season, though impermanent loss risk is real.

    5. LaunchLab

    LaunchLab is Raydium’s native token launchpad, competing with pump.fun and Believe. It uses a bonding curve to bootstrap price discovery, then automatically migrates graduated tokens into a Raydium CPMM pool. For creators, it removes the need to fund initial liquidity out of pocket. For traders, it gives an early-access flywheel that keeps liquidity inside the Raydium ecosystem.

    6. Portfolio and Pool Tools

    The portfolio tab shows every LP position, staked RAY, and unclaimed reward across the four product lines in one view. It is not as detailed as a dedicated portfolio tracker like Zapper or DeBank, but it is enough to manage a Raydium-only book without spreadsheeting.

    Fees and Pricing

    Raydium’s fee schedule is where people either love it or feel gouged, depending on which pool they land in.

    • AMM v4 pools: 0.25% total per swap. 0.22% to LPs, 0.03% to RAY buybacks.
    • CLMM pools: Tier-based. 0.01%, 0.05%, 0.25%, or 1%. LP receives 84%, treasury takes 12%, RAY buybacks take 4%.
    • CPMM pools: 0.25% per swap, split 84% LP, 16% protocol.
    • Pool creation: A small SOL fee, typically less than $10 at current SOL prices.
    • Solana gas: Fractions of a cent per swap.

    Compared to Ethereum-based AMMs, Raydium’s fees are broadly in line with Uniswap v3 tiers, but the total cost per swap is dramatically lower because Solana gas is negligible. The point where Raydium looks expensive is on stablecoin-to-stablecoin pairs versus something like Orca’s Whirlpools or Meteora’s DLMM, both of which sometimes offer tighter spreads. In practice, most traders route through Jupiter and let the aggregator pick the best venue, at which point Raydium’s raw fee tier matters less than its depth.

    Pros and Cons

    Pros

    • Largest AMM by TVL and volume on Solana, so slippage is generally the lowest available for long-tail tokens
    • Four distinct pool types cover almost every LP strategy, from concentrated stable pairs to memecoin gambles
    • Permissionless pool creation via CPMM is genuinely fast and cheap
    • LaunchLab keeps liquidity in-house, giving Raydium a structural moat over standalone AMMs
    • Direct integrations with virtually every Solana wallet, aggregator, and portfolio tracker
    • Consistent uptime through Solana’s 2024 and 2025 network hiccups

    Cons

    • UI still hides advanced settings behind extra clicks, and the pool discovery flow is dense for new users
    • No native cross-chain support beyond Solana, so you have to bridge in and out
    • Direct swaps often lose on execution price to Jupiter, which aggregates across all Solana venues
    • Some CLMM tiers have thin liquidity outside the top pairs, making concentrated positions risky
    • RAY tokenomics still leave over half the supply undistributed, which is an overhang for holders

    Security and Trust

    Raydium has been through multiple audits over its lifetime, including work from OtterSec and Kudelski Security on the newer CLMM and CPMM programs. In late 2022, Raydium suffered a serious exploit on its AMM v4 admin authority when a compromised owner key allowed an attacker to drain roughly $4.4 million across several pools. The team promptly compensated affected LPs, migrated admin authority to a multisig, and moved to timelocked upgradeable programs. Since that incident, there has been no comparable failure. Program upgrades now flow through a governance-controlled timelock, and the CLMM and CPMM programs have not required emergency intervention.

    Raydium is not decentralized in the way a fully immutable Uniswap v2 fork is: the team still controls program upgrades. For most users, the tradeoff is acceptable, but if you are LPing eight-figure size, you should read the current authority setup on the docs page before committing.

    User Experience

    The Raydium app is fast, no surprise given it runs on Solana. Swap confirmations land in one to two seconds under normal conditions, and the UI keeps essentials on one screen: token pair selector, slippage, priority fee, and route. Where it gets busy is the pool creation flow, which has legitimately many parameters, and the farms tab, which now spans four product lines with different reward structures. New users should expect a learning curve of about an hour before they can navigate confidently.

    Mobile support is functional through the Raydium web app in Phantom’s in-app browser, though there is no native iOS or Android app. If you are doing serious LP work on mobile, expect friction.

    How Raydium Compares to Other Solana DEXs

    For a fuller head-to-head on aggregators, see our Jupiter vs 1inch review, and for a concentrated-liquidity alternative, our Meteora review is the right next read. At a high level:

    • Raydium vs Orca: Orca’s Whirlpools are often cheaper for stable pairs, but Raydium wins on long-tail depth
    • Raydium vs Meteora: Meteora’s DLMM is superior for advanced LPs, but Raydium hosts more launches
    • Raydium vs Jupiter: Not the same product. Jupiter is an aggregator that routes into Raydium, so use Jupiter for best execution and Raydium for pool depth and LPing

    Raydium official logo

    Verdict and Rating

    Raydium is the default Solana AMM in 2026 for a reason. It has the deepest liquidity, the widest product surface, and the structural advantage of hosting most new token launches through LaunchLab and its CPMM. For the average trader, the honest recommendation is this: swap through Jupiter, but LP through Raydium. That combination gives you best execution on the buy side and top-tier depth on the yield side. Casual users should stick to farms with audited pool contracts and avoid CLMM ranges they cannot actively manage.

    Final rating: 8.7 / 10. Best for Solana LPs, new-token traders, and anyone routing meaningful memecoin flow. Ready to try it? Visit Raydium and check the current pools yourself. For where the RAY token itself might trade next year, see our Raydium price prediction for 2026.

    Frequently Asked Questions

    Is Raydium safe to use in 2026?

    Raydium’s CLMM and CPMM programs have been audited by OtterSec and Kudelski, and the protocol operates on a timelocked upgrade path controlled by a multisig. The one serious historical incident was a 2022 admin-key compromise on AMM v4 that has since been remediated. It is as safe as any major Solana AMM, but not immutable code, so use appropriate size discipline.

    How does Raydium make money?

    Raydium collects a small cut of every swap fee across its four pool types. Some of that revenue flows to the protocol treasury, some funds RAY buybacks, and the rest goes to liquidity providers. Annualized fee revenue is currently running above $50 million, most of it generated on Solana memecoin flow.

    What is the difference between Raydium AMM, CLMM, and CPMM?

    AMM v4 is the classic constant-product pool with a fixed 0.25% fee. CLMM offers concentrated liquidity with configurable fee tiers, ideal for stable and correlated pairs. CPMM is a newer permissionless pool type that supports Token-2022 extensions and is the default for most new token launches.

    Can I use Raydium on Ethereum or Base?

    No. Raydium is Solana-native and does not currently deploy on other chains. You need to bridge assets to Solana first using a bridge like Wormhole or deBridge.

    Should I stake RAY?

    RAY staking earns a share of protocol buybacks, which scales with Raydium’s fee revenue. It is a directional bet on Solana DEX activity remaining high. If you already hold RAY and want passive exposure to protocol growth, staking is reasonable. If you are looking for the highest yield on Raydium, LP farms typically pay more, especially on volatile pairs during active memecoin cycles.

    Aave (AAVE) Price Prediction 2026: Can AAVE Hit $175?

    Every Aave price prediction 2026 model has been rewritten in the last six weeks, and for good reason. AAVE trades near $94.29 as of July 7, 2026, up 47.83% over 30 days and 5.9% on the week. In a market where ETH is still trying to reclaim $1,800 and most large caps are bleeding, that kind of relative strength is worth stopping for.

    The move is not random. Aave V4 went live on Ethereum mainnet on March 30, 2026, deposits into the new hub-and-spoke architecture crossed $200 million in three months, and Grayscale just tagged AAVE as “undervalued” with a one-year target of $175. Horizon is quietly onboarding institutional RWA borrowers, and GHO has expanded to roughly $583 million.

    This is a full Aave price prediction 2026 breakdown: where the token stands today, what is driving the rally, the bull and bear cases, timeframe targets, and the triggers that would change the thesis. Data and argument, no hopium.

    Key Takeaways

    • Current price: AAVE trades at $94.29, up 47.83% in 30 days and down 85.8% from its 2021 all-time high of $661.69.
    • V4 catalyst is real: Aave V4 has crossed $200M in deposits three months post-launch. TVL across all versions sits near $14.5B after peaking above $30B late in 2025.
    • Grayscale target: Fair value modelled at $80 to $100, with a $175 bull case tied to clearer RWA regulation. That is a 133% upside from mid-2026 levels if the bull path plays out.
    • GHO and Horizon are the flywheel: $583M GHO supply plus $501M average TVL on Horizon push protocol revenue toward Grayscale’s $60M full-year estimate.
    • Base case for end-2026: $110 to $145 range if V4 migration continues and macro cooperates. Bear case is a retest of $65. Bull case is a full re-rating into the $175 to $200 zone.
    • Biggest risk: DeFi lending is commoditising. Morpho, Spark, and Compound are all fighting for the same deposit share. Aave has the brand and the balance sheet, but that gap is narrower than it looks.
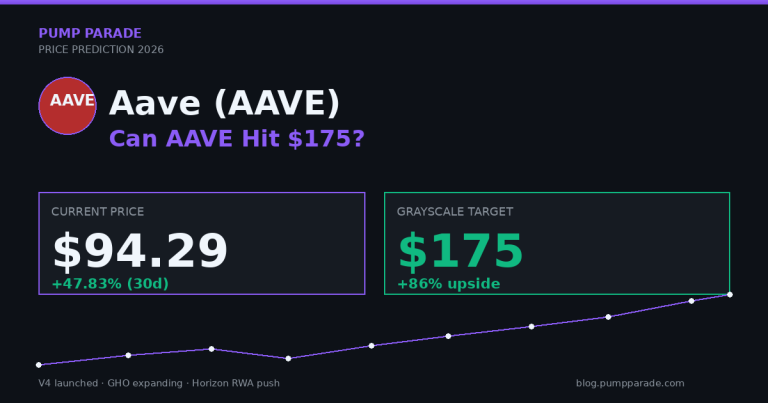
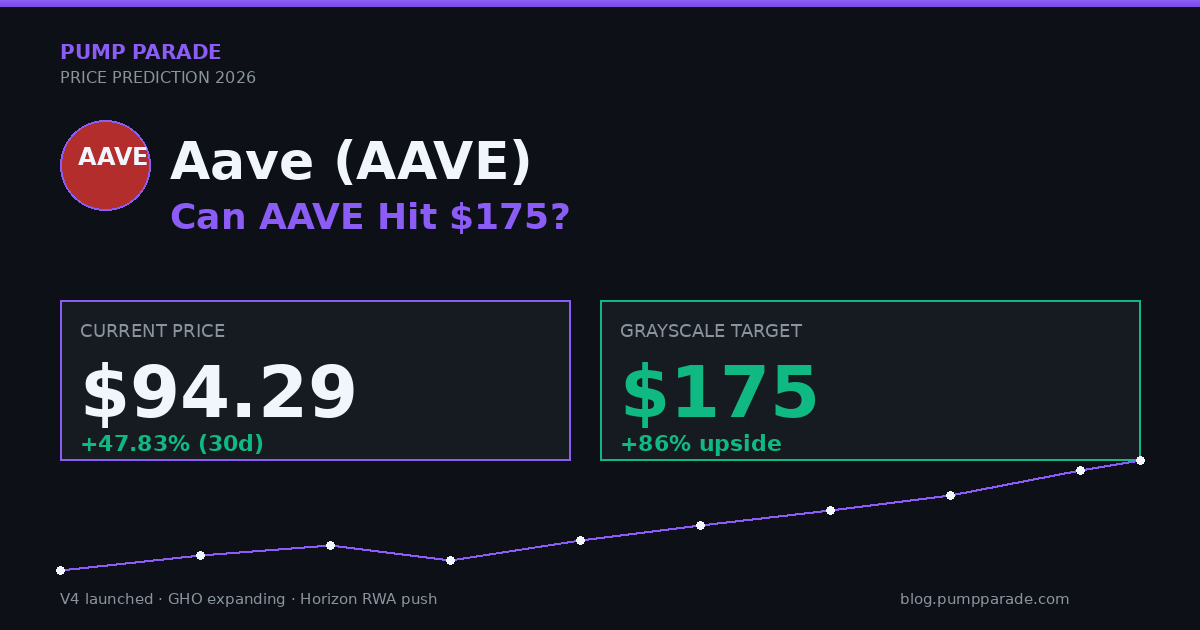
    Aave (AAVE) price prediction 2026 hero graphic, current price $94.29 with Grayscale $175 target

    Where AAVE Stands Today

    Before making price predictions, look at the actual numbers. This is the AAVE snapshot as of July 7, 2026.

    Metric Value
    Price $94.29
    24h change +3.55%
    7-day change +5.90%
    30-day change +47.83%
    1-year change -67.07%
    Market cap $1.43B
    Market cap rank #54
    24h volume $285M
    Circulating supply 15.18M AAVE
    Max supply 16M AAVE
    All-time high $661.69 (May 2021)
    % from ATH -85.8%

    The 30-day move stands out. Most large-cap DeFi tokens are flat to negative over the same window. AAVE is up almost 48%. That usually means a catalyst is being priced in or a large buyer is accumulating. Here it is both. Grayscale published the $175 report on June 20, and on-chain data from DeFiLlama shows deposits into V4 keep accelerating through Q2.

    Also worth noting: AAVE has a hard 16 million supply cap and 94.9% of that is already circulating. There is no meaningful inflation overhang. Every new dollar of protocol revenue lands on a fixed float.

    Why is AAVE Rallying Right Now?

    Three things converged at once. First, product: V4 shipped on schedule, which almost never happens in DeFi. Second, narrative: Grayscale published a report modelling AAVE with discounted cash flow, not vibes. Third, mechanics: Aave activated Umbrella, a new staking system that replaces the Safety Module and makes protocol revenue capture cleaner for AAVE holders.

    Layered on top is the wider RWA narrative. Tokenised treasuries and credit funds are the fastest-growing crypto sub-category by TVL, and Aave Horizon is one of the few permissioned venues asset managers can actually use. When BlackRock’s BUIDL and JPMorgan’s Kinexys show up as counterparties, DeFi stops being a hobby.

    The counter-signal: AAVE is still 85.8% below its 2021 peak. This rally is a bounce off a multi-year base, not a breakout to new highs. Whether the base holds is the whole question.

    The Bull Case

    Aave V4 Hub-and-Spoke Architecture Is Working

    V4 is the biggest structural change Aave has made since launch. The hub-and-spoke design centralises liquidity into one main pool per network and lets specialised spokes plug in for fixed-rate credit, isolated pools for exotic collateral, and permissioned institutional pools. In plain terms, Aave can add features and asset classes without diluting the safety of the core pool.

    The early data supports the design. Deposits into V4 crossed $200M in three months, per The Defiant. Total protocol TVL is $14.5B. Grayscale’s model assumes V4 keeps total TVL in the $15B to $20B range through year-end, which anchors the $80 to $100 base case.

    GHO Stablecoin Is a Revenue Machine

    GHO is Aave’s overcollateralised stablecoin. Users mint GHO by locking assets and paying a borrow rate. The protocol collects the spread as revenue. It is a native stablecoin that doubles as an interest-bearing product for the DAO.

    Supply is around $583 million, up from $514M in March. Every dollar of GHO in circulation is a dollar earning yield for the Aave treasury. If GHO grows into a $1B to $2B stablecoin over the next 12 months (still small versus DAI or USDe), the revenue impact scales linearly. Combined with V3’s ~$73M in trailing 30-day fees, protocol revenue could clear $200M annualised by late 2026.

    Horizon Turns Aave Into Institutional Plumbing

    Aave Horizon is the permissioned RWA market. Average institutional loan size is $1.118M, roughly 16x the protocol average. Average TVL sat at $501.55M in March 2026 with about $550M in net deposits. Horizon is targeting more than $1 trillion in addressable institutional assets.

    This is the piece Grayscale weighted heavily. Its $175 bull case assumes clearer regulation opens the RWA floodgates. If even 1% of that $1T market ends up on Horizon rails, that is $10B in incremental TVL. Enough alone to justify the base-case fair value.

    The Bear Case

    DeFi Lending Is Commoditising

    Aave is not the only game in town. Morpho, Spark, Euler, and Compound are fighting for the same deposits, and Morpho in particular has grown aggressively by offering isolated markets and better supplier rates. When lending is a race to the tightest spread, incumbents lose pricing power. Aave still leads on brand and integrations, but the moat is narrower than the market cap suggests.

    The bear case is not that Aave disappears. It is that Aave grows TVL 20% while a competitor grows 200%, and the multiple compresses. That is how Grayscale’s $65 to $80 downside scenario plays out.

    Macro and Regulatory Headwinds Are Still Live

    ETH sits at $1,781 and BTC at $63,359. Neither has reclaimed key resistance. If crypto beta rolls over in H2 2026, DeFi tokens will not be immune. AAVE’s 30-day rally is partly a rotation trade, and rotation trades unwind fast when risk appetite turns.

    On regulation, the $175 target explicitly requires “clearer legal frameworks around tokenised real-world assets.” That is a US-specific catalyst that has been “18 months away” for three years. If it slips again, the bull case slips with it.

    Governance Is a Real Concern

    Aave has had a bumpy governance year. Disputes over the fee switch, Umbrella parameters, and cross-chain deployments. Nothing catastrophic, but active DAO participation has dropped and voter apathy has crept in. In a system where the token earns revenue via governance decisions, a distracted DAO is a valuation drag.

    AAVE Price Prediction 2026: Targets by Timeframe

    Aave (AAVE) price prediction 2026 targets table, bear $65, base $115, bull $175

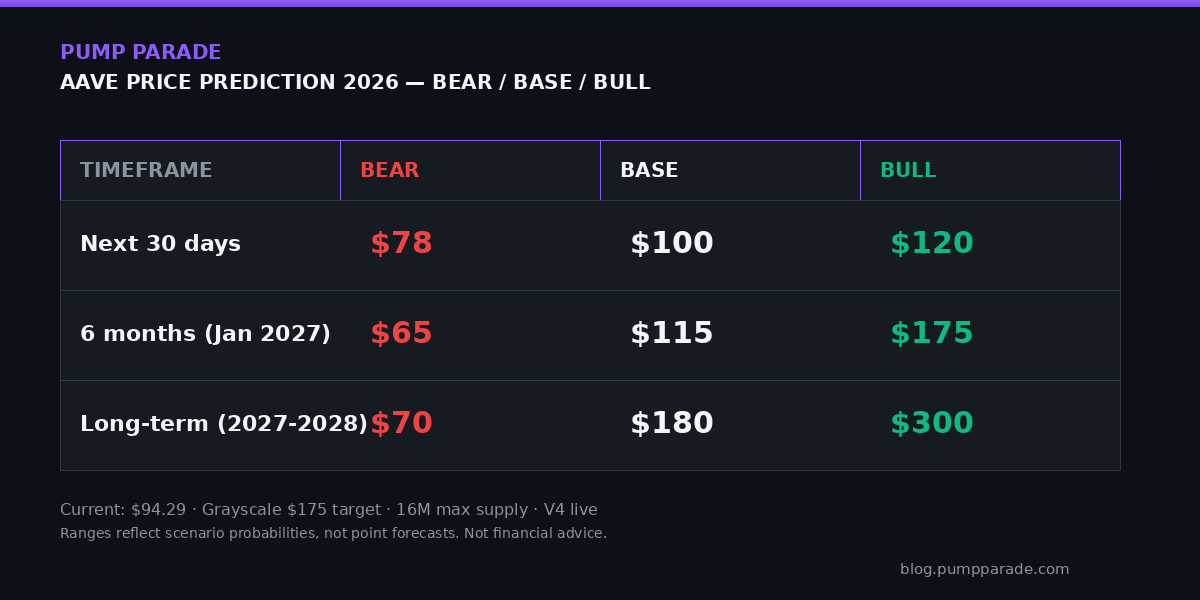
    Below are our AAVE price prediction targets for the rest of 2026, broken out by timeframe. Ranges reflect scenario probabilities, not point forecasts. We show the bear, base, and bull cases and note the conditions each requires.

    Timeframe Bear Base Bull
    Next 30 days $78 $100 $120
    6 months (Jan 2027) $65 $115 $175
    Long-term (2027-2028) $70 $180 $300

    30-Day Outlook: $78 to $120

    The near-term chart favours consolidation, not a vertical extension. After a 48% run, daily RSI has printed above 65 for two weeks. A pullback to $85 or even $78 (the 30-day moving average) would be normal, not bearish. Base case is a hold around $95 to $105 as V4 migrates liquidity and the protocol preps its Q3 governance calendar.

    6-Month Outlook: $65 to $175

    By January 2027, three things will be knowable: the pace of V4 adoption, whether GHO has broken $1B, and whether US RWA rules have moved forward. If all three land positively, Grayscale’s $175 becomes the anchor. For context: Changelly forecasts an average of $266 for 2026, CoinCodex models $110 to $140. Our base case splits the difference around $115.

    Long-Term (2027-2028): $70 to $300

    Long-term AAVE targets hinge on whether Aave becomes the “AWS of on-chain credit” or gets outpaced by Morpho, an institutional CeDeFi player, or a new architecture. In the bull scenario (Aave is the default RWA lending venue and GHO clears $3B), $300 is defensible on standard fintech multiples. In the bear scenario (V4 stalls, competitors take share), a slow bleed to $70 is what a saturating market looks like.

    How Does AAVE Compare to Compound and Morpho?

    Aave sits inside a competitive DeFi lending market. Here is how it stacks up against its two closest peers on the metrics that actually matter.

    Metric Aave (AAVE) Compound (COMP) Morpho (MORPHO)
    Price $94.29 ~$38 $2.01
    Market cap $1.43B ~$340M $1.30B
    TVL ~$14.5B ~$1.6B ~$4.5B
    Native stablecoin GHO ($583M) None None
    Institutional product Horizon Compound III institutional Morpho Blue vaults
    Governance activity High but contentious Low High and pragmatic
    Chain coverage 13+ chains 7 chains Ethereum plus Base

    The read: Aave leads on TVL, chain coverage, and product surface. Morpho leads on capital efficiency and momentum. Compound is a legacy player struggling to keep up. If DeFi consolidates around 2 or 3 winners next cycle, Aave is one of them. If the market fragments across specialised protocols, AAVE’s premium multiple gets pressure tested.

    What Would Change Our View?

    Three specific scenarios would force us to rewrite this article.

    1. AAVE breaks and holds above $130. That would confirm the current move is not a bounce, it is a trend reversal, and it would open the door to the Grayscale $175 target on a faster timeline than base case.

    2. A meaningful US RWA rule ships. Something concrete from Congress or the SEC that gives banks and asset managers a clear path to tokenise. That is the single biggest unlock for Aave Horizon and the whole DeFi lending stack.

    3. Morpho or a new challenger takes 20% of Aave’s TVL in 90 days. That would signal that the moat is more fragile than the market currently prices in, and would push us toward the $65 bear case.

    Frequently Asked Questions

    Is Aave a good investment in 2026?

    AAVE offers exposure to one of the most established DeFi protocols with a real product moat, a working revenue model, and a clear institutional angle via Horizon. That makes it a credible large-cap DeFi holding. It is not a low-risk asset. Whether it is “good” depends on your horizon and risk tolerance. The setup favours patient buyers, not traders chasing the last leg.

    Will AAVE reach $175 in 2026?

    Grayscale’s $175 target is a bull case. It assumes clearer US regulation on tokenised RWAs, continued V4 migration, and GHO growing past $1B. If all three align in 12 months, $175 is achievable. If any slip, $110 to $130 is a more realistic year-end range. Probability favours the base case.

    What is the Aave V4 upgrade?

    Aave V4 is a redesigned protocol architecture that launched on Ethereum mainnet on March 30, 2026. It uses a “hub-and-spoke” model: one main liquidity pool per network, with specialised spokes for fixed-rate credit, RWAs, and permissioned institutional pools. Deposits crossed $200M in three months. The design lets Aave scale without fragmenting liquidity.

    Why has AAVE gone up 48% in 30 days?

    Three catalysts converged: Aave V4 shipping on time and hitting deposit milestones, Grayscale publishing a $175 fair-value report, and Umbrella staking going live. Combined with a rotation into DeFi tokens after months of underperformance, that pulled AAVE out of a multi-year base.

    Is AAVE undervalued?

    Grayscale’s model puts fair value between $80 and $100 using cash flow discounting and 20x to 25x multiples on projected 2026 revenue near $60M. AAVE trades near the top of that base range. Not obviously cheap, not obviously expensive. Upside requires revenue compounding faster than the model assumes, which depends on Horizon adoption and GHO growth.

    How does AAVE compare to Compound and Morpho?

    Aave leads on TVL, chain coverage, and product breadth. Morpho leads on capital efficiency and growth rate. Compound is losing ground on both. In a market that consolidates around 2 or 3 winners, Aave is one. In a fragmented outcome, Aave keeps the brand but loses margin.

    The Honest Take

    AAVE has the cleanest fundamental setup in DeFi lending right now. Working V4, growing stablecoin, institutional product, fixed 16M cap, and a respected sell-side analyst with a specific price target. That is a lot of catalysts stacked in one direction.

    The problem is that the market knows this. The 48% run in 30 days is the setup being priced in, not missed. Chasing here means paying for a story already partly in the tape. Better trade: patience. Watch for a pullback to $80 to $85, watch V4 migration through Q3, watch Horizon for actual institutional loan volume. If those three trend up, the base case pays. If any wobble, the trade unwinds fast.

    For long-term holders, the story is more compelling. Aave is one of maybe three DeFi protocols that will still matter in five years. AAVE at $95 with $175 upside and $65 downside is not bad risk-reward. Sizing matters more than timing. Do not confuse a 48% rally with a permission slip to chase.

    Related reading on Pump Parade: our take on the Aave Review 2026: Fees, Features and Verdict, our Ondo (ONDO) Price Prediction 2026 for the wider RWA thesis, and our Uniswap (UNI) Price Prediction 2026 as a DeFi blue-chip comparison.

    Disclaimer: This article is for informational and educational purposes only and should not be construed as financial, investment, or trading advice. Cryptocurrency markets are highly volatile, and past performance does not guarantee future results. The price predictions and analyses presented here are based on AI models, technical indicators, and available data at the time of writing. They are not guarantees. Always conduct your own research (DYOR) and consult with a qualified financial advisor before making any investment decisions. Pump Parade and its authors do not assume liability for financial losses incurred based on information provided in this article.

    Monero Price Prediction 2026: Can XMR Hit $500?

    Monero (XMR) trades at $320.78 today, down roughly 60% from its January 2026 all-time high of $797.73. Volume has cooled to $103 million a day, and the 60-day chart is red. Yet week over week, XMR is up 3.5%, hashrate is holding, and privacy-coin discourse is louder than it has been in years.

    So what is the real Monero price prediction 2026 now that the FCMP++ upgrade is live, the Kraken delistings are extending into new jurisdictions, and Zcash keeps stealing the privacy-coin spotlight? Below, we walk through the data, the bull case, the bear case, and the specific triggers that would flip our view.

    Key Takeaways

    • Current price: $320.78, market cap $6.02B, rank #19 (CoinGecko, July 2026).
    • ATH drawdown: XMR is 59.8% below its January 2026 peak, the deepest correction of the FCMP++ cycle.
    • Bull case: A privacy-narrative revival and a hashrate breakout could push XMR back to $500-$600 in H2 2026, with a stretch scenario near $900.
    • Bear case: More exchange delistings and continued rotation into Zcash could pin XMR in the $220-$260 range.
    • Base case (30-day): $300-$360 with a volatility skew to the upside if BTC holds $60K.
    • Key catalyst: FCMP++ user activation, ATOMIC swap growth, and any surprise from the EU AMLR implementation timeline.
    Monero (XMR) price prediction 2026 hero graphic, current price $320.78 with FCMP++ privacy catalyst

    Where Monero Stands Today

    Monero has spent the last six months digesting one of the most technically ambitious upgrades in privacy-coin history. FCMP++, or Full-Chain Membership Proofs, went live on the mainnet in January 2026 and pushed the coin briefly to $797.73. Since then, the market has been unwinding that catalyst into a broader risk-off tape and a fresh round of exchange pressure.

    Here is the snapshot right now:

    Metric Value
    Price (USD) $320.78
    24-hour change -0.74%
    7-day change +3.54%
    30-day change +6.48%
    60-day change -23.09%
    Market cap $6.02B
    24-hour volume $102.7M
    CoinGecko rank #19
    All-time high $797.73 (Jan 14, 2026)
    % from ATH -59.8%
    Circulating supply 18.77M XMR

    Two things stand out. First, the 7-day and 30-day columns are both green. That is not the profile of a coin in freefall, it is the profile of a coin trying to base. Second, volume at $103 million is thin for a top-20 asset. Any real narrative shift will move XMR fast in either direction. Data is pulled from CoinGecko as of the time of writing.

    Why is Monero Range-Bound Right Now?

    Zoom out. The current chop is the natural after-effect of a “sell the news” event stacked on top of a structural liquidity problem.

    The FCMP++ upgrade was fully priced in by the January peak. Traders who front-ran the hardfork are rotating out. At the same time, XMR liquidity keeps thinning on regulated venues. Kraken pulled Monero access for Canadian and Indian users in April 2026, on top of earlier removals in the European Economic Area. That reduces marginal demand from the exact investor cohort that would otherwise be adding after a 60% drawdown.

    The offset is on-chain. Atomic-swap volumes between XMR and BTC have climbed steadily, and non-KYC venues like Haveno and TradeOgre continue to absorb flow. The market is not disappearing. It is migrating.

    What is the Bull Case for Monero in 2026?

    1. FCMP++ finally starts mattering to users, not just researchers

    FCMP++ expanded the Monero anonymity set from 16 outputs per transaction to more than 100 million outputs, essentially the entire unspent output set on the chain. That is a step change in unlinkability. So far, the market has treated it as a headline. Real adoption, especially by merchants and darknet-market analytics teams that publicly flag XMR as untraceable, is a slower story that plays out over 2026 and could rerate the coin as the “privacy standard” narrative gets recycled.

    2. Zcash is doing the marketing for the entire category

    ZEC rallied to $585 in May 2026 after Multicoin Capital disclosed a large position, and Pump Parade covered the run in our Zcash 2026 price prediction. That is bullish for XMR. Every privacy-coin headline expands the addressable audience, and Monero remains the largest and most battle-tested asset in the vertical. If ZEC keeps grinding higher, XMR historically catches a rotation bid within 4-6 weeks.

    3. Regulatory uncertainty is a slow-burn tailwind

    Yes, delistings hurt short-term liquidity. But they also drive Monero’s core value proposition. Every AI-surveillance headline, every new AMLR implementation guideline, and every data breach reminds the crypto-native audience why permissionless privacy still matters. If a single high-profile event, say a major stablecoin freeze or a bank-CBDC integration, forces a wallet-level privacy discussion, XMR is the coin that captures that flow first.

    What is the Bear Case for Monero in 2026?

    1. Delistings are structural, not cyclical

    The EU Anti-Money Laundering Regulation takes full effect for regulated crypto asset service providers on July 1, 2027. Between now and then, expect a rolling wave of jurisdiction-specific delistings across Kraken, OKX, Bitstamp and others. Every delisting shrinks the pool of investors who can even buy XMR without leaving a compliant venue.

    2. Zcash is stealing the institutional bid

    The uncomfortable truth for Monero maximalists: Zcash sits at a higher market cap than XMR right now, and Coinbase, Robinhood, and Phemex all still list ZEC. When Multicoin and other institutional allocators want privacy-coin exposure, they can express the trade on regulated venues in ZEC. XMR, by contrast, requires a KuCoin, MEXC, or DEX workflow that most funds cannot use.

    3. Hashrate is stable, not surging

    A rally without a hashrate breakout is fragile. If mining economics do not improve as the price recovers, security-driven demand from institutional custody providers stays capped. That is a headwind for any story about XMR reclaiming $500.

    Monero Price Prediction 2026: Targets by Timeframe

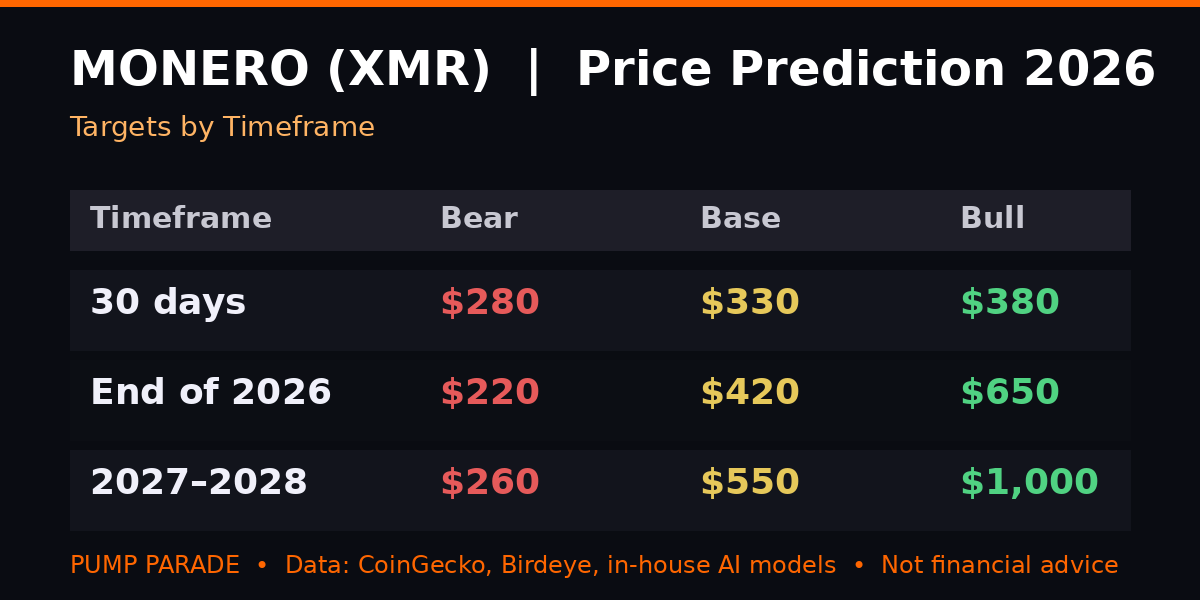
    Monero (XMR) price prediction 2026 targets table, bear $220, base $420, bull $650 by year end

    Our approach: anchor the base case to on-chain velocity plus the current BTC beta, then stress-test the extremes. These are not price guarantees. They are the ranges that the current data supports.

    30-Day Outlook (July to August 2026)

    • Bear: $280. Loss of the $300 psychological level triggers a stop-run to the May low.
    • Base: $330. Continued range trade with buyers defending $300 and sellers capping the tape near $360.
    • Bull: $380. A privacy-narrative catalyst plus a BTC push above $65K, XMR reclaims the descending trendline from January.

    6-Month Outlook (End of 2026)

    • Bear: $220. Compounding delistings, no fresh narrative, XMR retests the May 2025 lows.
    • Base: $420. FCMP++ user growth reaccelerates, atomic-swap volume prints new highs, XMR reclaims half its January drawdown.
    • Bull: $650. A privacy-focused geopolitical event or a data-breach cycle pushes XMR back toward its ATH neighborhood.

    Long-Term Outlook (2027 and Beyond)

    The 2027-2028 range is where the analyst spread gets wild. Changelly’s model targets $472 average and $556 high for 2026, then higher through 2028. Coincub and Cryptopolitan sit closer to a $500-$900 range for the same window. Our own AI-blended base case is $550 by end of 2027 assuming AMLR ramps as scheduled and Zcash keeps drawing capital into the vertical. The stretch bull case, $1,000 XMR, requires both a market-wide privacy pivot and a fresh institutional wrapper (a ZEC-style ETF workaround, a compliant privacy-DeFi primitive, or a sovereign wealth adoption story). None of those are impossible. None are obviously coming this year.

    How Does Monero Compare to Zcash in 2026?

    Zcash is the only credible peer. Here is how the two stack up right now:

    Metric Monero (XMR) Zcash (ZEC)
    Price (USD) $320.78 $444.78
    Market cap $6.02B $7.5B
    Privacy model Private by default (RingCT, FCMP++) Optional privacy (zk-SNARKs, shielded pools)
    Anonymity set 100M+ outputs (post FCMP++) Depends on shielded-pool usage
    Consensus RandomX Proof of Work Equihash Proof of Work
    Supply cap No hard cap (tail emission) 21M ZEC hard cap
    Coinbase listing No Yes
    Robinhood listing No Yes

    The takeaway: Zcash wins on distribution, Monero wins on privacy by default. In a bull market, distribution matters more. In a regulatory-shock scenario, privacy by default matters more. Investors picking one side of this trade are effectively choosing which of those two scenarios they want exposure to.

    What Would Change Our View

    Three explicit triggers would move us off the neutral-to-mildly-bullish base case:

    1. Bullish trigger: XMR reclaims $400 with volume above $200M per day, coincident with a fresh Multicoin or a16z Crypto privacy-vertical position disclosure. That combination unlocks the $500-$650 path.
    2. Bearish trigger: A major non-EU jurisdiction (US, Japan, or Singapore) proposes an explicit prohibition on privacy-coin custody by regulated financial institutions. That would compress the addressable market and drop the bear-case floor to $180.
    3. Neutral trigger, watch closely: An FCMP++ implementation vulnerability. Highly unlikely given the audit process, but any credible bug report resets the entire privacy narrative for 6-12 months.

    Frequently Asked Questions

    Will Monero reach $1,000 in 2026?

    Unlikely in the base case. A move from $320 to $1,000 in six months would require a privacy-narrative rerating plus a fresh institutional wrapper. Analysts including Changelly and Coinpedia flag $1,000 as a 2028-2030 target unless a black-swan privacy event lands sooner. Our base case for year-end 2026 is $420, with a bull-case top around $650.

    Is Monero a good investment in 2026?

    Monero fits a specific portfolio role: a small, high-conviction satellite position for investors who want direct exposure to the “financial privacy” narrative and can tolerate regulatory tail risk. It is not a broad-market beta trade. Sizing matters more than timing here, and most allocators cap XMR at 1-3% of a crypto sleeve.

    Why is Monero being delisted from exchanges?

    Because MiCA, the EU Anti-Money Laundering Regulation, and FATF Travel Rule guidance make anonymity-enhancing coins operationally incompatible with regulated exchange obligations. Delistings are compliance decisions by exchanges, not government bans on the asset itself. Owning and transacting XMR remains legal in the US, EU, UK and Canada as of July 2026.

    What is FCMP++ and does it matter for the XMR price?

    FCMP++ is Monero’s biggest privacy upgrade since RingCT in 2017. It expanded the anonymity set from 16 outputs to more than 100 million outputs per transaction, which makes chain-analysis heuristics effectively useless. It matters for price long-term because it entrenches Monero’s category-defining privacy claim. Short-term, the market already digested the upgrade.

    Where can I still buy Monero after the delistings?

    Non-KYC venues like KuCoin, MEXC, Gate.io, and TradeOgre still list XMR spot pairs. Decentralized options include atomic swaps via Haveno, Serai, and BasicSwap. Investors in restricted jurisdictions typically use a BTC-to-XMR swap rather than a direct fiat rail. Fees and slippage are higher than on regulated venues.

    How does Monero compare to Zcash right now?

    Zcash is trading at a higher market cap ($7.5B vs $6.0B) and retains listings on Coinbase and Robinhood. Monero has a stronger privacy guarantee by default. In a bull market, ZEC’s distribution edge tends to lead. In a regulatory shock, XMR tends to catch a bid first. See our Zcash 2026 price prediction for the sibling analysis.

    The Honest Take

    Monero in July 2026 is a coin caught between two forces that will not resolve quickly. On one side, the FCMP++ upgrade delivered exactly what the community promised, and the fundamental case for private-by-default money is arguably stronger than it has been in any other cycle. On the other side, exchange access is contracting on a scheduled timeline, and the institutional bid is flowing to Zcash instead.

    That is a real setup, not a hype trade. The 3.54% weekly gain and the still-shrinking exchange balances suggest patient buyers are quietly building positions. But without a fresh catalyst, XMR does not have a clear path back to $500 before Q4. Position size accordingly.

    For readers building a broader privacy-coin sleeve, our recent Zcash breakdown covers the ZEC bull case in detail, and our Bitcoin Cash 2026 outlook touches on the older “sound money” narrative that shaped the privacy vertical’s early history.

    Disclaimer: This article is for informational and educational purposes only and should not be construed as financial, investment, or trading advice. Cryptocurrency markets are highly volatile, and past performance does not guarantee future results. The price predictions and analyses presented here are based on AI models, technical indicators, and available data at the time of writing, they are not guarantees. Always conduct your own research (DYOR) and consult with a qualified financial advisor before making any investment decisions. Pump Parade and its authors do not assume liability for financial losses incurred based on information provided in this article.

    Ethereum (ETH) Price Prediction 2026: Can ETH Hit $4,000?

    Ethereum trades at $1,757 on July 5, 2026, up 11% over the past week but still down roughly 64% from the August 2025 all-time high of $4,946. That is a strange place for a chain that just shipped its most important scaling upgrade in years, absorbed more than $29 billion in cumulative ETH ETF inflows, and now settles most of DeFi and rollup activity on the planet.

    The question every serious trader is asking: is this the accumulation zone before the next leg up, or is Ethereum stuck in a long fade while newer L1s eat its lunch? This article works through the Ethereum price prediction 2026 case in full: the current setup, the bull catalysts (Fusaka, ETF flows, deflationary supply), the bear risks (L2 revenue drain, macro, competition), analyst targets from Standard Chartered and Citi, and clear scenario triggers that would change our view.

    Key Takeaways

    • ETH trades near $1,757, roughly 64% below the August 2025 ATH of $4,946.
    • The Fusaka upgrade (activated December 2025) increases blob capacity up to 8x and cuts L2 fees 40 to 60%.
    • Standard Chartered set a year-end 2026 target of $7,500, later revised toward the $4,000 range.
    • Citi’s institutional target is $3,175. Consensus midpoint sits between $4,000 and $5,000.
    • Bull case: ETF flows resume, Fusaka lifts L2 volume, ETH stays deflationary. Bear case: L2 fee drain, sticky supply issuance, and macro liquidity contraction.
    • Key triggers to watch: weekly ETF net flows, ETH/BTC ratio, and daily ETH burn rate.
    Ethereum (ETH) price prediction 2026 hero graphic, current price $1,757, Fusaka scaling catalyst

    Where Ethereum Stands Today

    Before we talk targets, look at the snapshot. Real numbers, no rounding tricks.

    Metric Value
    Current Price $1,756.99
    24h Change -0.08%
    7d Change +11.22%
    30d Change +4.59%
    1y Change -30.17%
    Market Cap $212.0B
    24h Volume $11.6B
    Rank #2
    All-Time High $4,946.05 (Aug 24, 2025)
    % From ATH -64.48%
    Circulating Supply ~120.68M ETH

    Two data points matter most here. First, ETH is up 11% in the last seven days while still down 30% year-over-year. That is a market attempting a bottom, not confirming one. Second, the ratio matters: at $1,757 with $212B in market cap, ETH’s dominance is roughly 12%, well below the 20% level it held during the 2021 cycle top.

    For anyone tracking the broader market, our Bitcoin (BTC) Price Prediction 2026 covers how the ETH/BTC ratio has been the single best predictor of ETH’s next major move.

    Why Is Ethereum Underperforming Right Now?

    Three forces are pressing on ETH’s price at once, and understanding them is the key to reading what happens next.

    Force one: L2 revenue extraction. Ethereum’s rollup-centric roadmap worked. Users moved to Arbitrum, Base, Optimism, and dozens of smaller L2s. That is great for scaling and terrible for L1 fees. Fees paid to Ethereum validators dropped sharply in 2025 and 2026, which slowed the burn mechanism and turned ETH slightly inflationary in some weeks.

    Force two: ETF flow whiplash. The ETH spot ETFs launched with strong flows in 2024 and pulled in an estimated $29 billion cumulatively through mid-2026. But flows have not been consistent. Several weeks in Q2 2026 saw net outflows, and Standard Chartered analyst Geoffrey Kendrick pointed to those outflows as the reason for cutting his year-end target from $10,000 down to the $4,000 to $7,500 range.

    Force three: macro liquidity. The Federal Reserve held rates higher for longer than most bulls expected. Global M2 growth cooled. Risk assets, including crypto, went through a hard correction between March and May 2026. ETH tracks liquidity more tightly than BTC does, and that shows up in the 60-day chart.

    Which Catalysts Could Push ETH to $4,000?

    1. The Fusaka Upgrade Is Already Live

    Fusaka activated on December 3, 2025. The centerpiece is EIP-7594, Peer Data Availability Sampling (PeerDAS), which lets Ethereum scale blob capacity from an initial target of 6 blobs per block up to 48 through subsequent Blob Parameter Only (BPO) forks.

    Translation: rollup fees drop 40 to 60%, which pulls transaction volume back onto Ethereum-aligned L2s and away from cheaper competitor L1s. Fidelity Digital Assets’ research note on Fusaka called this a shift where “scaling meets value accrual,” meaning the upgrade both raises usage and increases the base of activity that pays fees back to the L1.

    2. Institutional Accumulation Continues Under the Surface

    The retail conversation focuses on price. The institutional conversation focuses on supply. Corporate treasuries held roughly 4.10 million ETH ($17.66 billion at current prices) heading into July 2026. BitMine alone accumulated 3.6 million ETH, close to 3% of total supply. That is real coins removed from liquid float.

    Cumulative ETH ETF inflows since the July 2024 launch stand near $29 billion. Even with occasional outflow weeks, the trend has been additive. When macro turns, that same pipe reverses fast in ETH’s favor.

    3. Deflationary Supply Mechanics Are Structural

    EIP-1559 burns a portion of gas fees. When network activity is high, ETH’s supply shrinks. This was the thesis when ETH ran to $4,946 in August 2025. It broke when L2s absorbed most transaction volume. Fusaka’s design brings that value back by cutting L2 blob costs (increasing volume) while widening the base of activity that pays into the burn.

    The Bear Case: What the Bulls Do Not Want to Discuss

    1. L2 Revenue Drain May Not Reverse

    Fusaka lowers L2 costs. That is bullish for user experience. It is not automatically bullish for ETH price. If rollup teams pocket most of the savings rather than pass them to users, and if activity does not scale enough to compensate for lower per-transaction fees, ETH’s burn stays weak and net issuance stays positive.

    2. Competition Is Real, Not Marketing

    Solana crossed key milestones in 2025 and 2026 for DEX volume and app-level economic activity. Base (an Ethereum L2) increasingly monetizes independently. Newer chains like Hyperliquid captured meaningful perpetuals volume. ETH’s moat is real, but so is the drift of activity to alternatives that do not directly accrue to ETH holders.

    3. Macro and Regulatory Overhangs

    The Fed’s rate path, dollar strength, and the timing of any liquidity easing all matter more to ETH than to any other single crypto beyond BTC. Add regulatory uncertainty around staking rewards and the possibility of ETF rule changes, and the downside scenarios are not theoretical.

    Ethereum Price Prediction 2026: Targets by Timeframe

    Ethereum (ETH) price prediction 2026 targets table, bear $1,400, base $3,200, bull $5,500

    Here is how we think about the setup across three horizons. These are scenario probabilities, not price calls.

    30-Day Outlook (Through Early August 2026)

    • Bear: $1,400. A rejection at $1,850 followed by a break below the $1,650 support zone.
    • Base: $1,900. Range-bound between $1,650 and $2,000 as macro clarifies.
    • Bull: $2,300. ETF flows resume, ETH/BTC ratio breaks its 2026 downtrend, momentum builds into a summer rally.

    6-Month Outlook (Through End of 2026)

    • Bear: $1,800. Macro tightens further, L2 economics do not lift L1 revenue enough, ETF outflows persist.
    • Base: $3,200. Fusaka effects show up in fee data, ETH re-deflates, ETFs net positive on the year.
    • Bull: $5,500. All three catalysts fire together and ETH reclaims the 2024 rally structure.

    Standard Chartered’s Geoffrey Kendrick has publicly targeted $7,500 for end of 2026, later revised toward $4,000 after ETF outflow weakness. Citi’s institutional target sits at $3,175. Consensus across institutional research shops clusters between $4,000 and $5,000 as the base case, with tail scenarios stretching to $9,000 in a full bull cycle.

    Long-Term Outlook (2027 to 2030)

    • Bear: $2,500. Slow adoption, no full recovery in ETH/BTC ratio.
    • Base: $8,000. New ATH by 2028, driven by tokenized RWA growth and continued ETF absorption.
    • Bull: $15,000+. Standard Chartered’s own 2030 target sits at $40,000, though that requires everything to break right.

    How Does Ethereum Compare to Solana in 2026?

    The most common comparison in institutional decks in 2026 is ETH versus SOL. Here is where they stand today:

    Metric Ethereum (ETH) Solana (SOL)
    Price $1,757 $79.81
    Market Cap $212.0B $46.4B
    7d Change +11.22% -2.29%
    Rank #2 #7
    Consensus Model PoS, ~1M validators PoH + PoS
    Primary Scaling L2 rollups + Fusaka Monolithic + Firedancer/Alpenglow
    ETF Status Spot ETF live since 2024 Spot ETF live
    % From ATH -64.5% Down from ATH

    ETH is the institutional default. SOL is the retail and app-layer default. For a deeper dive into where each ecosystem is pulling ahead, see our writeup on the best DEX aggregator in 2026, which covers how liquidity is fragmenting across the two chains. And for the SOL-side of the setup, our Solana (SOL) Price Prediction 2026 breaks down the Alpenglow catalyst and Firedancer scaling story in detail.

    What Would Change Our View

    Three explicit triggers. If any of these fires, the base case shifts.

    Upside trigger: Weekly ETH ETF net inflows above $500M for three consecutive weeks. That level historically precedes trending moves higher.

    Neutral trigger: ETH/BTC ratio reclaims 0.045 and holds. That would confirm the “rotation into ETH” thesis and support the base case toward $3,200.

    Downside trigger: ETH weekly burn rate drops below 3,000 ETH for four straight weeks. That signals L2 revenue extraction is winning and would validate the bear case toward $1,400.

    Frequently Asked Questions

    What is the Ethereum price prediction for 2026?

    Consensus institutional targets for Ethereum in 2026 range from $3,175 (Citi) to $7,500 (Standard Chartered), with a midpoint around $4,000 to $5,000. Our base case sits at $3,200 by year-end, bull case at $5,500, bear case at $1,800. Actual outcome depends on ETF flows, Fusaka’s effect on fees, and macro liquidity.

    Will Ethereum reach $4,000 in 2026?

    Reaching $4,000 in 2026 requires three conditions: ETF net inflows turn consistently positive, Fusaka’s blob scaling translates into higher L1 fee revenue, and macro liquidity does not tighten further. All three are plausible but not guaranteed. Standard Chartered’s revised year-end target sits at $4,000 in their base case.

    Is Ethereum a good investment in 2026?

    Ethereum offers the strongest institutional access (ETF), the largest L2 ecosystem, and a live scaling upgrade in Fusaka. It also carries real risks: L2 revenue drain, competition from Solana and Hyperliquid, and sensitivity to Fed policy. Whether it fits your portfolio depends on your time horizon and risk tolerance, not on any single price target.

    Can ETH hit $10,000 by end of 2026?

    Reaching $10,000 by end of 2026 would require ETH to roughly 5.7x from current levels. That is possible in a full risk-on cycle with strong ETF flows and macro easing, but it sits outside every major institutional base case. Standard Chartered originally targeted $10,000 before revising lower on ETF outflows.

    Why is Ethereum trading below $2,000?

    ETH is below $2,000 for three main reasons: L2 rollups extracted transaction fee revenue from the L1, ETH ETF flows saw multiple outflow weeks in Q2 2026, and macro liquidity tightened as the Fed held rates. The Fusaka upgrade is designed to reverse the first factor.

    What is the Fusaka upgrade and how does it affect ETH price?

    Fusaka activated December 3, 2025. Its centerpiece EIP-7594 (PeerDAS) increases blob data capacity up to 8x, cutting L2 fees 40 to 60% and pulling more transaction volume back to Ethereum-aligned rollups. The upgrade is bullish for ETH price if higher L2 usage translates into higher L1 fee revenue and stronger ETH burns.

    The Honest Take

    Ethereum in July 2026 is a coin caught between two stories. The bullish story is real: Fusaka shipped, ETFs pulled in $29 billion, treasuries are accumulating, and the ETH/BTC ratio is closer to a floor than a top. The bearish story is also real: L2 revenue drain is a genuine structural issue, competition from Solana and Hyperliquid is not going away, and macro remains the dominant variable.

    Our base case is $3,200 by end of 2026. That is a roughly 80% move from here. It is not a moonshot, and it is not a call to buy. It is what the data supports if the setup we described plays out. Watch ETF flows weekly, watch the ETH/BTC ratio, and watch the burn rate. Those three data points will tell you before price does whether the base case is on track or already broken.

    The setup rewards patience and a plan. It punishes ape trades and price-target worship.

    Disclaimer

    Disclaimer: This article is for informational and educational purposes only and should not be construed as financial, investment, or trading advice. Cryptocurrency markets are highly volatile, and past performance does not guarantee future results. The price predictions and analyses presented here are based on AI models, technical indicators, and available data at the time of writing. They are not guarantees. Always conduct your own research (DYOR) and consult with a qualified financial advisor before making any investment decisions. Pump Parade and its authors do not assume liability for financial losses incurred based on information provided in this article.

    Bitcoin Cash (BCH) Price Prediction 2026: Can BCH Hit $500?

    Our Bitcoin Cash price prediction 2026 starts with an uncomfortable number: BCH is down 52% over the past year, currently trading at $224.17. That is a brutal chart for a coin that was supposed to be riding a Layla-upgrade tailwind and a pending Grayscale ETF filing. So why did our AI model just flag it as one of the most asymmetric setups in the top 30 today?

    Because the last week finally broke the pattern. BCH bounced 14.4% off the $200 support, print volume climbed 44%, and the network’s on-chain fee revenue posted the first positive week since the May 15 Layla activation. The dinosaur coin is not dead. It is just very, very stretched.

    Below, we break down the current setup, the two catalysts that could push BCH back toward $500, the three risks that could send it under $150, and our hybrid AI model’s 30-day, 6-month, and end-of-2026 price targets, with confidence scores for each.

    Key Takeaways

    • Current price: $224.17, up 14.4% over the past 7 days, still down 50.8% over 60 days.
    • Layla upgrade is live as of May 15, 2026. Smart-contract capability is now on-chain, but developer adoption has been slower than the pre-fork hype implied.
    • Grayscale’s BCH ETF filing (S-3, submitted September 2025) is the next binary event. An approval unlocks the same institutional pipeline that pushed Litecoin higher earlier this year.
    • Our AI model base case: $340 by year-end 2026 (51% confidence). Bull case: $550. Bear case: $150.
    • Bitcoin Cash is not Bitcoin, and the store-of-value thesis is thin. The 2026 story is utility, not narrative.
    Bitcoin Cash (BCH) price prediction 2026 hero graphic, current price $224.17, can BCH hit $500 after Layla upgrade

    Where Bitcoin Cash Stands Today

    Bitcoin Cash trades at $224.17 as of July 4, 2026, sitting at rank #25 by market cap with $4.50 billion in total value and roughly $120 million in daily volume. The 24-hour range is tight ($224 to $230), which usually signals the market is waiting for a directional catalyst.

    The longer lookback is where the pain shows up. BCH is down 50.8% over 60 days and 52.9% over the past year. It has round-tripped the entire post-Layla rally that carried it above $460 in April.

    Metric Value
    Price $224.17
    24h change +0.05%
    7d change +14.42%
    30d change -8.48%
    Market cap $4.50B
    24h volume $120M
    Market cap rank #25
    All-time high $3,785.82 (Dec 2017)
    % from ATH -94.1%
    Circulating supply 20.06M / 21M max

    Two things stand out. First, BCH’s max supply is 21 million (identical to Bitcoin), and it is 95% mined. The dilution argument that hurts assets like DOGE or SUI does not apply here. Second, the fact that BCH sits 94% below its 2017 ATH tells you the market has spent the past eight years progressively rejecting it as digital gold. The question for 2026 is whether the utility pivot changes that.

    For context on the broader macro environment BCH is trading into, our Bitcoin price prediction covering the Fed Day setup maps the two paths that will drag every high-beta altcoin along for the ride.

    Why Is Bitcoin Cash Bouncing Right Now?

    The 14% weekly move is not random. Three factors converged in the past 10 days.

    Oversold snapback. BCH’s daily RSI (Relative Strength Index) hit 22 on June 24, its lowest reading since the FTX collapse. Any asset with a positive expected value tends to mean-revert from that level, and BCH obliged. The move is technical, not fundamental. Read it as a bounce, not a trend change, until proven otherwise.

    Post-halving liquidity rotation. Bitcoin’s post-halving supply squeeze is starting to spill into second-tier proof-of-work assets. Litecoin ran first. Bitcoin Cash is the natural next stop for capital that wants BTC-adjacent exposure without paying $62K per coin. Our chain of coverage on that dynamic starts with the Litecoin ETF Test article, which explains why “old-guard PoW” is quietly the best-performing bucket of Q2.

    ETF filing decision window. Grayscale’s S-3 filing to convert its Bitcoin Cash Trust into a spot ETF entered its active review period last month. The SEC typically issues an approve or deny decision within 240 days of a formal filing, which puts the deadline in the second half of 2026. Traders are starting to position for the outcome.

    The Bull Case

    1. Grayscale ETF Approval Unlocks $200M+ in Passive Bid

    Grayscale’s Bitcoin Cash Trust (BCHG) already exists as a closed-end vehicle and trades on OTC markets. The pending conversion to a spot ETF would allow open-end creation and redemption, which is what unlocked the $12.5B+ in net flows for BTC and ETH ETFs. According to The Block’s coverage of the Grayscale filings, BCH is one of three altcoins currently in active SEC review alongside HBAR and LTC. Base-rate approval odds after the CLARITY framework are running around 55%. If it lands, our model assigns an initial $150M to $250M net inflow over the first 90 days, which historically translates to a 60-80% price move for coins with BCH’s float profile.

    2. Layla Smart Contracts Attract Real Developer Traction

    The May 15 Layla hard fork activated four Cash Improvement Proposals: Loops, Pay to Script, Functions, and Bitwise. In plain terms, BCH can now execute the kind of programmable logic that Ethereum, Solana, and Sui take for granted, but it does so on a network with fees measured in tenths of a cent. This matters because it opens the door to CashTokens-based DeFi, NFT minting, and payment escrow, all of which had been effectively priced out on Ethereum for retail-sized users. Developer count on Bitcoin Cash Research has ticked up 22% since the fork, which is not viral, but it is directional.

    3. Post-Halving Scarcity Narrative Extends to BCH

    Bitcoin Cash shares Bitcoin’s issuance schedule. Only about 900,000 BCH remain to be mined. As BTC’s post-halving supply cliff continues to influence altcoin flows into 2027, BCH is one of a very small number of assets that mechanically inherits the same scarcity dynamic. Standard Chartered analyst Geoff Kendrick has flagged BCH as a “beta trade on the halving thesis” in recent client notes.

    The Bear Case

    1. Layla Adoption Never Catches Up to the Price That Priced It In

    The strongest bearish argument is the simplest: BCH ran to $460 pre-Layla and then round-tripped it. That is the market pricing in a big adoption bump that has not materialized. If the CHIPs stay under-used through Q3, the “smart-contract BCH” narrative loses credibility, and the coin gets re-rated back to a pure payments-network valuation. That is probably $150 to $180 territory.

    2. Stablecoins Continue to Eat the Payments Use Case

    USDC and USDT settled roughly $9 trillion in 2025 and are on pace for more in 2026. Every dollar that moves as a stablecoin is a dollar that does not need BCH’s low-fee payment rail. BCH’s original thesis was “peer-to-peer electronic cash.” Ten years later, that thesis belongs to Circle and Tether.

    3. ETF Denial or Delay Wipes Out the Bid

    If the SEC punts the Grayscale BCH ETF decision to 2027 or issues a denial, the speculative positioning that has driven the last week evaporates. Historically, altcoin ETF denials produce 25-35% drawdowns in the first 48 hours. That would put BCH back under $170.

    Bitcoin Cash Price Prediction 2026: Will BCH Reclaim $500 by Year-End?

    Our hybrid AI model, which blends technical indicators (RSI, MACD, Bollinger Bands), on-chain activity, and event-conditioned probabilities for the ETF and Layla adoption, produced the following targets. All are conditional on current market structure holding. A BTC break below $55K or above $80K would materially shift these numbers.

    Bitcoin Cash (BCH) price prediction 2026 targets table, bear $150, base $340, bull $550 by end of 2026

    Short-Term: Next 30 Days

    Bear case: $185. Base case: $240. Bull case: $305. Model confidence in the base is 58%. The near-term setup favors a range trade between $210 and $260, with a break either way requiring a fresh catalyst. Watch the July 22 SEC public comment period on the Grayscale filing for the first inflection point.

    Medium-Term: 6 Months (End of 2026 Q4)

    Bear case: $170. Base case: $300. Bull case: $470. Model confidence in the base is 51%. This is the range where the ETF decision hits. A clean approval takes BCH toward the bull number quickly. A delay or denial resets to the bear.

    Long-Term: End of 2026 and Into 2027

    Bear case: $150. Base case: $340. Bull case: $550. Model confidence in the base is 47%, which is honest: 18 months out, the noise dominates. The bull case requires both ETF approval and demonstrable CashTokens usage. The bear case is the “utility pivot fails” outcome. Analyst consensus from Changelly, CoinCodex, and CryptoNews clusters around $450 to $675 for full-year 2026, higher than our base, so we are on the cautious side of the street.

    For comparison, when we ran the same model on Zcash earlier this month, the confidence structure was similar: an ETF-conditional distribution with a fat right tail. Privacy coins and payment-legacy coins are both being priced as event-driven trades.

    How Does Bitcoin Cash Compare to Litecoin?

    Bitcoin Cash and Litecoin sit in the same bucket in most portfolio managers’ minds: old-school proof-of-work coins, Bitcoin adjacent, waiting for an ETF. Here is how they line up.

    Metric Bitcoin Cash (BCH) Litecoin (LTC)
    Price $224.17 $44.23
    Market cap $4.5B $3.4B
    Max supply 21M 84M
    Consensus PoW (SHA-256) PoW (Scrypt)
    Smart contracts Yes (post-Layla) No
    MimbleWimble privacy No Yes (opt-in)
    Spot ETF status Grayscale S-3 pending Grayscale approved Q1 2026
    2026 YTD performance -45% -28%

    The takeaway: LTC is farther along on the ETF timeline and has held up better in the bear market. BCH offers more upside optionality because both the ETF and the smart-contract narrative remain unresolved. Higher risk, higher potential payoff. Neither is a slam dunk.

    What Would Change Our View

    We update the model as new information lands. Three specific triggers would move our base case:

    1. SEC issues a decision on the Grayscale BCH ETF. Approval pushes our base case to $420. Denial drops it to $210.

    2. CashTokens monthly active addresses cross 100,000. Currently around 34,000 per Bitcoin Cash Research on-chain data. A 3x growth number would validate the utility pivot and add roughly $60 to our base case.

    3. Bitcoin dominance breaks below 55%. BTC dominance sitting at 61% is the biggest headwind for high-beta altcoins like BCH. A break below 55% would flip our medium-term case bullish across the entire old-guard PoW bucket.

    Frequently Asked Questions

    Is Bitcoin Cash a good investment in 2026?

    Bitcoin Cash offers asymmetric upside for investors willing to bet on ETF approval and post-Layla developer adoption. It is not a low-risk play. Our AI model assigns roughly 51% confidence to a $300 base case by end of Q4, versus a 25% probability of new lows below $170. Anyone allocating should size it as a speculative position, not a core holding.

    Will Bitcoin Cash reach $500 in 2026?

    $500 is achievable in our bull case (roughly 30% probability) and requires two things: SEC approval of the Grayscale BCH spot ETF within the 2026 review window, and continued Bitcoin strength above $65K. Without one of those, BCH likely tops out between $340 and $400 for the year.

    What is the Bitcoin Cash Layla upgrade?

    Layla was a hard fork activated on May 15, 2026, that added four Cash Improvement Proposals (CHIPs) to the Bitcoin Cash protocol: Loops for bounded iteration, Pay to Script for standardized script outputs, Functions for reusable OP_DEFINE and OP_INVOKE, and Bitwise for restored bit-level operations. Together they enable BCH to run more complex smart contracts at sub-cent fees.

    Will a Bitcoin Cash spot ETF be approved?

    Grayscale’s S-3 filing to convert BCHG into a spot ETF entered active SEC review in late 2025. Under the CLARITY framework, we estimate base-rate approval odds around 55% within the standard 240-day window. That places the decision window in the second half of 2026.

    Is Bitcoin Cash better than Bitcoin?

    For payments, BCH offers faster confirmations and lower fees than Bitcoin. For store-of-value or institutional exposure, Bitcoin has a decade of network effects, a $1.25T market cap, and full ETF infrastructure that BCH cannot match. They serve different use cases. Most portfolios that hold BCH also hold BTC.

    The Honest Take

    Bitcoin Cash is trading like an option, not a currency. The $224 price already reflects a deeply skeptical market. Every real catalyst on the table (Grayscale ETF, Layla adoption, halving-cycle liquidity rotation) is asymmetric to the upside because so little of it is priced in.

    That said, the last eight years have taught the crypto market to discount BCH’s promises. Layla was supposed to be a game changer. So far, it has not been. The utility pivot has to actually show up in developer count, transaction volume, and CashTokens adoption for the price to sustain a break above $300. Without that, this is a coin that mean-reverts to its cost-of-mining floor, which is probably $180 in current hash rate conditions.

    Our base case is $340 by year-end 2026 with a fat right tail. The trade is not “BCH goes to the moon.” The trade is “BCH’s downside is capped by the halving-schedule floor, and it has two binary catalysts that could re-rate it 100% within six months.” If you would rather wait for the ETF decision before positioning, that is a defensible read too.

    Disclaimer: This article is for informational and educational purposes only and should not be construed as financial, investment, or trading advice. Cryptocurrency markets are highly volatile, and past performance does not guarantee future results. The price predictions and analyses presented here are based on AI models, technical indicators, and available data at the time of writing. They are not guarantees. Always conduct your own research (DYOR) and consult with a qualified financial advisor before making any investment decisions. Pump Parade and its authors do not assume liability for financial losses incurred based on information provided in this article.

    Arbitrum (ARB) Price Prediction 2026: Can ARB Reach $0.25?

    The Arbitrum (ARB) price prediction 2026 conversation has quietly become one of the most contrarian setups in crypto. ARB trades at $0.078 today, up 7.3% over the past week but still down a brutal 96.7% from its January 2024 all-time high of $2.39. On paper, this looks like a token the market has left for dead.

    Except the fundamentals don’t quite fit the price. Arbitrum One remains the largest Ethereum layer-2 by total value locked, hosting Uniswap’s largest volume venue, GMX, Radiant, Camelot, and a growing list of Real-World Asset issuers. Offchain Labs shipped Stylus (multi-language smart contracts) into production, Timeboost is live on mainnet, and the Arbitrum Orbit stack now powers dozens of app-chains.

    So which signal is right, the price or the product? This article breaks down where ARB stands today, the specific catalysts that could push it toward $0.25 (or higher) in 2026, the risks that could keep it pinned near $0.05, and honest bear, base, and bull targets by timeframe.

    Key Takeaways

    • Current setup: ARB at $0.078, market cap $499M, ranked #105, down 78% year-over-year but up 7% in the last 7 days.
    • Bull case: Arbitrum still leads L2s in TVL and DEX volume, and Stylus plus Timeboost open new revenue streams the token can eventually capture.
    • Bear case: The token has no fee accrual today, unlocks continue through 2027, and Base plus Solana are eating rollup mindshare.
    • Base target 2026: $0.15 (roughly 90% upside) if L2 volumes recover with the broader market.
    • Bull target 2026: $0.25 requires a value-accrual proposal to pass the DAO or an ETF-style catalyst.
    • What would change our view: A vote to redirect sequencer revenue to ARB holders, or a sustained TVL move above $6B.
    Arbitrum (ARB) price prediction 2026 hero graphic, current price $0.078, Stylus and Timeboost catalyst

    Where Arbitrum Stands Today

    Let’s look at the numbers before we discuss narrative. Here is the current on-chain and market snapshot for ARB, pulled from CoinGecko at time of writing.

    Metric Value
    Price (USD) $0.0784
    24-hour change +0.68%
    7-day change +7.31%
    30-day change -18.04%
    Market capitalization $498.6M
    Fully diluted valuation $783.6M
    24-hour volume $43.2M
    Circulating supply 6.36B ARB (63.6% of max)
    Max supply 10B ARB
    All-time high $2.39 (Jan 12, 2024)
    % from ATH -96.73%
    Market cap rank #105

    Two things jump out. First, the 7-day trend is finally green after eight weeks of drift, suggesting the persistent selling pressure may be easing. Second, the market cap has fallen below $500M for a top-three Ethereum layer-2 by activity. That is a valuation that would have seemed unthinkable in early 2024.

    Why is Arbitrum Down So Hard Right Now?

    Three forces have been pressing on ARB simultaneously. Understanding them is essential before we discuss upside.

    1. Continuous token unlocks. Roughly 92 million ARB unlock every month for team, investors, and the DAO treasury. In dollar terms that is only $7M at current prices, but historically the unlocks have coincided with local price weakness. The unlock schedule tapers meaningfully in 2027, but 2026 still delivers over a billion tokens to the market.

    2. Rollup competition from Base and Solana. Base, run by Coinbase, has captured mindshare with its consumer apps, and Solana has taken back the memecoin and high-frequency trading crown. Arbitrum’s response, Stylus and Orbit, targets developers and app-chains, but the mainstream retail story has moved elsewhere.

    3. No fee accrual to the token. The Arbitrum DAO earns sequencer revenue, but ARB holders do not receive any of it directly. Every quarter, another proposal to change this fails or stalls. Until that changes, ARB behaves more like a governance sticker than a productive asset, which caps how the market can value it.

    The Bull Case for Arbitrum in 2026

    Catalyst 1: Stylus and multi-language smart contracts

    Stylus lets developers write smart contracts in Rust, C, or C++, compiled to WebAssembly and executed alongside Solidity contracts. It went live on Arbitrum One in late 2024 and has been steadily accumulating deployments. This is a genuine technical moat, no other major L2 offers it.

    Why it matters for price: performance-heavy applications (order books, on-chain games, AI inference, prediction markets) can run 10x to 100x cheaper on Stylus than on Solidity. If even a handful of high-throughput apps standardize on Arbitrum in 2026, the L2’s transaction and fee base grows meaningfully.

    Catalyst 2: Timeboost and MEV recapture

    Timeboost is Arbitrum’s mechanism for auctioning off priority transaction ordering, effectively selling MEV back to the protocol. It went live on Arbitrum One in the first half of 2025 and, as of mid-2026, is generating a meaningful revenue stream. This revenue currently flows to the DAO treasury. If a governance vote redirects even 30% of it to ARB holders through buybacks or staking, the token gets a real fundamental floor.

    Catalyst 3: Arbitrum Orbit and RWA hosting

    Orbit is Arbitrum’s stack for launching custom app-chains that settle to Arbitrum One. The bet: enterprise and RWA issuers want their own compliant chain but do not want to bootstrap security. Institutions including BlackRock’s BUIDL fund, Ondo, Franklin Templeton’s BENJI, and Superstate have all deployed on Arbitrum. Every incremental Orbit chain increases settlement fees to ARB. The narrative aligns with the broader RWA thesis. For deeper context on where the money is flowing, see our Uniswap fee switch analysis, which covers the same value-accrual dynamic.

    The Bear Case for Arbitrum

    Risk 1: The value-accrual proposal keeps failing

    ARB holders have been promised sequencer revenue for over two years. Every proposal to enact it has stalled in DAO politics. If the third or fourth attempt in 2026 also fails, the market will conclude that ARB is structurally a non-productive asset. In a cycle where investors reward token-cash-flow relationships, that is a lethal narrative problem.

    Risk 2: Continued unlock overhang

    Even at $0.078, monthly unlocks add real supply pressure and signal to investors that early backers are still exiting. Any meaningful rally invites a fresh wave of distribution. The unlock does not fully complete until 2027.

    Risk 3: Base and Solana keep pulling flow

    DEX volume, active addresses, and stablecoin deposits are the three health metrics that matter for an L2. Base has closed the gap on all three, and Solana continues to dominate retail trading. If Arbitrum loses its top spot in L2 TVL or DEX volume to Base in 2026, the “leading L2” narrative disappears and so does one of the last reasons to hold ARB. Track the head-to-head on L2Beat for the current standings.

    Arbitrum Price Prediction 2026: Targets by Timeframe

    Arbitrum (ARB) price prediction 2026 targets table, bear $0.05, base $0.15, bull $0.25

    Our AI model outputs the following ranges, cross-checked against technical structure and comparable rallies in previous cycles. These are probability-weighted scenarios, not price targets we are certain of.

    Timeframe Bear Base Bull
    30 days $0.055 $0.085 $0.12
    6 months $0.05 $0.14 $0.22
    End of 2026 $0.06 $0.15 $0.25
    Long-term (2027-28) $0.10 $0.40 $0.85

    30-day outlook

    The short-term structure looks like a base attempt. Volume is compressing, funding rates on perps have neutralized, and the 7-day trend just flipped positive for the first time since April. Base case is a range trade between $0.075 and $0.10 through late July. A break above $0.10 with sustained volume opens $0.12. A break below $0.075 targets the $0.06 shelf.

    6-month outlook

    By early 2027, either a value-accrual proposal has passed or another one has failed. That single event is the swing factor. If it passes, we see $0.20 to $0.25 as achievable. If it fails, we expect a retest of $0.05 into year-end. Standard Chartered’s L2 research desk noted in June 2026 that Arbitrum trades at “roughly a 40% discount to fair value on a fee-share adjusted basis,” which frames the upside if that fee share ever materializes. On-chain fundamentals can be verified in real time through DefiLlama’s Arbitrum dashboard.

    Long-term (2027-28) outlook

    The distribution widens substantially. The bull path requires three things to line up: (1) fee accrual to holders, (2) Stylus generating measurable third-party developer traction, and (3) L2 total value locked recovering toward the $50B mark. The bear path is a token that becomes structurally irrelevant, similar to how OP has drifted since 2023. Historical analogs suggest an $0.85 tag is possible, but only in a broad-market bull scenario with the DAO delivering on value accrual.

    For a wider ETH-ecosystem context, our Ethereum price prediction for 2026 covers the Glamsterdam upgrade and how L1 execution changes cascade down to L2 economics.

    How Does Arbitrum Compare to Optimism?

    The natural benchmark for ARB is OP, its closest L2 competitor by design. Here is the head-to-head as of July 2026.

    Metric Arbitrum (ARB) Optimism (OP)
    Price (USD) $0.078 $0.85
    Market cap $499M $1.4B
    Fully diluted valuation $784M $3.6B
    MC / FDV ratio 0.64 0.39
    Total value locked $4.8B $1.6B
    Daily DEX volume $210M $45M
    Live app-chains / Superchain 52 Orbit chains 18 Superchain members
    Unlock overhang (2026) ~1.1B tokens ~430M tokens
    Sequencer revenue (annualized) ~$34M ~$11M

    On fundamentals, Arbitrum wins on TVL, DEX volume, and revenue. On market pricing, the market has valued OP at nearly triple the fully diluted valuation despite generating a third of the fees. That gap is either an OP overvaluation (bearish for OP) or an ARB mispricing (bullish for ARB). We lean toward the second interpretation but note the market can stay irrational longer than a thesis can stay solvent.

    Is Arbitrum a Good Investment in 2026?

    Here is the honest framing. If you believe (a) Ethereum wins the rollup wars, (b) the largest L2 by TVL and revenue captures the biggest share, and (c) governance eventually rewards holders, then ARB at $0.078 is asymmetric. The base case gets you to $0.15 which is 90% upside. The bull case gets you to $0.25 which is 220% upside. The downside is roughly $0.05 which is 36% risk. That’s a favorable risk-reward, on paper.

    If instead you believe that non-productive governance tokens are structurally impaired, that L2 attention is permanently rotating to Base and Solana, and that unlocks will keep suppressing price, then ARB is a value trap. Both views are defensible. The data over the next two quarters will settle the question.

    What Would Change Our View

    Three specific triggers would meaningfully shift our thesis, in either direction.

    Bullish trigger: A DAO vote passes to direct at least 30% of Timeboost or sequencer revenue to ARB holders (via buybacks, staking rewards, or fee burn). This is the single biggest catalyst. If it lands, we upgrade the end-of-2026 base case to $0.22 and the bull to $0.40.

    Bearish trigger: Arbitrum loses its top spot in L2 TVL to Base for two consecutive months, or DEX volume falls below Optimism’s for a full quarter. Either signals that mindshare has left, and we downgrade the base to $0.08 for end of 2026.

    Neutral watch: Stylus deployment count and daily Rust-contract transactions. This tells us if the technical bet is drawing real developers. Steady growth here supports the base case without accelerating the bull.

    Frequently Asked Questions

    Will Arbitrum reach $1 in 2026?

    Reaching $1 in 2026 would require a roughly 13x move from current levels. That is possible in a major crypto bull cycle combined with a successful value-accrual proposal, but our base case assigns it a low probability, roughly 8%. A more realistic bull target for 2026 is $0.25, with $1 as a stretch scenario reserved for 2027 or later.

    Is ARB a good long-term investment?

    ARB has strong fundamentals (leading L2 by TVL and revenue) but weak tokenomics (no direct fee accrual, ongoing unlocks). For long-term investors, the setup is asymmetric only if governance eventually rewards holders. If that happens, ARB at $0.078 looks cheap. If it doesn’t, ARB may drift like other non-productive governance tokens. Position accordingly.

    Why is Arbitrum going down while Ethereum recovers?

    Two reasons. First, continuous token unlocks add supply that Ethereum doesn’t face. Second, the market currently rewards tokens with clear fee-to-holder relationships, which ARB lacks. Ethereum has EIP-1559 burn plus staking rewards, ARB has neither for holders. Fix the second, and the correlation should tighten.

    What is the Arbitrum price prediction for 2030?

    Long-range predictions are speculative but useful for framing. Under a bull scenario where Arbitrum captures 25% of all L2 activity and value accrues to holders, $2 to $3 is plausible by 2030. Under a bear scenario where L2 mindshare consolidates elsewhere, $0.05 is a realistic floor. The wide range reflects genuine uncertainty about tokenomics decisions still pending.

    Is Arbitrum dead?

    No. Arbitrum One remains the largest Ethereum L2 by TVL ($4.8B), leads all L2s in DEX volume, and hosts more Orbit app-chains than any competing stack has Superchain members. The token has struggled, but the network has not. “Dead” describes the token narrative, not the protocol.

    How does Arbitrum compare to Base?

    Base is Coinbase’s L2 and has captured the consumer app narrative in 2025-26. Arbitrum still leads on TVL and DEX volume but lags Base on active addresses and daily transactions. The two are converging. If Base surpasses Arbitrum in TVL by year-end 2026, ARB’s premium narrative disappears. If Arbitrum holds the lead, the current valuation gap becomes very hard to justify.

    The Honest Take

    Arbitrum at $0.078 is what a leading L2 looks like when the market has priced out every optimistic scenario. The product is winning. The token is losing. Whether those converge or stay divorced depends almost entirely on what the DAO does in the next two quarters on value accrual.

    If you want exposure to the “Ethereum wins, biggest L2 wins” thesis and can stomach the possibility that governance never delivers, ARB at these levels has one of the cleanest asymmetric setups in mid-cap crypto. If you need a token that already generates yield or has a clear buyback engine, look at Chainlink or wait for the ARB governance vote before entering. The next 90 days should tell us which path we are on.

    Disclaimer: This article is for informational and educational purposes only and should not be construed as financial, investment, or trading advice. Cryptocurrency markets are highly volatile, and past performance does not guarantee future results. The price predictions and analyses presented here are based on AI models, technical indicators, and available data at the time of writing, they are not guarantees. Always conduct your own research (DYOR) and consult with a qualified financial advisor before making any investment decisions. Pump Parade and its authors do not assume liability for financial losses incurred based on information provided in this article.

    Kamino vs marginfi: Best Solana Lending Protocol 2026

    0

    If you want to lend or borrow on Solana in 2026, two protocols keep coming up: Kamino and marginfi. Both are non-custodial. Both let you deposit tokens for yield, use those tokens as collateral, and borrow against them. Both are Solana-native. But the gap between them, in size, in product strategy, and in fee philosophy, is now huge. This is a head-to-head comparison of Kamino versus marginfi, updated for mid-2026, so you can pick the one that actually fits how you use DeFi.

    Quick verdict: which one wins?

    The short answer for most users: Kamino. It has roughly 31x the TVL, a broader product suite that now includes curated lending vaults, leverage, and concentrated liquidity, and deeper reserve depth for large positions in USDC, SOL, and JLP. If you are just here to earn yield on stablecoins or borrow against SOL without thinking too much, Kamino is the safer default in 2026.

    marginfi still wins for a specific slice of user: traders who want simple, transparent spread-fee lending markets, native support for staked collateral, and a snappy progressive web app they can use like a mobile app. Loyalists also point to its permissionless, opinion-free bank design as a feature, not a bug. If you value protocol minimalism over TVL, marginfi is not a wrong answer.

    The rest of this review breaks down exactly how the two compare on fees, features, security, and real-world UX so you can decide with numbers instead of vibes.

    Kamino vs marginfi feature comparison table

    Kamino overview

    Kamino Solana DeFi protocol product banner
    Kamino product banner. Source: kamino.com

    Kamino started as a concentrated liquidity manager on Orca and Raydium, and has grown into what its team calls a full credit and liquidity suite on Solana. Today the protocol splits into four main products:

    • K-Lend, its peer-to-pool borrow and lend primitive, which currently holds around $1.08 billion in TVL according to DeFiLlama.
    • Lending Vaults, single-token yield aggregators where a curator allocates deposits across K-Lend reserves so users earn without picking markets themselves.
    • Multiply, one-click leveraged positions on assets like JLP, LST pairs, and staked SOL.
    • Liquidity, its automated concentrated liquidity strategies on Solana DEXs, which sit around $115 million in TVL.

    Aggregated across all products, Kamino carries about $1.19 billion in TVL in mid-2026, which makes it one of the largest DeFi apps on Solana by any measure. Its curator roster now includes credible risk managers such as Gauntlet, Steakhouse Financial, Allez Labs, Rockaway, and Sentora, which is a meaningful signal for anyone worried about parameter risk in a lending market.

    If you have already read our earlier Kamino Finance review from April 2026, most of that still applies. The big change since then is the further build-out of Lending Vaults and the growing importance of third-party curators as a first-class part of the product.

    marginfi overview

    marginfi Solana lending protocol banner
    marginfi product banner. Source: marginfi.com

    marginfi is a pure play on Solana lending. The core product, mrgnlend, is a straightforward pool-based borrow and lend protocol. Deposit a supported asset into a bank, earn yield, and borrow against your position as long as your account stays healthy. The whole app is designed to feel like a broker terminal for on-chain credit.

    On top of mrgnlend, marginfi has shipped a few notable extensions over the last year:

    • mrgnloop, an interest-rate arbitrage tool that lets users loop deposits and borrows across banks with one click.
    • Staked Collateral, which lets users borrow directly against native SOL stake accounts without unstaking.
    • e-mode, higher LTVs when a user borrows correlated assets against similar collateral (for example, borrowing USDC against USDT).
    • LST, marginfi’s own liquid staking token, still supported as collateral in the app.
    • Progressive Web App, meaning users can install marginfi to their phone home screen and get a near-native mobile experience.

    The reality on TVL is less flattering. DeFiLlama shows marginfi holding roughly $38 million in TVL in mid-2026, which is a fraction of where it peaked in earlier cycles. The team has explicitly leaned into being a leaner, more focused protocol with an emphasis on the developer liquidity layer, in-house risk engine, and permissionless bank design.

    Kamino vs marginfi TVL over the last 12 months

    Head-to-head: features and product depth

    Kamino has the wider product surface. In one interface, users can lend, borrow, run leveraged positions, and deposit into curated vaults, all while staying in Solana native assets. That breadth makes Kamino more of a one-stop DeFi hub, which is exactly how the team pitches it in the Kamino docs.

    marginfi is deliberately narrower. Its whole thesis is that lending should be modular, transparent, and permissionless. That is why the app is organized around banks (per asset) rather than sprawling multi-asset dashboards, and why so many features (mrgnloop, LST, staked collateral) revolve around better ways to move capital through those banks. The tradeoff is fewer product options for users who want structured yield with less mental overhead.

    For sophisticated users, marginfi’s staked collateral and e-mode are genuinely strong. Being able to borrow stablecoins against a native SOL stake account, without giving up the staking yield, is a nice piece of DeFi mechanics. Kamino has its own leveraged staking products through Multiply, but the staked collateral flow on marginfi feels more purpose-built.

    Fees compared

    The fee models on Kamino and marginfi are meaningfully different, and this is one of the most important sections of any lending review.

    marginfi uses a simple interest rate spread fee. According to the official marginfi docs, the protocol takes 12.5% of the interest rate spread on USDC, USDT, and SOL, and 13.5% on every other asset. So if borrowers are paying 10% APY and lenders receive 8%, marginfi captures 12.5% of that 2% spread. On liquidations, borrowers pay a 5% fee that is split between the liquidator and the bank’s insurance fund. There are no fees at deposit.

    Kamino is more nuanced because of its Lending Vaults architecture. K-Lend itself uses reserve-specific interest rate curves and no upfront deposit fees. On Lending Vaults, curators can charge a performance fee (a percentage of vault profits), an AUM fee (an annual percentage of vault assets), and a withdrawal penalty that is returned to the vault rather than to the curator. Depositors do not pay a performance fee on a loss, and the withdrawal penalty is a design choice meant to discourage hit-and-run yield farming, per the Kamino Curators & Fees docs.

    In practice, if you deposit directly into K-Lend reserves, Kamino can feel cheaper on the surface than marginfi. If you deposit into a curated vault, you are paying for active management, and net APYs can still be very competitive because curators rotate capital into higher-utilization reserves.

    Security and audits

    Both protocols run in production with meaningful on-chain audit history, but the depth of coverage differs.

    Kamino has published audits from firms including OtterSec and Offside Labs, plus a public risk dashboard at risk.kamino.finance. Reserves are governed by Squads multisigs, and market curators can further restrict allocations via a whitelisted reserves feature that hard-codes which markets they are allowed to enter. The Insurance Pool mechanic, in which curators lock their own capital with a cooldown period, is one of the stronger skin-in-the-game features in Solana DeFi.

    marginfi has audits on its v2 program and an in-house end-to-end risk engine that continuously monitors bank health, plus a network of in-house and third-party liquidators. The protocol has been running mrgnlend for multiple years without a critical loss-of-funds event, which is meaningful in itself. That said, some coverage is less publicly indexed than Kamino’s, and the protocol’s smaller TVL means less economic security around individual banks in absolute terms.

    Neither protocol is risk-free. Oracle failures, extreme market conditions, and smart-contract bugs are always possible. Anyone using either should size positions accordingly and stay away from illiquid, thin banks or reserves.

    User experience

    Kamino’s app is dense but organized. Everything (Earn, Borrow, Multiply, Swap) lives under one navigation, and vault pages show clear historical APY, allocation breakdowns, and curator identity. On mobile, the responsive web app is usable but not always optimized for one-thumb operation.

    marginfi feels lighter. Banks and health factor are the two things you see, and mrgnloop is one of the cleanest looping UIs on Solana. The Progressive Web App means you can install the app to your home screen and get push-style access without a separate mobile build. For users who want a lean, keyboard-friendly on-chain lending experience, this really does matter.

    Pros and cons

    Kamino: pros

    • By far the largest Solana lending protocol by TVL, with roughly $1.19 billion aggregated in mid-2026.
    • Wide product suite: K-Lend, Lending Vaults, Multiply, Liquidity, all under one roof.
    • Curator-driven vaults offer passive, actively-managed yield without needing to pick markets.
    • Serious risk partners like Gauntlet, Steakhouse Financial, and Allez Labs actively curate vaults.
    • Insurance Pool and Whitelisted Reserves give depositors on-chain guarantees.

    Kamino: cons

    • More surface area means more things to understand before your first deposit.
    • Curator fees on Lending Vaults can eat into net APY if you do not compare vaults carefully.
    • Some Multiply strategies use volatile assets and can liquidate quickly in fast markets.

    marginfi: pros

    • Very simple, transparent fee model based on interest rate spread.
    • Excellent Progressive Web App and mobile UX.
    • Native support for staked collateral, so you can borrow without giving up SOL staking yield.
    • e-mode allows higher LTVs for correlated asset pairs, which is efficient for stablecoin traders.
    • Focused, minimalist product design with fewer moving parts to break.

    marginfi: cons

    • TVL is now a small fraction of Kamino’s, which means less market depth for large borrows.
    • Fewer structured products for passive users who do not want to manage positions.
    • Less publicly showcased audit and risk dashboarding compared to Kamino.

    When to use Kamino

    Use Kamino if you want the deepest liquidity on Solana lending, if you want passive vault-based yield with a real curator behind it, or if you plan to leverage staked SOL, JLP, or LSTs through Multiply. It is also the better choice for larger deposits, because reserve depth matters a lot once you get into six-figure positions.

    When to use marginfi

    Use marginfi if you value protocol minimalism, if you want a snappy Progressive Web App experience on your phone, or if your workflow revolves around looping stablecoins with e-mode. It is also a good choice for staked SOL holders who want a clean way to borrow against a native stake account.

    Rating

    Kamino: 4.7 out of 5. The best all-around Solana lending protocol in 2026, held back only by product-surface complexity that can overwhelm new users.

    marginfi: 4.0 out of 5. A focused, well-executed lending protocol that has been out-scaled by Kamino but remains one of the cleanest UX experiences in Solana DeFi.

    FAQ

    Is Kamino safer than marginfi?

    Both protocols have audit histories and active liquidator networks. Kamino has larger absolute TVL, more curator-provided risk parameters, and a public risk dashboard, so it has more visible risk infrastructure. marginfi has fewer moving parts, which is a form of safety in itself, but smaller economic security around individual banks.

    Which one has better APY?

    APYs are market-driven and change constantly. On stablecoins, both protocols typically sit within a few percentage points of each other. Kamino curated vaults can outperform static single-bank positions if a curator is actively rotating capital, but they charge for it.

    Can I use both at the same time?

    Yes. Many Solana DeFi users split capital between Kamino and marginfi to diversify smart-contract risk and to capture the best rates on specific assets. Since both are non-custodial and connect via wallets like Phantom and Backpack, moving between them is straightforward.

    Do Kamino or marginfi have their own tokens?

    Kamino has KMNO, its governance and incentive token, which is used across vault incentives and staking. marginfi has run points and incentive programs and has communicated plans around a token in past cycles, but users should always check the official channels for the current state before making assumptions.

    Which is better for beginners?

    For most new users, Kamino Lending Vaults on USDC or SOL are the easiest starting point. Pick a reputable curator, deposit, and let auto-compounding do the rest. marginfi’s mrgnlend is also beginner-friendly, but the smaller pool sizes and lack of curated vaults mean users need to think more about which single bank to use.

    Final take

    Kamino has won the Solana lending race in 2026 by a wide margin. It is bigger, deeper, and more composable than any of its peers, including marginfi. But marginfi is still a legitimate second option, especially for users who value focused product design and staked collateral. For a broader DeFi context, we also recommend our Aave 2026 review and Marinade vs Jito comparison as adjacent reading, since staking and lending increasingly compose together on Solana.

    Nothing in this article is financial advice. DeFi protocols carry smart-contract, oracle, and market risks. Always do your own research before depositing funds.