

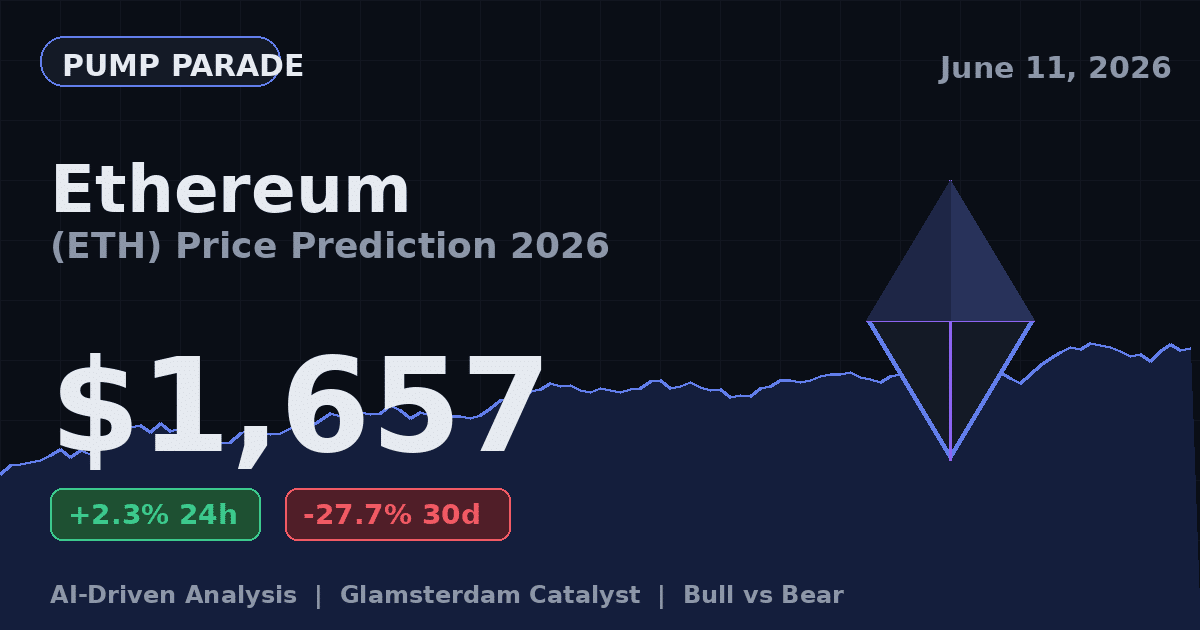
Ethereum is trading at $1,657 at time of writing. That price tells two stories at once. The bullish read: ETH is up 2.3% on the day and finally finding bids near a multi-year support shelf. The bearish read: it is down 27.7% in the last 30 days and sits 66.5% below its August 2025 all-time high of $4,946.
Most price prediction posts skip the second sentence. We are not going to do that. ETH has had a brutal cycle relative to BTC, and any honest 2026 forecast has to start there.
The setup matters because the next four months are loaded. The Glamsterdam upgrade is moving through devnet. Spot ETH ETFs are still in net outflow mode, but staked-ETF products from BlackRock are quietly building AUM. Around 30% of ETH supply is now locked in validators. So the question is not whether things are bad. They are. The question is whether the fundamentals catching up to the price will create the next leg, or whether ETH spends another six months range-bound below $2,000.
Let us look at the numbers.
Ethereum Price Today: A Quick Snapshot
Here is the on-chain and market picture as of June 11, 2026:
- Price: $1,657 (per CoinGecko)
- 24h change: +2.3%
- 7d change: -6.5%
- 30d change: -27.7%
- 1y change: -40.2%
- Market cap: ~$200 billion
- 24h volume: ~$12.1 billion
- Circulating supply: 120.7 million ETH
- All-time high: $4,946 (Aug 24, 2025)
ETH is the second-largest crypto by market cap. That position is not in danger, but the gap to Bitcoin has widened sharply. BTC dominance recently pushed above 58%. That is the highest reading since early 2021. For ETH bulls, a turn in that dominance chart is the single most important variable to watch.
For a related read on where Bitcoin sits in this cycle, see our Bitcoin price prediction with the Reserve catalyst.
Why ETH Has Been Underperforming
Three things have driven the drawdown.
First, ETF flows reversed. U.S. spot Ethereum ETFs have pulled in roughly $11.6 billion in cumulative net inflows since launch. But the recent flow tape has flipped. Weekly outflows hit around $241 million in early June. That is not catastrophic in dollar terms, but it changes the marginal bid story.
Second, L2 scaling cannibalized fees. Layer-2 rollups now do most of the work that used to drive base-layer fee burn. That made the network cheaper to use, which is good for users. It also made ETH less deflationary, which is bad for the simple “ultrasound money” thesis. The math is what it is.
Third, macro pressure. A risk-off rotation hit altcoins harder than BTC. ETH wears that rotation more than other large caps because it sits at the top of the L1/L2 stack. When traders de-risk, they often sell ETH first to keep BTC exposure.
The bear case is real. So is the catalyst stack on the other side.
The Glamsterdam Catalyst
Glamsterdam is Ethereum’s next hard fork. It is currently targeting mainnet activation in Q3 2026, with public testnet activations on Holesky and Sepolia in the months before. Developers have stressed the date can slip if testnet validation runs into issues. As of April 2026 the Ethereum Foundation was transitioning to Devnet-5 after testing three of the headline EIPs on Devnet-4.
Two upgrades carry most of the weight.
EIP-7732 (Enshrined Proposer-Builder Separation, or ePBS) moves block-building into the protocol itself. In plain terms, it makes the validator job simpler and reduces the leverage that specialist builders have over MEV (the value extracted from ordering transactions). If ePBS lands cleanly, solo staking gets more competitive with the big pools. That is good for decentralization, and arguably good for the long-term valuation case.
EIP-7928 (Block-Level Access Lists) makes blocks easier for nodes to process in parallel. The intent is a faster effective slot time and lower confirmation latency. Think of it as a behind-the-scenes performance patch that lets the chain handle more without a hard gas-limit bump.
Neither of these is a clean meme catalyst. They are infrastructure changes that institutional stakers care about deeply and that retail traders mostly ignore until the price moves. That is exactly the kind of setup our AI model tends to underweight in the short term and overweight in the medium term.
Technical Analysis: Levels That Matter
Three levels are doing the heavy lifting right now.
Support at $1,500 to $1,550. This zone has held three retests since late April. A clean break below it opens up the $1,250 area, which is the next high-volume node on the historical profile.
Pivot at $1,800. Reclaiming this level on a daily close would put the 50-day moving average back in play. RSI (Relative Strength Index) on the daily is at 38, which is the upper end of the oversold zone. A push above $1,800 would likely flip momentum scoring positive on most standard models.
Resistance at $2,150 to $2,200. This is the heaviest resistance shelf on the chart. It sits at the 200-day moving average and the underside of the channel that broke down in March. ETH has rejected from this band twice. A third test on rising volume is the level to watch.
For traders, the framework is straightforward. Above $1,800 on a daily close, the bias shifts to neutral. Above $2,200 on rising volume, the bias shifts to bullish. Below $1,500, the structure breaks and bear targets activate.
The Bull Case for ETH
Here is what has to go right for the upside scenario.
- Glamsterdam lands on schedule. A clean Q3 activation shifts narrative back to L1 fundamentals. Historically, post-upgrade ETH has outperformed BTC by 8% to 14% in the 60 days after merge events.
- ETF flows turn. A reversal from net outflow to net inflow of even $200 million per week is enough to absorb most spot supply at current prices.
- Staking yield narrative. BlackRock’s ETHB and similar staked ETH products distribute roughly 82% of staking rewards to investors. As tradfi yields compress, a 2% to 4% on-chain yield with optional staking exposure becomes more attractive.
- BTC dominance peaks. A roll-over from the 58%+ dominance zone has historically triggered an altcoin rotation. ETH is the natural first stop.
If three of these four play out, the path back to $3,000 by year-end is on the table. A stretch case puts ETH at $3,500 to $4,000 if ETF flows accelerate alongside a confirmed Glamsterdam activation.
The Bear Case for ETH
The flip side is just as concrete.
- Glamsterdam slips into 2027. If devnet issues push activation past Q4 2026, the catalyst stack thins out. ETH risks another six months of grind.
- ETF outflows accelerate. A sustained $400M+ weekly outflow tape would likely break the $1,500 support and target the $1,250 area.
- L1 narrative shifts to Solana or modular chains. Capital chasing fee revenue is increasingly going to alt-L1s. If that flow does not reverse, ETH’s relative dominance keeps slipping.
- Macro deterioration. A risk-off shock would hit ETH harder than BTC. The 0.85+ correlation to NASDAQ tech has not gone away.
The downside scenario is not a vaporization. It is a slow grind to $1,200 and a longer wait for the next leg. Painful, but not terminal.
ETH Price Prediction 2026 to 2028
Our hybrid AI model blends technical signals, on-chain flows, ETF flow data, staking participation, and macro proxies. Here is what it currently outputs across three time horizons. These are probability-weighted ranges, not single-point forecasts.
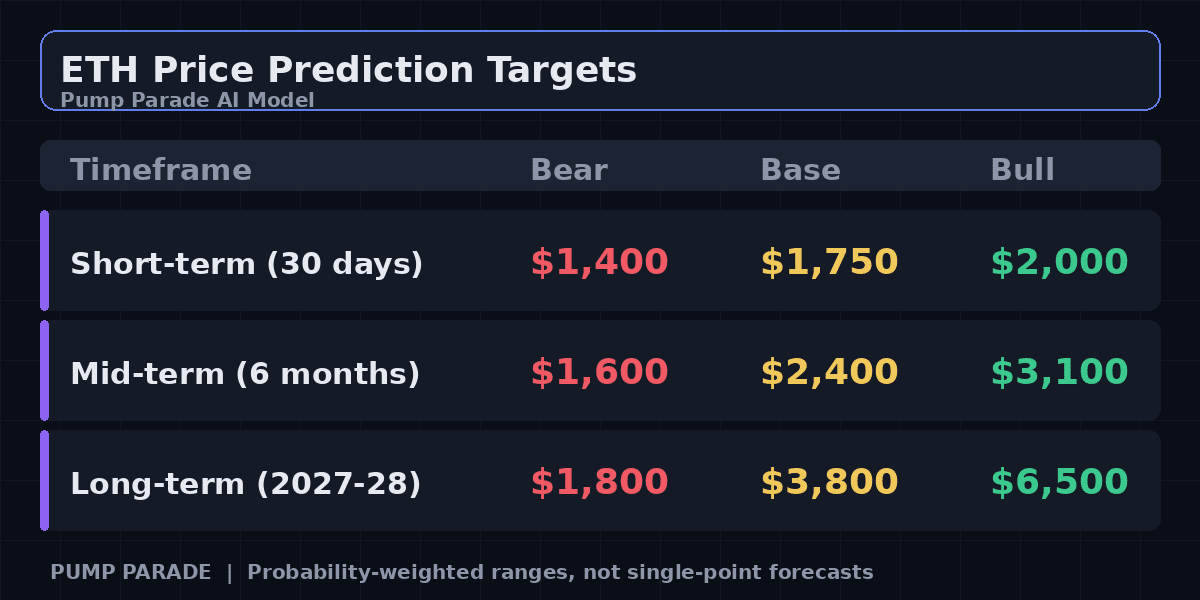
- Short-term (30 days): Bear $1,400 / Base $1,750 / Bull $2,000. The base case assumes ETF outflows stabilize and ETH holds the $1,550 support.
- Mid-term (6 months): Bear $1,600 / Base $2,400 / Bull $3,100. The base case assumes Glamsterdam activates on schedule and BTC dominance rolls over.
- Long-term (2027-2028): Bear $1,800 / Base $3,800 / Bull $6,500. The base case assumes Glamsterdam delivers on staking and L1 economics, and ETF AUM crosses $25 billion.
The model assigns a 58% probability to a $2,400 to $3,100 print at some point in the next six months. That is a meaningful tilt, but it is not a layup. A 22% probability sits on the bear path.
For independent reference on macro and on-chain data, the CoinGecko Ethereum page tracks the live numbers our model ingests.
What to Watch in the Next 90 Days
Three specific signals will tell you which scenario is playing out.
- Holesky and Sepolia activations. If both testnets activate Glamsterdam cleanly by mid-July, the Q3 mainnet date is on track. Slippage on either pushes the catalyst.
- ETF weekly flow tape. Watch for two consecutive weeks of positive net inflows. That has historically been the inflection point.
- BTC dominance. A daily close below 56% would be the cleanest signal that altcoin rotation has started.
You do not need to predict the outcome. You need to know which signal flips first.
Bottom Line
ETH at $1,657 is a setup with real risk and a real catalyst stack. The 67% drawdown from ATH is severe, but the Glamsterdam upgrade and the staked-ETF flywheel are both still developing. The probability favors a recovery toward $2,400 to $3,100 within six months, but the bear path to $1,250 is live until ETH reclaims $1,800 on a daily close.
The smart move is not to call a single target. It is to size around the signals above and let the chart tell you when the regime has changed.
Disclaimer: This article is for informational and educational purposes only and should not be construed as financial, investment, or trading advice. Cryptocurrency markets are highly volatile, and past performance does not guarantee future results. The price predictions and analyses presented here are based on AI models, technical indicators, and available data at the time of writing, they are not guarantees. Always conduct your own research (DYOR) and consult with a qualified financial advisor before making any investment decisions. Pump Parade and its authors do not assume liability for financial losses incurred based on information provided in this article.
