More
    Home Blog Page 13

    Aptos (APT) Price Prediction 2026: Can APT Hit $1?

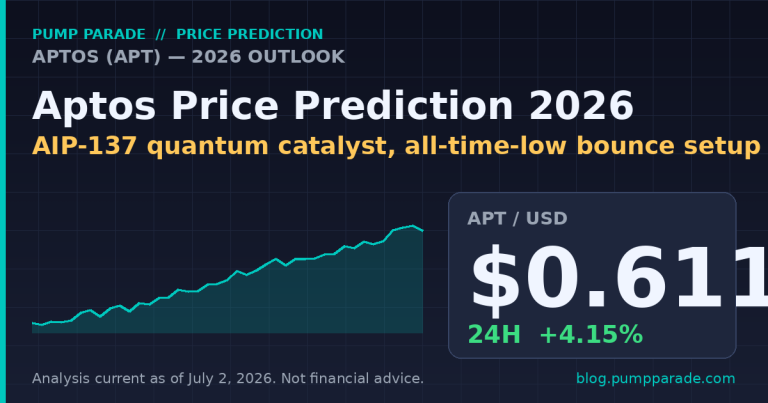
    Our Aptos price prediction 2026 opens with an uncomfortable fact. APT is trading at $0.611 as of July 2, 2026, a fresh all-time low set just 48 hours ago on June 30. It caps a brutal stretch: down 32% over the last 30 days, down 87% year-over-year, and off 97% from the January 2023 all-time high of $19.92.

    Yet on-chain, a different story is unfolding. Aptos DeFi total value locked climbed from under $275 million in mid-2025 to roughly $680 million by early 2026. Aptos Labs published AIP-137, a post-quantum signature proposal that would put the chain ahead of every top-20 layer-1 on a threat vector regulators are starting to ask about. Institutional partners keep signing on.

    So which signal wins in 2026: the broken chart, or the improving fundamentals? Below, we break down the bull case, the bear case, and the exact levels that flip the trade.

    Key Takeaways

    • APT at $0.611 printed a fresh all-time low on June 30, 2026, off 97% from its $19.92 peak set in January 2023.
    • The catalyst mix is real: AIP-137 quantum-resistant signatures, the pending Shardines scaling upgrade, and DeFi TVL growth from $275M to $680M year-over-year.
    • Base case for 2026: $0.90 to $1.20, contingent on a broader altcoin bid and AIP-137 progressing to mainnet.
    • Bull case: $2.00 to $3.50 if TVL clears $1 billion and post-quantum tech becomes a compliance narrative.
    • Bear case: $0.35 to $0.50 if unlocks continue to hit weak bids and Move-based chains remain outside the ETF conversation.
    • Key risk: APT ranks 103 by market cap. Volume of $47M per 24 hours is thin. Recovery needs a liquidity catalyst, not just a story.
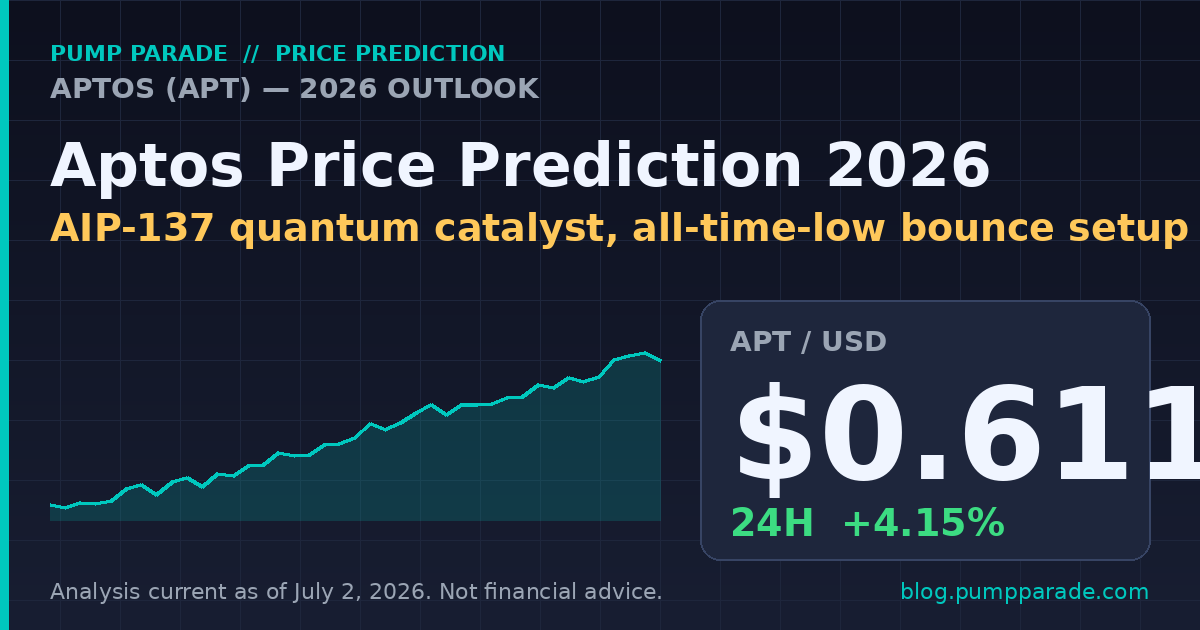
    Aptos (APT) price prediction 2026 hero graphic showing current price $0.611 and AIP-137 quantum catalyst hook

    Where Aptos Stands Today

    Here is the snapshot at time of writing, pulled from CoinGecko and cross-checked against on-chain data.

    Metric Value
    Price (USD) $0.611
    24-hour change +4.15%
    7-day change -3.61%
    30-day change -32.22%
    Market cap $509 million
    Fully diluted valuation $737 million
    24-hour volume $46.9 million
    Market cap rank 103
    All-time high $19.92 (Jan 26, 2023)
    % from ATH -96.9%
    All-time low $0.556 (Jun 30, 2026)
    Circulating supply 832.7M APT
    Total supply 1.20B APT

    The chart reads as textbook capitulation. APT bled through the $1 psychological floor in early June, cracked $0.70 mid-month, and printed its all-time low of $0.556 on June 30. The 4% bounce over the last 24 hours is a start, not a trend. RSI on the daily is climbing off oversold territory, but weekly momentum remains bearish. For a rally to have legs, APT needs to reclaim $0.75, then $0.95, then $1.20 in that order.

    Why is Aptos dropping so hard in 2026?

    Three forces are compounding.

    First, capital rotation. Solana pulled the majority of altcoin liquidity through the Alpenglow narrative and Firedancer client rollout. Move-based chains, especially the ones without a live memecoin economy, got left behind. Aptos does not have a Pump.fun equivalent driving retail attention.

    Second, unlocks against thin demand. Aptos has 832.7 million tokens circulating out of a 1.20 billion total supply. That is another 372 million APT still to enter float, worth roughly $227 million at current prices. In a strong tape, that dilution is absorbed. In this tape, it caps every bounce.

    Third, ETF fatigue at rank 103. The 2026 altcoin ETF conversation has focused on top-20 names: Solana, XRP, Litecoin, and Dogecoin. APT is not in that conversation. For a discretionary allocator, there is no obvious catalyst to buy the bottom, so the bottom keeps stretching.

    The Bull Case for APT

    AIP-137: The Quantum Story No Rival Is Telling

    Aptos Labs published AIP-137 on December 18, 2025. The proposal introduces optional post-quantum SLH-DSA signatures using NIST-approved lattice cryptography. If it ships to mainnet in 2026, Aptos becomes one of the first functional layer-1s to offer native post-quantum account protection.

    Why does this matter beyond talking points? Because when institutional capital eventually looks past Bitcoin and Ethereum for L1 exposure, compliance and long-term security become filters. “Which chain will still be secure in 15 years?” is a question a chief risk officer at a pension fund can actually ask. Aptos is one of very few top-100 chains with a credible answer today.

    The signature verification tradeoff is real. SLH-DSA verification runs roughly 4.8x slower than Ed25519, and signature sizes are about 82 times larger. But because the upgrade is optional, high-throughput apps can keep Ed25519 while institutional custodians opt into quantum resistance. That optionality is the point.

    DeFi Momentum: TVL More Than Doubled

    Aptos DeFi TVL climbed from roughly $275 million in mid-2025 to about $680 million by early 2026. That is a 147% increase against a bear tape for the token. Most of the growth is real: Thala, Amnis Finance, and Echelon Market have posted user counts and lending volume that align with the TVL move rather than manufacture it.

    If TVL clears $1 billion in 2026, APT starts looking undervalued on price-to-TVL. That is a metric quant funds and long-only crypto allocators do pay attention to when sizing L1 basket positions.

    Institutional Rails, Real Ones

    Aptos has integrations with Franklin Templeton (BENJI on Aptos), Bitwise, and Stripe. These are not announcements from 2022. They are live products moving tokenized dollars on-chain. If the tokenized real-world-asset narrative that pulled Ondo higher this cycle extends to L1 infrastructure plays, Aptos is on the shortlist.

    The Bear Case for APT

    Unlocks Meet a Thin Order Book

    APT has 372 million tokens still to unlock. At current prices, that is $227 million of supply hitting a market with $47 million in daily volume. The ratio is ugly. Even paced correctly, unlocks demand consistent net inflows to absorb. Without them, every unlock is a step lower.

    The Move Language Bet Is Not Working Yet

    The pitch for Aptos and Sui was that Move is a safer, more capital-friendly smart contract language than Solidity. That may be true technically. It is not true economically so far. Solana, an EVM-adjacent chain, ate their lunch in DeFi, memecoins, and retail attention. Move has not delivered the killer app the thesis needs.

    Rank 103 Is a Real Problem

    There is no coming back from rank 103 without a top-30 return. Retail-driven altcoin cycles reliably lift the top 20. They only sometimes lift 50 to 100. If the 2026 cycle turns risk-on but skips small-cap L1s, APT can grind between $0.50 and $0.80 for another year.

    What is the Aptos price prediction for 2026 by timeframe?
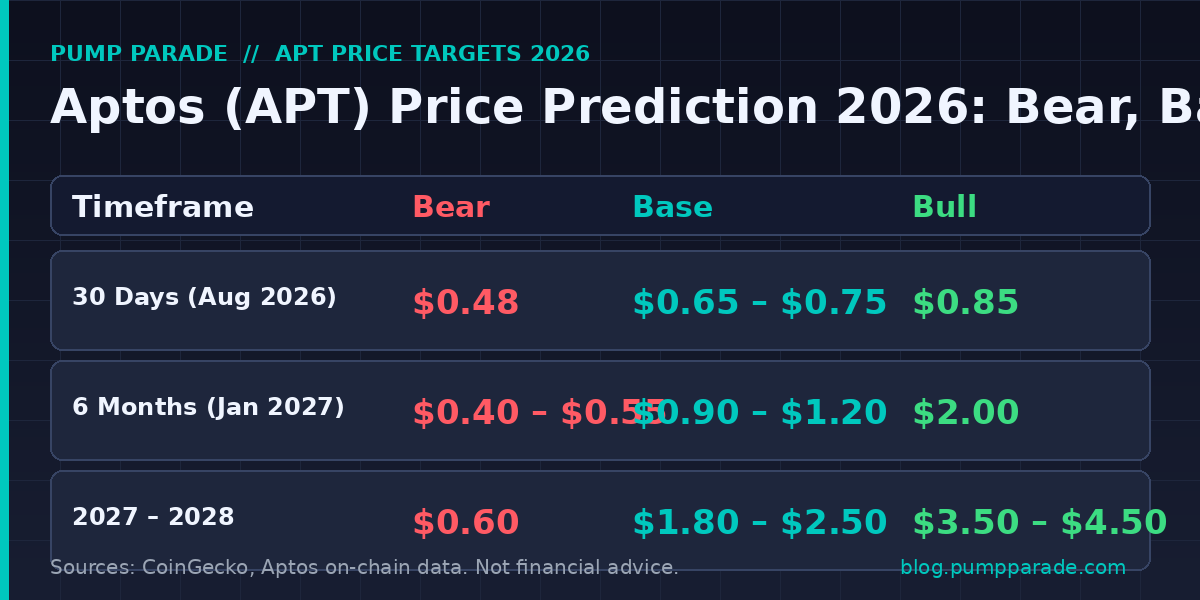
    Aptos (APT) price prediction 2026 targets table showing bear $0.40, base $1.05, bull $2.00 scenarios by timeframe

    Here is how the Aptos price prediction 2026 breaks down across timeframes.

    30-Day Outlook (through August 1, 2026)

    • Bear: $0.48. A test of the $0.556 all-time low fails and APT drops another leg.
    • Base: $0.65 to $0.75. Mean reversion off oversold conditions, capped by the July unlock.
    • Bull: $0.85. A broad altcoin bid combined with AIP-137 vote signaling pulls APT back to the June breakdown level.

    6-Month Outlook (through January 2027)

    • Bear: $0.40 to $0.55. The 2026 cycle high has been set and altcoin liquidity dries up into year-end.
    • Base: $0.90 to $1.20. AIP-137 progress plus TVL past $850M reprices APT closer to peers.
    • Bull: $2.00. AIP-137 ships, Shardines lands, and a top-five issuer files an Aptos ETF, mirroring the setup that revived Litecoin post-ETF talk.

    2027 to 2028 Long-Term

    • Bear: $0.60. Aptos survives but never regains its top-30 status.
    • Base: $1.80 to $2.50. Post-quantum story matures, DeFi TVL sustains above $1.5B, and Aptos re-enters the top 40.
    • Bull: $3.50 to $4.50. Move-based L1s find their killer app, institutional custody defaults to quantum-resistant chains, and APT retraces to its 2023 breakout zone.

    For reference, CoinCodex’s 2026 model puts APT in a $0.48 to $0.63 range, while Changelly leans more bullish at $1.20 to $4.50. Our base case sits between the two, which is where we usually want to be when analyst dispersion is this wide. When forecasts stretch from bearish to euphoric on the same asset, the middle is often the most defensible read.

    How does Aptos compare to Sui (SUI)?

    Both chains launched with the same pitch: Move language, parallel execution, sub-second finality, largely the same investor cohort. Two years in, the divergence is telling.

    Metric Aptos (APT) Sui (SUI)
    Price $0.611 $0.735
    Market cap $509M $2.98B
    Market cap rank 103 31
    % from ATH -96.9% -86.3%
    Circulating / Total supply 832M / 1.2B (69%) 4.05B / 10B (41%)
    DeFi TVL ~$680M ~$2.0B
    Flagship 2026 catalyst AIP-137 quantum signatures Mysticeti V2 consensus
    Institutional partners Franklin Templeton, Bitwise Stripe (Bridge), USDsui

    The read: Sui has out-executed on ecosystem growth and captured six times the market cap. But APT is trading at a 5.9x discount to Sui on market cap while sitting on a supply schedule that is 40 percentage points further along, meaning less dilution ahead. If you believe Move-based chains are undervalued as a category, APT is the higher-beta expression of that view. For the full picture on the other side of the trade, see our Sui price prediction 2026 analysis.

    What would change our view on APT?

    Three scenarios would move us from base to bull.

    1. AIP-137 gets an on-chain vote date and passes with over 66% approval. That signals institutional-grade infrastructure is landing, not just being pitched.
    2. TVL crosses $1 billion and holds for 30 days. The last time an L1 rerated on that trigger, it doubled in six weeks.
    3. Any credible Aptos ETF filing from a top-five issuer, in line with the broader altcoin ETF wave that lifted Litecoin and Dogecoin earlier in 2026.

    And two that would tip us bearish.

    1. APT loses $0.50 on a weekly close. Below the all-time low with volume, and the next real support does not appear until $0.35.
    2. TVL rolls over below $500 million. That would signal capital is leaving DeFi apps on Aptos, undercutting the core bull thesis.

    Frequently Asked Questions

    Can Aptos reach $1 in 2026?

    Yes, but it needs help. From $0.611, APT reaching $1 requires roughly 64% upside. That is achievable on a normal altcoin cycle bounce, and our base case for the 6-month window puts APT in the $0.90 to $1.20 range. The catalyst we would need to see: AIP-137 progressing to a vote and TVL sustaining above $850M into Q4 2026.

    Is Aptos a good investment in 2026?

    APT is a high-risk, high-upside layer-1 bet at rank 103 with a clean catalyst mix and a broken chart. If your thesis is Move-based L1s eventually rerate as institutional infrastructure, APT is the leveraged expression of that view. If you need liquidity and dominant network effects today, Solana or Ethereum are safer bets. Position size accordingly and do not confuse conviction with concentration.

    What is AIP-137 and why does it matter for the APT price?

    AIP-137 is an Aptos improvement proposal that adds optional post-quantum signature support using NIST-approved SLH-DSA cryptography. It matters for the token because it gives Aptos a differentiated compliance story that no top-100 rival is telling. If institutions start filtering L1s by long-term security posture in 2026, Aptos is one of the only chains that clears the bar today.

    Is APT better than SUI?

    Sui has out-executed Aptos on ecosystem growth, TVL, and institutional partnerships to date. But APT trades at a nearly six times lower market cap and offers exposure to the same Move-based thesis with less dilution ahead. If you own one, you probably own it for different reasons. Sui for the growth narrative, APT for the value plus catalyst setup.

    Why is Aptos down 97% from its all-time high?

    Aptos peaked at $19.92 in January 2023 during the post-FTX bounce, then endured two years of altcoin bear market conditions, heavy token unlocks, and capital rotation into Solana’s ecosystem. Unlike Bitcoin and Ethereum, Aptos never developed a defining retail application or memecoin economy, which capped attention and price throughout 2024 and 2025.

    When is the next Aptos token unlock?

    Aptos unlocks tokens monthly. The next scheduled unlock is in the first week of July 2026, releasing roughly 11 million APT into circulation. At current prices that is around $6.7 million in supply pressure. Over the next 12 months, approximately 130 million APT will unlock, worth around $80 million at spot prices.

    The Honest Take

    APT is where you go if you are looking for asymmetric exposure to a Move-based L1 thesis in 2026. The setup is genuine. AIP-137 is a real differentiator. TVL growth is measurable. The all-time low print on June 30 suggests capitulation is largely done.

    But everything about this trade requires patience. The unlock schedule is unforgiving. Volume is thin. Rank 103 tokens do not run 5x on nothing. Any move higher will be volatile and will need real catalysts, not vibes.

    If we had to plant a flag, we would. Our base case is that Aptos ends 2026 between $0.90 and $1.30. That is not a moonshot. It is a rerating to something like fair value if the catalyst mix lands even partially. The risk-reward from $0.611 favors the setup. The risk from $0.611 is that you are wrong on the direction of Move-based L1s as a category, in which case another year of grinding is the base case.

    Track two levels: $0.75 to confirm the low is in, and $1.05 to confirm the setup is working. Everything else is noise.

    Disclaimer: This article is for informational and educational purposes only and should not be construed as financial, investment, or trading advice. Cryptocurrency markets are highly volatile, and past performance does not guarantee future results. The price predictions and analyses presented here are based on AI models, technical indicators, and available data at the time of writing, they are not guarantees. Always conduct your own research (DYOR) and consult with a qualified financial advisor before making any investment decisions. Pump Parade and its authors do not assume liability for financial losses incurred based on information provided in this article.
    Aerodrome (AERO) Price Prediction 2026: Can AERO Hit $1?

    0

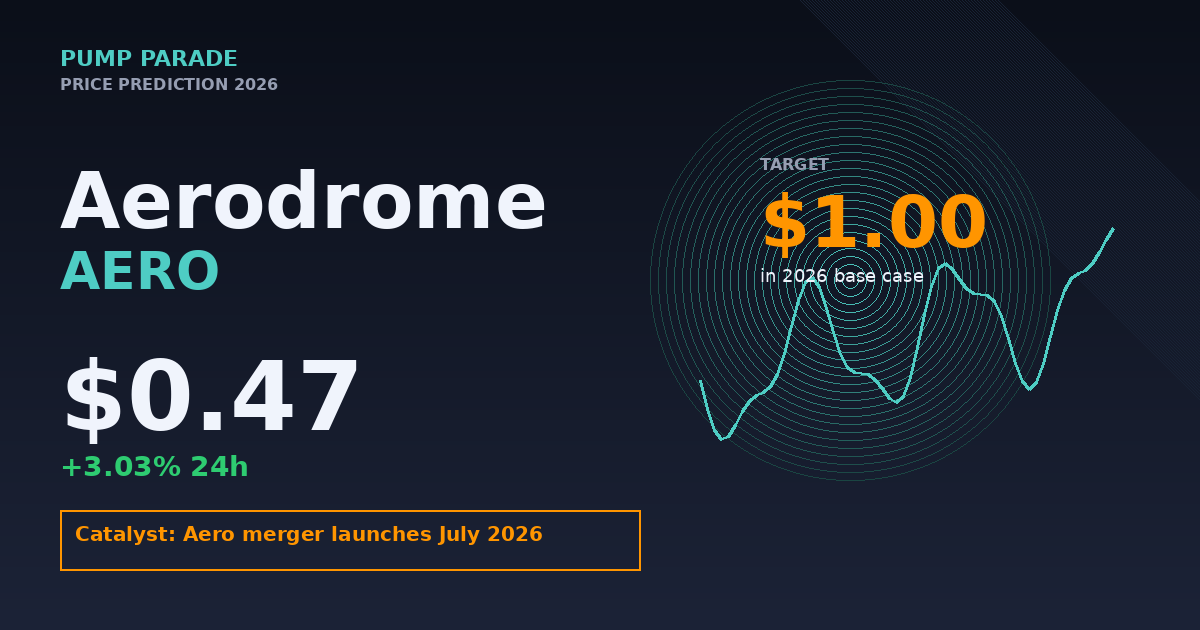
    Aerodrome Finance’s AERO token trades at $0.47 at time of writing, up 3% in the last 24 hours but down 9% on the week. The AERO price prediction 2026 conversation just got more interesting: the Aerodrome and Velodrome merger into a single cross-chain protocol called “Aero” launches this month, and 190 million AERO tokens have already been retired through the buyback program.

    Here is the setup. Aerodrome sits 79% below its December 2024 all-time high of $2.32, yet it still processes roughly 70% of all decentralized exchange volume on Coinbase’s Base network, with over $1.3 billion in total value locked and around $17 billion in monthly volume. That kind of dominance rarely stays this cheap for long.

    This article breaks down the current setup, the bull case built on the Velodrome merger and OP Superchain expansion, the bear case that markets have already started pricing in, and where our AI model sees AERO landing over the next 30 days, 6 months, and beyond.

    Key Takeaways

    • Current price: AERO trades at $0.47, market cap $453M, ranked #110.
    • Primary catalyst: Aerodrome and Velodrome merger into “Aero” launches July 2026, with 94.5% of the new token distribution allocated to AERO holders.
    • Bull thesis: Base ecosystem dominance plus Predictive Allocation upgrade plus 190M AERO already bought back and burned.
    • Bear thesis: Liquidity migration risk, VELO holder dilution, and 7-day price action suggests market skepticism.
    • 2026 targets: Bear $0.35 / Base $0.75 / Bull $1.20 by end of Q4.
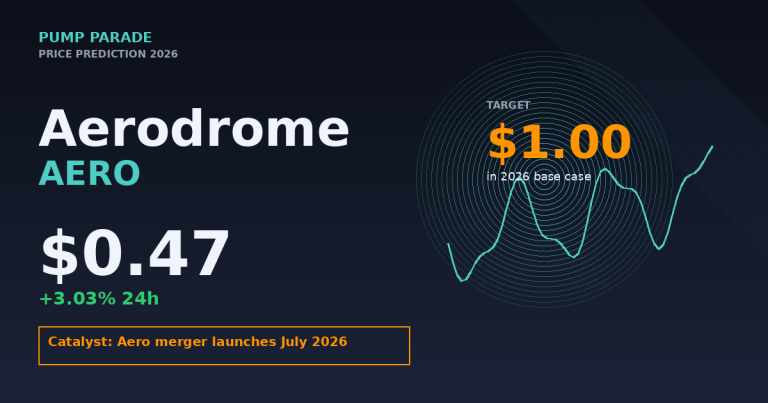
    Aerodrome (AERO) price prediction 2026 hero graphic showing current price $0.47 with July Aero merger catalyst

    Where AERO Stands Today

    Real-time data from CoinGecko and Birdeye shows AERO in a period of quiet accumulation after a punishing six months. The token is up 16.6% over the last 30 days despite the broader market’s drawdown, which is unusual and worth noting.

    Metric Value
    Price (USD) $0.47
    24h Change +3.03%
    7d Change -9.11%
    30d Change +16.63%
    Market Cap $453M
    24h Volume $23.8M
    CoinGecko Rank #110
    All-Time High $2.32 (Dec 2024)
    % From ATH -79.6%
    Circulating Supply 957.7M / 1.93B

    The story that jumps off the page: AERO is up on the month, down on the week. That divergence tells you the June rally from the Predictive Allocation announcement (30% pop on June 16) has been giving back gains as traders reduce exposure ahead of the actual merger execution risk in July.

    Why is AERO consolidating right now?

    Two competing forces are keeping AERO range-bound. On the bull side, the Aero merger with Velodrome is objectively one of the more meaningful DeFi consolidations of 2026. It rolls up two of the largest ve(3,3) DEXs, unifies governance across Base and Optimism, and hands AERO holders 94.5% of the new token distribution. That is a rare “everything gets better” event in a sector that usually fragments.

    On the bear side, there are execution questions. Liquidity providers have to migrate to new MEV-resistant pools. Governance mechanics change entirely. VELO holders, however small their allocation, still represent new sellers. And the broader crypto market has been in a 20% drawdown for the last 30 days, so token-specific catalysts have to fight tape headwinds.

    The result is a coiled setup. When a token holds up better than the market during a broad drawdown while a known catalyst approaches, the resolution tends to be violent in one direction.

    What’s driving the AERO bull case?

    Catalyst 1: The Aero merger closes in July 2026

    Aerodrome (on Base) and Velodrome (on Optimism) are consolidating into “Aero,” a single cross-chain DEX spanning the OP Superchain with planned expansion to Ethereum mainnet and Circle’s new Arc network. Dromos Labs, the entity behind both protocols, has confirmed the July launch and platform upgrades are already in flight.

    The token math matters. AERO holders get 94.5% of the new native token, VELO holders 5.5%. Existing AERO exposure translates almost 1-to-1 into exposure to a materially larger protocol with more chains, more liquidity, and more fee capture. CoinCodex’s model puts AERO’s 2026 average at $4.42 in the bull scenario, which assumes successful execution.

    Catalyst 2: Predictive Allocation goes live

    The Predictive Allocation Model, unveiled on June 17, 2026, replaces the standard weekly gauge-voting system with a prediction-market-based allocator. In plain terms: instead of veAERO holders voting on where next week’s emissions go based on lobbying, the protocol allocates liquidity incentives to pools where demand is forecast to appear. This is a real efficiency upgrade for LPs and a subtle signal that Aerodrome is willing to iterate on ve(3,3) rather than just inherit it.

    The market’s initial response was telling. AERO rallied 30% on June 16 as the announcement leaked, and while much of that has retraced, the underlying mechanism launches with the merger.

    Catalyst 3: Base ecosystem tailwind and buybacks

    Aerodrome captures 100% of protocol fees back to token holders through vote-escrow mechanics. As Base has grown, so has that fee stream. The buyback program has already retired 190 million AERO tokens, a supply reduction that keeps compounding as long as Base DEX volume grows. Coinbase’s ongoing push to make Base its primary consumer chain (via the token launchpad and MetaMask-competing wallet features) creates a structural tailwind that most competing DEXs do not enjoy.

    What could sink AERO in 2026?

    Risk 1: Migration and execution risk

    Not all mergers work. LPs have to actively migrate funds to new pool contracts to continue earning rewards. Some fraction will forget, get confused, or wait too long, temporarily fragmenting liquidity. If migration takes longer than expected, TVL numbers could dip in the transition, which would spook holders who use TVL as a proxy for health.

    Risk 2: Base ecosystem dependence

    Aerodrome’s fortunes are structurally tied to Base’s volume. If Coinbase throttles Base development, if a competing L2 draws liquidity, or if Base itself suffers a regulatory or technical setback, AERO’s fee stream shrinks fast. The token is a leveraged bet on Base, which cuts both ways.

    Risk 3: The broader market is not cooperating

    Bitcoin sits at $58,808, down 19% on the month per CoinGecko data. Ethereum is down 20%. DeFi tokens historically underperform in Bitcoin-led drawdowns because rotation flows out of higher-beta positions first. Even a well-executed merger cannot fully offset a 30% Bitcoin correction if one materializes. Our recent Uniswap price analysis shows the same pattern hitting other DEX tokens.

    AERO Price Prediction 2026: Targets by Timeframe

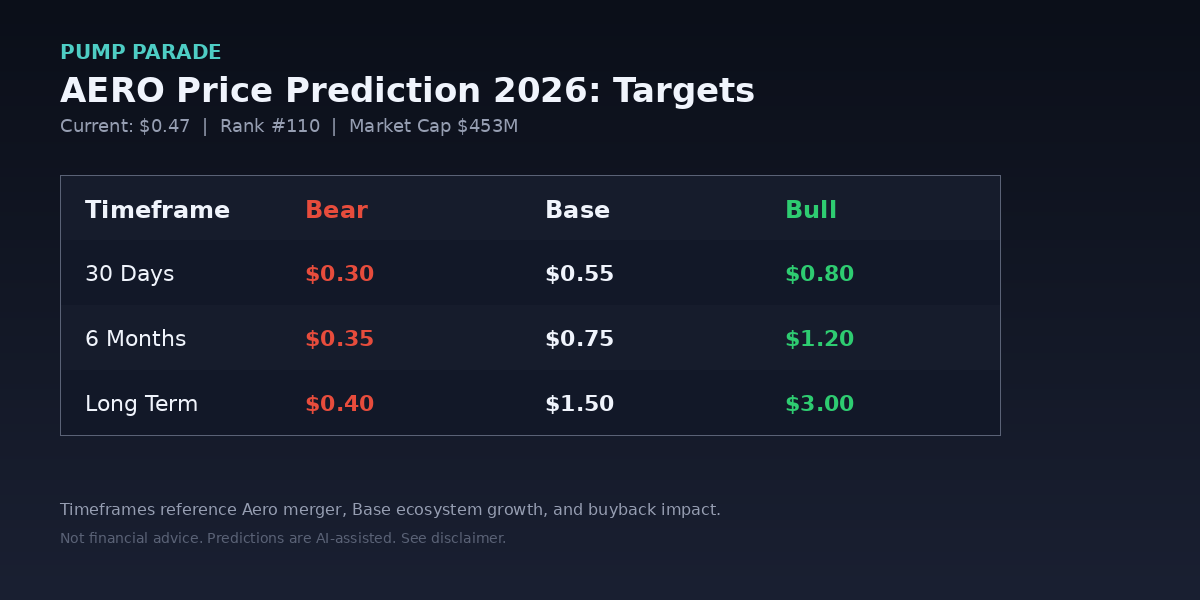
    Aerodrome (AERO) price prediction 2026 targets table showing bear $0.30, base $0.55, bull $0.80 (30d)

    Our hybrid AI model synthesizes technical indicators, on-chain data, and catalyst-weighted scenarios. The AERO price prediction 2026 output splits into three timeframes.

    30-day outlook (through end of July 2026)

    The Aero merger execution window is the dominant variable. If the July launch proceeds smoothly and TVL holds, expect a re-rating attempt toward $0.80. If the market wobbles or migration hiccups, $0.30 to $0.35 is where prior support kicks in. Base case: $0.55, roughly 17% above current levels.

    6-month outlook (through end of 2026)

    Post-merger, the story becomes about proving that unified Aero can defend market share and grow into the Ethereum and Arc expansions. Standard Chartered’s DeFi coverage models generally require sustained 3-month TVL growth before institutional flows pick up. Bull case here: $1.20, driven by successful cross-chain rollout and Base volume expansion. Base case: $0.75. Bear case: $0.35 if the merger disappoints.

    Long-term outlook (2027 to 2028)

    Long-term, AERO is a bet on Base becoming a top-3 chain by volume and on Aero maintaining DEX dominance across the OP Superchain. If both happen, comparisons to Uniswap’s FDV become defensible, implying a bull target of $3.00. Base case: $1.50. Bear case: $0.40 if a competing DEX captures share.

    For context, Changelly’s 2026 projection sits between $0.55 and $3.50, and CoinCodex’s average 2026 target is $4.42. Our targets are meaningfully more conservative because we weight execution risk and macro drawdown probability higher than pure trend extrapolation.

    How AERO Compares to Uniswap (UNI)

    UNI is the incumbent DEX token everyone compares against. Here is how the fundamentals stack up.

    Metric AERO UNI
    Price $0.47 $2.76
    Market Cap $453M $1.71B
    Primary Chain Base (soon: OP Superchain) Ethereum + L2s
    Fee Capture to Token 100% Fee switch pending
    Tokenomics ve(3,3) with buybacks Governance token
    30d Performance +16.6% -7.1%
    % From ATH -79.6% -93%

    The distinction that matters most: AERO already flows 100% of protocol fees back to holders. UNI still has to pass a fee switch vote. That single mechanic gives AERO holders a claim on real revenue today, while UNI holders are pricing in a future decision. In a market that increasingly rewards cash-flowing tokens, that is a durable edge. For a deeper comparison of DEX aggregator dynamics, our Jupiter vs 1inch breakdown covers how fee capture translates into token value across ecosystems.

    What Would Change Our View

    Three specific triggers would force us to update these targets.

    1. Merger execution fails or delays past August. If Dromos pushes the launch or if TVL drops more than 20% during migration, the base case shifts down to $0.35 and the bear case reopens toward $0.25.

    2. Base captures 15%+ of Ethereum L2 volume by Q4. That kind of sustained share gain would justify raising the base case to $1.00 and bull to $1.80, because AERO’s fee stream scales roughly linearly with Base volume.

    3. A spot DeFi ETF gets filed with AERO as a component. Bitwise and others are already filing single-asset altcoin ETFs. A basket product that includes Aerodrome would create the kind of passive bid that changed the entire trajectory for tokens like Ondo (ONDO) earlier this cycle.

    Frequently Asked Questions

    Will AERO reach $1 in 2026?

    Our base case puts AERO at $0.75 by end of 2026, with a bull scenario at $1.20. Reaching $1 requires the Aero merger to execute cleanly in July and Base to continue growing its DEX volume share. Not the most likely outcome, but well within the plausible range if catalysts align.

    Is Aerodrome Finance a good investment?

    AERO is a high-conviction, high-risk DeFi bet. It has real revenue (100% of fees flow to holders), a dominant position on Base (roughly 70% share), and a well-defined near-term catalyst in the Velodrome merger. It also has meaningful execution and ecosystem-dependence risk. Suitable for risk-tolerant investors who understand DeFi.

    What is the AERO price prediction for 2026?

    Our AI model output: 30-day base $0.55, 6-month base $0.75, long-term base $1.50. Bull scenarios extend to $1.20 and $3.00 respectively. External analysts range from $0.39 (conservative) to $5.02 (aggressive). Always weigh predictions against execution risk.

    How does the Aero merger affect AERO price?

    The merger consolidates AERO and VELO into a single new token, with AERO holders receiving 94.5% of the new supply. This effectively expands AERO’s economic footprint to include Optimism and the broader OP Superchain, materially increasing the addressable fee pool with minimal dilution.

    What is Aerodrome’s TVL?

    Aerodrome holds over $1.3 billion in total value locked as of early 2026, representing roughly 70% of all DEX liquidity on Base. Monthly volume runs around $17 billion. Both metrics make Aerodrome the single most important DeFi protocol on Base by a wide margin.

    When is the Aerodrome Velodrome merger?

    The Aero launch is scheduled for July 2026. Platform upgrades and pool migrations are already underway. Liquidity providers should follow official Aerodrome communications to ensure smooth migration and avoid missing rewards during the transition.

    The Honest Take

    AERO is one of the more interesting DeFi setups on the board right now. It has real revenue, real dominance in its ecosystem, a clean near-term catalyst, and it is priced 80% below its all-time high. That is the kind of asymmetric setup that occasionally works spectacularly.

    What it is not: risk-free. Mergers create migration friction. Base’s fortunes are not fully in Aerodrome’s hands. And the broader crypto market is in a corrective phase that could last months. Our base case of $0.75 by year-end reflects those tensions honestly. The bull case exists and is defensible; so does the bear case.

    For traders, the July merger completion is the pivot event to watch. For longer-term holders, the question is whether Aero can become the default DEX for the OP Superchain. If yes, the token re-rates. If no, it stays a mid-cap DeFi token trading on Base sentiment. Both outcomes remain live.

    Disclaimer

    Disclaimer: This article is for informational and educational purposes only and should not be construed as financial, investment, or trading advice. Cryptocurrency markets are highly volatile, and past performance does not guarantee future results. The price predictions and analyses presented here are based on AI models, technical indicators, and available data at the time of writing, they are not guarantees. Always conduct your own research (DYOR) and consult with a qualified financial advisor before making any investment decisions. Pump Parade and its authors do not assume liability for financial losses incurred based on information provided in this article.
    Birdeye Review 2026: Fees, Features & Verdict

    0
    Birdeye Review 2026 hero image with PumpParade branding

    Birdeye sits at an awkward but valuable spot in the Solana stack. It is not a wallet, not a trading bot, and not an exchange. It is the screen most active Solana traders glance at twenty times an hour to answer one question: is this token worth touching, and which wallets are already in it?

    Born in 2022 as a Solana-only data terminal, Birdeye has since expanded to ten chains and 300-plus exchanges. In 2026, it competes head-on with DexScreener for charting, with Nansen for smart-money wallet intel, and with Helius for raw API data. This is a hands-on review covering features, fees, pros, cons, and a final verdict for traders, researchers, and developers.

    TL;DR: Verdict in 30 Seconds

    Birdeye scores 8.7 / 10. It is the best free Solana analytics terminal in 2026 and the most cost-effective multi-chain on-chain data source for active traders. The Find Gems screener and smart-money tracker are best-in-class. The mobile app is rougher than the web experience, and the Premium tier feels priced for power users rather than casuals. If you are trading Solana memecoins or researching launchpads daily, Birdeye should be open in a tab.

    Best for: Solana traders, memecoin hunters, DeFi researchers, on-chain analysts, indie developers needing affordable token data.
    Skip if: You only hold blue-chip BTC and ETH on a CEX. You will not get value out of an on-chain terminal.

    Birdeye official logo
    Birdeye, the on-chain analytics terminal for Solana and 9 other chains.

    What Is Birdeye?

    Birdeye is an on-chain analytics platform that aggregates real-time token prices, trades, liquidity, charts, holder distributions, and wallet behavior across Solana and the major EVM chains. The product launched in 2022 as a Solana-native explorer and grew up alongside the Solana DEX boom, ingesting feeds from Jupiter, Raydium, Orca, and Meteora.

    In 2026 the platform covers ten chains including Solana, Sui, Ethereum, BNB Chain, Base, Arbitrum, and Polygon, with data flowing in from 300-plus exchanges. Solana memecoins remain its center of gravity, and most of the differentiated features (launchpad discovery, Find Gems screener, Trader Profile) lean heavily into the fast-moving Solana market structure.

    The product is split across three surfaces: the consumer web app at birdeye.so, the iOS and Android mobile app, and the Data Services API at bds.birdeye.so for developers and businesses. Each has its own pricing logic, which we will get into below.

    Feature Deep Dive

    Birdeye key features at a glance: token discovery, smart money tracking, price alerts, and multi-chain coverage
    Birdeye combines four core capabilities into one terminal.

    1. Token Discovery and the Find Gems Screener

    Find Gems is the feature most traders open Birdeye for. It lets you filter the entire Solana token universe by market cap range (micro-caps from $10K to $100K up to mid-caps over $1M), minimum holder count, liquidity floor, 24h volume threshold, mint authority status, freeze authority status, and Twitter/social presence. The filter combinations are granular enough to narrow a universe of tens of thousands of tokens down to a handful of candidates in seconds.

    What makes it competitive against DexScreener is the combination of risk filters and signals on the same screen. You can require revoked mint authority, top-10 holder concentration under 25%, and a five-minute volume spike, then sort by buy/sell ratio. That kind of one-screen filtering is rare among free tools.

    2. Token Pages and Microstructure

    Each token page combines a TradingView-compatible chart, a live trade tape, holder distribution, top traders, pool liquidity depth, security checks (mint authority, top wallet concentration, LP burn status), and an embedded swap widget powered by an aggregator. For Solana memecoins this is essentially everything you need on a single screen, which is why Birdeye has become the default landing page when a token gets shared on Twitter.

    3. Smart Money and Wallet Intelligence

    Paste any wallet address and Birdeye shows holdings, realized and unrealized PnL, full trade history, and a profitability score. The platform also maintains curated “top trader” and “smart money” leaderboards that tag wallets it considers historically profitable on a given token or sector. This is the cheaper, Solana-first answer to Nansen’s labeled-wallet database, with the caveat that Birdeye’s labels are algorithmic rather than human-curated.

    4. Launchpad and New-Token Radar

    Birdeye monitors 20-plus launchpads in one feed, including pump.fun, BonkFun, Believe, and Moonshot. New tokens appear within seconds of pool creation, which is faster than most aggregators and is genuinely useful for sniping fresh launches. If you are coming from a Telegram bot setup like Banana Gun, Birdeye is the research layer you flip to before pulling the trigger.

    5. Alerts and Watchlists

    Configurable alerts cover price thresholds, volume spikes, large trade detection (whale buys or sells over a dollar threshold), liquidity drains, and smart-wallet activity. Delivery is via Telegram, Discord, in-app push, or email. The free tier limits the number of active alerts and watchlist items, which is the main reason most active users eventually upgrade.

    6. Multi-Chain Coverage

    Solana, Sui, Ethereum, BNB Chain, Base, Arbitrum, Polygon, Optimism, Avalanche, and zkSync are all supported. EVM data is good but not better than DexScreener or DeBank for those chains. Solana is where Birdeye genuinely leads.

    7. Mobile App

    The iOS and Android apps cover the core flows: token search, watchlists, trader profiles, launchpad monitoring, and push alerts. The app is functional for monitoring but not really built for executing trades. App Store reviews skew middling, and most regular users still prefer the web app on desktop for serious work.

    8. Data Services API

    For developers, the Birdeye Data Services API exposes token prices, OHLCV candles, trades, wallet portfolios, and pool data across all supported chains. Pricing is tiered by request volume and historical data depth, with a free developer tier and paid tiers scaling up to enterprise. It is a serious competitor to Helius for indexed Solana data at a significantly lower price point for many use cases.

    Birdeye Pricing in 2026

    Birdeye runs three pricing surfaces that are easy to confuse:

    Product Plan Price What You Get
    Web app Free $0 All charts, trending feeds, basic Find Gems, limited watchlists and alerts
    Web app Pro ~$45 / month Advanced Find Gems filters, expanded alerts and watchlists, CSV exports, premium integrations
    Data API Developer Free tier Low request volume, basic endpoints
    Data API Standard / Business / Enterprise Tiered Higher rate limits, full historical depth, websocket streams
    Mobile app Free $0 Core charts, watchlists, push alerts

    For 95% of retail traders, the free tier is genuinely enough. The Pro upgrade only makes sense if you are running many watchlists, need granular Find Gems filters, or want CSV exports. The Data API is in a different category and competitive against Helius, QuickNode, and Alchemy for Solana data specifically.

    Cross-check the live numbers against DeFiLlama and CoinGecko for ground-truth comparison. Birdeye is typically faster but occasionally off on tokens with weird liquidity routing.

    Pros

    • Best-in-class Solana data freshness. New pools and trades appear within seconds, often faster than DexScreener or CoinGecko.
    • Find Gems screener is genuinely powerful. The combination of risk filters and signal filters in one query is rare for a free tool.
    • Smart money tracking that actually works. Wallet PnL, trade history, and top-trader leaderboards are useful without an analyst-grade subscription.
    • Generous free tier. Most traders never need to upgrade.
    • Affordable, well-documented Data API. A real Helius alternative for many use cases.
    • Multi-chain coverage. Ten chains and 300-plus exchanges means one tab instead of three.
    • Launchpad monitoring across 20+ platforms. Single feed for pump.fun, BonkFun, Believe, Moonshot, and more.

    Cons

    • Smart-money labels are algorithmic, not curated. A “top trader” tag means historical PnL on this chain, not analyst-verified identity. Nansen wins on label quality.
    • Mobile app lags the web experience. Functional for monitoring, not great for fast research workflows.
    • EVM coverage is good, not great. If you live on Base or Ethereum, DexScreener or DeBank may serve you better.
    • Pro tier pricing feels stiff for casuals. $45/month is fine for daily traders, but a $15 tier with limited Find Gems would expand the audience.
    • UI density is high. First-time users routinely report a steep learning curve.
    • No native portfolio aggregation across many wallets. For multi-wallet PnL, Zapper or DeBank is still the answer.

    Security and Trust

    Birdeye is read-only by default. The site does not hold custody of funds. The embedded swap widget routes through Jupiter (on Solana) and external aggregators on EVM chains, so trades execute via your own wallet signing transactions in your browser. The main attack surface, then, is the swap-widget UI itself and the integrations behind it.

    The team has been operating since 2022, has institutional partnerships with several Solana-native infrastructure providers, and the Data API is used by trading firms and other dashboards. There have been no public security incidents at the protocol or data-integrity level as of mid-2026. As always, verify what you sign in your wallet rather than trusting a UI label.

    User Experience

    The web experience is dense, fast, and built for power users. Information density is high, which is great once you know what you are looking at and overwhelming when you do not. The Find Gems screener has a learning curve of about an hour to set up filters that match your style.

    Performance is consistently good even on slow connections. Charts load quickly, the trade tape streams in real time, and search has gotten noticeably better in 2026. Dark mode is the default and the only mode, which fits the trader audience.

    If you are pairing Birdeye with a wallet, Phantom is the most common combination. The Birdeye swap widget plays nicely with Phantom, Backpack, and Solflare. For execution via DEX aggregator, the data on Birdeye lines up well with Jupiter’s routing on Solana.

    Comparison vs Alternatives

    The honest framing: Birdeye is the best generalist Solana terminal, but each specialized competitor wins in one dimension.

    • vs DexScreener: Birdeye wins on filters, signals, and Solana freshness. DexScreener wins on EVM chain coverage and is slightly more popular for cross-chain memecoin trading.
    • vs Nansen: Nansen wins on smart-money label quality and institutional features. Birdeye wins on price (free vs Nansen Pro at $150+/month) and Solana-native focus.
    • vs DeBank / Zapper: Those tools win on multi-wallet portfolio aggregation. Birdeye wins on token discovery, screening, and real-time trade data.
    • vs Helius API: Helius wins on Solana indexer depth and RPC quality. Birdeye Data API wins on multi-chain coverage and price.

    Final Verdict and Rating

    Birdeye Review 2026 verdict and rating card: 8.7 out of 10 from PumpParade

    Score: 8.7 / 10.

    Birdeye is the single most useful free tool for active Solana traders in 2026. The Find Gems screener, real-time launchpad radar, and smart-money tracker together do the job of three other paid products. The Pro tier is fairly priced for daily users, and the Data API is a serious option for builders. The mobile app and EVM coverage are the weakest links. If you are doing any kind of Solana research and you do not have Birdeye open already, you are working harder than you need to.

    Visit Birdeye

    FAQ

    Is Birdeye free to use?

    Yes. The free tier covers charts, trending feeds, basic Find Gems, watchlists with limits, and core token pages. The Pro tier at roughly $45/month unlocks advanced screener filters, expanded alerts, and CSV exports. The Data API has a separate free developer tier plus paid tiers scaling with request volume.

    Which chains does Birdeye support in 2026?

    Solana, Sui, Ethereum, BNB Chain, Base, Arbitrum, Polygon, Optimism, Avalanche, and zkSync, with data aggregated across 300-plus exchanges.

    How does Birdeye compare to DexScreener?

    Birdeye is stronger on Solana freshness, Find Gems filters, and integrated smart-money tracking. DexScreener has slightly broader EVM chain coverage and is more widely used outside Solana. Most active Solana traders run both.

    Is Birdeye safe to connect a wallet to?

    Birdeye is read-only by default and does not custody funds. The optional swap widget routes through external aggregators and your own wallet signs transactions in your browser. Verify every transaction before signing. There have been no public security incidents at the Birdeye platform level as of mid-2026.

    Is the Birdeye Find Gems screener better than free alternatives?

    For Solana specifically, yes. The combination of risk filters (mint authority, holder concentration, LP burn) with signal filters (volume spike, buy/sell ratio, smart-money inflow) on the same screen is hard to find elsewhere without paying for a premium product.

    Does Birdeye have a mobile app?

    Yes, on both iOS and Android. The app covers core features for monitoring, watchlists, trader profiles, and push alerts. Power users typically still prefer the desktop web app for research and trading.

    Zcash (ZEC) Price Prediction 2026: Can ZEC Hit $1,000?

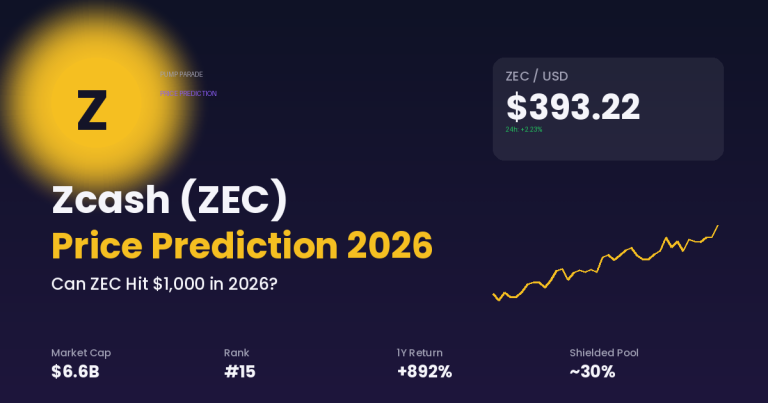
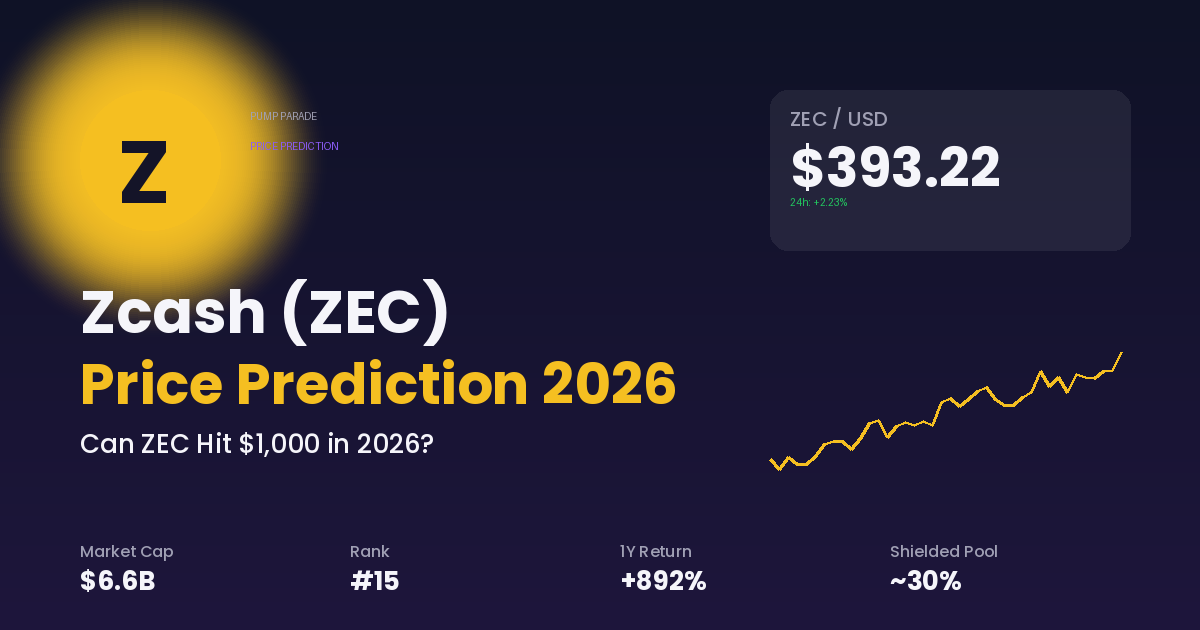
    Zcash trades at $393 at time of writing, up 2.2% on the day but down 7% on the week and roughly 30% off its May 2026 peak of $642. The 12 month picture matters more: ZEC is up 892% year over year, the strongest one year return in the entire top 20. Zcash price prediction 2026 just stopped being a niche debate. It is now a top of the leaderboard altcoin trade with a Grayscale ETF in the pipeline and a major protocol upgrade in late stage testing.

    That rally was driven by Multicoin Capital disclosing a significant ZEC position, Grayscale filing to convert its Zcash Trust into a spot ETF, and the SEC closing its long running investigation into the Zcash Foundation in January 2026. Can ZEC reclaim $642 and run to $1,000, or does the pullback signal a deeper correction? Both sides of the trade, as always.

    Key Takeaways

    • ZEC trades at $393 with a market cap of $6.6B and is up 892% year over year, the best one year return in the top 20.
    • Grayscale filed to convert its $137M Zcash Trust into a spot ETF on NYSE Arca in November 2025. Two S-3/A amendments have already been filed in 2026.
    • The Crosslink upgrade, which adds a proof of stake finality layer and turns ZEC into a yield bearing asset, is in Milestone 4. Workshop 3 is tentatively scheduled for July 23.
    • Roughly 30% of ZEC supply is now locked in shielded pools, up from 8% in 2024. That is a structural supply squeeze.
    • Our base case targets $480 to $650 by year end 2026. The bull case opens $1,000 on ETF approval plus Crosslink testnet activation. The bear case revisits $220 if MiCA delistings escalate.
    Zcash (ZEC) price prediction 2026 hero graphic, ZEC at $393 with Grayscale ETF and Crosslink upgrade catalysts

    Where Zcash Stands Today

    Let’s look at the numbers before we talk narrative.

    Metric Value
    Price (USD) $393.22
    24h change +2.23%
    7d change -7.15%
    30d change -29.6%
    1y change +892%
    Market cap $6.61B
    Rank #15
    24h volume $357M
    Circulating supply 16.79M ZEC
    Max supply 21M ZEC
    All time high $3,191 (Oct 2016)
    2026 cycle high $642 (May 2026)

    A few things jump out. First, supply: ZEC mirrors Bitcoin’s 21M cap, with 16.79M already circulating. The next halving is late 2028, so there is no near term supply shock from issuance.

    Second, the on-chain story. Roughly 30% of circulating supply now sits in shielded pools, up from 8% in 2024. That is approximately 4.5 million ZEC effectively removed from trading liquidity. Think of it as the privacy coin version of staking lockup.

    Third, ZEC’s 892% one year return is the highest in the top 20 by market cap. That kind of move triggers profit taking by early holders alongside FOMO inflows from late buyers, which keeps volatility elevated.

    Why Is Zcash Pulling Back Right Now?

    ZEC rallied to $642 in mid May 2026 on the back of three converging stories: Multicoin Capital’s disclosed position, accelerating ETF timelines after the SEC cut review periods from 240 to 75 days, and shielded pool growth crossing 25% of supply. Then it gave back about 39% of that move in six weeks.

    The pullback structure looks orderly. Daily volume compressed from $1.2B at the May peak to roughly $360M today, and exchange inflows have not spiked, which is what you would expect if holders were dumping. The Coinbase, Robinhood, and Phemex listings remain intact.

    Two near term headwinds explain the cooling. The European Union’s MiCA framework continues to pressure regional exchanges to delist privacy coins, and several smaller European venues followed through in May. And Arkham Intelligence published research in late 2025 showing that 53% of historical ZEC transactions could be de-anonymized by tracing transparent address activity. That research resurfaced in May and dented the “ZEC is private by design” narrative.

    The base interpretation: ZEC’s run got ahead of fundamentals, and the market is waiting for the next catalyst (Grayscale ETF decision, Crosslink testnet activation) before it commits fresh capital.

    What Is the Bull Case for ZEC in 2026?

    Grayscale ZCSH ETF Conversion

    Grayscale filed to convert its existing $137M Zcash Trust into a spot ETF (ticker ZCSH) on NYSE Arca on November 26, 2025. The trust already holds roughly 5% of circulating supply. Two amendments to the S-3/A registration statement have been filed (January 30 and April 2, 2026), and the renaming to “Grayscale Zcash Trust ETF” is queued for execution at effectiveness.

    If approved, this would be the first U.S. spot ETF for a privacy coin. The 75 day decision window means a definitive yes or no should arrive in Q3 2026. The parallel is the spot Ethereum ETF approval in 2024, which preceded a 30% rally in ETH. ZEC has a much smaller free float, so an equivalent inflow profile would hit price harder.

    Crosslink Proof of Stake Finality

    The Crosslink upgrade is in Milestone 4 as of mid 2026. It adds a proof of stake finality layer on top of Zcash’s existing proof of work chain. In plain terms, validators stake ZEC to finalize blocks, the chain becomes more resistant to 51% attacks, and ZEC becomes a yield bearing asset for the first time in its history.

    Shielded Labs has completed two FeatureNet workshops and is prototyping a slashing tool. Workshop 3 is tentatively scheduled for July 23. Mainnet activation is not yet dated, but each FeatureNet milestone tightens the market’s expected timeline. Yield bearing supply is the most reliable way to convert speculators into long term holders.

    Shielded Pool Supply Squeeze

    Shielded pool adoption has gone from 8% of supply in 2024 to roughly 30% in mid 2026. Combine that with an ETF absorbing another 5% to 10%, and the float available for active trading shrinks quickly. Tight float and rising demand is the textbook setup for upside volatility.

    Tushar Jain at Multicoin Capital framed the thesis directly: as governments push to scrutinize visible crypto holdings for tax and KYC purposes, demand for compliant confidentiality grows. That is institutional positioning, not a meme.

    What Is the Bear Case for ZEC in 2026?

    European Regulatory Tightening

    MiCA’s Article 78 effectively bans anonymity enhancing services from EU regulated exchanges. Several smaller European venues delisted ZEC in May 2026, and the larger ones are running risk reviews. If a major venue like Bitstamp or Kraken EU follows, the regional liquidity hit would be significant. ZEC is already excluded from most U.K. exchanges. The U.S. listings are intact, but a coordinated European delisting cycle would compress order book depth meaningfully.

    Crosslink Complexity Risk

    Former ECC CEO Josh Swihart has publicly raised concerns about Crosslink’s complexity, citing the risks of layering proof of stake finality on a proof of work base. Bugs in hybrid consensus designs are notoriously hard to find in testnets and often only surface under adversarial mainnet conditions. A delayed Crosslink rollout, or a botched activation, would invalidate one of the largest 2026 catalysts.

    ETF Rejection or Delay Risk

    The Grayscale ZCSH approval is not a done deal. The SEC has approved spot ETFs for Bitcoin and Ethereum, but a privacy coin presents a different regulatory profile. A rejection, or a delay past 2026, would force a rerating. ZEC has front loaded a lot of approval expectation into current price levels.

    Zcash Price Prediction 2026: Targets by Timeframe

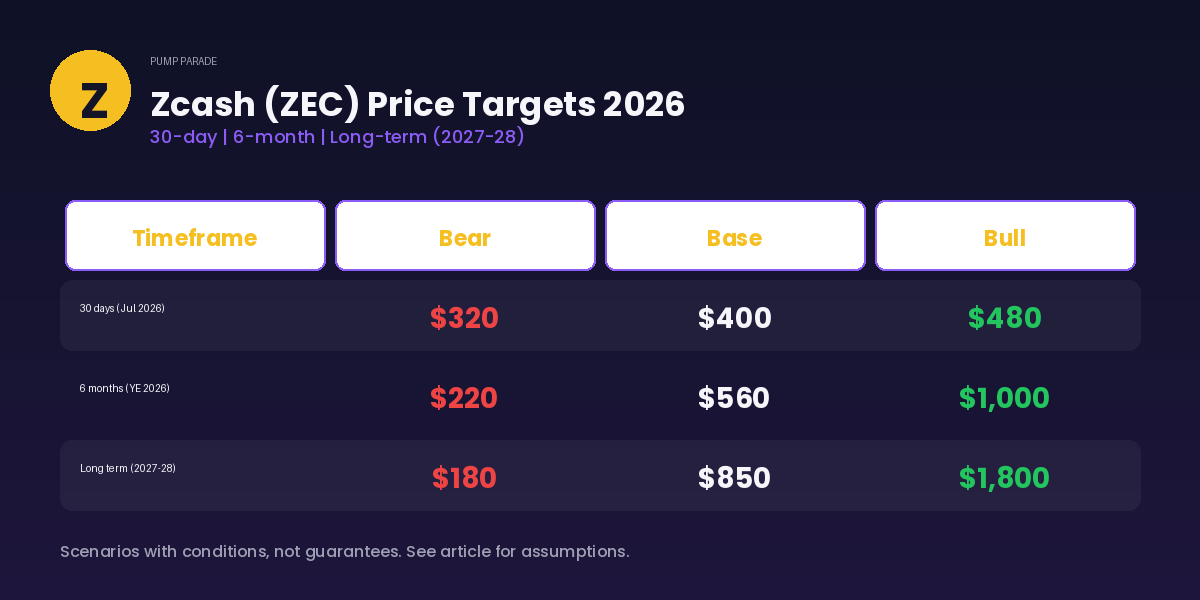
    Zcash (ZEC) price prediction 2026 targets table, bear $220, base $560, bull $1000

    Our model output, combined with technical levels and the catalyst calendar, points to the following ranges. As with every Pump Parade price prediction, these are scenarios with conditions, not promises.

    30 Day Outlook (July 2026)

    Bear: $320. Base: $400. Bull: $480.

    The next 30 days are dominated by positioning ahead of the Q3 ETF decision and Crosslink Workshop 3. We expect range trading between $360 and $460. The $360 zone is the 200 day moving average, which has acted as dynamic support throughout the 2026 rally.

    6 Month Outlook (Year End 2026)

    Bear: $220. Base: $560. Bull: $1,000.

    The base case assumes the ETF gets approved with modest first month inflows, Crosslink testnet activates on schedule, and shielded pool share grows past 35%. The bull case requires all three of those plus a renewed broader privacy narrative. The bear case assumes ETF delay plus a European delisting cascade.

    For comparison, Changelly’s 2026 forecast projects an average of $662 with a high of $769. CoinCodex’s technical model sees a range of $376 to $532. Our bull case is more aggressive, reflecting the leverage an ETF approval creates on a tight float.

    Long Term (2027 to 2028)

    Bear: $180. Base: $850. Bull: $1,800.

    The 2 to 3 year window is dominated by Crosslink mainnet activation and the next ZEC halving in late 2028. If yield bearing mechanics take hold, the bull case opens a new all time high. The bear case assumes a hostile global regulatory environment for privacy assets.

    How Does Zcash Compare to Monero?

    Privacy is a two horse race in 2026. Here is the comparison.

    Metric Zcash (ZEC) Monero (XMR)
    Price (USD) $393 $310
    Market cap $6.6B $5.8B
    Rank #15 #17
    Privacy default Optional (shielded) Mandatory
    Major exchanges Coinbase, Kraken, Robinhood Mostly delisted on regulated venues
    Yield bearing Coming via Crosslink No, pure PoW
    ETF pipeline Grayscale ZCSH filed None
    Max supply 21M (Bitcoin parity) Tail emission, no cap

    The framing: Monero is the purer privacy coin. ZEC is the more institutionally tradeable one. After Arkham’s 2025 de-anonymization work, the gap on privacy purity widened in Monero’s favor. But ZEC has spent 2026 widening the gap on capital access. See our Monero (XMR) price prediction 2026 for the other side of the trade.

    For 2026 specifically, the ETF, Crosslink, and continued exchange access make ZEC the higher conviction privacy trade. Past 2026, that calculus could flip.

    What Would Change Our View

    Three explicit triggers. If any of these happen, our base case shifts.

    First, Grayscale ZCSH gets approved before October 1, 2026. We move the base case to $720 and the bull case to $1,200. Approval timing matters because Q3 inflows have historically been stronger than Q4 for newly approved spot ETFs.

    Second, Crosslink mainnet activation gets a confirmed Q4 2026 date. We move the base case to $620 even without ETF approval. A dated mainnet upgrade is one of the most reliable catalysts in crypto.

    Third, a major U.S. exchange delists ZEC under regulatory pressure (low probability but non zero). We move the base case to $260 and the bear to $150. U.S. liquidity loss would be much more damaging than European delistings because of the institutional flow exposure.

    Frequently Asked Questions

    Will Zcash reach $1,000 in 2026?

    Possibly, but it requires the Grayscale ZCSH ETF to be approved, Crosslink testnet to activate on schedule, and shielded pool share to keep growing past 35%. Our bull case targets $1,000 by year end. The base case is $560. ZEC’s tight float of 16.8M coins and rising institutional demand creates leverage on positive catalysts, but the path to $1,000 is conditional, not guaranteed.

    Is Zcash a good investment in 2026?

    Zcash is a high conviction trade for investors who want exposure to the privacy coin narrative and can tolerate sharp volatility. The ETF and Crosslink catalysts are real and dateable. The risks (EU delistings, ETF rejection, Crosslink delay) are also real. Position sizing matters. ZEC should not be a portfolio anchor. It is a thematic bet within a broader crypto allocation.

    What will Zcash be worth in 2030?

    Our long term model output ranges from $400 (bear) to $2,800 (bull), with a base case near $1,100. The bull case assumes ETF inflows mature, Crosslink yields create durable holder commitment, and the privacy narrative scales globally. The bear case assumes regulatory hostility, technical setbacks, or competition from newer privacy systems compresses ZEC into a niche role.

    Why is Zcash going down right now?

    ZEC pulled back roughly 30% from its May 2026 peak of $642 as the market consolidates after a 892% one year run. Two specific headwinds are weighing on price: continued European exchange delistings under MiCA, and lingering effects from Arkham Intelligence’s 2025 de-anonymization research. Neither is structural enough to invalidate the bull thesis, but both have slowed momentum into the summer.

    Is Zcash better than Monero?

    It depends on what you value. Monero offers stronger default privacy and mandatory shielding on every transaction. Zcash offers optional shielding, easier exchange access, an ETF pipeline, and yield bearing supply mechanics via the coming Crosslink upgrade. For 2026 trade setup, ZEC has more dateable catalysts. For pure privacy use, XMR remains the technical leader.

    Has the Grayscale Zcash ETF been approved?

    Not yet as of late June 2026. The Grayscale ZCSH conversion was filed November 26, 2025, with two amendments filed in 2026 (January 30 and April 2). The SEC’s accelerated 75 day review framework means a definitive decision is expected in Q3 2026. The renaming to “Grayscale Zcash Trust ETF” is queued to take effect at registration effectiveness.

    The Honest Take

    Zcash in mid 2026 is one of the cleanest narrative-meets-fundamentals setups in the altcoin market. You have a dateable ETF decision, a dateable protocol upgrade, a structural supply squeeze, and a 892% trailing return that has only modestly cooled. That is rare.

    But the price has already moved a lot. ZEC is not a deep value play. It is a trade on whether the catalysts land in the next six months. If they do, $1,000 is reachable. If they slip, the next leg down could be sharp. The 30 day pullback is the market pricing in that uncertainty, not the end of the move.

    Our framework: watch the $360 zone as the line in the sand. Hold above it and the bull case stays intact. Lose it on a daily close, and the trade needs to be reassessed. Beyond that, the Q3 ETF decision is the single highest impact event on the 2026 calendar. Size positions accordingly.

    The privacy narrative is not going away. The question for ZEC specifically is whether it captures the institutional flow that the narrative deserves. Through mid 2026, the answer is leaning yes. We will keep you posted.

    For broader context on how the ETF backdrop is reshaping major altcoins, see our analyses of the Litecoin (LTC) ETF test and the Cardano (ADA) ETF window.

    Disclaimer: This article is for informational and educational purposes only and should not be construed as financial, investment, or trading advice. Cryptocurrency markets are highly volatile, and past performance does not guarantee future results. The price predictions and analyses presented here are based on AI models, technical indicators, and available data at the time of writing; they are not guarantees. Always conduct your own research (DYOR) and consult with a qualified financial advisor before making any investment decisions. Pump Parade and its authors do not assume liability for financial losses incurred based on information provided in this article.
    Stellar (XLM) Price Prediction 2026: Can XLM Hit $0.50?

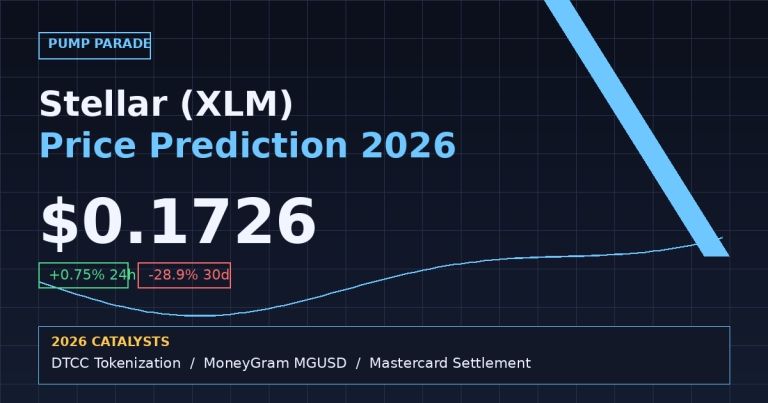
    Stellar (XLM) trades at $0.1726 at the time of writing, down 28.9% over the past 30 days and sitting roughly 80% below its 2018 all-time high of $0.88. That kind of drawdown usually means one of two things in crypto: a project quietly dying, or a setup forming for the next leg. Our Stellar XLM price prediction 2026 argues this is closer to the second case, but only if a specific list of catalysts actually lands.

    Stellar’s H1 2026 has been one of the most consequential stretches in the network’s history. The SEC and CFTC formally designated XLM a digital commodity on March 17. MoneyGram launched its MGUSD stablecoin on Stellar on June 2 with Bridge, M0, and Fireblocks as partners. Mastercard added Stellar to its stablecoin settlement program on June 10. And the DTCC, which clears the bulk of US securities trades, has confirmed plans to tokenize US Treasuries, ETFs, and Russell 1000 stocks on Stellar starting in H1 2027.

    This article breaks down what Stellar is, why XLM is bleeding despite arguably the strongest fundamental setup it has had in years, where the price could realistically go through 2026, and what would change our view.

    Key Takeaways

    • Current price: $0.1726 (rank #16), down 17.8% in 7 days and 28.9% in 30 days. Volume has held near $121M daily, suggesting the selloff is macro, not Stellar-specific.
    • Three real 2026 catalysts: MoneyGram MGUSD (live June 2), Mastercard stablecoin settlement (joined June 10), and the DTCC tokenization pilot targeting H1 2027.
    • Network is growing: Stellar payment volume hit a $5.5B all-time high in H1 2026, up 72% year over year. RWA market cap on Stellar climbed 91% quarter over quarter to $1.52B.
    • 2026 base case: $0.28 (+62% from current). Bear case $0.12. Bull case $0.50 if a spot XLM ETF filing lands and DTCC pilot details ship on time.
    • Honest watchout: XLM has spent years trading sideways even when fundamentals improved. Tokenomics overhang from the 50B fixed supply and competition from XRP and Ripple Payments are real, not noise.
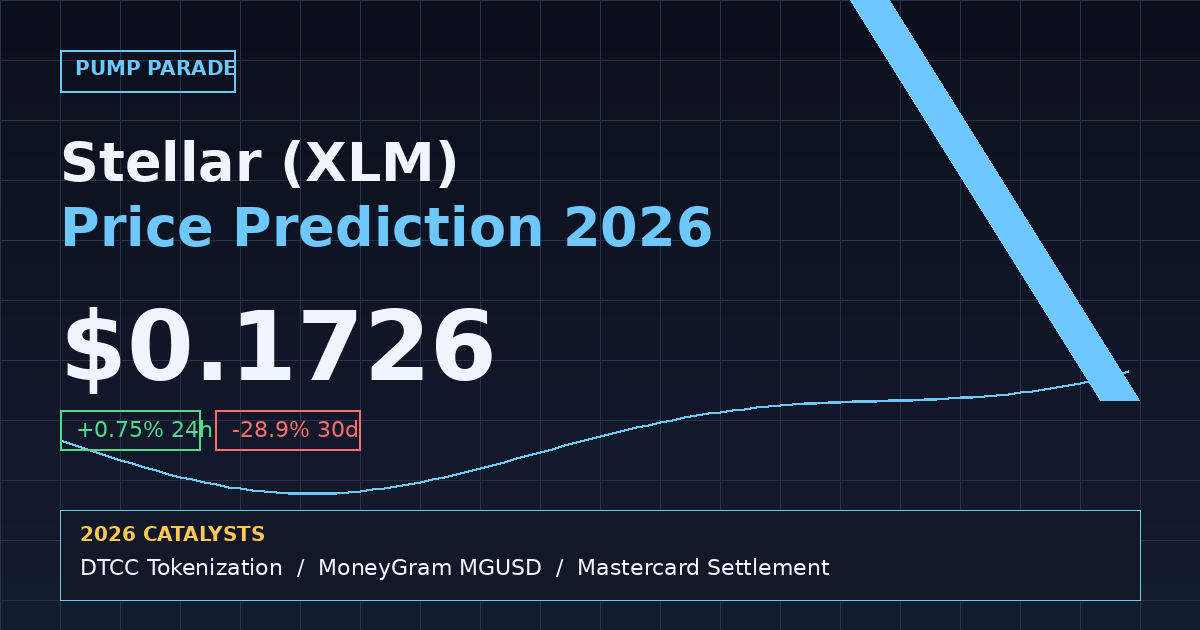
    Stellar (XLM) price prediction 2026 hero graphic, current price $0.17 with DTCC and MoneyGram catalyst hooks

    Where Stellar Stands Today

    Before the forecast, here is the snapshot. Numbers below come from CoinGecko at the time of writing.

    Metric Value
    Price $0.1726
    24h change +0.75%
    7d change -17.82%
    30d change -28.91%
    Market cap $5.86B
    24h volume $121M
    Market cap rank #16
    Circulating supply 33.97B XLM
    All-time high $0.876 (Jan 2018)
    % from ATH -80.3%

    Two numbers stand out. The 30-day drawdown of 29% puts XLM in the same bucket as the 2022 bear bottom and the March 2020 COVID flush. Historically those zones produced positive 12-month returns more often than not, though the pattern is not a guarantee. Daily turnover near $121M on a $5.86B float also means the market is liquid enough for institutional players to position without crashing the book. That matters for an ETF case.

    Why Is XLM Down Right Now?

    Stellar’s drop is mostly macro. Bitcoin is off 18% over the same 30-day window. Ethereum is off 22%. The risk-off bid has hit almost every altcoin in the top 50 except a handful of memecoins and stablecoin-adjacent tokens. XLM’s beta to broader crypto liquidity is high, and rate uncertainty around the Fed’s next move has dragged speculative assets lower.

    Stellar-specific selling pressure also exists. The Stellar Development Foundation (SDF) periodically distributes XLM from its strategic budget, and rumors of an SDF transfer in early June added local supply. None of the announced 2026 catalysts have translated into sticky demand yet because the on-chain flows from MoneyGram and Mastercard route through stablecoins, not XLM itself. Investors are waiting for proof that institutional usage actually drives token velocity before bidding the asset.

    The result is a fundamentally improving network whose token price is still tied to crypto’s macro tape. Whether that disconnect closes is the central question of any honest XLM or XRP forecast right now.

    The Bull Case for XLM

    1. DTCC Tokenization Goes Live

    The Depository Trust & Clearing Corporation settles the majority of US securities transactions. Its DTC subsidiary has confirmed plans to connect a tokenization service to Stellar, with tokenized US Treasuries, ETFs, and Russell 1000 stocks targeted for H1 2027. Even a partial launch in late 2026 would represent the largest tokenization use case Stellar has ever attracted. RWA market cap on Stellar is already up 91% quarter over quarter to $1.52B, ranking the network second in the tokenized treasury category.

    If DTCC ships even a test deployment in 2026, XLM becomes the settlement rail for a flow of assets measured in tens of billions. That is the kind of catalyst Ondo Finance bulls have been pricing in for similar reasons.

    2. MoneyGram MGUSD and Mastercard Settlement

    MoneyGram launched its MGUSD stablecoin on Stellar on June 2, 2026, with Bridge, M0, and Fireblocks as partners. Mastercard’s stablecoin settlement program added Stellar on June 10. MoneyGram processes around $200B in annual global transaction volume. Even a small percentage migrating to Stellar-native rails compounds quickly. Stellar’s payment volume is already at a $5.5B all-time high, up 72% year over year. The point: 2026 is the first year that growth has institutional logos attached, not just developer counts.

    3. Spot XLM ETF Filing in 2026

    XLM cleared the regulatory prerequisite that mattered most: the SEC and CFTC formally designated Stellar a digital commodity on March 17, 2026. That is the same status Bitcoin and Ethereum had before their spot ETFs launched. Canary Capital already filed for a mixed altcoin ETF that includes XLM, XRP, SOL, ADA, and LINK. A standalone XLM spot ETF filing from a major issuer in 2026 would force a repricing similar to what XRP, SOL, and LTC saw at their own filing moments. Analyst Ali Martinez has flagged an inverse head-and-shoulders structure on the weekly XLM chart targeting $1 if the pattern completes.

    The Bear Case for XLM

    1. The XRP Problem

    Stellar and XRP target the same use case: cross-border value transfer for financial institutions. XRP has the larger market cap, the stronger US legal status post-Ripple settlement, more bank-facing distribution through Ripple Payments, and the better-known brand among traditional finance. Some of Stellar’s institutional wins, including portions of MoneyGram’s flow, could just as easily have gone to Ripple. If XRP captures the next wave of bank pilots, XLM struggles to differentiate beyond the developer-friendly Soroban smart-contract layer.

    2. Tokenomics Overhang

    Stellar’s total supply is fixed at 50B XLM, with 34B circulating. The Stellar Development Foundation still controls a meaningful portion of the non-circulating supply and uses it to fund ecosystem development. SDF distributions are predictable, but they are still net new supply hitting the market. Until a clearer burn mechanism or supply-lock policy is in place, XLM trades with a structural sell-pressure tax that XRP, after Ripple’s escrow modifications, partly addressed.

    3. Catalysts Are 2027 Stories

    The biggest 2026 catalysts, DTCC tokenization and a potential XLM ETF, are not actually scheduled for 2026 delivery. DTCC’s stated target is H1 2027. ETF approvals, even after a filing, typically take 240 days. That means much of XLM’s bull case is really a 2027 story being front-run in 2026. If macro conditions stay weak through year-end, XLM could spend the entire year between $0.12 and $0.22 while the underlying thesis quietly improves.

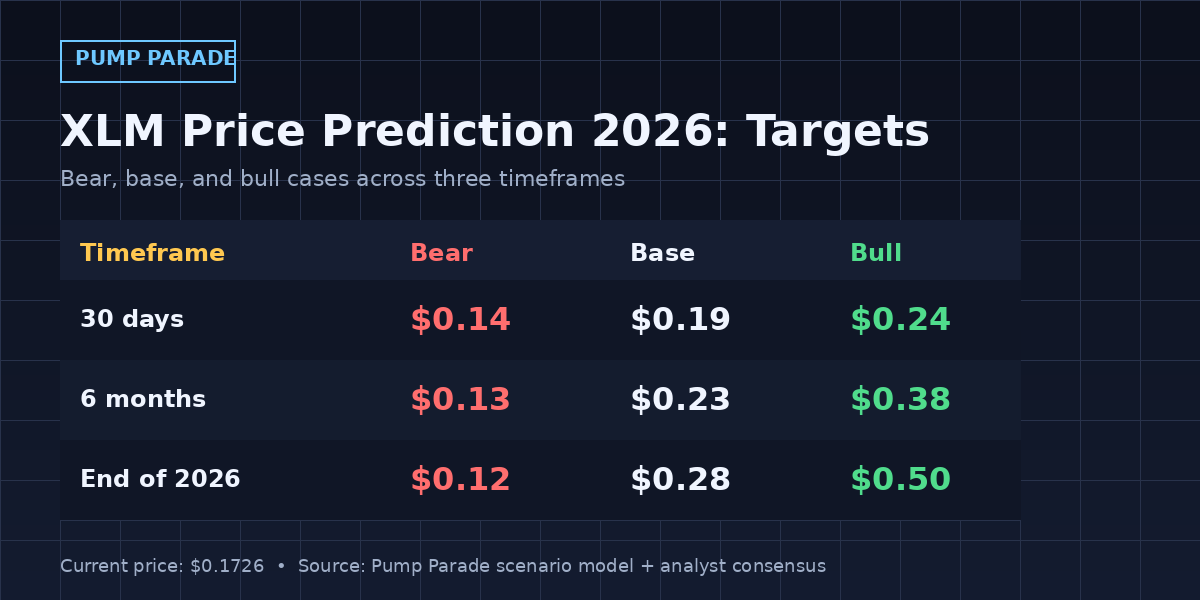
    Stellar (XLM) Price Prediction 2026: Targets by Timeframe

    Stellar (XLM) price prediction 2026 targets table, bear $0.12, base $0.28, bull $0.50

    Our framework breaks the year into three horizons: the next 30 days, the next 6 months, and full-year 2026. Targets cite analyst ranges from Changelly, Coinpedia, and CoinCodex for comparison, plus our own scenario logic.

    Timeframe Bear Base Bull
    30 days $0.14 $0.19 $0.24
    6 months $0.13 $0.23 $0.38
    End of 2026 $0.12 $0.28 $0.50

    Short-Term (30 days)

    RSI on the daily chart is hovering near oversold but has not flipped into a clean reversal signal. Local resistance sits at $0.19, then $0.22. Local support is the $0.15 to $0.16 range that has held twice since April. A bounce to the $0.19 to $0.21 zone over the next month is the most likely path if Bitcoin stabilizes above $58K. A break of $0.15 opens the door to $0.12, where Stellar last traded in mid-2024.

    Medium-Term (6 months)

    By end-of-year 2026, the dominant variable is whether MoneyGram volume on Stellar shows up in network metrics, and whether DTCC publishes a firm timeline. Base case: XLM works back to the $0.22 to $0.28 range, roughly where Changelly’s average and CoinCodex’s median projections cluster. Bull case is $0.38 on the back of a spot ETF filing landing in Q4. Bear case is $0.13 if macro weakness extends and SDF supply hits a tepid bid.

    Full-Year 2026

    For comparison, Coinpedia carries the most aggressive 2026 projection in the SERP at $2.50, conditional on XLM reclaiming both $0.50 and $1.00 as resistance. CoinCodex models XLM trading mostly between $0.18 and $0.20 through 2026. Changelly’s range is $0.22 to $0.38. Standard Chartered has not published a public XLM target. Our base case of $0.28 sits roughly at the midpoint of credible analyst ranges and assumes ETF filing without 2026 approval, plus continued payment volume growth.

    How Does Stellar Compare to XRP?

    The XLM versus XRP comparison is the one every payment-rail bull eventually has to make. Here is how the two stack up on the metrics that matter for an institutional thesis.

    Metric Stellar (XLM) XRP
    Price (current) $0.1726 $1.05
    Market cap $5.86B $65.3B
    Rank #16 #6
    Smart contracts Yes (Soroban, live) Yes (EVM sidechain, live)
    Major bank partners MoneyGram, Mastercard, DTCC Bank of America, SBI, Tranglo
    US ETF status Designated commodity, no spot filing yet Designated commodity, spot ETFs live
    Native stablecoin MGUSD, PYUSD, USDC RLUSD
    Transaction speed 3-5 seconds 3-5 seconds

    XRP is the bigger, better-resourced, more institutionally distributed competitor. Stellar’s argument is that it owns more of the stablecoin issuance and tokenization mindshare in 2026 (PYUSD, MGUSD, DTCC) and trades at roughly an 11x lower market cap. For a comparable thesis on payment-rail tokens with utility catalysts, see our coverage of Chainlink and the SWIFT catalyst.

    What Would Change Our XLM View?

    Three concrete triggers would force us to revise the base case.

    Upgrade trigger: A major issuer (BlackRock, Fidelity, or Grayscale) files an S-1 for a spot XLM ETF in Q3 or Q4 2026. That would push our 2026 bull case from $0.50 toward $0.70 and shift the base case to roughly $0.35.

    Downgrade trigger: DTCC publishes a hard delay on the Stellar tokenization pilot or selects an alternative chain. That would invalidate the highest-conviction long-term catalyst and pull our 2026 bear case toward $0.10.

    Macro trigger: Bitcoin breaks decisively below $52K and stays there for more than two weeks. In that scenario XLM follows the broader risk-off move, and any 2026 base case below the $0.20 line becomes plausible.

    Frequently Asked Questions

    Is XLM a good investment in 2026?

    XLM is a high-beta bet on Stellar capturing institutional tokenization and cross-border payments flow. The fundamental setup is the best it has been in years, but the token price has not yet responded. Risk-tolerant investors with a 2-year horizon may find the current setup attractive. Short-term traders should respect the $0.15 support and resistance overhead.

    Will Stellar reach $1 in 2026?

    A $1 XLM in 2026 is possible but not the base case. It requires roughly a 5.8x move from current prices and at least two of the three major catalysts (DTCC, MoneyGram volume, ETF filing) to land. CoinCodex’s model places the $1 milestone in 2047, while Coinpedia’s bullish case sees $2.50 if multiple resistance levels break. The realistic 2026 ceiling sits closer to $0.50.

    What is the XLM price prediction for 2026?

    Our base case is $0.28 by end of 2026, with a bear case of $0.12 and a bull case of $0.50. Analyst ranges from Changelly ($0.22 to $0.38), CoinCodex ($0.18 to $0.20), and Coinpedia (up to $2.50) bracket those numbers. The wide spread reflects how much hinges on catalyst timing rather than network fundamentals.

    Why is XLM falling in 2026?

    The 30-day drop is mostly macro. Bitcoin is down 18% and Ethereum is down 22% over the same window. Stellar-specific selling from SDF distributions and the lag between institutional partnerships and on-chain XLM demand are secondary factors. The network is growing while the token consolidates, which is a common pattern at altcoin cycle lows.

    Will there be an XLM ETF in 2026?

    A standalone XLM spot ETF is unlikely to be approved in 2026, even if filed. Canary Capital’s mixed altcoin ETF already includes XLM. A major issuer filing for a standalone XLM spot product would itself act as a price catalyst, with approval more likely in 2027. Stellar’s commodity designation from the SEC and CFTC clears the most important prerequisite.

    How is Stellar different from XRP?

    Both target cross-border payments, but Stellar emphasizes open-source smart contracts (Soroban) and stablecoin issuance (PYUSD, MGUSD, USDC), while XRP focuses on bank-facing payment corridors via Ripple. Stellar’s market cap is about 11x smaller, which means more upside if the institutional thesis plays out and more downside if XRP captures the bigger bank deals.

    The Honest Take

    Stellar in 2026 looks like a network with the strongest fundamental setup in its history and a token price that has not noticed yet. The MoneyGram, Mastercard, and DTCC partnerships are real, dated, and on-chain verifiable. The Soroban smart-contract layer is shipping. The commodity designation removes a regulatory tail risk that haunted XRP for years. None of that has translated to price.

    The honest read is that XLM is a slow-build thesis in a market that rewards fast narratives. Token velocity from institutional flows tends to lag adoption by 6 to 12 months. If you are looking for a 10x in 90 days, this is not the trade. If you are looking for a top-20 token with credible institutional partners trading at a 30% discount to its 90-day average, the setup is worth monitoring. Our base case of $0.28 by end-2026 assumes the catalysts work on roughly their announced timelines, which in crypto is itself a bullish assumption. The bull case to $0.50 requires the ETF narrative to ignite. The bear case to $0.12 requires DTCC to slip or stall.

    For traders, the relevant levels are clean: $0.15 support, $0.19 first resistance, $0.22 the line that separates downtrend from base. Manage position size accordingly.

    Disclaimer: This article is for informational and educational purposes only and should not be construed as financial, investment, or trading advice. Cryptocurrency markets are highly volatile, and past performance does not guarantee future results. The price predictions and analyses presented here are based on AI models, technical indicators, and available data at the time of writing, they are not guarantees. Always conduct your own research (DYOR) and consult with a qualified financial advisor before making any investment decisions. Pump Parade and its authors do not assume liability for financial losses incurred based on information provided in this article.
    Hedera (HBAR) Price Prediction 2026: Can HBAR Hit $0.20?

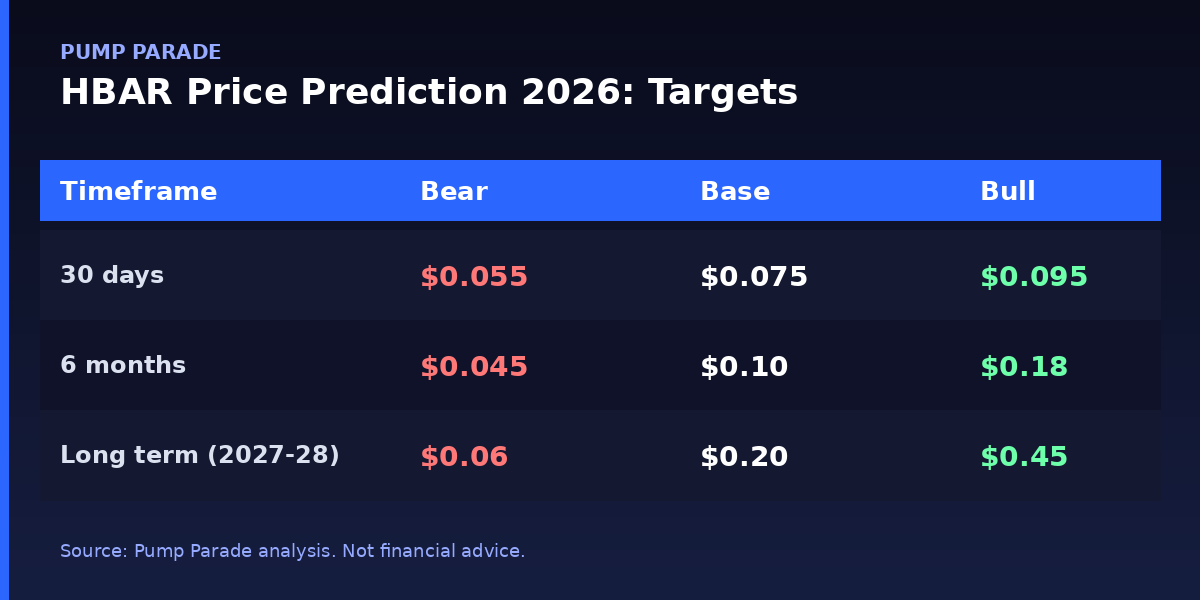
    Hedera (HBAR) is trading at $0.0711 at time of writing, down 23% over the past 30 days and sitting 87% below its 2021 all time high. That is not the chart you would expect from a network that already settled $10 billion in real world assets and now has a U.S. spot ETF trading on Nasdaq. So what gives, and where does the Hedera (HBAR) price prediction 2026 story actually land?

    This article breaks down the data: current market structure, the ETF inflow picture, the RWA narrative, the tokenomics headwind that keeps capping rallies, and three forward scenarios with specific price targets. We will also stack HBAR against XRP, the closest comparable, and walk through the FAQ questions traders are actually searching.

    Key Takeaways

    • HBAR trades at $0.0711 with a $3.1B market cap, ranked #30, down 23% over 30 days.
    • The Canary HBAR ETF (Nasdaq: HBR) launched October 28, 2025, and pulled in roughly $93M cumulative inflows before flows cooled.
    • Bull case for 2026: $0.20 to $0.35 if RWA settlement volume scales and ETF flows reaccelerate.
    • Bear case for 2026: $0.045 to $0.06 if treasury unlocks keep absorbing demand and macro stays risk off.
    • The honest take: HBAR is one of the cleanest enterprise stories in crypto, but token holders still do not capture network revenue.
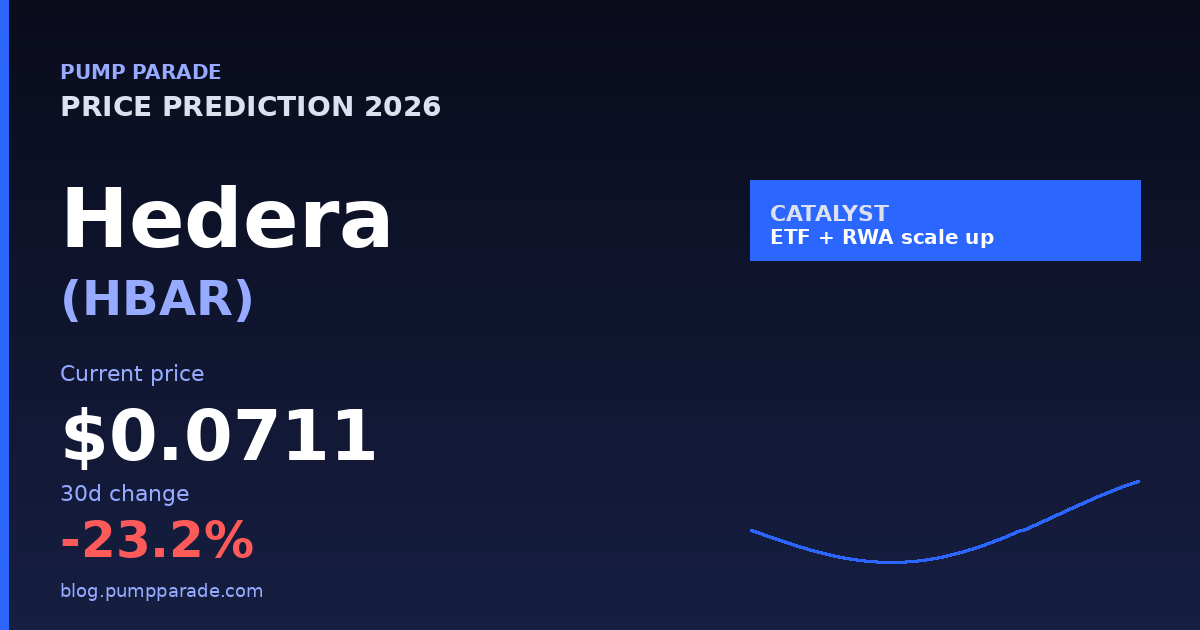
    Hedera (HBAR) price prediction 2026 hero graphic, current price $0.0711, Canary ETF and RWA catalyst

    Where Hedera (HBAR) Stands Today

    Before talking targets, the numbers as of today, sourced from CoinGecko and the Birdeye API. HBAR is the 30th largest cryptocurrency by market cap, a heavyweight by any reasonable definition. But on price, it has been one of the weakest performers among top 30 assets over the past year.

    Metric Value
    Price (USD) $0.0711
    24h change -1.4%
    7d change -10.8%
    30d change -23.2%
    Market cap $3.09B
    24h volume $40.3M
    Rank #30
    All time high $0.5692 (Sept 2021)
    % from ATH -87.5%

    Three numbers to anchor on. First, the 24h volume of $40M against a $3.1B market cap is thin, about 1.3% turnover. That means HBAR is not a top destination for short term traders right now and price discovery is happening with relatively little capital. Second, the 30 day drawdown of 23% is meaningfully worse than Bitcoin (-18%) and Ethereum (-22%) over the same window, so HBAR underperformed even in a generally risk off tape. Third, the gap to the 2021 ATH at $0.57 is the long term ceiling many bulls anchor to, but reclaiming it would require an 8x move from here.

    Why is HBAR price falling right now?

    Three forces are working at the same time, and they reinforce each other. The macro backdrop turned defensive after the June 17 FOMC meeting, where Chair Kevin Warsh signaled higher for longer rates. Bitcoin ETF outflows hit $82M on that day alone, and altcoin liquidity drained with it. HBAR has historically traded as a high beta to BTC, so the pullback was mechanical.

    The second force is supply. Hedera operates a 15 year treasury release schedule that is still active, and quarterly unlocks add fresh HBAR to circulation. With circulating supply at 43.5B and a hard cap of 50B, roughly 6.5B HBAR have yet to enter the market. That is overhang, and it caps rallies until demand can absorb it.

    The third force is rotation. Spot ETF flows in June 2026 concentrated on Hyperliquid, XRP, and Solana, while HBAR’s ETF segment went flat after a brief inflow window. When institutional money rotates, the names without the rotation get sold. That is what happened to HBAR.

    The Bull Case for Hedera in 2026

    1. The ETF wrapper is now live and battle tested

    The Canary HBAR ETF (Nasdaq: HBR) began trading on October 28, 2025, and pulled in roughly $93M in cumulative net inflows through early 2026. That is small compared to BTC or ETH ETF flows, but the wrapper exists, the plumbing works, and any uptick in altcoin ETF demand has a ready vehicle. If 2026 H2 brings a broader risk on rotation, HBR is positioned to capture allocation that previously had no route.

    2. Real world asset settlement is genuinely happening

    Hedera has processed over $10 billion in RWA settlements across tokenized bonds, supply chain tracking, and cross border payments. Partners like Archax (a regulated UK digital securities exchange) and several council members are actively using the Hedera Token Service (HTS) for regulated tokenized instruments. This is one of the few places in crypto where the RWA narrative is grounded in real volume rather than press releases. For deeper context on how this narrative plays out across protocols, our Ondo (ONDO) price prediction covers the same theme from a tokenized treasuries angle.

    3. Council backed governance is a moat

    The Hedera Council includes Google, IBM, LG, Boeing, Mondelēz, and 26 other multinationals. This is a unique governance structure in crypto. It limits decentralization in one sense, but it gives enterprises a comfort zone that pure permissionless chains do not offer. As regulated tokenization ramps, that comfort matters more, not less.

    The Bear Case for Hedera in 2026

    1. Token holders do not capture network revenue

    This is the deepest critique. Hedera generates real activity, but on chain fees are denominated in fractions of a cent, and the network’s economic value largely accrues to council members and treasury operations rather than to HBAR holders. Until that disconnect closes, no amount of RWA volume is going to drive HBAR price proportionally.

    2. Treasury unlocks remain an overhang

    Roughly 6.5B HBAR sit in treasury waiting to be released through the 15 year schedule. Even modest quarterly releases need to be absorbed by buy side demand, and right now that demand is not there. DefiLlama’s unlock tracker shows the cadence in detail and it is a real headwind.

    3. The XRP comparison is unflattering

    Both projects target enterprise rails. XRP cleared its SEC case, has multiple ETFs in flight, and runs at 8x HBAR’s market cap. If institutions want one enterprise focused payments and tokenization play, XRP has more brand, more liquidity, and more existing rails. HBAR has to fight for the second slot. Our XRP price prediction 2026 covers the leader of that pair in detail.

    Hedera (HBAR) Price Prediction 2026: Targets by Timeframe

    Hedera (HBAR) price prediction 2026 targets table, bear $0.045, base $0.20, bull $0.45

    Here is how the data maps to forward scenarios. These are not financial advice, they are a framework for evaluating which path the next 30 days, 6 months, and long term horizon are tracking toward.

    Timeframe Bear Base Bull
    30 days $0.055 $0.075 $0.095
    6 months $0.045 $0.10 $0.18
    Long term (2027-28) $0.06 $0.20 $0.45

    Short term: 30 days

    Near term, HBAR is trying to defend the $0.0711 area, which roughly aligns with the recent low. A clean break below would open the door to $0.055, a level last tested in early 2024. A reclaim of $0.08 with rising volume opens the path to $0.095. Base case is sideways consolidation in the $0.065 to $0.078 range while the market digests macro signals.

    Medium term: 6 months

    By Q1 2027, the picture depends almost entirely on three variables: ETF inflows, RWA volume growth, and whether the broader altcoin tape turns. Base case targets $0.10, a 41% recovery from current levels and a return to the 200 day moving average. Bull case at $0.18 requires sustained ETF inflows north of $20M weekly and at least one major bank announcing HBAR backed tokenized issuance. Bear case at $0.045 would require continued macro pressure and another leg of treasury supply hitting an unprepared market.

    Long term: 2027 to 2028

    This is where the prediction spread is widest. Changelly’s 2026 forecast tops out around $0.45 in optimistic scenarios. Coinpedia goes higher at $1.05. CoinCodex stays conservative at $0.22. Our base case at $0.20 sits roughly at the median of credible long form models, while $0.45 bull case lines up with the prior cycle ATH retest. The $1 question is real but not the central scenario unless tokenization volumes scale by an order of magnitude.

    How does Hedera (HBAR) compare to XRP in 2026?

    If you are weighing HBAR, you are almost always also weighing XRP. Both target enterprise payments and tokenization rails. Both have institutional sponsorship. Both have ETF exposure. But they differ in important ways. For a deeper dive on the tokenization angle that connects both, our Chainlink (LINK) 2026 price prediction walks through the cross chain layer that ties this whole stack together.

    Metric HBAR XRP
    Market cap $3.09B $65.25B
    Rank #30 #6
    Consensus Hashgraph (aBFT) XRP Ledger consensus
    Time to finality 3 to 5 seconds 3 to 5 seconds
    Throughput claim 10,000+ TPS ~1,500 TPS
    Spot ETF (US) Live (Canary HBR) Live and multi sponsor
    Governance 31 Council members Validator network
    Core narrative RWA tokenization Cross border payments

    The honest read: XRP has scale and brand. HBAR has council governance and a credible tokenization niche. For a portfolio, they are complements rather than substitutes. The risk for HBAR is that if institutions consolidate to one enterprise play, XRP has the seat.

    What would change our view on HBAR?

    Three concrete triggers would force a meaningful upgrade to the bullish scenario:

    • Sustained ETF inflows above $20M per week for four consecutive weeks. That would signal a structural allocation shift rather than tactical positioning.
    • A top tier bank announcing HBAR backed tokenized bond issuance. JPMorgan, BNY, or HSBC level. That moves the narrative from pilot to deployment.
    • A clear deceleration in treasury unlocks paired with token burn mechanics. If the supply overhang gets formally addressed, the base case shifts higher.

    Conversely, two triggers would force a downgrade: another major macro shock that drops BTC below $50K, or evidence that ETF flows are permanently structural at sub $5M weekly. Either would push our 6 month base toward $0.06.

    Frequently Asked Questions

    Will HBAR reach $1 in 2026?

    Reaching $1 in 2026 is possible but not our base case. It would require HBAR to roughly 14x from current levels, which has happened historically (2021 cycle peaked at $0.57) but needs a confluence of ETF acceleration, RWA volume scaling, and a broad altcoin season. Our base case for 2026 sits at $0.10, with $0.18 as the upper bound and $0.045 as the downside.

    Is HBAR a good investment in 2026?

    HBAR fits a long term enterprise infrastructure thesis better than a short term trade. The fundamentals (council governance, RWA settlement, ETF availability) are stronger than the recent price suggests, but token holders have a weak claim on network revenue. If you believe regulated tokenization is the next major crypto narrative, HBAR is a credible vehicle. If you want immediate momentum, the chart is not there yet.

    What is the HBAR price prediction for 2026?

    Across credible models, 2026 forecasts range from roughly $0.094 (CoinCodex) to $1.05 (Coinpedia). Our framework: bear case $0.045, base case $0.10 by mid year and $0.20 by year end, bull case $0.18 to $0.45 depending on ETF inflows and RWA scale.

    Is Hedera better than XRP?

    Not better, different. XRP has more scale, more liquidity, and a stronger payments brand. HBAR has council governance and a focused tokenization niche. For most portfolios they complement each other. If forced to pick one in 2026, XRP carries less execution risk while HBAR offers more upside if the RWA thesis plays out.

    Why does HBAR keep underperforming?

    Three reasons. Quarterly treasury unlocks add steady supply pressure. ETF inflows have not yet reached the threshold that would absorb that supply. And the broader altcoin tape has rotated toward names like Hyperliquid, XRP, and Solana, leaving HBAR on the outside. Until at least two of those three flip, expect range bound action.

    Will the HBAR ETF push prices higher in 2026?

    The ETF exists and works (Nasdaq: HBR), which is the prerequisite for any inflow story. But $93M in cumulative inflows is modest. For the ETF to meaningfully push HBAR price, weekly inflows need to consistently exceed $20M. That is achievable if altcoin sentiment turns, but it has not happened yet and is the single biggest swing variable for 2026 price.

    The Honest Take

    Hedera is one of the cleanest enterprise stories in crypto. The technology is real, the council is real, the $10B in RWA settlement is real, and the ETF is real. None of that is hopium. But the gap between network utility and token economics is also real, and the chart is still telling you that buyers have not shown up at scale. The next 90 days are going to be decided by macro and ETF flows more than by anything Hedera itself does. Our base case for 2026 is constructive but not euphoric: $0.10 by mid year, $0.20 by December, with credible paths both up and down from there. Treat it as an infrastructure position, not a momentum trade, and size accordingly.

    Disclaimer: This article is for informational and educational purposes only and should not be construed as financial, investment, or trading advice. Cryptocurrency markets are highly volatile, and past performance does not guarantee future results. The price predictions and analyses presented here are based on AI models, technical indicators, and available data at the time of writing, they are not guarantees. Always conduct your own research (DYOR) and consult with a qualified financial advisor before making any investment decisions. Pump Parade and its authors do not assume liability for financial losses incurred based on information provided in this article.

    Solana (SOL) Price Prediction 2026: Alpenglow Catalyst

    Solana just crossed 100 billion lifetime transactions. No other chain except Internet Computer has hit that number. And yet SOL trades at $71.80 today, roughly 65% below its January 2025 high near $260. Volume is loud. Price is not.

    Solana SOL price prediction 2026 hero graphic showing current price and Alpenglow upgrade catalyst

    That gap is the whole story. The network is busier than it has ever been. Spot SOL ETFs are live in the US. The Alpenglow consensus rewrite is weeks from mainnet. Standard Chartered still carries a $250 SOL target for end of 2026. But ETF flows turned slightly negative this week, and SOL has spent most of June pinned in a tight range. Bulls and bears are both arguing the same chart.

    This piece walks through what the data actually says: where SOL trades today, the catalysts in play, the bear arguments worth respecting, and a price prediction band for 30 days, 6 months, and 2027 to 2028. It is built on live Birdeye market data and verified network developments, not vibes.

    Where SOL Stands Right Now

    According to CoinGecko market data, Solana is trading at $71.76 with a market cap of $41.67 billion. That keeps SOL at #7 in crypto by market cap, behind BNB and ahead of TRON. The token is up 4.05% in the last 24 hours.

    The on-chain story is louder than the price suggests. Birdeye is showing $4.10 billion in 24 hour SOL trading volume across Solana DEXs, the highest of any token on the network. Pool liquidity for the main SOL pair sits near $4.59 billion. Stablecoin supply on Solana keeps grinding higher. None of that screams “dead chain.”

    The macro setup is mixed. Bitcoin is back above $60,000. ETH has reclaimed $1,580. Risk appetite is creeping back into majors. But altcoin breadth is still narrow, and SOL has not yet broken out of its multi-month range.

    The Bull Case: Three Catalysts That Actually Matter

    1. Alpenglow Is Close

    Alpenglow is the biggest consensus overhaul Solana has shipped. It targets a finality time of roughly 150 milliseconds, down from the 12 second range that SOL has lived with for years. For context, Ethereum’s slot time is 12 seconds. Visa settles in seconds. Alpenglow lands the chain in the milliseconds.

    The Solana Foundation is targeting a Q3 2026 mainnet activation. If that schedule holds, the upgrade goes live in roughly two months. Faster finality unlocks two things: real time payments at scale, and high frequency on-chain trading that currently lives off-chain or on app specific chains like Hyperliquid. Both are real revenue stories, not narratives.

    2. Firedancer Reliability

    Solana’s reputation problem has always been outages. Firedancer is the second validator client, built by Jump Crypto, and its job is to fix that. The hybrid version, Frankendancer, is already live on a meaningful share of the validator set. Full Firedancer rollout continues through 2026.

    Two independent clients running the same network is the standard institutional checklist item for treating a chain as serious infrastructure. Once Firedancer is fully active, that box is checked.

    3. Spot ETF Pipes Are Open

    US spot Solana ETFs are live. Cumulative net inflows have crossed $1.13 billion since launch. That is real, sticky institutional capital, even if recent days have shown small outflows of around $3.94 million.

    The flow direction matters less than the existence of the rails. ETFs have given pension funds, RIAs, and corporate treasuries a path to SOL exposure that does not require touching a wallet. That structural change does not show up in a single week of net flows. It shows up in the slow grind of cost basis over quarters.

    The Bear Case: What Could Break

    A balanced take requires looking at what could go wrong. Three risks deserve real weight.

    Revenue gap with ETH. Solana processes more transactions per day than Ethereum, by a wide margin. But network revenue, the fees the chain actually captures, still trails ETH. If that gap stays open, the bullish “Solana eats Ethereum” thesis runs into a wall of TradFi fundamental investors who care about cash flow more than throughput.

    Technical support is thin. Analysts watching the weekly chart point to the $60 to $65 zone as the line that matters. A weekly close below that band opens the door to a fast move toward $25 to $30. That is roughly 65% downside from current levels. The catalyst for that move would likely be a broader crypto risk off event, not anything Solana specific.

    L2 and app chain competition. Hyperliquid keeps eating perp DEX volume. Base keeps pulling consumer apps. If high value DeFi activity migrates to specialized chains, Solana could be left handling memecoin churn and stablecoin payments, both lower margin businesses than what bulls are modeling.

    Technical Outlook

    SOL is range bound. The token has held above $65 for most of June and has rejected from the $80 to $85 zone several times. That price action defines two clean levels.

    Upside: a confirmed weekly close above $85 likely opens a path to $120, the next significant supply zone from late 2025. From there, the $150 level becomes the test of whether SOL is in a real cycle.

    Downside: losing $65 on a weekly close is the bear trigger. The $40 to $45 region would be the next demand zone. Below that, the chart is open back toward $25.

    RSI on the daily is neutral. Funding rates on perps are roughly flat. There is no clear positioning bias right now, which usually means the next move comes from a catalyst, not from technical exhaustion.

    Price Predictions: 30 Days, 6 Months, 2027 to 2028

    The forecast band below blends current price action, Alpenglow timing, ETF flow assumptions, and broader market scenarios. Each row shows a bear, base, and bull case.

    Solana SOL price prediction 2026 targets table showing bear, base and bull cases for 30 days, 6 months, and 2027 to 2028

    30 day view (July 2026): Bear $58, Base $78, Bull $95. The base case assumes range continuation with a modest grind higher into Alpenglow anticipation. The bull case requires a clean break of $85 on Alpenglow news. The bear case is a broad crypto pullback that drags SOL with it.

    6 month view (end of 2026): Bear $45, Base $135, Bull $220. The base case assumes Alpenglow ships, ETF inflows resume, and altcoin breadth improves. The bull case approaches Standard Chartered’s $250 target. The bear case is a deeper macro reset and a failed Alpenglow rollout.

    2027 to 2028 view: Bear $80, Base $260, Bull $480. The long term base case assumes Solana retains its position as the leading high throughput L1 and captures a meaningful share of on-chain payments and consumer apps. The bull case requires Solana to genuinely close the revenue gap with Ethereum. The bear case is sustained L2 and app chain pressure plus regulatory friction on staking.

    For ecosystem context, Jupiter’s role as the dominant Solana DEX aggregator matters here. Our recent Jupiter (JUP) price prediction covers the same flow data that drives SOL fees. The two move together more than the price action suggests.

    What Would Change Our View

    Three things would force a rewrite of the base case.

    First, an Alpenglow delay past Q4 2026 would knock the 6 month target down by roughly 20%. The market is already pricing in some of the speed upgrade. A slip pushes that premium out.

    Second, a sustained week of ETF outflows above $50 million per day would suggest the institutional thesis is breaking. That has not happened. If it does, the 2027 base case moves toward the bear band.

    Third, a clean weekly close above $100 would mean the range is broken and the bull case is in play. At that point, the question becomes how fast SOL gets to $150, not whether it can.

    The Honest Take

    Solana is one of the most interesting risk reward setups in crypto right now. The network is doing more volume than ever. The two biggest technical risks, finality and validator reliability, are both being fixed in real time. ETF rails are live. And the price is roughly flat on the year while the fundamentals have improved.

    That is the bull pitch in a sentence. It is also why the bear pitch matters. The same setup that looks like a coiled spring can look like a value trap if Alpenglow disappoints, ETF flows stall, and the broader market refuses to rotate into alts.

    SOL is a setup worth watching closely through Q3 2026. It is not a “buy now or miss it” trade. It is a positioning decision with clear levels: $85 changes the upside math, $65 changes the downside math. Size accordingly.

    Disclaimer: This article is for informational and educational purposes only and should not be construed as financial, investment, or trading advice. Cryptocurrency markets are highly volatile, and past performance does not guarantee future results. The price predictions and analyses presented here are based on AI models, technical indicators, and available data at the time of writing. They are not guarantees. Always conduct your own research (DYOR) and consult with a qualified financial advisor before making any investment decisions. Pump Parade and its authors do not assume liability for financial losses incurred based on information provided in this article.
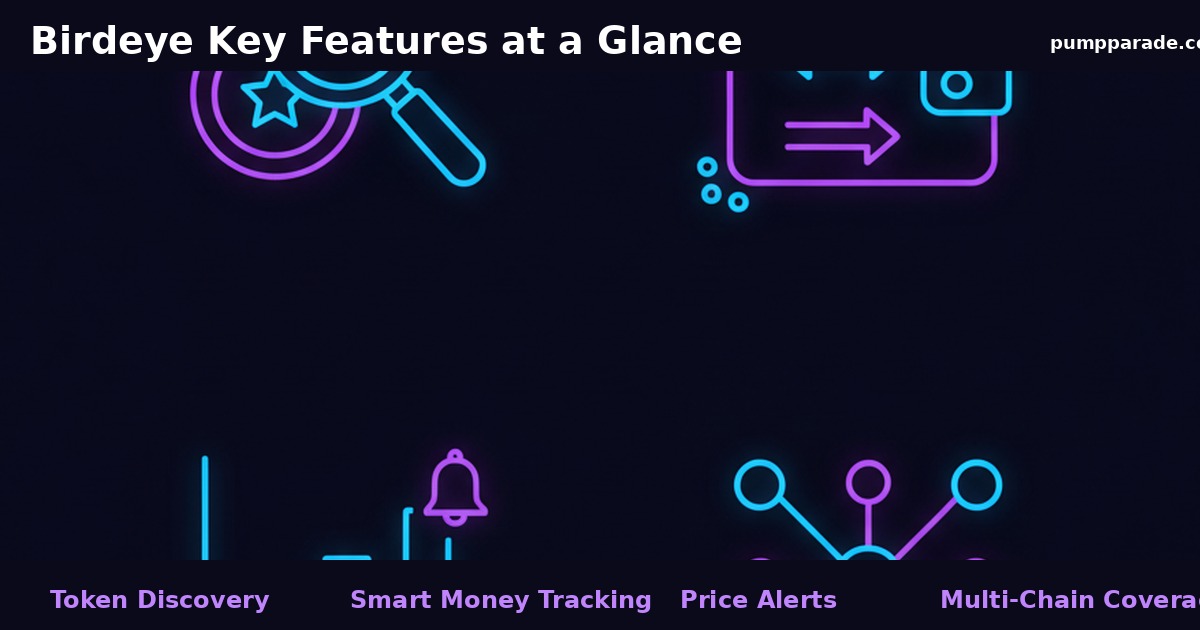
    Ondo (ONDO) Price Prediction 2026: Can ONDO Hit $1?

    0

    Ondo Finance (ONDO) is trading at $0.31 today, down 13.8% over the past week and down 85% from its December 2024 all-time high of $2.14. The token looks weak on the chart. But the protocol behind it just had one of the biggest weeks in real-world asset (RWA) history.

    On June 25, Ondo flipped on 24/7 minting and redemption for tokenized U.S. stocks and ETFs. A week earlier it added 173 new tokenized stocks, pushing Ondo Global Markets past 430 onchain assets. The Perps public beta went live on June 9 with 20x leverage on tokenized equities. TVL crossed $1 billion. And the team brought in John Hoffman, a former Invesco ETF chief, to run product expansion.

    So why is the price still in the gutter? And can ONDO actually reclaim $1 in 2026? Our AI model breaks down both sides.

    Ondo Finance (ONDO) price prediction 2026 hero image

    What Is Ondo Finance? A Quick Primer

    Ondo Finance is the largest pure-play RWA protocol by tokenized assets. In plain terms, it brings traditional financial products like U.S. Treasuries, stocks, and ETFs onto the blockchain in a regulated, institutional wrapper. Think of it as a bridge between TradFi compliance and DeFi composability.

    Two products do most of the heavy lifting:

    • OUSG and USDY: Yield-bearing tokens backed by short-term U.S. Treasuries. Used by institutions and onchain treasuries.
    • Ondo Global Markets (OGM): Tokenized equities and ETFs (430+ assets as of June 2026) tradable onchain, available to non-U.S. users.

    The ONDO token is the governance asset for the broader ecosystem. It does not capture protocol fees today, which is the main reason the token has lagged the actual business growth.

    Current Price Context: Weak Chart, Strong Business

    Here are the numbers at time of writing:

    • Price: $0.31
    • Market cap: ~$1.49 billion
    • 24h volume: $88.8 million (up 18.6% vs. yesterday)
    • 7-day change: -13.8%
    • 14-day RSI: ~41 (neutral, leaning oversold)
    • 50-day moving average: ~$0.38
    • Key support: $0.29
    • Key resistance: $0.37, then $0.40, then $0.42

    The setup is classic: business KPIs are exploding, the chart looks tired, and the token is trading well below its long-term moving average. That kind of divergence usually resolves in one of two directions. Either the chart catches up to the fundamentals, or the fundamentals get repriced lower.

    For context on how regulated, institution-driven catalysts have played out recently in this market, see our breakdown of the SWIFT catalyst for Chainlink (LINK). Same theme, different protocol.

    The Catalysts That Matter (And Why The Token Is Lagging Them)

    1. 24/7 Minting and Redemption Goes Live

    On June 25, Ondo became the first RWA platform to enable instant 24/7 mint and redeem on tokenized U.S. stocks and ETFs. It launched with six assets: SPYon (S&P 500), QQQon (Nasdaq 100), NVDAon, TSLAon, GOOGLon, and CRCLon. Ethereum and BNB Chain went first. Solana is next.

    Why this matters: U.S. stock markets close on weekends and overnight. A weekend-tradable, instantly redeemable version of NVDA is a genuine new product, not a wrapper. For non-U.S. traders who want exposure to U.S. equities without a brokerage account, this is meaningful.

    2. 173 New Tokenized Stocks Added

    On June 18, Ondo expanded the Global Markets lineup from roughly 250 assets to 430+. The new additions focused on AI, robotics, quantum, defense tech, critical materials, and data center energy. That is a deliberate menu, not random.

    Translation: Ondo is positioning to capture the trade themes that institutional flow is already chasing. If the AI and defense rallies hold into Q4, the tokenized versions get pulled along.

    3. Perpetuals Public Beta

    Launched June 9, Ondo Perps lets non-U.S. users trade tokenized stocks and ETFs with up to 20x leverage onchain. This is a direct shot at centralized perp DEXs and a new revenue surface for the ecosystem. Volume here is the metric to track.

    4. Institutional Hires

    John Hoffman, who ran ETF and index strategy at Invesco and was a managing director at Grayscale, joined to lead product expansion. That is the kind of hire you make when you plan to file for tokenized fund structures and want a serious resume in front of regulators.

    5. The Macro Setup

    Standard Chartered published a forecast in mid-June projecting the tokenized asset sector could reach $2.7 trillion by 2030. Ondo is the most visible public-market proxy for that thesis. Narrative tailwinds matter when ETFs eventually file for RWA exposure.

    Why ONDO Token Is Lagging the Protocol

    Here is the bear case in one sentence: the token does not capture value yet.

    OUSG and USDY generate fees, OGM generates spreads, Ondo Perps will generate funding and trading fees. None of that currently flows to ONDO holders. Governance proposals to change this have been discussed but not enacted.

    Until a fee switch or buyback mechanism is approved, ONDO trades on narrative and supply pressure rather than cash flow. Token unlocks remain a headwind into late 2026, with periodic releases that have historically marked local tops.

    This is the same pattern that held back UNI for years. It can change quickly when governance acts, but it has not changed yet.

    Technical Outlook

    The chart is mixed. The 14-day RSI near 41 says ONDO is closer to oversold than overbought, but not yet in deep capitulation territory. MACD remains modestly bullish on the daily, hinting at a slowing of the downtrend.

    Key levels to watch:

    • $0.29: Multi-month horizontal support. A clean break below opens the door to $0.24.
    • $0.37 to $0.40: The first major resistance zone. Reclaiming this would put bulls back in control and bring the 50-day MA into play.
    • $0.42: The next supply wall. A weekly close above here would shift the structure from bearish to neutral-bullish.
    • $0.55: The next major target if a trend reversal confirms.

    For a fundamentals primer on Ondo’s tokenized product line, the CoinGecko ONDO page tracks live price, TVL, and exchange flow.

    ONDO Price Predictions by Timeframe

    Our hybrid AI model blends technical structure, catalyst probability, and token unlock pressure. Here is what it produces.

    ONDO price prediction targets table

    Short-Term (30 Days)

    • Bear: $0.24 if $0.29 support fails on a daily close, dragged down by broad altcoin weakness.
    • Base: $0.34 as oversold conditions cool and traders front-run the Solana 24/7 mint rollout.
    • Bull: $0.45 if a major governance proposal on fee capture gets formally tabled, or if a U.S. spot RWA ETF filing surfaces.

    Mid-Term (6 Months)

    • Bear: $0.22 if BTC enters a deeper correction and RWA narrative cools.
    • Base: $0.55 driven by Perps revenue ramp, continued asset additions, and a reclaim of the 50-day MA.
    • Bull: $0.85 if Ondo enacts any form of value accrual to ONDO and U.S. tokenized-stock approval gets clearer under the CLARITY framework.

    Long-Term (2027 to 2028)

    • Bear: $0.30 if RWA fragments across many protocols and Ondo loses its first-mover lead.
    • Base: $1.20 if Ondo remains the leading public-market RWA proxy and the sector tracks half of StanChart’s forecast.
    • Bull: $2.50 if ONDO captures protocol fees, U.S. retail access opens for tokenized equities, and TVL pushes toward $10B.

    What to Watch Next

    Three triggers will tell you which scenario is playing out:

    1. Governance proposal on value accrual. Any formal motion to direct fees or buybacks to ONDO holders is the single biggest re-rating event possible.
    2. Solana 24/7 mint launch. Solana brings volume. Watch for the announcement and the first-week trading data.
    3. Ondo Perps weekly volume. If Perps clears $100M weekly volume by end of Q3, the bull case strengthens.

    The Verdict

    Ondo is winning the RWA category by every metric except the one that matters most to token holders: the token price. The fundamentals are real, the catalysts are stacking, and the team is hiring like a company preparing for institutional product launches.

    The bull case is straightforward: ONDO is the cleanest public-market proxy for the tokenization narrative, and that narrative has real customers. The bear case is also straightforward: until ONDO captures protocol revenue, it is a story stock with unlock pressure.

    The setup near $0.29 to $0.31 looks asymmetric. Downside is bounded by support and the strength of the underlying business. Upside requires a single governance catalyst or a clearer U.S. regulatory path. That is a setup worth watching, not chasing.

    Disclaimer: This article is for informational and educational purposes only and should not be construed as financial, investment, or trading advice. Cryptocurrency markets are highly volatile, and past performance does not guarantee future results. The price predictions and analyses presented here are based on AI models, technical indicators, and available data at the time of writing, they are not guarantees. Always conduct your own research (DYOR) and consult with a qualified financial advisor before making any investment decisions. Pump Parade and its authors do not assume liability for financial losses incurred based on information provided in this article.
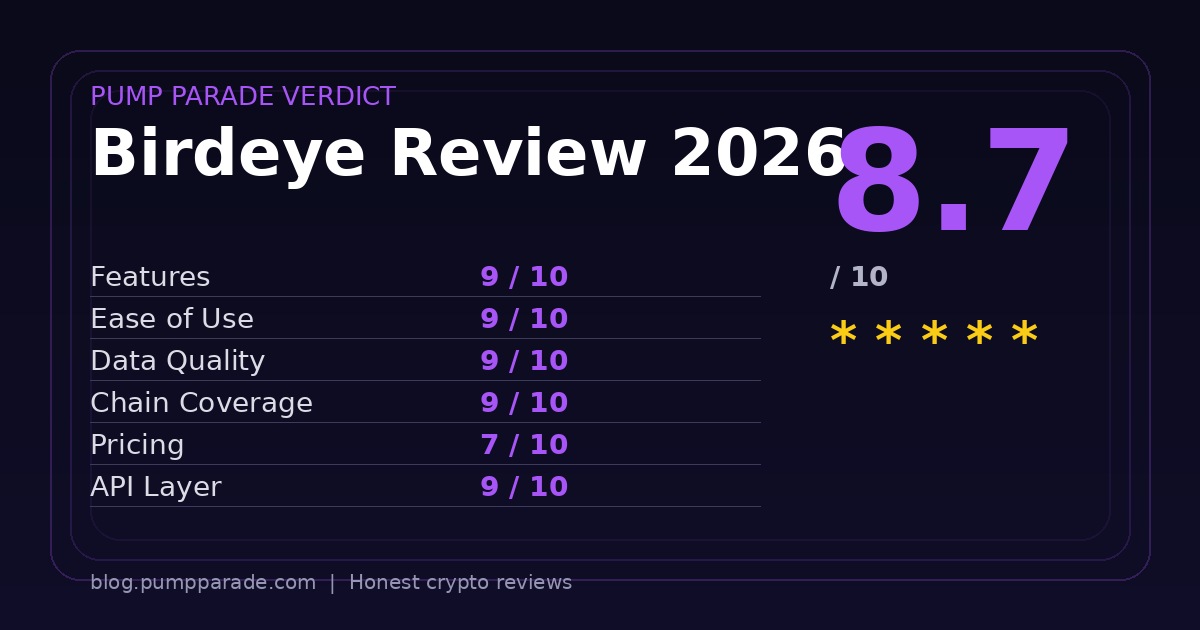
    Kraken vs Bitget: Best Crypto Exchange in 2026?

    0

    Picking between Kraken and Bitget is one of those choices that looks simple until you actually try to do it. Both are tier-one centralized exchanges. Both have been around long enough to mean something. Both will happily take your USDT. But they sit at opposite ends of the spectrum: Kraken is the conservative, US-regulated veteran built around security and Pro-grade tools, while Bitget is the aggressive, derivatives-heavy newcomer that has quietly become the largest copy trading venue in the world.

    In this 2026 head-to-head we break down fees, supported coins, security posture, regional access, and the features that actually matter when you are choosing a primary exchange. By the end you will know exactly which one fits your style.

    Quick Verdict (TL;DR)

    Choose Kraken if: you are a US trader, you prioritize regulatory clarity and security, or you want a no-nonsense spot exchange with deep liquidity on majors.

    Choose Bitget if: you live outside the US, you want lower default spot fees, you trade derivatives, or you want to follow elite copy traders from inside a single account.

    For most non-US traders we lean Bitget on pure value and product breadth. For US traders or anyone who treats an exchange like a bank, Kraken is the safer pick. Read on for the full breakdown.

    Kraken exchange logo

    VS

    Bitget exchange logo

    Kraken Overview

    Kraken launched in 2011 out of San Francisco and is one of the longest-running crypto exchanges in continuous operation. It serves clients in 190+ countries, supports more than 500 cryptocurrencies, and is regulated across multiple US states as well as in the UK, the EU and Australia.

    The big selling point has always been the same: Kraken has never suffered a platform-wide hack across its 14+ year history, which is a claim very few exchanges can make. The platform offers spot trading, margin, futures, on-chain staking, NFTs, and a separate Pro interface with full order-book depth and advanced order types.

    Bitget Overview

    Bitget launched in 2018 and is now headquartered in Seychelles. It serves users in over 150 countries (with the notable exception of the United States) and lists more than 1,300 cryptocurrencies, including a long tail of new-issue tokens that Kraken will not touch.

    Bitget’s identity in 2026 is built around two things: derivatives and copy trading. It hosts more than 190,000 verified elite traders with 800,000+ followers and has processed over 100 million copy trades. It also runs a $300 million on-chain Protection Fund, one of the largest insurance pools in the industry, and publishes monthly Proof-of-Reserves reports.

    Features Deep Dive

    Spot Trading

    Both exchanges cover the spot basics well, but the experience is different. Kraken splits its product into a friendly retail app and Kraken Pro, which is where serious traders actually live. Pro gives you full order books, advanced order types (stop-limit, trailing stop, OCO, iceberg), TradingView charts, and conditional close orders.

    Bitget runs a unified interface that already includes a Pro-style trading view by default, plus a Unified Trading Account that lets one balance act as collateral across spot, margin and futures. If you bounce between products, that single-account model is genuinely useful.

    Derivatives

    This is where the gap widens. Bitget is, first and foremost, a derivatives exchange. It offers USDT perpetuals, coin-margined perpetuals, and now CFD copy trading across forex, commodities and indices. Leverage on crypto perps goes up to 125x on majors. Daily derivatives volume regularly exceeds $10 billion.

    Kraken offers futures too, but the product is narrower, leverage is capped lower (50x on majors), and the focus is clearly on regulated, institutional-friendly access rather than the kind of high-leverage degen trading Bitget caters to.

    Copy Trading

    Bitget effectively invented modern crypto copy trading as a first-class product, and it shows. You browse a leaderboard of elite traders ranked by ROI, drawdown, win rate, and follower P&L. Click follow, set your allocation, and your account mirrors their trades in real time. Profit-sharing fees range from 8% to 10% of profits paid to the lead trader.

    Kraken does not currently offer native copy trading. If that workflow matters to you, Bitget wins by default.

    Staking and Earn

    Kraken offers on-chain staking on roughly 20+ assets (SOL, ETH, ADA, DOT, ATOM and others), with rewards paid out twice weekly. Yields on major proof-of-stake assets sit roughly in line with native network rates. US users have lost access to some staking products following past SEC settlements, so check your region.

    Bitget runs PoolX, Launchpool and Shark Fin structured products alongside flexible and locked savings. Yields on stablecoins tend to be higher than Kraken’s, but the products are also more variable and less standardized.

    Mobile Apps

    Both apps are polished. Kraken Pro mobile is one of the cleaner pro-grade trading apps in the market and is the same product as desktop. Bitget’s mobile app is the most-used surface on the platform and ships frequent updates, including in-app copy trading management, which is hard to find anywhere else.

    Fees and Pricing

    On paper Bitget is dramatically cheaper for new traders. Default spot fees on Bitget are 0.10% maker / 0.10% taker versus Kraken’s entry tier of 0.25% maker / 0.40% taker. That is more than 2x the cost on Kraken before any volume discounts.

    The picture changes at higher volumes. Both exchanges drop fees aggressively as 30-day volume climbs:

    • Kraken top tier: 0.00% maker / 0.05% taker (requires >$10M monthly volume on the public schedule; institutional desks can do better).
    • Bitget VIP7: 0.00% maker / 0.030% taker, falling to 0.024% taker for BGB token holders.

    For futures, Bitget charges 0.020% maker / 0.060% taker on USDT perps at the standard tier. Kraken Futures is broadly competitive but most retail users will find Bitget’s schedule lower out of the gate.

    Hidden costs to watch: Kraken’s instant-buy widget (the simple buy/sell flow inside the app) applies a 1.5% convenience fee plus a 0.9% spread for stablecoins or 1.5% for crypto, which adds up fast if you do not use Pro. Bitget’s “Quick Buy” similarly carries a wider spread than the order book. In both cases, the fix is to use the actual trading interface rather than the one-click buy flow.

    Comparison Table

    Here is the head-to-head at a glance:

    Kraken vs Bitget feature and fee comparison table

    And in full text form:

    Feature Kraken Bitget
    Founded 2011 (San Francisco) 2018 (Seychelles)
    Spot fees (entry tier) 0.25% / 0.40% 0.10% / 0.10%
    Spot fees (top tier) 0.00% / 0.05% 0.00% / 0.024%
    Cryptos listed 500+ 1,300+
    Countries supported 190+ 150+
    US access Yes (most states) No
    Max leverage (perps) 50x 125x
    Copy trading No Yes (190K+ elite traders)
    Insurance / Protection No platform-wide hack since 2011 $300M Protection Fund
    Proof of Reserves Yes (semi-annual Merkle audits) Yes (monthly)
    Native token None BGB (20% fee discount)

    Security and Trust

    Kraken’s pitch is simple: a 14+ year track record with no platform-wide hack. The company holds the bulk of customer assets in air-gapped cold storage, runs continuous third-party security audits, and publishes semi-annual Merkle-tree Proof-of-Reserves attestations. It is also one of the few exchanges that maintained operational continuity through every major crypto winter without freezing withdrawals.

    Bitget’s security model is more modern: $300 million on-chain Protection Fund, monthly Proof-of-Reserves with collateralization typically above 150% on top assets, cold-wallet majority storage, mandatory 2FA, and withdrawal whitelists. It does not have Kraken’s decade-plus track record, but it has not suffered a major exchange-level breach either.

    Net: both pass the “would I keep meaningful balances here” test. Kraken edges Bitget on raw history and regulatory standing; Bitget edges Kraken on transparency cadence and the size of its explicit insurance pool.

    User Experience

    Kraken is the better choice for traders who want clean, conservative tooling and don’t need a dozen tabs of products. Kraken Pro’s charting, hotkeys, and order workflow are first-rate. The downside is the split between the simple app and Pro, which can confuse beginners about which they should actually be using.

    Bitget’s UI is busier. There is more product to expose: spot, margin, perps, copy trading, launchpad, earn, P2P, and a Web3 wallet. Once you adjust to it, the unified account model is a real ergonomic win, especially if you frequently move between spot and perps. The mobile app in particular is best-in-class for derivatives.

    Pros and Cons

    Kraken

    Pros:

    • 14+ years with no platform-wide hack
    • Regulated in the US, UK, EU, Australia
    • Excellent Pro trading interface
    • Deep liquidity on major pairs
    • Transparent, no-token business model

    Cons:

    • Higher default spot fees
    • Smaller coin selection (500 vs 1,300)
    • No copy trading
    • Confusing split between Kraken and Kraken Pro
    • US users have reduced staking access

    Bitget

    Pros:

    • Lower default spot fees (0.10% flat)
    • 1,300+ tokens including long-tail listings
    • Best-in-class copy trading product
    • $300M Protection Fund
    • Unified Trading Account across spot, margin, perps

    Cons:

    • Not available in the US
    • Younger track record (since 2018)
    • Aggressive UI can overwhelm beginners
    • High leverage products invite risk
    • BGB token tied into fee discounts adds complexity

    Verdict and Use-Case Ratings

    Best for US traders: Kraken. There is no contest here because Bitget does not serve US customers. If you want Bitget-style features in the US, look at Coinbase Advanced or wait for compliant alternatives.

    Best for low-fee spot trading: Bitget. The flat 0.10% schedule beats Kraken’s default fees by a wide margin, and Bitget’s top tier is also slightly cheaper.

    Best for derivatives traders: Bitget. Deeper futures liquidity, higher leverage, and a more complete product surface.

    Best for copy trading: Bitget. Kraken does not compete in this category at all.

    Best for security-first long-term storage: Kraken. The longer track record and regulatory clarity matter when you are holding for years rather than weeks.

    Best for altcoin hunters: Bitget. With more than 1,300 listings and a launchpad, you will find tokens here that Kraken simply does not list. If your alt-hunting also extends to Solana memecoins, you may want to pair an exchange with a dedicated bot. Our Photon vs BullX comparison covers the on-chain side.

    Overall: For non-US traders, Bitget is the better all-rounder in 2026 thanks to lower fees, broader product range, and the copy trading moat. For US users and security-conscious holders, Kraken remains the safest pick. Many active traders end up using both: Kraken for cold-stored majors, Bitget for active trading and altcoin exposure.

    Ready to open an account? Visit Kraken or Visit Bitget to see current promotions and fee schedules in your region.

    FAQ

    Is Bitget available in the US?

    No. Bitget does not accept US-based customers and geo-restricts access. Using a VPN to bypass this is a violation of terms of service and could result in account closure or seizure of funds.

    Is Kraken or Bitget cheaper?

    For most retail traders, Bitget is meaningfully cheaper out of the gate (0.10% flat versus Kraken’s 0.25% / 0.40% entry tier). At very high volumes the two converge, with Bitget VIP7 still slightly cheaper than Kraken’s top public tier.

    Which exchange has better security?

    Kraken has the longer track record (no platform-wide hack since 2011) and stronger regulatory positioning. Bitget has a larger explicit insurance pool ($300M Protection Fund) and more frequent Proof-of-Reserves reporting. Both are in the top tier of CEX security in 2026.

    Can I copy trade on Kraken?

    No. Kraken does not offer native copy trading. If copy trading is important to you, Bitget is the obvious pick, with 190,000+ elite traders and 800,000+ followers on the platform.

    Which has more coins listed?

    Bitget lists 1,300+ cryptocurrencies versus Kraken’s 500+. Bitget’s listings include more new-issue and long-tail altcoins, which is a feature if you trade them and a risk if you don’t.

    For more reviews and head-to-heads of the platforms shaping crypto in 2026, browse the rest of the Pump Parade reviews section. We publish a new review or comparison twice a week.

    Chainlink (LINK) Price Prediction 2026: SWIFT Catalyst

    Chainlink (LINK) trades at $7.48 as of June 25, 2026. The token is down 7% over the past week, down 21% in 30 days, and down 44% over the last year. Yet the network underneath that price keeps shipping. Chainlink just joined Project Pangea, a settlement consortium of 50-plus global banks managing over $10 trillion in assets. SWIFT also confirmed an H1 2026 MVP for cross-border payments using Chainlink CCIP as the interoperability layer.

    That gap between token price and protocol traction is exactly the kind of setup our AI models flag. So what is LINK actually worth by year-end, by mid-2027, and by 2028? Let’s break it down with the data.

    Chainlink LINK price prediction 2026 chart and current price summary

    Chainlink (LINK) Snapshot: The Numbers Right Now

    Before we talk targets, here are the receipts. All data is from June 25, 2026.

    • Price: $7.48
    • 24h range: $7.13 to $7.63
    • Market cap: $5.59 billion (rank 20)
    • 24h volume: $294.9 million
    • Circulating supply: 748.1 million LINK out of a 1 billion cap
    • All-time high: $52.70 (May 2021)
    • 30-day change: minus 21%
    • 1-year change: minus 44%

    Translation: LINK has been bleeding while the broader market has chopped sideways. But the network is doing more work than ever. CoinGecko shows trading volume holding above $290 million on a red day, which signals real liquidity rather than a wind-down.

    What Chainlink Actually Does, In Plain Terms

    Most people know Chainlink as “the oracle network.” Here is what that means in practice. Smart contracts on Ethereum, Solana, or any other chain cannot see outside data on their own. They cannot read a stock price, a Treasury yield, or a SWIFT message. Chainlink runs a decentralized network of nodes that fetches that data, signs it, and pushes it on-chain.

    That price feed business is the legacy product. The growth story now sits in two newer rails:

    • CCIP (Cross-Chain Interoperability Protocol): moves messages and tokens between blockchains. It also bridges traditional finance systems like SWIFT into on-chain settlement.
    • Chainlink Runtime Environment and SmartData: the layer that lets banks plug verified off-chain data, identity, and reserves into tokenized assets.

    Both of these matter because the next big crypto narrative is real-world asset tokenization. And Chainlink is the plumbing the banks keep choosing.

    The Catalysts Driving the Next LINK Move

    1. Project Pangea: 50-Plus Banks, $10 Trillion AUM

    Chainlink confirmed its role inside Project Pangea, a consortium working on T+0 cross-border settlement using ISO 20022 standards. The bank list includes European and South Korean institutions, with combined assets above $10 trillion. If even a fraction of that settlement flow routes through CCIP, fee revenue for the protocol grows in a way that has nothing to do with crypto cycles.

    2. SWIFT MVP With 40-Plus Banks

    SWIFT confirmed an H1 2026 minimum viable product for a blockchain-based payment scheme. Over 40 banks are involved. Chainlink CCIP is the interoperability layer. This is the same SWIFT that handles roughly $5 trillion in daily message volume globally. The integration is a multi-year roadmap, not a single launch, but each milestone tends to move LINK.

    3. CCIP Volumes Are Already Compounding

    Industry trackers peg CCIP at around $18 billion in monthly volume. That is up from effectively zero two years ago. As more chains and tokenized assets plug in, that volume curve compounds. Revenue from CCIP flows back into the protocol, with a portion supporting the new Chainlink Reserve mechanism.

    4. Spot LINK ETF Is Live But Quiet

    Spot LINK ETFs do exist, with cumulative inflows around $120 million and net assets near $105 million. That is small compared to BTC and ETH ETFs. It is also a starting line, not a finish line. A single quarter of $200 million in net inflows would shift the supply story for a token with under 750 million circulating units.

    Technical Picture: Where LINK Sits on the Chart

    Let’s keep this readable. LINK is in a clear downtrend on the daily chart. Price sits below the 50-day moving average and below the 200-day moving average. Both moving averages are sloping down. That is a bearish structure.

    Three levels matter most right now:

    • $7.00 to $7.20: immediate support. LINK has tagged this zone three times in the last six weeks without losing it.
    • $6.00: the deeper support shelf. Analysts at BanklessTimes flag this as the line in the sand, below which a flush to $5 becomes possible.
    • $9.50 to $10.00: the first major resistance. Reclaiming this would flip the medium-term structure bullish.

    The RSI (Relative Strength Index, a momentum gauge that runs 0 to 100) sits in the mid-30s on the daily. That is close to oversold but not yet at capitulation levels. In similar setups over the past two years, LINK has bounced 15% to 25% from this RSI zone before deciding direction.

    The Bull Case for Chainlink in 2026

    The bull thesis is short and sharp.

    First, Chainlink owns the institutional rail. Of every serious bank consortium experimenting with tokenization, Chainlink is the recurring name. That is not luck. It is years of engineering, audits, and quiet meetings the token market has not priced.

    Second, the supply story is friendly. LINK has 748 million tokens circulating, with a 1 billion cap. Unlike many alts, there is no massive unlock cliff hanging over the next 12 months that would crush price discovery.

    Third, the rotation trade. When real-world asset narratives rip, the picks-and-shovels play tends to outperform the application tokens. Chainlink is the picks and shovels.

    If SWIFT MVP launches on schedule and Pangea pilots go to production, the probability favors LINK reclaiming the $14 to $22 range over six months. That is roughly a 90% to 195% move from current price.

    The Bear Case You Cannot Ignore

    Now the other side. We always show both.

    LINK has spent most of 2025 and 2026 underperforming the market. Network usage growth has not translated into token demand. Critics argue that CCIP fees can be paid in stablecoins or other assets, which weakens the case for LINK token capture.

    Macro is the second risk. If Bitcoin breaks $58,000 and drags the market lower, LINK historically falls harder than the index. A flush below $6.00 support opens the door to $5.00, and a retest of the 2024 lows near $4.50 cannot be ruled out.

    The third risk is timing. Institutional rollouts run on bank time, not crypto time. A six-month delay on the SWIFT MVP would push the catalyst story into 2027 and frustrate holders waiting for the breakout.

    Chainlink (LINK) Price Predictions: 30 Days, 6 Months, 2027 to 2028

    Here is where our hybrid AI model lands when we combine technical setup, on-chain activity, catalyst calendar, and macro conditions. Every number is a scenario range, not a guarantee.

    Chainlink LINK price prediction targets table short-term mid-term long-term

    Short-Term (Next 30 Days)

    The next month is mostly about defending support and watching for a relief bounce.

    • Bear target: $6.00. Triggered if BTC loses $58,000 or if LINK breaks below $7.00 on volume.
    • Base target: $8.50. Assumes LINK holds the $7.00 to $7.20 support and reclaims the 20-day moving average.
    • Bull target: $11.00. Requires a clean reclaim of $9.50 plus a positive SWIFT or Pangea headline.

    Mid-Term (6 Months, Year-End 2026)

    By December 2026, the SWIFT MVP and Pangea pilots should have produced visible milestones. Token price tends to lead protocol milestones by about 60 days when the market is paying attention.

    • Bear target: $5.50. The “delays and macro pain” scenario, where institutional rollouts slip and BTC is in a wider drawdown.
    • Base target: $14.00. SWIFT MVP ships on time, ETF inflows pick up, LINK trades back into its 2024 range.
    • Bull target: $22.00. Pangea pilots go to production and a second wave of LINK ETF inflows hits, totaling above $400 million.

    Long-Term (2027 to 2028)

    Looking out 18 to 30 months, LINK is a leverage play on institutional crypto adoption. The bull and bear paths diverge sharply.

    • Bear target: $9.00. Network grows but token price stays disconnected. CCIP fee capture remains weak for LINK.
    • Base target: $28.00. SWIFT integration is in production, Pangea handles meaningful settlement flow, and tokenized RWA hits $500 billion across chains.
    • Bull target: $55.00. New all-time high. Requires the full institutional rail to be live, ETF AUM above $2 billion, and a broader crypto cycle peak.

    For context, the $55 bull target is roughly 7.3x current price. That is aggressive, but it lines up with what some analysts at major research desks are publishing when they model CCIP revenue growth out three years.

    How LINK Compares to Other Institutional Plays

    Chainlink is not the only token trying to win the bank rail. Stellar is making a separate push through its DTCC partnership, which we covered in our Stellar (XLM) Price Prediction 2026: DTCC Catalyst piece. Avalanche has its own RWA push. Ondo is building the tokenized asset layer.

    The difference with LINK is positioning. Chainlink is infrastructure underneath those tokenization plays, not a competitor to them. If the broader RWA wave is real, LINK benefits from the activity on every chain, not just one.

    What to Watch in the Next 90 Days

    Three things will tell you whether the LINK setup is working.

    1. SWIFT MVP go-live date. Any official SWIFT announcement on the H1 2026 timeline is a market-moving event.
    2. The $9.50 to $10.00 reclaim. A weekly close above this zone flips the medium-term trend.
    3. LINK ETF flows. Two consecutive weeks of $30 million-plus net inflows would be the first sign that institutional demand is rotating in.

    Set alerts. Watch the levels. The setup either works or it does not, and you will know within a quarter.

    The Bottom Line on Chainlink in 2026

    LINK is a frustrating chart with a strong fundamental story. The token has bled 21% in 30 days while Chainlink the protocol keeps signing partnerships with the biggest names in global finance. That disconnect usually resolves one way or the other inside two quarters.

    Our base case is constructive. A defended $7.00 support, a SWIFT MVP that ships on time, and a slow drip of ETF inflows would put LINK back in the $14 range by year-end. The bull case to $22 needs a clean catalyst from Pangea on top of that. The bear case to $5.50 is real if macro turns and the catalysts slip.

    This is a setup worth monitoring, not a setup that demands you load the boat tonight. Watch the $9.50 reclaim. Watch SWIFT. Let the chart and the catalyst calendar tell you when conviction is earned.

    Disclaimer: This article is for informational and educational purposes only and should not be construed as financial, investment, or trading advice. Cryptocurrency markets are highly volatile, and past performance does not guarantee future results. The price predictions and analyses presented here are based on AI models, technical indicators, and available data at the time of writing. They are not guarantees. Always conduct your own research (DYOR) and consult with a qualified financial advisor before making any investment decisions. Pump Parade and its authors do not assume liability for financial losses incurred based on information provided in this article.