

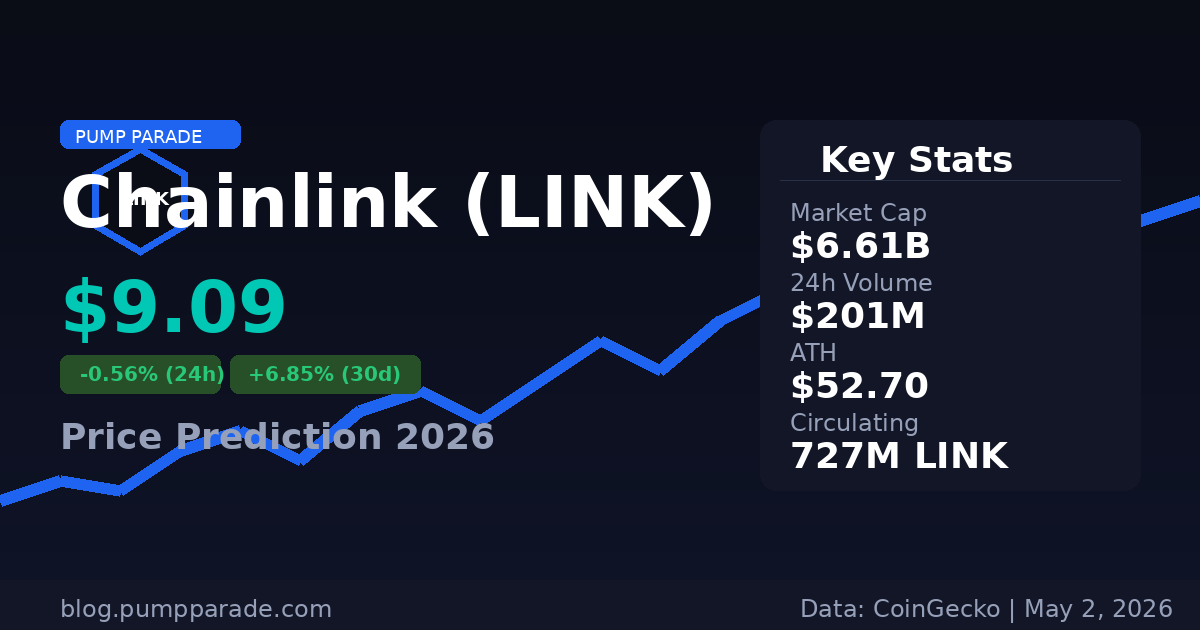
Chainlink (LINK) is trading at $9.09 as of May 2, 2026. That is down about 83% from its all-time high of $52.70 set in May 2021. For a protocol that powers more than $20 trillion in data value across hundreds of smart contract ecosystems, that price gap is striking.
But here is what the headlines miss: on-chain activity is quietly surging. Weekly Cross-Chain Interoperability Protocol (CCIP) volume just hit $1.3 billion, up 260% from a month ago. A record 970,430 LINK tokens left exchanges last week, the largest single-day outflow of 2026. Whales are accumulating while retail ignores it.
This article breaks down what is driving LINK right now, where the price could go over the next 12 months, and the key risks that could derail the recovery. No hype. Just the data.
What Is Chainlink?
Chainlink is the dominant oracle network in crypto. Smart contracts on blockchains cannot access real-world data by themselves. They cannot pull a stock price, check the weather, or verify a payment. Chainlink bridges that gap.
The network operates through a decentralized pool of node operators. These nodes fetch off-chain data and deliver it to on-chain smart contracts. LINK is the token that pays for that service and secures the network through staking.
As of May 2026, Chainlink secures data for DeFi protocols, real-world asset (RWA) tokenization platforms, insurance contracts, and cross-chain bridges. Its CCIP protocol has become the leading standard for moving assets and messages across different blockchains securely.
Key metrics at time of writing, according to CoinGecko:
- Price: $9.09
- Market cap: $6.61 billion
- 24h volume: $201 million
- Circulating supply: 727 million LINK (of 1 billion total)
- ATH: $52.70 (May 2021)
Current Market Context
LINK is up 6.85% over the last 30 days but down 3.57% over the last 7. That short-term softness reflects the broader crypto market, which has been consolidating since early April.
The 30-day gain is meaningful, though. It happened against a backdrop of muted sentiment. Bitcoin has been rangebound between $76,000 and $82,000. Most altcoins have struggled. LINK holding and grinding higher in that environment suggests real demand underneath.
The whale outflow data supports this. When large holders pull tokens off exchanges, it typically signals intent to hold, not sell. The 970,430 LINK outflow on April 29 was the largest of 2026. Historically, similar exchange outflow events have preceded meaningful LINK price moves over the following 6 to 8 weeks.
Technical Analysis
Looking at the daily chart, LINK is holding above the $8.80 support level that has been defended three times since March. The 200-day moving average sits at approximately $8.40. LINK is trading above it, which is a baseline positive signal.
The RSI (Relative Strength Index, a momentum gauge that runs from 0 to 100) is sitting near 47. That is neutral territory. Not oversold enough to signal a big bounce, not overbought either. The absence of extreme readings is actually healthy for a longer-term thesis.
Key levels to watch:
- Support: $8.80 (immediate), $8.40 (200-day MA), $7.50 (strong floor)
- Resistance: $10.50 (recent ceiling), $12.00 (August 2025 high), $15.00 (major structural resistance)
A clean daily close above $10.50 would be the first clear breakout signal. Until that level is cleared, LINK remains in a range-bound recovery phase.
Key Catalysts for 2026
CCIP Growth. Chainlink’s Cross-Chain Interoperability Protocol is becoming the backbone of cross-chain DeFi. Weekly CCIP volume crossing $1.3 billion is not a trivial number. As more protocols integrate CCIP for secure asset transfers, demand for LINK as the settlement and security layer increases.
Real-World Asset Tokenization. RWA tokenization is one of the biggest crypto narratives of 2026. Tokenized Treasury bills, private credit, and real estate are all growing rapidly. Chainlink’s Proof of Reserve and data feed products are the oracle layer most of these platforms rely on. More RWA volume means more Chainlink revenue and more LINK staking demand.
Grayscale LINK Trust. The Grayscale Chainlink Trust (GLNK) launched in December 2025, giving institutional investors regulated access to LINK for the first time. Cumulative inflows have already surpassed $111.5 million. This opens the LINK market to fund managers and family offices that cannot hold crypto directly.
Staking v1 Maturity. Chainlink’s staking program allows LINK holders to earn yield by securing the network. As staking rewards become more visible and the locked LINK supply grows, circulating supply effectively tightens. Less selling pressure from staked holders supports the price floor.
The broader ecosystem context matters too. Ethereum’s DeFi resurgence directly benefits Chainlink since the majority of Chainlink oracle calls still originate from Ethereum mainnet and its layer-2 networks. For more context on the Ethereum outlook, see our Ethereum (ETH) price prediction for 2026.
The Bull Case
Our hybrid AI model assigns a 58% probability of LINK reaching the $16 to $24 range by end of 2026, based on current technical structure and catalyst trajectory.
The bull case rests on three pillars. First, CCIP volume continues to compound as more cross-chain bridges and DeFi protocols adopt the standard. Each new integration adds baseline demand for LINK. Second, the RWA narrative accelerates, pulling institutional capital into Chainlink-powered infrastructure. Third, a broader altcoin recovery in Q3 or Q4 2026 carries LINK back toward its 2025 highs near $25.
Historically, LINK has outperformed in mid-to-late bull cycle phases. In 2020-2021, it went from $2 to $52 in roughly 18 months. The current setup, with accumulation occurring at depressed prices and fundamentals genuinely improving, rhymes with that pattern.
Bull case price targets:
- 3 months: $14 to $16
- 6 months: $20 to $24
- End of 2026: $28 to $35 if market conditions are favorable
The Bear Case
The bear case is real and worth taking seriously.
LINK has been in a multi-year downtrend against Bitcoin (BTC). Relative to the market leader, it has consistently underperformed since 2021. That ratio needs to recover for LINK to post meaningful USD gains in a flat or declining BTC environment.
Competition is also growing. Pyth Network, a newer oracle provider built on Solana, has captured significant market share on faster chains. If Pyth or other alternatives continue eating into Chainlink’s dominance in high-speed DeFi, the growth story becomes harder to tell.
Macro risk remains. If Bitcoin breaks below $70,000 and the broader market enters a prolonged correction, LINK historically drops harder than BTC in risk-off environments. The $7.50 support level would be the critical line in the sand. A weekly close below it would likely send LINK toward $6.
Bear case price targets:
- 3 months: $7.00 to $7.50
- 6 months: $5.50 to $6.50
- If major breakdown: $4.50 (2024 lows)
Chainlink (LINK) Price Predictions by Timeframe
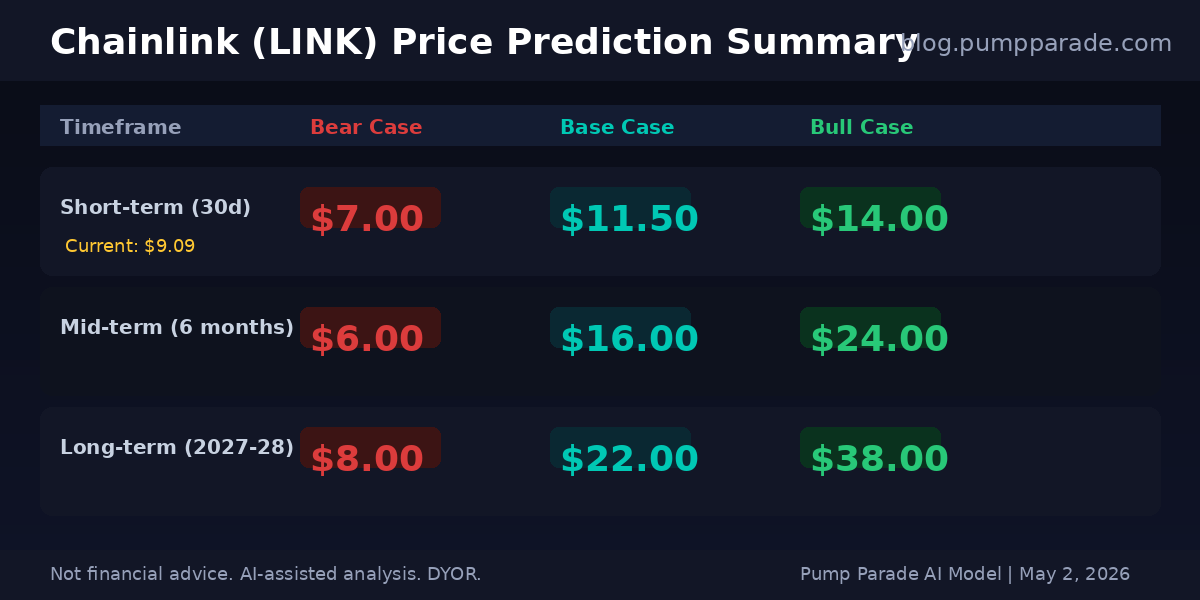
Based on our AI model’s analysis of technical indicators, on-chain data, exchange flows, and macro conditions, here are our price prediction ranges for LINK:
Short-term (30 days, by June 2026): Bear $7.00 | Base $11.50 | Bull $14.00
The next 30 days are about whether LINK can clear the $10.50 resistance level. A macro risk-off move would push it back toward $7 to $8. A positive crypto market environment could see a quick run toward $13 to $14.
Mid-term (6 months, by November 2026): Bear $6.00 | Base $16.00 | Bull $24.00
The base case assumes CCIP growth continues, the Grayscale product attracts further institutional inflows, and BTC holds above $75,000. In that scenario, LINK gradually reclaims historical support levels and rebuilds toward $15 to $18. The bull case requires a genuine alt season where capital rotates out of BTC and ETH into mid-cap infrastructure tokens.
Long-term (2027-2028): Bear $8.00 | Base $22.00 | Bull $38.00
The long-term thesis depends on whether RWA tokenization becomes a trillion-dollar market. If it does, Chainlink is positioned to be the oracle infrastructure standard for that market. A $22 base case represents roughly a 140% gain from current levels and still implies LINK is at about 42% of its 2021 ATH.
What to Watch
If you are tracking LINK, here are the signals that matter most:
- Weekly CCIP volume: If it sustains above $1 billion and trends toward $2 billion, the fundamental case strengthens.
- Exchange flows: Continued outflows signal accumulation. Sudden large inflows to exchanges are a warning sign.
- BTC price action: A clean BTC break above $85,000 would likely trigger an altcoin rotation that benefits LINK.
- $10.50 resistance: A confirmed daily close above this level would be the first technical breakout confirmation.
- GLNK inflow data: Grayscale Trust inflows accelerating would signal growing institutional conviction.
Disclaimer: This article is for informational and educational purposes only and should not be construed as financial, investment, or trading advice. Cryptocurrency markets are highly volatile, and past performance does not guarantee future results. The price predictions and analyses presented here are based on AI models, technical indicators, and available data at the time of writing. They are not guarantees. Always conduct your own research (DYOR) and consult with a qualified financial advisor before making any investment decisions. Pump Parade and its authors do not assume liability for financial losses incurred based on information provided in this article.
About our AI predictions: Pump Parade’s price predictions are generated by machine learning models that analyze technical indicators, on-chain data, and market sentiment. These models have limitations and cannot account for black swan events, regulatory changes, or sudden market shifts. Use AI predictions as one input among many in your research.
