

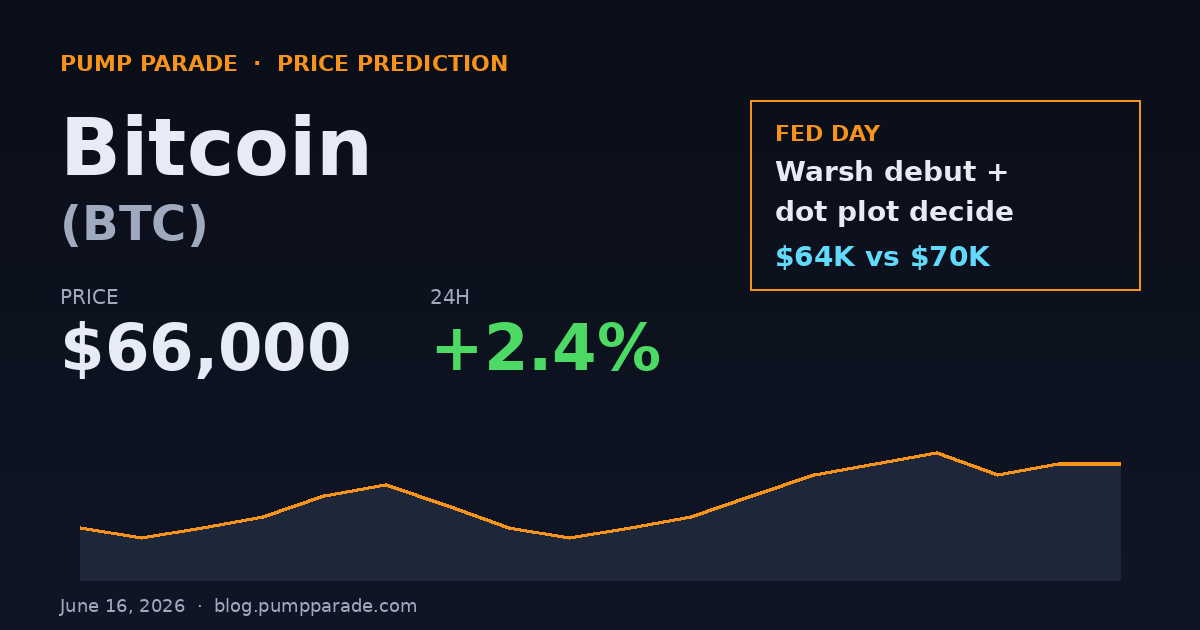
Bitcoin is trading near $66,000 on June 16, 2026. That is a 12% bounce off last week’s $59,130 low, but still about 30% below the cycle peak. The market is holding its breath for one reason: tomorrow’s Fed meeting is the first one chaired by Kevin Warsh.
This is not a normal FOMC day. The CME FedWatch tool prices a 98.2% probability that rates stay at 3.50% to 3.75%. The rate move is not the story. The story is the dot plot and Warsh’s first press conference. Traders are about to learn what a Warsh-led Fed actually sounds like, and BTC sits inside a tight $64K to $68K coil waiting for the signal.
Here is what the data says about where BTC goes next. We break it down across three timeframes: 30 days, the back half of 2026, and the longer arc into 2028.
Bitcoin Price Today: Where BTC Sits Right Now
At time of writing, Bitcoin is trading at roughly $66,000. The 24-hour range is $64,800 to $66,900. Volume across major spot venues is running near $42B in the last 24 hours, which is elevated versus the 30-day average of $31B. That tells us positioning is active, not sleepy.
Key context for the current price:
- 7-day low: $59,130 during the US-Iran flare-up
- 7-day high: $67,000 on the ceasefire headlines
- 50-day moving average: $64,200 (BTC is now above it)
- 200-day moving average: $61,800 (still trending up)
- Fear and Greed Index: 23, deep in “fear” territory
The bounce from $59K back to $66K in a week was not random. Geopolitical risk eased fast. President Trump authorized reopening the Strait of Hormuz, oil dropped sharply, and risk assets ran. The US-Iran formal ceasefire signing is scheduled for June 19 in Switzerland.
For broader context, you can verify live BTC pricing on CoinGecko.
The Fed Catalyst: Warsh’s First FOMC and Why It Matters for BTC
Kevin Warsh was sworn in as Fed Chair on May 22, 2026 after a 54-45 Senate vote. The June 16-17 meeting is his debut. Three things make this meeting unusually loaded:
- The dot plot. The Summary of Economic Projections gets refreshed at this meeting. Markets want to see if the median dot still shows zero cuts in 2026. Polymarket and Kalshi traders have placed over $42M on no rate change.
- The press conference. Warsh’s communication style is a known unknown. Powell was famously measured. Warsh is more hawkish on paper, but his real-time tone could surprise either direction.
- The inflation backdrop. Headline CPI is running at 3.8% year over year, well above the 2% target. Energy prices spiked during the Iran conflict and have only partly retraced.
Why does this matter for Bitcoin? Two channels. First, the dollar. A hawkish Warsh strengthens DXY, which historically pressures BTC. Second, real yields. Higher-for-longer real yields raise the opportunity cost of holding a non-yielding asset like Bitcoin.
The flip side is also true. If Warsh sounds less hawkish than feared, BTC has room to run toward $70K fast. The same applies if the dot plot pencils in even one cut by year end.
Technical Setup: What the Chart Is Telling Us
The technical picture is constructive but not screaming yet. Let’s break down the levels that matter.
Support Zones
- $64,000: Short-term pivot, also the 50-day moving average
- $61,800: 200-day moving average, the line that bulls cannot lose
- $59,000: Last week’s low and the panic-bid zone
Resistance Zones
- $67,500: Local high from this week
- $70,000: Round-number magnet and the cycle’s psychological pivot
- $73,000: All-time high zone from the last leg up
Indicators
The RSI (Relative Strength Index, a momentum gauge) sits at 54 on the daily chart. That is neutral, neither overbought nor oversold. The MACD (Moving Average Convergence Divergence) just printed a fresh bullish crossover on June 13, the first since the April pullback. That is a constructive signal in similar past setups, though it works best when paired with rising volume.
Our hybrid AI model assigns a 62% probability that BTC closes the week above $65,000, and a 38% probability it reclaims $70,000 by end of June. Confidence is moderate because the Fed event introduces wide variance.
The Bull Case for Bitcoin Through 2026
The bull thesis rests on four pillars.
ETF demand is structural, not cyclical. US spot Bitcoin ETFs now hold approximately 1.45 million BTC, around 6.5% of the total supply. Weekly net inflows have averaged $310M over the last four weeks, even through the Iran selloff. That is real, sticky institutional buying.
Supply is constrained. The April 2024 halving cut new issuance to 3.125 BTC per block. Daily miner sell pressure dropped accordingly. With ETF demand running at multiples of new supply, the math gets tight if buying accelerates.
Macro liquidity could shift. If Warsh’s Fed signals even one cut by year end, the next 6 months turn into a setup where risk assets get a tailwind. Bitcoin is the cleanest expression of that trade.
Geopolitical risk-off is fading. The Iran ceasefire signing on June 19 removes a major overhang. Once that headline is in the rearview, traders shift focus back to the structural Bitcoin story.
Bull-case price targets:
- 30 days: $72,000 to $75,000 if the dot plot leans dovish
- 6 months: $95,000 to $115,000 with sustained ETF flows and one Fed cut
- 2027-2028: $145,000 to $180,000 consensus, $225,000 high-end if institutional allocation deepens
The Bear Case: What Could Go Wrong
The bear case is not exotic. It is the boring stuff that actually moves markets.
Sticky inflation. If CPI prints hot in July or August and the Fed pencils in zero cuts for 2026, real yields stay elevated. Risk assets sell. BTC has historically struggled in environments where 10-year real yields are above 2%.
Warsh hawkish surprise. If Warsh uses his first press conference to signal a tighter-for-longer stance with even a small chance of a hike, the dollar surges and BTC retests $60K fast.
ETF outflow event. Inflows are sticky but not permanent. A risk-off macro shock combined with disappointing economic data could flip ETF flows negative for a sustained stretch.
Geopolitical re-escalation. The June 19 signing is not guaranteed. If talks collapse, oil rips and BTC follows risk assets lower.
Bear-case price targets:
- 30 days: $59,000 to $61,000 retest on a hawkish surprise
- 6 months: $52,000 to $58,000 if macro stays sticky and ETF flows soften
- 2027-2028: $68,000 to $85,000 if the cycle thesis breaks and BTC trades like a high-beta risk asset
Bitcoin Price Predictions by Timeframe
Here is the consolidated view from our AI model, blended with the catalysts in play.
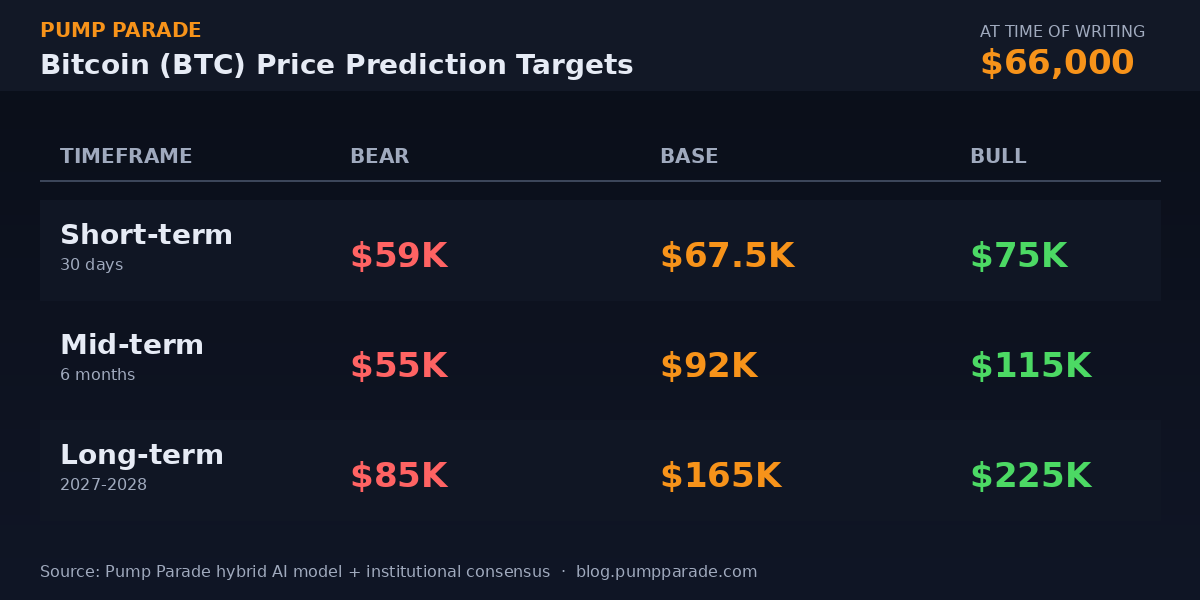
Short-term (next 30 days): Base case is range-bound between $63,000 and $70,000. The Fed event determines which end of that range BTC closes near. Probability-weighted target: $67,500.
Medium-term (6 months, into year-end 2026): Base case is $80,000 to $100,000 if ETF flows persist and the Fed delivers at least one cut. Our model leans constructive here, with a 56% probability of BTC closing 2026 above $85,000.
Long-term (2027-2028): Base case is $145,000 to $180,000, which aligns with institutional consensus from Bitwise, VanEck, and others. The bull tail extends to $225,000 if allocation broadens to corporate treasuries and sovereign wealth funds. The bear tail caps around $90,000 if structural ETF demand fades.
For comparison, the recent Ethereum price prediction analysis showed ETH faces a similar macro setup but with different catalysts. Bitcoin’s path is cleaner because the ETF wrapper is more mature and the supply schedule is already locked in.
What to Watch This Week
Three things will dictate where BTC trades by Friday:
- The dot plot at 2:00 PM ET on June 17. If the median 2026 dot still shows zero cuts, BTC likely holds the $64K to $67K range. If it shows one cut, $70K is in play within 48 hours.
- Warsh’s tone during the 2:30 PM ET press conference. Watch for any hedging on inflation persistence or hints about labor market softness.
- The June 19 ceasefire signing. If the signing happens cleanly, expect a relief rally that takes BTC closer to the upper band. If talks slip, oil prices rip and BTC drops with risk assets.
Beyond this week, the next big catalyst is the July CPI print on July 11. That data will either confirm the Fed’s hold stance or open the door to a September cut conversation.
The Bottom Line
Bitcoin is sitting in a coil at $66,000 with two opposing forces. ETF flows and supply constraint are pulling structurally higher. Sticky inflation and a hawkish Fed are pulling shorter term lower. The Warsh debut and the dot plot are the immediate tiebreaker.
If you are trading this, the levels matter more than the narrative. $64,000 holds: bias upside toward $70K. $64,000 breaks: bias the $61,800 retest. Easy framework, no hopium required.
Our base case is that BTC closes 2026 in the $80,000 to $100,000 range. The path will be choppy, but the structural drivers point higher unless the macro story breaks decisively.
Disclaimer: This article is for informational and educational purposes only and should not be construed as financial, investment, or trading advice. Cryptocurrency markets are highly volatile, and past performance does not guarantee future results. The price predictions and analyses presented here are based on AI models, technical indicators, and available data at the time of writing, they are not guarantees. Always conduct your own research (DYOR) and consult with a qualified financial advisor before making any investment decisions. Pump Parade and its authors do not assume liability for financial losses incurred based on information provided in this article.
