More
    Home Blog

    Hyperliquid (HYPE) Price Prediction 2027: HYPE to $150?

    Hyperliquid (HYPE) trades at $81.08 as of October 14, 2026, down 9.6% on the week after touching an all-time high of $97.96 on September 23. The pullback leaves the token 17% below its peak, yet still up 109% over the past year. That is the setup every Hyperliquid price prediction 2027 piece has to reconcile: a protocol that eats fees, buys back its own token, and now controls roughly 32% of on-chain perps volume, versus a chart that just lost momentum.

    Our take is that HYPE is at a decision point. The buyback flywheel is real. The valuation is stretched. The next 90 days bring enough catalysts, and enough token unlocks, to settle the argument.

    Below, we lay out where HYPE stands today, why it moved the way it did, the bull and bear cases from the people actually trading it, three concrete price targets by timeframe, and how HYPE stacks up against the perp DEX competition. No hopium. No doom. Just the numbers and the setup.

    Key Takeaways

    • HYPE sits at $81, with a $18.0B market cap, ranked #11. The token is down 9.6% on the week after an all-time high of $97.96 on September 23.
    • Hyperliquid runs about 32% of on-chain perpetual futures volume. Annualized revenue hit roughly $626M in April 2026, with 97% routed to open-market HYPE buybacks.
    • Our base case for Q4 2026 is $70 to $110. Our 6-month base case targets $140 by April 2027. Bull case: $180+. Bear case: $45 if unlocks outrun buybacks.
    • Catalysts to watch: HIP-4 permissionless outcome markets rolling to mainnet, continued HyperEVM growth, and the ongoing DEX-to-CEX market share rotation.
    • The biggest risk is dilution. Roughly 75% of supply is still locked, with about 10M HYPE unlocking monthly.
    Hyperliquid (HYPE) price prediction 2027 hero graphic current price $81 and perp DEX dominance catalyst

    Where Does Hyperliquid Stand Today?

    HYPE went live via its November 2024 airdrop and has spent most of 2026 climbing from the mid-$30s into triple digits. The September rally to $97.96 came as perps volume on the platform ran past $8B per day and the Assistance Fund crossed $1.1B in cumulative buybacks. The current 17% pullback is the first material cooldown since July.

    Metric Value
    Price (Oct 14, 2026) $81.08
    24h change -1.5%
    7d change -9.6%
    30d change +1.3%
    1-year change +109%
    Market cap $18.04B
    CoinGecko rank #11
    24h volume $0.70B
    All-time high $97.96 (Sep 23, 2026)
    % from ATH -17.2%
    Circulating supply 222.45M HYPE
    Max supply 1B HYPE

    The number that matters most on this table is not price. It is the gap between circulating supply (222M) and max supply (1B). About 75% of the token has not reached the market yet. That is the backdrop for everything that follows.

    Why Is HYPE Pulling Back Right Now?

    Three things are weighing on the chart. First, broader risk-off: Bitcoin is flat at $83K, Ethereum is down 4.4% on the week, and the top 20 is bleeding together. HYPE is high-beta and goes with the tape.

    Second, profit-taking. The run from $35 in April to $98 in September is a 180% move in five months. The holders who stacked at $40 are not idiots. They are trimming.

    Third, unlock anxiety. The monthly 10M HYPE unlock that began in November 2025 is a known supply overhang, and the next cliff ratchets up when team and investor tranches start vesting more aggressively through 2027. Markets price overhangs before they land.

    The pullback is not fundamentally bad. The buyback flywheel still runs daily. Open interest is still above $8.9B. Monthly active traders still crossed 274,000 in Q1 2026, per VanEck. The question is whether price finds a floor near $70 or washes out to the $55 to $60 zone, where many models put fair value today.

    The Bull Case for HYPE

    Catalyst 1: The buyback flywheel

    Hyperliquid routes roughly 97% of protocol fees into the Assistance Fund, which buys HYPE on the open market every single day. Cumulative buybacks passed $1.1B at the end of April 2026, and the Fund now holds around 44M HYPE at an average cost near $25. VanEck pegs the annualized buyback rate at about 7% of market cap, which is roughly 5x Ethereum’s EIP-1559 burn.

    Compare this to a traditional token with inflation and no revenue return. HYPE’s structural buyer is itself. As long as volumes hold, the sink is permanent.

    Catalyst 2: Perp DEX dominance keeps compounding

    Hyperliquid holds roughly 32% of all on-chain perps volume. The DEX share of total crypto perpetual volume rose from 6.4% to 24.3% during 2025 and continues to climb. If that trend holds and Hyperliquid defends its lead against newcomers like Aster, revenue scales with the entire DEX wave, not just Hyperliquid’s slice.

    This is the key piece institutional desks are starting to re-rate on. Nansen’s recent note said buy-side comparisons are shifting from UNI and dYdX to CME, ICE, and Nasdaq. If HYPE gets even a fraction of that multiple expansion, the token re-rates higher.

    Catalyst 3: HIP-4 and HyperEVM growth

    HIP-4 went live on mainnet in May 2026, introducing permissionless outcome markets (think prediction markets, event contracts) with cross-margin unification. The next 90 days will show whether third-party builders actually ship markets, which would open a new revenue line on top of perps. HyperEVM, the general-purpose smart contract layer, is also attracting a growing DeFi ecosystem that compounds the fee engine.

    The Bear Case for HYPE

    Risk 1: Dilution overhang

    Only 22.2% of max supply is in circulation. Monthly unlocks of about 10M HYPE began in November 2025 and continue through 2027. At today’s price, each monthly unlock is roughly $800M of potential sell pressure. Buybacks offset part of this, but if volumes dip, the math stops working in HYPE’s favor. The float at full dilution puts the FDV near $81B, well above any current analyst price target.

    Risk 2: Competition is finally showing up

    Aster briefly held over 50% of on-chain perps volume in September 2025 before falling back to 15% by April 2026. The next challenger is already in testing somewhere. Centralized exchanges are also fighting back with lower fees and rebate programs. Hyperliquid’s moat is deep (its order book is the best on-chain) but no DEX has retained dominant market share through a full cycle. The precedent is not comforting.

    Risk 3: Regulation on multi-asset expansion

    Hyperliquid’s roadmap includes equities, FX, commodities, and prediction markets. Each of those categories lives under heavy securities, commodities, or gaming regulation depending on jurisdiction. The team has moved cautiously, but a single enforcement action against a HIP-3 or HIP-4 deployer could chill the whole permissionless-markets thesis and compress HYPE’s multiple fast.

    Hyperliquid Price Prediction 2027: Targets by Timeframe
    Hyperliquid (HYPE) price prediction 2027 targets table bear $45 base $140 bull $220

    Here is our framework. Each cell is a price range, not a point estimate, because point estimates in crypto are theater. These are the levels where the setup actually makes sense based on volume, unlocks, and comparable valuations.

    Timeframe Bear Base Bull
    30-day (Nov 2026) $65 $85 $105
    6-month (Apr 2027) $55 $140 $180
    End of 2027 $45 $160 $220

    30-day outlook: November 2026

    Short-term direction depends on whether BTC holds $80K and whether perps volume rebounds from the September slowdown. Base case is a range of $75 to $95 as the market digests the recent pullback. The $70 to $72 zone is critical support (previous breakout level). A break there opens $60.

    6-month outlook: April 2027

    By April, two things should be clearer: cumulative Q4 buybacks (which could cross $1.5B) and the first-year performance of HIP-4 markets. If both land strong, a retest and breakout above $100 followed by a push to $140 is plausible. Arthur Hayes has publicly called $150 by August 2026 (that call aged poorly on timing but the thesis survives). CoinCodex’s model puts a path to $100 by February 2027.

    End of 2027

    The long-term range widens because unlock schedules dominate. If buybacks consistently absorb more HYPE than monthly unlocks release, and if DEX share keeps growing, $200 is reachable. If volumes mean-revert and the Fund slows, dilution wins and HYPE settles in the $45 to $80 range. Coincub’s bull case puts the longer-term range at $180 to $300. Our base case sits in the $140 to $180 zone.

    For broader market context, see our Solana price prediction for 2027, which maps similar catalysts on a different Layer 1.

    How Does Hyperliquid Compare to Other Perp DEXs?

    Perps volume is the metric. Everything else (fees, buybacks, token price) flows from it.

    Metric Hyperliquid dYdX GMX Aster
    On-chain perps share ~32% ~8% ~5% ~15%
    Daily volume (approx) $8B+ $1B $0.3B $3B
    Annualized revenue ~$626M ~$120M ~$45M Undisclosed
    Token buyback rate ~7% of mcap/yr Varies Fee share None confirmed
    Native chain HyperCore + HyperEVM App-chain (Cosmos) Arbitrum BNB Chain
    Market cap $18.0B $0.6B $0.3B $2.1B (est.)

    The chart tells the story: Hyperliquid is bigger than every other perp DEX combined, and it is the only one with a direct, continuous buy wall funded by fees. The nearest comparable protocol with similar revenue capture is Uniswap, which is still debating fee switch mechanics while HYPE already runs it.

    What Would Change Our View on HYPE?

    Three triggers would move us from base case to either extreme:

    Bullish trigger: Hyperliquid holds >$8B daily perps volume through Q1 2027 and HyperEVM TVL crosses $5B. That combination would validate the fee engine through a broader market slowdown and justify a push toward $180 to $220.

    Bearish trigger: Monthly unlocks outpace Assistance Fund buybacks for two consecutive months, net of staking lockups. That is the sign the flywheel has slipped, and HYPE’s support disappears. Target becomes $55 or lower.

    Game-changer trigger: A HIP-3 or HIP-4 deployer gets hit with a securities or commodities enforcement action in a major jurisdiction. That would freeze permissionless-market expansion and force the multiple back down to a straight perp-DEX comp, probably $70 to $90 regardless of volume.

    For a parallel view on how DeFi tokens with fee-return mechanisms re-rate, our Avalanche price prediction walks through a different Layer 1’s valuation math.

    Frequently Asked Questions

    What is the highest HYPE price prediction for 2027?

    Analyst targets for 2027 range from $100 (CoinCodex) to $300 (Coincub bull case). Our own base case for end of 2027 is $160, with a bull case of $220 if perps volume holds above $8B daily and HyperEVM scales. Any target above $220 assumes both aggressive multiple expansion and that supply unlocks continue to be absorbed by buybacks.

    Is Hyperliquid a good investment in 2027?

    HYPE is one of the few tokens with real, measurable protocol revenue returned to holders through buybacks. That alone sets it apart. The risk is valuation: at $18B market cap and $81B fully diluted, HYPE already prices in continued dominance. For investors comfortable with high beta and a 2027 unlock schedule, the setup is attractive. For capital preservation, the drawdown risk to $55 is real.

    How does the Hyperliquid buyback mechanism work?

    About 97% of all protocol fees are sent to the Assistance Fund, which buys HYPE on the open market daily. The remaining 3% covers operating costs. A December 2025 governance vote recognized Assistance Fund HYPE as effectively burned. Weekly burn volume has reached $9.22M. The mechanism depends on trading volume, so a prolonged volume crash would weaken buybacks.

    Can HYPE reach $200 by 2027?

    Reaching $200 would require either continued multiple expansion (institutional desks pricing HYPE closer to traditional derivatives venues) or a step-change in revenue from HyperEVM and HIP-4 markets. Both are plausible but neither is base case. Our model treats $180 to $220 as the bull-case band for end of 2027, dependent on buybacks staying ahead of unlocks.

    What is Hyperliquid’s fully diluted valuation?

    At $81 per token and 1B max supply, HYPE’s fully diluted valuation is roughly $81B. Only 222M tokens (22.2%) are in circulation today. The FDV versus circulating cap gap is the single most important variable in HYPE’s long-term valuation debate. Models that use FDV typically find HYPE expensive. Models that focus on circulating cap and buyback math typically find it fair or cheap.

    What are the biggest risks to HYPE in 2027?

    Three things: (1) monthly unlocks of around 10M HYPE outpacing buybacks if volumes fall, (2) competitive pressure from newer perp DEXs or centralized exchanges winning share back, and (3) regulatory action against a HIP-3 or HIP-4 deployer that chills the permissionless-markets thesis. Any one of these would compress HYPE’s multiple quickly.

    The Honest Take

    Hyperliquid is the most unambiguously good-business story in crypto right now. Real revenue. Real buybacks. Real market share. The protocol has out-executed every other perp DEX by a wide margin and the team has done it with 11 people and no venture capital.

    And still: the token is high beta, the valuation is reflexively tied to perps volume, and 75% of supply has not touched the market. If you are long HYPE for 2027, you are betting that the flywheel outruns the unlock schedule. If you are short HYPE, you are betting that at some point every DEX gets dethroned.

    Our base case sits between those two: $140 by April 2027, $160 by year-end. The setup worth watching is the $70 to $72 support zone and the next three monthly unlocks. Hold those, and the next leg higher is in play. Lose them, and the bear case gets its first clean entry.

    Disclaimer: This article is for informational and educational purposes only and should not be construed as financial, investment, or trading advice. Cryptocurrency markets are highly volatile, and past performance does not guarantee future results. The price predictions and analyses presented here are based on AI models, technical indicators, and available data at the time of writing. They are not guarantees. Always conduct your own research (DYOR) and consult with a qualified financial advisor before making any investment decisions. Pump Parade and its authors do not assume liability for financial losses incurred based on information provided in this article.

    Sources: VanEck Hyperliquid research, CoinGecko HYPE market data, Nansen HIP-3 analysis.

    Can ChatGPT Pick Stocks? What Every Public AI Paper-Trading Experiment Actually Shows

    0

    AI models can generate stock picks, and some public tests posted eye-catching gains. The evidence underneath is usually short, noisy, and full of drawdowns. Below is a scorecard of the experiments you can actually verify, plus a checklist for running a fair paper test yourself.

    The short answer

    Yes, ChatGPT (and other AIs) can generate stock picks and run a simulated portfolio. Public tests are short and volatile. In one six-month micro-cap paper-trading study, the portfolio’s maximum drawdown reached −50.33%. Treat AI picks as research input, not advice.

    The experiments, side by side

    Don’t trust a single viral thread. Here are the public AI paper-trading experiments and studies we could verify from primary sources, lined up the same way.

    ChatGPT runs a $100 micro-cap portfolio for ~6 months (Nathan Smith study)

    Nathan Smith’s January 2025 paper, Evaluating ChatGPT as a Portfolio Decision-Maker in Micro-Cap Equities, is the cleanest retail-readable ChatGPT portfolio experiment we found in full text.

    Setup, from the PDF:

    • Universe: U.S.-listed micro-cap equities
    • Starting capital: $100
    • Duration: about six calendar months
    • Design: forward-only paper trading. ChatGPT made the portfolio decisions; a human only prompted the model and entered the trades
    • Benchmarks: Russell 2000 and S&P 500 were plotted for context, not as a formal relative-performance test
    • Costs: the simulation did not include commissions or bid–ask spreads

    What the PDF actually reports (not a newsletter paraphrase):

    • The largest equity run in the series was +21.51% (a short window in mid-November 2025)
    • Maximum drawdown reached −50.33% (equity fell to $67.10 on that trough day, from the $100 start)
    • The portfolio was routinely 2–3 concentrated tickers; average position cost basis was about 25% of starting capital
    • Of 46 realized lot exits, exactly half were profitable, but average losses exceeded average gains (profit factor 0.82)
    • The model often re-entered tickers that had already lost money, and leaned on event-driven binary outcomes

    That is the important pattern: a headline “up” moment can sit next to a drawdown that would have shaken most people out. The study is exploratory. It documents behavior under thin capital and elevated micro-cap risk. It is not a claim that ChatGPT beats the market.

    Multi-model Reddit experiments (figures unverified)

    Several r/ChatGPT and r/artificial threads describe head-to-head tests: ChatGPT vs Gemini vs Claude vs Perplexity with small starting pots; GPT, Gemini, Grok and DeepSeek on paper Alpaca accounts with a live leaderboard; and a risk-management shootout across many models.

    We could not open those threads reliably enough to confirm dollar amounts, durations or whether money was real or paper. So this article does not quote their percentages. Methodologically they are useful as existence proofs: people are trying multi-model paper contests. They are too short and too lightly documented to crown a winner.

    The academic side: MarketSenseAI, agentic nowcasting, StockAgent, AlphaQuanter

    Four research papers from 2025–2026 are worth knowing about, because they try harder on leakage and benchmarks than a weekend Reddit run.

    MarketSenseAI (Signal or Noise in Multi-Agent LLM-based Stock Recommendations?): a deployed multi-agent LLM equity system, validated at the portfolio level with live, look-ahead-free signals. On its S&P 500 cohort (19 months, Sep 2024–Mar 2026), the strong-buy equal-weight portfolio averaged +2.18% per month against a passive equal-weight benchmark of +1.15%. That is a real published edge. The same paper shows the result rests on 19 monthly observations in a mostly rising market, and the S&P 100 cohort is directionally similar but statistically underpowered. Month by month, the strong-buy book still trailed its equal-weight benchmark in a large minority of months (we covered that pattern in our best AI stock picker piece).

    Agentic AI nowcasting (Autonomous Market Intelligence…): a fully agentic LLM rates every Russell 1000 stock daily from April 2025, searching the live web without curated inputs. The abstract’s headline result: longing the top 20 picks produced 18.4 bp of daily alpha (Fama–French five factors plus momentum) and an annualised Sharpe ratio of 2.43. The authors stress the edge is concentrated in the top tier and dilutes as you add more names; bottom-ranked stocks looked statistically like the market. Sample length is still short (about nine months in the draft we read).

    StockAgent (ACM): an LLM trading simulation designed to control for data leakage. Useful as a methodology paper; do not treat it as a retail performance claim.

    AlphaQuanter (ACL Findings 2026): an RL-trained single-agent framework with tool use, backtested on five large-cap stocks (GOOGL, MSFT, META, NVDA, TSLA). It reports strong backtest metrics versus prompt-only and multi-agent baselines. That is a different animal from a live multi-stock paper portfolio: small universe, historical simulation, research prototype.

    Scorecard

    Experiment Model(s) Universe Capital / size Duration Live / forward? Benchmark Headline (verified) Max drawdown / risk note Public logs?
    Smith micro-cap ChatGPT U.S. micro-caps $100 ~6 months Forward-only paper R2K / S&P as context Largest run +21.51% Max DD −50.33% Yes (paper + eval repo)
    MarketSenseAI Multi-agent LLM S&P 500 cohort ~35 strong-buys / month 19 months Live, no look-ahead Equal-weight S&P 500 +2.18%/mo vs +1.15% EW Trailed EW in many months Paper; system is commercial
    Agentic nowcasting Agentic LLM + web Russell 1000 Top-20 long ~Apr 2025–Jan 2026 Live nowcast FF5 + momentum 18.4 bp daily α; Sharpe 2.43 Edge concentrated in top tier Dataset / updates on GitHub
    AlphaQuanter RL single-agent 5 large-caps Single-name books 6-month test window Backtest B&H / rules / other agents SOTA vs listed baselines (paper) MDD reported per stock in paper Code + data on GitHub
    Reddit multi-model threads GPT / Gemini / Claude / Grok / … Mixed Small pots (claimed) Weeks Mixed / unclear Often none Not cited — unverified Unknown Thread posts only

    No milo paper-agent row here: we only add one when we can pull live paper-mode figures from the product. Guessing would break the point of the table.

    What the experiments get wrong (the fair-test checklist)

    Fair-test checklist comparing four verified AI paper-trading studies on forward testing, benchmarks, duration, costs, loss disclosure and public logs

    When a ChatGPT portfolio post goes viral, run it through this list before you copy the setup.

    Short windows and lucky single stocks

    Six months of micro-caps, or nine months of a rising Russell 1000, is not a career. Smith’s largest run was a handful of days. The nowcasting paper’s edge sat in the top 20 names. Concentrated luck looks like skill until the next regime.

    No benchmark or the wrong one

    Beating “cash” on a $100 account is not the same as beating a relevant index. Micro-caps should be judged against something like the Russell 2000, not the S&P 500, if you care about relative skill. Smith’s paper is careful about this: the big indexes are context, not the score. Many Reddit posts skip a benchmark entirely.

    Backtests vs forward-only tests (look-ahead bias)

    If the model may have seen the news, the filings or even the price path in training data, you are not testing prediction. The better papers (MarketSenseAI, the nowcasting study) insist on live or strictly timestamped generation. AlphaQuanter is explicit that it is a backtest. Both kinds of work are useful. They answer different questions.

    Concentration and drawdowns

    Smith’s book sat in two or three names and drew down more than 50%. The nowcasting alpha faded as the list got longer. MarketSenseAI’s edge is also a concentrated strong-buy filter, not “the whole index, but smarter.” High concentration is where the interesting numbers come from, and where the pain lives.

    Fair-test checklist (reuse this):

    1. Forward-only or live signals (no peeking)
    2. A matched benchmark for the same universe
    3. Same investable set for the AI and the benchmark
    4. Costs included (spread, commission, turnover)
    5. Duration of at least six months, ideally through a bad stretch
    6. Losses and drawdowns disclosed, not only winners
    7. Decisions logged with reasons you can audit

    What the serious research actually found

    Put together, the rigorous work does not say “ChatGPT prints money.” It says something narrower:

    • There is evidence of selection skill in some live or forward setups, especially in top-ranked or strong-buy buckets.
    • The edges are sample-short, often concentrated, and sit next to real drawdowns or months of underperformance.
    • Asymmetry shows up repeatedly: models are better at picking winners than losers (nowcasting paper), or portfolio outcomes are dominated by a few binary bets (Smith).
    • There is no consensus that a general-purpose chatbot, left alone with a brokerage, is a reliable stock picker.

    That is still interesting. It is not a product brochure.

    How to run your own fair AI paper-trading test

    If the secondary question on your mind is “how would I test an AI myself without risking money?”, here is a boring, fair protocol:

    1. Pick a universe (for example, a fixed list of 50 liquid U.S. stocks) and freeze it.
    2. Pick a benchmark that matches that universe (equal-weight of the same list, or a relevant ETF).
    3. Go forward-only. Prompt the model with information available that day. No “what would you have done in 2022?”
    4. Log every decision and the reason in plain English, including holds.
    5. Include costs in the paper ledger, even if they are rough (for example, a fixed bps per trade).
    6. Run at least six months, and keep going through an ugly stretch if you get one.
    7. Publish the losers with the winners. If you cannot show the drawdown, you do not have a result.

    Want to see an AI agent explain every stock decision before you trust it? milo runs stock agents in paper mode, with no real money, and narrates each move in plain English. → andmilo.com/stocks

    FAQ

    Can ChatGPT pick stocks?
    Yes, it can generate picks and run a simulated portfolio, but public tests are short and volatile. In one six-month micro-cap paper-trading study, the portfolio’s maximum drawdown reached −50.33%. Treat AI picks as research input, not advice.

    Has anyone tested ChatGPT with real or paper money?
    Yes. Nathan Smith’s forward-only micro-cap paper trade is the clearest documented ChatGPT portfolio study we verified end to end. Multi-model Reddit experiments exist too; most are paper or very small accounts, and we could not confirm their posted figures from primary pages.

    Can AI beat the stock market?
    Some 2026 research reports outperformance — MarketSenseAI versus an equal-weight S&P 500 book, and an agentic nowcasting study with alpha concentrated in the top 20 picks — but the samples are short and the edges narrow. There is no consensus.

    What is AI paper trading?
    An AI makes simulated trades with no real money, so you can measure its decisions and risk before trusting it with anything that matters.

    How do you test an AI trading strategy fairly?
    Go forward-only, use a matched benchmark, include costs, run 6+ months, and disclose losses.

    Which AI is best at picking stocks: ChatGPT, Gemini, Claude or Grok?
    There isn’t enough rigorous evidence to name one. The head-to-head Reddit tests are too short to generalize from. Don’t pick a “winner” off a weeks-long leaderboard.


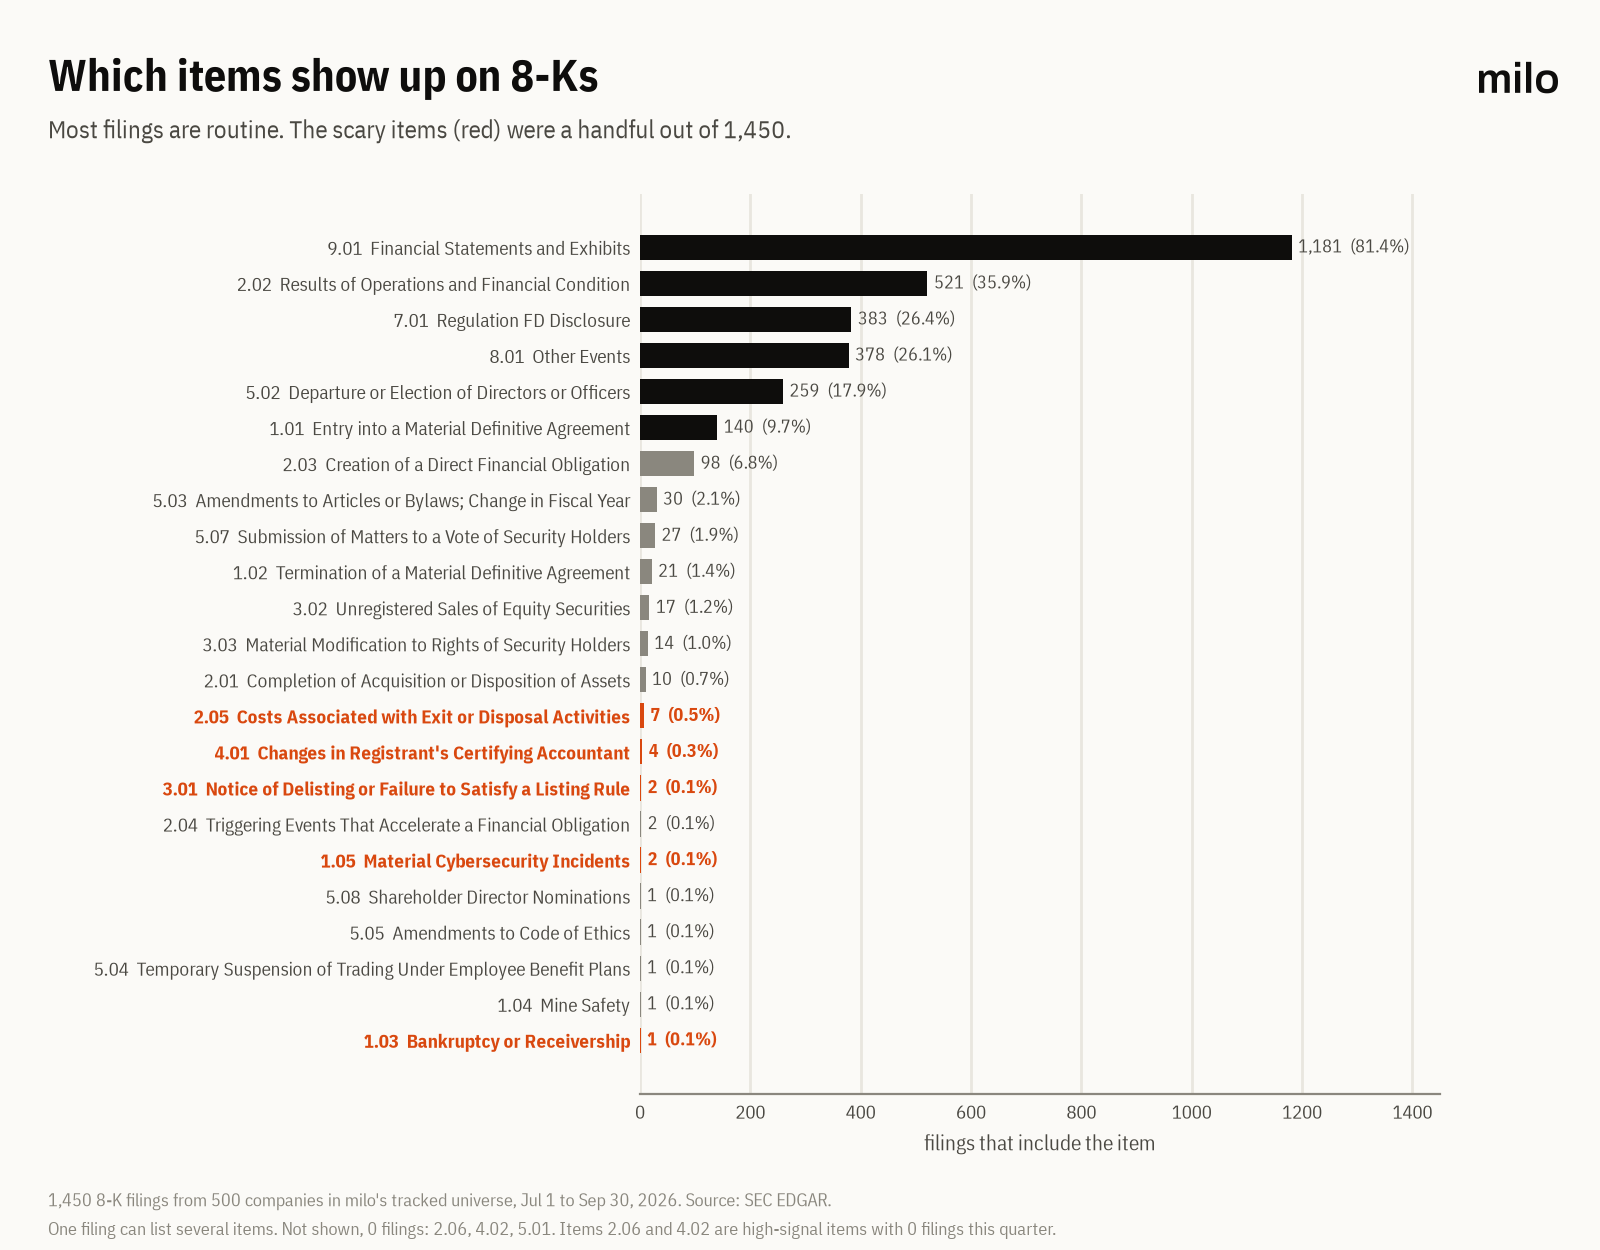
    milo’s stock agents are paper trading and research only (insider buys, Congress trades, 8-K filings). Try one at andmilo.com/stocks. Related read: milo Insider Digest #1.

    Educational content, not investment advice. Paper-trading results don’t reflect real-money trading.

    Raydium Review 2026: Fees, Features & Verdict

    0

    Raydium quietly powers a huge slice of Solana’s on-chain economy, yet it rarely gets the same hype as newer DEXs or aggregators. If you have traded a Solana memecoin, farmed yield on a stablecoin pair, or launched a token through an AMM pool, chances are Raydium’s liquidity was in the mix somewhere. But is it still the best place to swap, provide liquidity, or launch a pool in 2026? This review digs into the fees, the features, the trade-offs, and the verdict.

    TL;DR: Our Quick Verdict on Raydium

    Rating: 4.3 / 5

    Raydium remains one of the most important liquidity venues on Solana. It combines a classic AMM, a hybrid order-book integration, and a growing suite of LP tools that still make it a top choice for traders who want deep pools, concentrated liquidity ranges, and a clean path to listing new tokens. The user interface is polished, fees are competitive, and TVL has stayed above $1.2 billion through 2026. The main knocks are the lack of a native cross-chain layer, a RAY token that has underperformed the broader Solana rally, and a crowded field where Jupiter still routes most retail swaps. If you live on Solana, Raydium belongs in your toolbox. If you need multi-chain support out of the box, you will still need an aggregator alongside it.

    Visit Raydium

    Raydium TVL, Volume, and Price statistics infographic 2026

    What Is Raydium?

    Raydium is an automated market maker (AMM) and liquidity provider built on Solana. It launched in early 2021 and was one of the first protocols to pair an AMM with an on-chain central limit order book, back when it integrated with Serum. Today Raydium runs on its own hybrid model: standard constant-product pools, concentrated liquidity pools similar to Uniswap V3, and a dedicated launch infrastructure called AcceleRaytor and the newer LaunchLab product line.

    The protocol is governed in part by the RAY token, which captures a small share of trading fees through buybacks. Raydium is non-custodial, which means users keep control of their own keys through a Solana wallet like Backpack or Solflare, and interact with the protocol directly from the browser or mobile.

    Raydium By The Numbers (October 2026)

    Here are the key stats as of this review, pulled from DeFiLlama, CoinGecko, and Birdeye:

    • Total Value Locked: $1.21 billion, up roughly 6.1 percent over the past 30 days.
    • 24-hour trading volume: $174.9 million, up 33.3 percent day over day thanks to a memecoin rotation.
    • 7-day volume: $1.24 billion.
    • 30-day volume: $8.35 billion, which places Raydium inside the top five Solana DEXs by throughput.
    • RAY price: $2.08.
    • RAY market cap: $560.5 million, with a circulating supply around 269 million tokens.
    • Supported chain: Solana only (with wrapped and bridged assets available).

    The TVL has stayed remarkably sticky through a choppy summer. Even when Solana memecoin volumes faded in Q3, Raydium’s pools kept most of their deposits, a sign that LPs trust the protocol with real capital rather than just hot-money speculation.

    Features Deep Dive

    Standard AMM Pools

    The classic Raydium experience is the constant-product AMM. Any user can swap through these pools, and anyone can deposit two tokens to become a liquidity provider. Fees for most standard pools sit at 0.25 percent per trade, with 0.22 percent going to LPs and 0.03 percent routed to the RAY buyback pool.

    Concentrated Liquidity (CLMM)

    Raydium’s concentrated liquidity pools, often called CLMMs, work similarly to Uniswap V3. LPs can set a specific price range where their capital earns fees. This produces higher capital efficiency and larger fee yields for active providers, but it also means LPs need to rebalance when the market drifts out of their range. Fee tiers in CLMM pools typically range from 0.01 percent for stablecoin pairs to 1 percent for volatile pairs, so the economics change substantially depending on which pool you join.

    Hybrid Order Book Integration

    Historically Raydium shared liquidity with the Serum order book, so swap routes could pull from both the AMM and a limit order book at the same time. After the Serum shutdown in late 2022, Raydium rebuilt this integration with OpenBook, Solana’s community-driven order book. In 2026, most retail swaps route through the AMM, but larger traders can still tap deeper liquidity on paired OpenBook markets for tighter execution.

    LaunchLab and Memecoin Launches

    Raydium has leaned into Solana’s memecoin boom with LaunchLab, a project launch and bonding-curve platform aimed at new tokens. It is one of the main destinations for projects that graduate from pump.fun style bonding curves and want permanent liquidity on an AMM. For creators, this means fast listing, immediate price discovery, and native integration with Raydium’s existing pool infrastructure.

    Yield Farming

    Raydium’s “Farms” section lets LP token holders stake their positions to earn additional rewards, often in RAY plus a partner token. Yields vary widely, from mid-single digits on stablecoin pairs to 50 percent or higher APR on new memecoin pools. These are high-risk, high-reward opportunities where impermanent loss can easily eat the posted APR, so position sizing matters.

    Raydium Solana DEX interface and branding

    Portfolio and LP Dashboard

    The Raydium portfolio tab gives LPs a clean view of their positions, pending rewards, impermanent loss exposure, and historical fees earned. It is not as deep as a third-party tracker, but it is enough to manage positions without jumping to another tool. For broader portfolio tracking across protocols, pairing Raydium with a dedicated analytics tool is still the better workflow.

    Fees and Pricing

    Fees are the first thing anyone looking at a DEX should check, and Raydium’s structure is competitive without being the cheapest option on Solana.

    • Standard AMM swap fee: 0.25 percent per trade (0.22 percent to LPs, 0.03 percent to RAY buyback).
    • CLMM fee tiers: 0.01 percent, 0.05 percent, 0.25 percent, and 1 percent, chosen by pool creators.
    • LaunchLab fees: Varies by launch, typically a small protocol cut on the bonding curve and a listing fee at graduation.
    • Network fee: Standard Solana network fees apply, typically fractions of a cent per transaction.
    • Deposit or withdrawal fees: None. LPs can enter and exit positions at any time, paying only Solana gas.

    Compared to peers, Raydium sits in the middle. Orca generally undercuts on stablecoin pairs with its 0.01 percent tier, and Jupiter can save traders money by routing across multiple DEXs. But for direct pool trades, Raydium’s fees are reasonable, especially given the depth of its memecoin and token2022 liquidity.

    Pros and Cons

    Pros

    • Deep liquidity across memecoin, blue-chip, and stablecoin pairs on Solana.
    • Both standard AMM and concentrated liquidity pools in one interface.
    • LaunchLab provides a strong on-ramp for new projects without needing bespoke listings.
    • Clean, responsive UI that works well on both desktop and mobile.
    • Native integration with major Solana wallets and widely supported by aggregators.
    • Low Solana network fees keep active LP management cheap.
    • Transparent fee breakdown with clear routing of buybacks to RAY.

    Cons

    • Solana only. No native support for Ethereum, Base, or other chains.
    • Standard AMM fee of 0.25 percent is higher than Orca’s cheapest stablecoin tier.
    • RAY token has underperformed SOL and most Solana DeFi tokens over the past year.
    • Impermanent loss on CLMM pools can be brutal in high-volatility memecoin pairs.
    • No native fiat on-ramp, so new users still need a CEX or wallet integration to buy SOL first.
    • Documentation around some newer features like LaunchLab tier mechanics could be clearer for first-time creators.

    Security and Trust

    Raydium has been live for close to five years, which in DeFi terms is a serious track record. The protocol has survived multiple Solana outages, the collapse of FTX and Serum, and a 2022 exploit of a pool authority that saw the team cover affected users with its own treasury and a RAY buyback adjustment. That response, while not perfect, signaled a willingness to make depositors whole and reset the system rather than socialize losses to LPs.

    Smart contract audits have been performed by firms including Kudelski Security and OtterSec, with the latest reviews published on Raydium’s documentation site. The protocol is open source, with its program code viewable on GitHub, and governance updates are announced through the official @RaydiumProtocol channels. As with any DeFi protocol, residual smart contract risk is real. LPs should size positions accordingly and prefer audited pools over fresh deployments.

    User Experience

    The Raydium interface is one of the better DeFi UIs on Solana. Swaps load in under a second once the wallet is connected. Pool views show APR, TVL, and 24-hour volume at a glance. Adding or removing liquidity takes a handful of clicks, and transaction simulation surfaces estimated slippage before the trade signs.

    Mobile support is strong. Raydium’s responsive web app works well through Phantom’s in-app browser and other Solana wallet browsers. Dedicated apps are not required, which keeps the user flow simple. The main friction point is the sheer density of information in the LP dashboard, which can feel overwhelming the first time a user manages a concentrated liquidity position.

    Who Should Use Raydium?

    Raydium is a great fit for several user profiles in 2026:

    • Active Solana traders who want direct access to AMM pools without routing through an aggregator every time.
    • Liquidity providers who are comfortable managing concentrated ranges and want higher capital efficiency.
    • Memecoin degens looking for the first permanent AMM listings for tokens graduating from bonding curves.
    • Project teams that want a plug-and-play launch infrastructure through LaunchLab.
    • Yield farmers who are willing to accept volatility in exchange for high posted APRs.

    Who should probably skip Raydium? Multi-chain traders who do not want to maintain a Solana workflow, retail users who prefer the simplicity of a swap aggregator, and risk-averse holders who are not comfortable with impermanent loss math.

    Final Verdict

    Raydium has aged well. In a market where new DEXs ship every quarter and old ones get forgotten by the next memecoin cycle, Raydium has kept its liquidity sticky, its interface sharp, and its product roadmap focused on real on-chain needs. It is not the cheapest DEX on Solana for every pair, and the RAY token’s price action continues to lag the broader ecosystem. But as a core piece of Solana’s DeFi stack, it remains close to indispensable.

    If you spend any serious time on Solana, Raydium is worth having in your rotation. For a quick swap of a well-known pair, an aggregator may still find a better route. For deeper LP strategies, direct AMM access, and participation in new launches, Raydium is where the work happens.

    Our rating: 4.3 / 5. Visit Raydium and connect a Solana wallet to try it yourself. For a broader view of where Solana is headed from here, see our Solana price prediction for 2027.

    FAQ

    Is Raydium safe to use in 2026?

    Raydium has been live since 2021, has been audited by firms including OtterSec and Kudelski Security, and has a track record of covering users after one past exploit. No DeFi protocol is risk-free, but Raydium ranks among the better-tested AMMs on Solana. Users should still verify pool addresses, start with small test transactions, and avoid fresh unaudited pools when possible.

    What is the difference between Raydium and Jupiter?

    Jupiter is a swap aggregator that routes trades across many Solana DEXs, including Raydium, to find the best price. Raydium is one of those underlying DEXs. For a one-off swap, Jupiter often gives better execution. For LPing, launching tokens, or managing concentrated liquidity, you interact directly with Raydium.

    What are Raydium’s fees?

    Standard AMM pools charge a 0.25 percent swap fee, split between LPs (0.22 percent) and RAY buybacks (0.03 percent). Concentrated liquidity pools use tiered fees of 0.01, 0.05, 0.25, and 1 percent depending on pair volatility. Solana network fees are a fraction of a cent per transaction.

    Can I earn yield by providing liquidity on Raydium?

    Yes. LPs earn swap fees from the pool and can stake LP tokens in Raydium’s Farms section for additional RAY and partner-token rewards. Yields vary from mid-single digits for stablecoin pairs to 50 percent plus APR on new memecoin pools. Factor in impermanent loss before committing capital.

    Does Raydium work on mobile?

    Yes. The Raydium web app is responsive and works smoothly inside Solana wallet browsers like Phantom, Backpack, and Solflare. There is no dedicated iOS or Android app, which keeps the experience simple and reduces attack surface.

    Stacks (STX) Price Prediction 2027: Can STX Hit $1?

    Stacks (STX) trades at $0.43 at the time of writing, up roughly 10% in the last 24 hours and climbing out of a sideways range that trapped the token for most of 2026. The focus of this Stacks price prediction 2027 piece is simple, because the next 12 months are shaping up to be the most consequential in the project’s history.

    Three things changed this year. The Nakamoto upgrade cut Stacks block times to seconds. The sBTC bridge crossed 2,949 BTC in supply by the end of Q2, bringing real Bitcoin into Stacks smart contracts without a centralized custodian. And the Stacks Q2 2026 ecosystem report showed cumulative wallets passing 1.6 million while daily active users jumped 55% quarter over quarter.

    So the question we are answering: can STX reclaim $1 by late 2027, and what has to happen for the bull case to play out? We will walk through the current setup, the bull and bear cases, three price targets by timeframe, how Stacks compares to CORE DAO, and the scenarios that would flip our view either way.

    Key Takeaways

    • STX trades at $0.43 with a market cap near $796M, ranking around #89 by capitalization.
    • The sBTC bridge, Fireblocks custody integration, and PoX-5 upgrade are the three catalysts within the next 90 days.
    • Our base case targets $0.70 within six months. The bull case is a $1.00 reclaim by late 2027 if sBTC supply doubles.
    • Downside risk sits at $0.30 if Bitcoin DeFi narratives cool or token unlocks weigh on the chart.
    • STX is still roughly 89% below its all-time high of $3.86, which gives any sustained rally a long runway.
    Stacks (STX) price prediction 2027 hero graphic, current price $0.43 and sBTC Bitcoin L2 catalyst

    Where Stacks Stands Today

    Before the forecast, the current snapshot. STX is doing what mid-cap Bitcoin ecosystem tokens tend to do at the start of a new narrative cycle: outperforming on the way up, consolidating on the way down, and attracting steady on-chain volume.

    Metric Value
    Price $0.43
    24h Change +10.03%
    Market Cap $796.5M
    24h Volume $107.3M
    Rank #89
    Circulating Supply 1.9B STX
    All-Time High $3.86
    % From ATH roughly 89% below

    The 24h volume to market cap ratio sits near 13%, which is healthy. Compare that to the Solana ecosystem leaders we covered in our recent SOL price prediction, where volume to market cap often runs closer to 5%. Higher turnover usually means a token is being actively traded rather than passively held, and that is often a precondition for a trend to form.

    Why Is Stacks Rising Right Now?

    Three forces are driving STX. First, Bitcoin DeFi is finally a real narrative with real numbers behind it. The sBTC bridge has unlocked native-feeling Bitcoin yield for the first time, with BitFlow’s sBTC pairs averaging a 17.9% BTC APY over 30 days during Q2. Hermetica’s hBTC and Stacking DAO’s stSTX both posted all-time-high TVLs.

    Second, institutional plumbing is in place. The Fireblocks custody integration, finalized earlier in 2026, lets institutional desks hold and move STX and sBTC through MPC wallets. That matters because the first bull run for Stacks in 2024 ended partly because custodians could not comfortably hold the asset.

    Third, UTXO Management, a subsidiary of Nakamoto Inc. (NASDAQ: NAKA), signed on as the inaugural Bitcoin Staking participant and committed part of its treasury BTC. Bitcoin Magazine reported a target of around 3% BTC-denominated yield. Public-company treasuries buying into a Bitcoin L2 yield mechanism is a credibility unlock, not a trade.

    The Bull Case for STX

    sBTC Supply Doubles by Mid-2027

    If sBTC supply roughly doubles from 2,949 BTC to 6,000 BTC over the next 12 to 15 months, STX captures more of the Bitcoin DeFi mindshare. Historical patterns from Ethereum’s early DeFi summer suggest native-asset bridges tend to compound, not decay. More sBTC means more liquidity in Zest for lending, more volume on BitFlow, and a larger pool of fees funnelling back to STX stackers.

    PoX-5 Mainnet and Bitcoin Staking Go Live

    PoX-5 is the next consensus upgrade. It introduces a new staking model with waterfall bond structuring and a 15% reserve fund. It also opens the Bitcoin Staking primitive to a broader set of participants beyond the UTXO Management pilot. If this ships cleanly in Q4 2026 or Q1 2027, STX stackers see a real yield pickup, and that is a textbook rerating catalyst.

    Public-Company Treasuries Buy In

    The thesis is simple: the top 100 Bitcoin treasury companies hold more than 1.2 million BTC, roughly 5% of supply. Even a 1% to 2% allocation to Bitcoin Staking through Stacks would be a nine-figure capital inflow. That is a slow drip, not a rocket, but the kind of flow that reprices mid-cap tokens on a six-month horizon.

    The Bear Case for STX

    sBTC Growth Stalls

    If sBTC supply stays flat or grows below 10% per quarter, the Bitcoin DeFi narrative loses momentum. Capital does not stay patient. Rival Bitcoin L2s like CORE DAO, Rootstock, and BOB would start to look more attractive on a growth-rate basis, and STX would compress back to the lower end of its range.

    Token Unlocks and Stacking Dilution

    Stacks has a predictable emission schedule, and roughly half of circulating STX is already deployed in stacking contracts. If STX price falls and holders de-stack to realize gains, the float increases and spot pressure builds. Dilution risk is limited since circulating supply already equals total supply, but liquid float swings matter at this market cap.

    Bitcoin Beta Risk

    STX is a high-beta Bitcoin asset. In practical terms, when BTC falls 10%, STX has historically fallen 15% to 20%. If Bitcoin breaks down below $90,000 and stays there, STX follows. No amount of ecosystem progress overrides BTC price action in the short term, and traders should size positions accordingly.

    Stacks Price Prediction 2027: Targets by Timeframe

    Stacks (STX) price prediction 2027 targets table, bear $0.30, base $0.70, bull $1.00 across timeframes

    These are the levels our model and the on-chain context point to. They are not promises. Price predictions are hypotheses with timeframes, and every target comes with a condition.

    30-Day Outlook

    Short-term, STX looks like a continuation setup. Base case is a drift to $0.48 as the recent breakout consolidates. Bull case is $0.65 if BTC breaks to a new all-time high and the Bitcoin DeFi trade reaccelerates. Bear case is $0.35 if BTC pulls back toward $90K and risk assets compress.

    6-Month Outlook

    By April 2027, PoX-5 should be live and sBTC supply numbers for Q4 2026 will be public. Base case is $0.70. Bull case is $1.00, which lines up with the 2024 high and the main round-number magnet above the current range. Bear case is $0.30, roughly a retest of the 2026 lows if the narrative cools entirely.

    Long-Term (2027 to 2028)

    The long-term range is wider. Base case targets $1.20, which assumes steady but unspectacular sBTC growth and no new unlocks. Bull case is $2.50, which requires Bitcoin DeFi TVL to grow 3x to 5x from current levels and sustained public-company treasury participation. Bear case is $0.40, which assumes Bitcoin L2 competition fractures the market.

    For context, CryptoRank’s 2026 to 2030 outlook puts STX in a $5 to $8 range in a bullish 2027 scenario. We think that is aggressive. Our base is more conservative because mid-cap altcoins historically underperform their peak-cycle targets by 30% to 50%.

    How Does Stacks Compare to CORE DAO?

    The closest competitor to Stacks is CORE DAO, another Bitcoin smart contract chain with its own staking mechanism. Here is the side-by-side on the metrics that matter.

    Metric Stacks (STX) CORE DAO (CORE)
    Market Cap $796M ~$450M
    BTC Bridge Supply 2,949 BTC (sBTC) ~1,400 BTC (lstBTC)
    Smart Contract Language Clarity Solidity (EVM)
    Consensus Proof of Transfer (PoX) Satoshi Plus (DPoW)
    Block Time ~5 seconds ~3 seconds
    Institutional Custody Fireblocks integrated BitGo, Copper
    Native Yield Bitcoin Staking (3% BTC APY target) BTC Staking (variable)

    Stacks has the larger market cap and the deeper BTC bridge. CORE DAO has an EVM-compatibility advantage for developer onboarding. If you think the next wave of Bitcoin DeFi gets built by Ethereum-native devs, CORE wins. If you think it becomes its own thing with its own language, STX is the better bet. Both can win. The market is not winner-take-all.

    What Would Flip Our View on STX?

    Three concrete triggers would move us off the base case.

    Flip bullish: sBTC supply crosses 5,000 BTC before Q2 2027, OR a top-five public-company Bitcoin treasury allocates to Bitcoin Staking in size, OR Zest and BitFlow combined TVL crosses $500M.

    Flip bearish: sBTC supply drops below 2,500 BTC in any quarter, OR PoX-5 ships with a critical security flaw, OR Bitcoin breaks $85K support and stays there for more than 30 days.

    Flat and hold: sBTC grows 10% to 20% per quarter, PoX-5 ships without drama, BTC stays in a $95K to $130K range. In that scenario, STX grinds between $0.40 and $0.70 for most of 2027.

    Frequently Asked Questions

    Is Stacks a good investment in 2027?

    Stacks offers direct exposure to the Bitcoin DeFi thesis, one of the few credible narratives tying mid-caps to the Bitcoin treasury flywheel. The risk-reward favors patient holders if sBTC growth continues. It is not a sure bet, and position sizing matters because STX has roughly 1.5x to 2x the volatility of BTC itself.

    Will STX reach $1 by 2027?

    Our base case has STX trading between $0.70 and $1.20 by late 2027. A clean break above $1 requires sBTC supply to roughly double and institutional Bitcoin Staking participation to scale. The bull case gets STX to $2.50 if both of those happen and BTC runs to new all-time highs. The bear case keeps STX below $0.50.

    What is sBTC and how does it work?

    sBTC is a two-way peg that moves Bitcoin between the base layer and Stacks without a centralized custodian. Users deposit BTC and mint sBTC on Stacks, which can then flow through DeFi protocols. When they want BTC back, they burn sBTC and the bridge releases the underlying Bitcoin.

    How does Stacks compare to Rootstock and other Bitcoin L2s?

    Stacks is purpose-built as a Bitcoin smart contract layer with its own language (Clarity) and settles state back to Bitcoin. Rootstock uses a merge-mined sidechain with EVM compatibility. CORE DAO uses hybrid consensus. Stacks leads in native BTC bridge supply. CORE leads in developer accessibility.

    What is the Nakamoto upgrade?

    Nakamoto was the biggest hard fork in Stacks history, activated in October 2024. It cut block times from the roughly ten-minute Bitcoin cadence down to seconds, and it introduced the groundwork for sBTC. It is the moment Stacks stopped being a slow Bitcoin sidechain and became a usable DeFi platform.

    The Honest Take

    Stacks is not a hype trade right now. It is a slow-building thesis trade with real numbers behind it. The sBTC supply curve is the single most important chart we are watching. If it compounds through 2027, STX reclaims $1 and probably more. If it stalls, the whole Bitcoin L2 narrative decelerates and STX stays rangebound.

    The upside case is credible but not guaranteed. The downside case is uncomfortable but limited by how far STX has already fallen from its ATH. For traders, this is a setup worth monitoring. For long-term holders who believe Bitcoin DeFi will matter, STX is one of two or three pure plays worth researching alongside Bitcoin forks like BCH and the broader L1 landscape.

    Disclaimer: This article is for informational and educational purposes only and should not be construed as financial, investment, or trading advice. Cryptocurrency markets are highly volatile, and past performance does not guarantee future results. The price predictions and analyses presented here are based on AI models, technical indicators, and available data at the time of writing, they are not guarantees. Always conduct your own research (DYOR) and consult with a qualified financial advisor before making any investment decisions. Pump Parade and its authors do not assume liability for financial losses incurred based on information provided in this article.

    Render (RNDR) Price Prediction 2027: Can RENDER Hit $5?

    Render (RENDER) trades at $2.11 after a 11% daily rip, and the token now sits roughly 85% below its 2024 all-time high of $13.63. The GPU rental network has quietly become the clearest crypto bet on AI compute demand, with on-chain data from Render Network Foundation showing AI workloads at 35 to 40% of total network volume. The question driving every Render price prediction 2027 search right now is simple: can RENDER actually hit $5 before Christmas next year, or is this just another AI token head-fake?

    The setup is interesting. RENDER was down 85% from its ATH into early October, then ripped 11% in a single session on reported governance progress for two capacity-expansion proposals. The AI narrative is back on the table. Nvidia’s Blackwell B200 rollout is spilling GPU demand into every corner of the market, and decentralized compute networks are catching bids as pure-play plays on that trend.

    Below, we break down where RENDER stands today, the real catalysts and risks over the next 15 months, and three price targets you can actually defend with data. We also run a head-to-head against io.net, the closest competitor, and answer the questions buyers are asking Google right now.

    Key Takeaways

    • Current state: RENDER at $2.11, market cap $1.09B, rank 83, down 84.54% from its March 2024 ATH of $13.63.
    • Main catalyst: Pending governance proposals RNP-019 and RNP-023 could add roughly 60,000 consumer GPUs and expand AI-focused capacity.
    • Tokenomics: Burn-Mint Equilibrium model, with token burns reportedly up 278.9% year-over-year through late 2025.
    • Bull target: $5.00 by end of 2027 if AI compute demand holds and the two capacity RNPs ship on schedule.
    • Bear risk: $0.90 if hyperscaler GPU supply floods the market and the “DePIN discount” widens.
    • The honest take: This is a high-beta AI proxy, not a stablecoin. The setup is credible but needs network growth to show up in token burns before $5 becomes a base case.
    Render (RENDER) price prediction 2027 hero graphic. Current price $2.11, 60,000 GPU capacity vote catalyst.

    Where RENDER Stands Today

    Here’s the current state of the Render token, pulled live from on-chain and market data at the time of writing.

    Metric Value
    Price $2.11
    24h change +11.09%
    7-day change +5.67%
    Market cap $1.09B
    24h volume $29.0M
    Market cap rank #83
    All-time high $13.63 (March 2024)
    % from ATH -84.54%
    Circulating supply ~532M RENDER
    Max supply ~644M RENDER

    Two numbers matter here. First, $1.09 billion is not a huge market cap for a project that sells into one of the largest spend categories in tech. Second, 85% below ATH tells you the market has already priced in a lot of disappointment. The question is whether that disappointment is still rational in the age of Blackwell.

    Why Is RENDER Rallying Right Now?

    Three forces are moving the token into the back half of 2026. One, AI compute demand continues to run ahead of supply. Hyperscalers are reporting multi-quarter waitlists for H200 and B200 GPUs, and the overflow is reaching smaller studios, independent researchers, and Web3 teams that cannot access traditional cloud capacity at any price. That is Render’s native market.

    Two, governance momentum. The Render Foundation is advancing RNP-019 and RNP-023, two proposals that together would add approximately 60,000 consumer GPUs and expand AI subnet capacity. If both pass, Render roughly doubles the compute it can meter and burn against.

    Three, the Solana migration is maturing. Render completed its move from Ethereum to the Solana Virtual Machine in 2024, and the token is now settling the vast majority of its volume on Solana rails. Lower fees mean more frequent compute jobs make economic sense, which widens the addressable market for small AI inference workloads. If you want context on the chain itself, our Solana price prediction for 2027 covers the SOL side of that story.

    The Bull Case

    GPU demand keeps outrunning hyperscaler supply

    Enterprise AI spend has not slowed. Nvidia’s data center segment is still absorbing every chip it can ship, and the gap between demand and allocated supply has widened, not narrowed, through 2026. Render monetizes that gap. Every rendering job, whether a Hollywood VFX frame or a batched AI inference task, triggers token flow under the Burn-Mint Equivalence model. More jobs, more burn, less float.

    RNP-019 and RNP-023 ship on schedule

    If both capacity proposals clear governance and the GPUs come online in the first half of 2027, Render’s throughput roughly doubles. The practical read-through: a credible path to meaningful fee revenue and sustained burns that the market can actually model. Analysts tracking the rising AI compute demand on Render are already citing year-over-year burn growth of 278.9% through late 2025 as evidence the mechanism works at scale.

    DePIN sector gets its ETF moment

    Spot ETFs have widened the on-ramp for BTC, ETH, SOL, and now a handful of mid-caps. If the SEC extends that treatment to a basket DePIN product in 2027, Render is one of the three or four names any issuer builds around. That is a structural bid, not a narrative trade.

    The Bear Case

    Hyperscalers catch up and the DePIN discount widens

    The simple risk: Nvidia, TSMC, and the hyperscalers close the GPU supply gap faster than expected. If AWS, Azure, and Google Cloud can price match a decentralized network, enterprise buyers will stay on the incumbents for compliance reasons alone. Render’s thesis gets harder to sell.

    Token burns do not translate to price

    Burn mechanics are only bullish if demand for the token outpaces supply issuance. Render still issues RENDER to GPU operators as emissions. If the network grows but burns do not meaningfully exceed emissions, the float stops shrinking. Multiple other DePIN tokens have hit this ceiling.

    AI narrative fatigue

    Markets rotate. If the AI trade peaks and capital rotates into the next theme, RENDER likely gets sold alongside Bittensor and other AI tokens, regardless of fundamentals. Beta is a two-way street.

    Will RENDER Reach $5 by 2027? Price Targets by Timeframe

    Render (RENDER) price prediction 2027 targets table. Bear $0.90, base $3.75, bull $5.00 to $6.50.

    Here is how the three horizons shake out, with explicit bear, base, and bull cases for each.

    30-day outlook (through mid-November 2026)

    • Bear: $1.65 if the broader market rolls over and the current rally fades without governance news.
    • Base: $2.30, modest continuation if volume holds above $25M per day.
    • Bull: $2.85 if RNP-023 gets a scheduled vote date and AI compute demand headlines keep coming.

    6-month outlook (through April 2027)

    • Bear: $1.40 if AI narrative cools and RENDER retests the summer 2026 lows.
    • Base: $3.10, assuming at least one capacity RNP passes and burns continue trending higher.
    • Bull: $4.25 if both RNPs clear governance and a credible DePIN ETF filing lands.

    Long-term (year-end 2027)

    • Bear: $0.90 if hyperscalers out-compete on price and token burns stall.
    • Base: $3.75, a reclaim of 2024 territory on steady AI growth and completed capacity upgrades.
    • Bull: $5.00 to $6.50, which would require AI compute to remain capacity-constrained plus a DePIN product on a major exchange or ETF rail.

    For comparison, Benzinga’s analyst aggregation puts the 2026 Render average target at $4.25, while BYDFi’s bull scenario stretches to $8 for 2027 and 2028. Our base case sits conservatively between those two.

    Is RENDER a Better Bet Than io.net?

    io.net is the closest competitor. Both run GPU marketplaces, both are built on Solana, and both are pitched as the picks and shovels of the AI build-out. Here is how they stack up on the metrics that matter.

    Metric RENDER io.net (IO)
    Market cap $1.09B ~$180M
    Core use case GPU rendering + AI inference AI training clusters
    Settlement chain Solana Solana
    Tokenomics Burn-Mint Equilibrium Fixed supply + emissions
    Flagship partners OTOY, Stability AI, Endeavor Various AI startups
    Governance RNP system, active Foundation-led
    Peak-to-trough -85% from ATH -95%+ from ATH
    Positioning Hollywood + AI Pure AI compute

    Translation: Render is the more mature project, with a real customer base in 3D rendering before AI was even a crypto narrative. io.net is the higher-beta, higher-risk bet with more upside if AI training workloads centralize on crypto rails. Most portfolios that hold both weight RENDER at roughly 3 to 5 times IO exposure.

    What Would Change Our View

    Three triggers would move us from base to bull, or from base to bear.

    1. Burn growth stalls below 100% YoY. The 278.9% figure through late 2025 is the single most important data point in the thesis. If quarterly burn growth drops materially below triple digits while emissions hold, the deflationary case weakens and we revise toward the bear range.
    2. Both RNP-019 and RNP-023 clear and ship. If 60,000 additional GPUs come online and the AI subnet goes live by mid-2027, the base case shifts up by 20 to 30% and $5 becomes the central tendency, not the bull extreme.
    3. Nvidia launches a direct cloud rental competitor. If Nvidia DGX Cloud or an equivalent slashes retail GPU rental pricing by 40%+, that is a direct arrow at Render’s revenue model. Bear case moves from $0.90 to the mid-$0.60s.

    Frequently Asked Questions

    What is the Render (RENDER) price prediction for 2027?

    Our base case puts RENDER between $3.10 and $3.75 by the end of 2027, with a bull target of $5.00 to $6.50 and a bear case of $0.90. The range reflects uncertainty on AI compute demand and governance execution over the next 15 months.

    Can RENDER reach $5 in 2027?

    $5 is plausible but requires two things to hit together: AI compute demand must remain capacity constrained through 2027, and RNP-019 and RNP-023 need to clear governance and ship. If either leg fails, $3 to $4 is the more realistic ceiling. If both land, $5 becomes the base case rather than the bull scenario.

    Is RENDER a good long-term investment?

    RENDER is a leveraged bet on decentralized GPU compute. The project has real customers, working tokenomics, and credible governance. It is also down 85% from its ATH, which cuts both ways. For a long-term hold thesis, size it as a high-beta AI proxy rather than a core position, and expect 50% drawdowns along the way.

    Why is RENDER linked to AI growth?

    Render operates a decentralized GPU marketplace. The same chips that train and run AI models render 3D graphics, so demand for AI compute directly bids up Render’s rental market. AI workloads already account for 35 to 40% of network volume, up from a small single-digit share in 2023.

    How does RENDER compare to Bittensor (TAO)?

    Bittensor is a decentralized machine learning network. Render is a decentralized GPU rental network. Both are AI plays, but they monetize different layers of the stack. TAO captures value when models get trained on-chain, RENDER captures value when any GPU workload runs. Our Bittensor price prediction covers the TAO side in detail.

    Where can I trade RENDER?

    RENDER trades on all major centralized exchanges and across Solana DEX aggregators, including Jupiter. If you prefer a self-custody route, our Jupiter overview walks through how the Solana DEX layer handles tokens like RENDER.

    The Honest Take

    Render is one of the cleaner stories in crypto AI, and most of the noise around it is justified. Real customers. Real burns. Real governance. A tokenomics model that has survived two cycles and keeps compounding on-chain volume. The 85% drawdown from ATH is doing more work than most charts admit: it is pricing in a scenario where crypto AI never recovers its 2024 enthusiasm.

    That said, $5 is not a given. The base case puts fair value closer to $3.50 by late 2027. $5 requires the AI compute shortage to persist, both pending RNPs to ship, and sentiment to stay constructive on the DePIN sector. Any of those failing drops the central target by 20 to 30%. Any two of them failing puts the bear case back on the table.

    For traders, the setup worth monitoring is a close above $2.60 on sustained volume, which would confirm the current rally is more than a dead cat. For long-term holders, the question is simpler: do you believe decentralized GPU networks capture a meaningful share of the AI compute boom? If yes, RENDER is one of the two or three best vehicles to express that view. If you want context on the AI token basket more broadly, our coverage on Bittensor’s 2026 trajectory is a good companion read.

    The honest answer to “Can RENDER hit $5?” is: yes, but not by accident. The token needs the fundamentals to show up on-chain over the next 12 months. If they do, $5 clears. If they do not, the market has already told you where it thinks fair value lives, and that number starts with a 1.

    Disclaimer: This article is for informational and educational purposes only and should not be construed as financial, investment, or trading advice. Cryptocurrency markets are highly volatile, and past performance does not guarantee future results. The price predictions and analyses presented here are based on AI models, technical indicators, and available data at the time of writing. They are not guarantees. Always conduct your own research (DYOR) and consult with a qualified financial advisor before making any investment decisions. Pump Parade and its authors do not assume liability for financial losses incurred based on information provided in this article.

    Best AI stock pickers in 2026: scores, bots and agents, and how to check their work

    0

    Search “best AI stock picker” and you’ll get a dozen listicles, most of them written by a company that sells one. They all rank tools by how impressive the marketing sounds. That’s backwards. The question that matters with any AI stock tool is simpler: can you check its work?

    Here’s a way to sort these tools that doesn’t depend on whose ad budget is bigger.

    There are really three kinds of “AI stock picker”

    Scores. The tool gives each stock a number. Danelfin’s AI Score, from 1 to 10, is the clearest example. You get a ranking and some of the factors behind it, then you decide what to do.

    Patterns and bots. Tickeron is the best-known one here: pattern recognition on charts, plus “AI Robots” that generate trade signals for active traders. More frequent, more technical, more for people who trade often.

    Agents. Software that researches a stock, decides, places the (simulated or real) trade, and writes down why. The output isn’t a score, it’s a decision with reasoning attached. This is the newest category and the one most listicles lump in with the others.

    Signal apps such as Prospero.ai sit somewhere between scores and bots: they condense data into a few proprietary signals per stock.

    None of these categories is “better”. They answer different questions. A score helps you research. An agent does the work and asks you to judge the result.

    Four things to check before trusting any of them

    1. Live or backtested? A backtest is a simulation run after the fact. It’s easy to make look great. Live results, recorded as they happened, are the only ones worth much.
    2. How long is the record? Six good months is noise. Look for at least a couple of years, including a bad stretch for the market.
    3. Does it explain itself? “Score: 9” tells you nothing when it’s wrong. A written reason lets you spot when the tool is reacting to something silly.
    4. Is the record public and complete? Including the losers. If a tool only shows you winning picks, assume the rest look different.

    What the research actually says

    Two recent papers are worth knowing about, because they test AI stock picking live rather than on historical data the model may already have seen.

    A Peking University study (arXiv 2601.11958) had an AI model with web search rate every Russell 1000 stock daily from April 2025. Its top-20 picks beat the index over the roughly nine-month window. The catch the authors stress: the edge was concentrated in the very top picks and faded fast as the list got longer, and the model couldn’t pick losers at all. It’s also a short window.

    A second paper (arXiv 2604.17327) tested MarketSenseAI, a commercial multi-agent system, over 19 months on the S&P 500. Its strong-buy picks averaged 2.18% a month against 1.15% for an equal-weight benchmark. That’s a strong result. But look at it month by month:

    Monthly excess return of MarketSenseAI's strong-buy portfolio vs an equal-weight S&P 500 benchmark, Sep 2024 to Mar 2026

    It trailed the benchmark in 8 of the 19 months, sometimes by more than 3 points. The authors themselves say the result rests on 19 observations from a mostly rising market. If you’d followed a tool like this, you’d have spent a lot of months wondering whether it had stopped working.

    That’s the realistic picture: there’s real evidence that AI can add something, and it comes with long losing stretches and short track records. Anyone promising you more is selling.

    The tools, side by side

    Type What you get Can you check it?
    Danelfin Score 1–10 AI Score per stock, with factors Partly: it shows the factors behind each score
    Tickeron Patterns / bots Chart patterns, AI Robot signals Depends on the robot; check whether results are live
    Prospero.ai Signals Proprietary signals per stock Limited: the signal logic is proprietary
    MarketSenseAI Agent research Written thesis plus rating per stock Yes, a public paper reports its live results
    milo Agent Agents that research, trade on paper and explain each move Yes, every trade comes with its reasoning

    Pricing changes often, so check each site.

    Where milo fits

    I’ll be upfront that this is our blog. milo is an AI agent platform. On US stocks, milo agents do research and paper trading only: they read insider buys, Congress disclosures and 8-K filings, make simulated trades, and explain each one in plain English. No real money moves on stocks.

    That’s deliberate. The fair way to judge any AI picker is to watch it work for a while, on paper, with its reasoning in front of you, before you trust it with anything. Try a milo stock agent in paper mode and see whether its reasoning holds up.

    FAQ

    Can AI pick stocks better than humans?
    Some live studies show an edge, mostly in the very top picks and over short windows. The evidence is promising and nowhere near settled.

    What is an AI stock picking agent?
    Software that researches, decides and records trades on its own, with its reasoning attached, as opposed to a tool that gives each stock a static score.

    Danelfin or Tickeron?
    Danelfin suits slower research where you want a ranking. Tickeron suits active traders who want pattern alerts and bot signals.

    Are AI stock picker returns real?
    Ask whether they’re live or backtested, how long the record is, and whether losing picks are included. Most published numbers are backtests.

    Not investment advice. Past performance, live or simulated, doesn’t predict future results.

    Congress stock trade trackers compared, and why the 45-day lag matters more than the tool

    0

    Every few months a chart goes viral showing that some member of Congress “beat the market” by a mile. Then someone on r/stocks asks the obvious follow-up: can I just copy them? And someone else answers with the problem that nobody’s tracker can fix. By the time you see the trade, it’s old news.

    That’s the real story of Congress trade trackers. The tools differ in polish, alerts and price. They all read the same public filings, and those filings arrive late by law.

    What a Congress trade tracker actually shows you

    The STOCK Act (2012) requires members of Congress, and senior staff, to file a Periodic Transaction Report for stock trades over $1,000. The deadline is 30 days after they’re notified of the trade, and never more than 45 days after the trade itself. Trades by a spouse or dependent child count too. House reports go to the House Clerk; Senate reports go to the Senate eFD system. The fine for filing late is $200, which is not much of a deterrent.

    Two more details matter more than people think:

    • Amounts are ranges, not numbers. A report says “$1,001–$15,000” or “$500,001–$1,000,000”. You don’t know the real size.
    • The date you see first is the filing date. A tracker shows a trade when the report lands, not when the trade happened.

    Every tracker on the market is a nicer front end for those two government databases.

    How late is “late”? We checked a batch

    We pulled seven House reports signed in September 2026, covering 130 transactions, and measured the gap between each trade date and the date the member signed the report.

    Histogram of days between trade and signed report for 130 House transactions

    • The median gap was 23 days.
    • 19 of the 130 trades were more than 30 days old when the report was signed.
    • 7 were signed after the 45-day limit (up to 49 days).
    • One trade was reported the same day. That’s the exception.

    So even in a small, ordinary batch, a typical trade is three weeks old before any tracker can show it.

    The trackers, briefly

    I’m not going to pretend to rank these by traffic or accuracy, because nobody publishes data that would let you. Here’s what each is good for, based on what they offer publicly. Check current pricing on their sites, since it changes.

    Capitol Trades. Free and clean. Good for browsing by politician, ticker or sector without signing up for anything. Best for “what did my representative buy?”

    Quiver Quantitative. Congress trades plus a lot of other alternative data (lobbying, contracts, insider trades). It also publishes strategy backtests built on Congress trades. Free tier plus paid plans.

    Unusual Whales. Known mostly for options flow, and it has a big Congress trading section and alerts. Paid subscription for the full product.

    Autopilot. An app that lets you link a brokerage account and automatically mirror a politician’s portfolio. That’s a different thing from tracking. You’re copying trades with the lag baked in.

    The source itself. The House Clerk and Senate eFD sites are free and always first. They’re also unpleasant to use: many House reports are PDFs, and older paper filings are scanned images.

    What it’s for Cost Data delay
    House Clerk / Senate eFD The raw filings Free None beyond the legal lag
    Capitol Trades Browsing and searching Free Legal lag + processing
    Quiver Quantitative Data plus backtests Free tier, paid plans Legal lag + processing
    Unusual Whales Alerts and dashboards Paid Legal lag + processing
    Autopilot Auto-copying a portfolio Paid Legal lag + execution

    Notice the last column. Nothing on this list removes the lag, because the lag is in the law.

    Why “copy Congress” charts look better than real life

    Most of those viral performance charts quietly enter each trade on the trade date. You couldn’t have done that. You’d have entered on the disclosure date, often weeks later, at a different price. Add the dollar ranges, which make position sizes a guess, and the gap between the chart and what a follower could actually earn can be large. It can go either way, but it’s never zero.

    If you want an honest answer to “does this work?”, the test has to enter on the disclosure date, size positions conservatively, and compare against just buying an index fund over the same period.

    Test it on paper before you put money behind it

    That’s the part I’d actually do before paying for any tracker. Pick a rule (“buy what members of the Armed Services committees disclose, one week after disclosure, hold 90 days”) and run it on paper for a few months.

    This is what we use milo for. milo reads House and Senate disclosures, insider Form 4s and 8-K filings, and you can set up an agent to follow a rule like the one above and explain each trade in plain English. On US stocks milo is research and paper trading only: no real money, just a record you can judge before you trust the idea. Try a Congress-following paper agent on milo.

    FAQ

    How long do members of Congress have to report stock trades?
    Under the STOCK Act, within 30 days of being notified of the trade and no later than 45 days after the transaction.

    What’s the best free Congress stock tracker?
    Capitol Trades is the easiest free one to browse. Quiver Quantitative has a useful free tier. The House Clerk and Senate eFD sites are the free primary sources.

    Can I see Congress trades in real time?
    No. No tracker can, because members aren’t required to report for up to 45 days.

    Do the reports show exact dollar amounts?
    No, only ranges such as $1,001–$15,000 or $1,000,001–$5,000,000.

    Is copying Congress trades profitable?
    The honest answer is that it depends on the period and on how you handle the lag. Be skeptical of any backtest that enters on the trade date. Paper-test the strategy yourself, entering on the disclosure date.

    Not investment advice. Filings can be amended and trackers can contain errors; check the original report before acting on anything.

    Solana (SOL) Price Prediction 2027: Can SOL Hit $250?

    Solana (SOL) is trading at $112.57 at the time of writing, up 3.0% in 24 hours but still 61.6% below its January 2025 all-time high of $293.31. The chart has been grinding sideways, yet the fundamentals look increasingly out of step with the price. Two of the biggest validator upgrades in Solana’s history, Firedancer and Alpenglow, are already live or landing within quarters, and spot Solana ETFs just posted their strongest week since launch at $153 million in weekly inflows. Standard Chartered holds a $250 base case.

    That is the backdrop for this Solana price prediction 2027 analysis. We pulled live Birdeye and CoinGecko data, mapped the real catalysts, and stress-tested the bull and bear cases against on-chain activity. The question most traders are actually searching: can SOL retake $200, and then $250, inside the next 12 to 18 months? Below are the targets by timeframe, the three catalysts that would get us there, the three risks that would not, and the levels we are watching.

    Key Takeaways

    • SOL today: $112.57, +3.0% in 24h, +10.8% over 30 days, 61.6% below ATH of $293.31.
    • Base case for end of 2027: $250, aligned with Standard Chartered’s institutional target.
    • Bull case: $400 if Firedancer client diversity, Alpenglow sub-second finality, and sustained ETF inflows all land.
    • Bear case: A retest of $70 to $85 if ETF demand reverses and memecoin volume drops further.
    • Biggest catalyst: Alpenglow mainnet, targeted Q3 2026, cuts finality from ~12.8 seconds to 100 to 150 ms.
    • Biggest risk: SOL still correlates heavily with Bitcoin. A BTC drop below $70,000 drags it to the lower bound.
    Solana (SOL) price prediction 2027 hero graphic showing current price $112.57 and Firedancer plus ETF catalysts

    Where Does Solana Stand Today?

    Before any forecast, the facts on the ground. The numbers below come from CoinGecko and Birdeye, pulled the morning this piece was written.

    Metric Value
    Price $112.57
    24h change +3.04%
    7-day change -7.31%
    30-day change +10.81%
    Market cap $66.4 billion
    24h volume $2.35 billion
    Market cap rank #7
    All-time high $293.31 (Jan 2025)
    % from ATH -61.6%

    Rank seven means SOL is still a top-ten asset by every measure that matters: liquidity, market cap, and daily turnover. The 30-day change of +10.8% against a 7-day change of -7.3% tells you we had a strong month that gave back some gains, which is textbook consolidation inside a broader uptrend, not a top. For readers newer to Solana flow, our Photon vs BullX trading bot comparison is a primer on how fast money moves through the chain.

    Why is Solana Range-Bound Right Now?

    The chart is doing what it should after a 10x run from the 2023 lows: digesting. SOL ran from under $10 in late 2022 to $293 in January 2025, then spent most of 2026 oscillating between $90 and $160. On-chain activity has held up. Fee revenue is well above its 2023 base, Jupiter still routes more DEX volume on most days than any other aggregator in crypto, and Jito has grown liquid staking TVL past most comparables as a percentage of circulating supply.

    What has not held up is the pure-degen flow. Memecoin launch volume on Pump.fun has fallen roughly 60% from the February 2025 peak, taking a chunk of chain revenue with it. Standard Chartered flagged this in their February 2026 note, calling the shift “memecoins to micropayments” and cutting their 2026 target to $250 from $350. Fewer traders paying $20 priority fees to snipe dog coins means the chain earns less per block.

    Macro matters too. Bitcoin at $83,931 is off its highs, and SOL’s 90-day correlation with BTC sits in the 0.78 to 0.85 range. Until BTC decides where it is going, SOL will mostly follow.

    The Bull Case: Three Catalysts That Could Push SOL to $250

    1. Alpenglow and Firedancer deliver sub-second finality

    This is the most underpriced catalyst in crypto right now. Alpenglow is a consensus rewrite that replaces Proof-of-History and TowerBFT with two components: Votor, which handles fast-finality consensus, and Rotor, which propagates data more efficiently. The Solana Foundation reports 98.27% of voting stake approved it in September 2025. Mainnet integration is targeted for Q3 2026, and the stated goal is cutting finality from roughly 12.8 seconds to between 100 and 150 milliseconds.

    In plain terms: if Alpenglow ships cleanly, Solana becomes functionally real-time. Payments, order books, and the micropayment thesis Standard Chartered pivoted toward all become materially more viable. Pair that with Firedancer, Jump Crypto’s independent validator client that went live on mainnet in December 2025 and already attracts more than 20% of network stake, and you have real client diversity for the first time. That is a story institutions can underwrite.

    2. Spot ETF inflows pass $5 billion AUM

    Spot Solana ETFs went live on October 28, 2025. By end of August 2026, category AUM crossed $1.49 billion with Bitwise’s BSOL alone past $1 billion. The strongest week of 2026 produced $153 million in net inflows, and the single-day peak of $60.9 million was the third-highest since launch.

    The pattern looks a lot like Ethereum ETFs in 2024: slow at first, then compounding as more RIAs added them to model portfolios. If Solana ETFs reach even half the AUM pace of ETH ETFs over a comparable window, we are looking at $4 to $6 billion by end of 2027. That is persistent, price-insensitive bid.

    3. Real-world asset tokenization leans Solana

    Solana already hosts roughly $863 million in tokenized real-world assets, including treasury products from Franklin Templeton, Hamilton Lane, and Ondo. The combination of sub-second finality post-Alpenglow and cents-per-transaction fees makes it the natural choice for anything that needs to settle quickly without eating a $5 gas tax. Solana is the leading non-Ethereum beneficiary of this trend.

    The Bear Case: Three Risks That Could Push SOL Back to $70

    1. ETF flows reverse

    The ETF story cuts both ways. Spot Solana ETFs saw a surge in outflows during the April 2026 drawdown, and $100 million can leave in a week just as easily as it arrived. If BTC breaks $70,000 support and macro conditions tighten, expect SOL ETFs to see sustained outflows. In that scenario, $85 is realistic and $70 is on the table.

    2. Alpenglow slips or ships with bugs

    Jump Crypto originally targeted Firedancer for Q2 2024 and missed by roughly 18 months. Consensus rewrites are hard. If Alpenglow slips to 2027, the near-term bull narrative loses a leg. A buggy launch that triggers finality or liveness issues on mainnet would reopen the old “Solana is unreliable” critique. The chain has had seven outages since 2021, and institutional risk committees remember.

    3. Competition from Ethereum L2s and new L1s

    Base, Hyperliquid, Monad, and MegaETH are not sitting still. If a credible EVM-compatible chain hits the latency and cost profile Solana sells on, the “why not just use Ethereum” argument gets easier. For a flavor of how fast new L1 narratives can shift, see our Hyperliquid price prediction, which has eaten real share from Solana’s perps venues.

    Solana Price Prediction 2027: Targets by Timeframe

    Solana (SOL) price prediction 2027 targets table showing bear $70, base $250, bull $400

    Here is how our hybrid AI model and analyst consensus map onto specific timeframes. The model weighs technical setups (RSI, moving averages, support/resistance), on-chain activity (fees, active addresses, TVL), and sentiment inputs from spot and derivatives flows.

    Short-term: 30 days ($85 to $160)

    SOL needs to reclaim $125 and hold it for the base case to activate. Below $100 opens a retest of the $85 structural support that held multiple times through 2026. A clean break above $140 on volume would set up a run at $160. Watch the daily close relative to the 50-day moving average near $118.

    Medium-term: 6 months ($70 to $230)

    This window spans the Alpenglow mainnet target. A successful Q3 2026 launch, combined with continued ETF inflows, maps to a base case of $175 by Q1 2027. The bull case of $230 would require ETF AUM crossing $3 billion and Bitcoin trading above $110,000. A delayed Alpenglow plus a BTC correction is the $70 bear path.

    Long-term: End of 2027 ($95 to $400)

    Our base case for year-end 2027 is $250, aligning with Standard Chartered’s target and marking a new ATH. The bull case of $400 requires three things: Alpenglow live and stable, ETF AUM past $5 billion, and SOL capturing a majority share of non-ETH stablecoin settlement. The bear case of $95 is a world where ETFs saw net outflows for 2027 and BTC spent the year under $75,000.

    Timeframe Bear Base Bull
    30 days $85 $125 $160
    6 months $70 $175 $230
    End of 2027 $95 $250 $400

    For context, Standard Chartered’s longer-horizon call is $500 by 2029 and $2,000 by decade’s end. Not a forecast we are stapling our name to, but a useful anchor for the upper tail.

    How Does Solana Compare to Ethereum?

    Any serious SOL analysis has to answer the “why not just use ETH” question. Here is the honest comparison on the metrics that drive long-term price.

    Metric Solana (SOL) Ethereum (ETH)
    Price (today) $112.57 $2,563
    Market cap $66.4B $313.0B
    Avg. tx cost ~$0.0025 ~$0.80 (L1)
    Current finality ~12.8 sec ~13 min
    Validator clients 3 6+
    Spot ETF AUM ~$1.49B ~$18B+
    Staking yield 6.5% to 7.5% 3.0% to 3.5%

    Translation: SOL is faster and cheaper, ETH has more client diversity and bigger institutional base. The 2027 thesis is that Solana’s technical edge compounds while its decentralization catches up, closing the trust discount. For contrast on how other high-throughput L1s are getting repriced, our Avalanche price prediction covers a parallel ETF catalyst story.

    What Would Change Our View?

    Upside revision to $350 to $450: Alpenglow ships in Q3 2026 as planned, SOL ETFs cross $4 billion AUM by Q2 2027, and BTC breaks $120,000.

    Downside revision to $65 to $95: Alpenglow slips past Q1 2027, a major chain outage returns, or ETF outflows exceed inflows for two consecutive quarters.

    Pattern invalidation: A clean break of the $85 structural low on heavy volume ends the sideways consolidation thesis and opens a measured move to $55 to $60. We would need to see this with falling on-chain activity to put real weight on it.

    Frequently Asked Questions

    Is Solana a good investment in 2027?

    Solana looks attractive relative to its 2024 to 2025 highs, with real catalysts (Alpenglow, Firedancer client diversity, growing ETF AUM) and an active developer ecosystem. SOL remains high-beta to Bitcoin and sensitive to macro, so position sizing matters. The probability favors upside over a 12 to 18-month window, but not without volatility.

    Will Solana reach $250 by 2027?

    Our base case is yes. Standard Chartered’s Geoff Kendrick holds $250 as his 2026 institutional target. The technical and on-chain picture supports it provided Alpenglow activates on schedule and ETF inflows continue averaging $30 million or more per week. A BTC drawdown below $70,000 is the main thing that would derail the target.

    What is the Solana price prediction for 2027?

    Our hybrid model indicates a bear case of $95, a base case of $250, and a bull case of $400 for end of 2027. The spread is wide because the Alpenglow outcome and macro conditions both have binary components. Track Alpenglow mainnet activation, weekly ETF flows, and the BTC trend as the signals that narrow the range.

    What is Alpenglow and when does it launch?

    Alpenglow is Solana’s biggest consensus upgrade since the chain launched. It replaces Proof-of-History and TowerBFT with Votor (fast-finality consensus) and Rotor (data propagation), targeting 100 to 150 millisecond finality versus the current roughly 12.8 seconds. Mainnet integration is targeted for Q3 2026, and 98.27% of voting stake has already approved it.

    How does SOL staking yield compare to ETH?

    SOL staking yields range from roughly 6.5% to 7.5% annually through validators or liquid staking protocols like Jito. ETH staking yields are closer to 3.0% to 3.5%. The higher SOL yield reflects both higher inflation and a smaller validator base, so it is not a free lunch, but it is a meaningful carry for long-term holders. For wallet options, see our Backpack vs Solflare comparison.

    What are the biggest risks to the SOL bull case?

    Three things: ETF outflows reversing the institutional bid, Alpenglow slipping or shipping with liveness issues, and credible competition from EVM-compatible chains like Monad or MegaETH. Any one alone is manageable. Two or more at the same time would reset the thesis.

    The Honest Take

    Here is the thing about Solana at $112: the market is pricing in a lot of execution risk that may not materialize. Alpenglow has 98% stake approval and a credible team behind it. Firedancer is live and growing stake share. The ETF bid is slower than SOL maxis expected, but it is building, and the Bitwise BSOL inflows have been impressive for a product that is barely a year old.

    The bear case is also real. A chain outage or a buggy Alpenglow launch would hurt. ETF flows can reverse. BTC is not guaranteed to break out. And the memecoin revenue stream that padded 2024 earnings has shrunk, which means SOL has to grow into its valuation on actual utility (payments, DeFi, RWAs), not casino volume.

    Our take: risk-reward favors a core position with staged entries between $85 and $115, scaling out above $200 and reconsidering below $80. That is a framework, not advice. The market owes us nothing, and anyone telling you SOL “will” hit any specific number is selling you something.

    Disclaimer: This article is for informational and educational purposes only and should not be construed as financial, investment, or trading advice. Cryptocurrency markets are highly volatile, and past performance does not guarantee future results. The price predictions and analyses presented here are based on AI models, technical indicators, and available data at the time of writing, they are not guarantees. Always conduct your own research (DYOR) and consult with a qualified financial advisor before making any investment decisions. Pump Parade and its authors do not assume liability for financial losses incurred based on information provided in this article.

    How to track insider buying without drowning in noise (a free OpenInsider alternative)

    0

    Most “insider buying” screeners show you everything with a buy code. When we pulled every Form 4 from SEC EDGAR filed Oct 2–9, 2026 and kept only rows coded as purchases, we got 343 of them across 77 tickers. That sounds like a lot of conviction until you look closer: 157 were under $25,000, and 60 rows were Taiwan Semiconductor employees whose stock plan bought shares for them on a schedule.

    So the useful question isn’t “where can I see insider buys?” EDGAR is free and so is OpenInsider. The question is how to filter them down to the handful that mean something. Here’s how we do it.

    What a Form 4 is (short version)

    A Form 4 is the filing that officers, directors and 10% owners must send the SEC within two business days of trading their company’s stock. Each transaction gets a one-letter code. The ones you’ll see most:

    • P: open-market or private purchase. Someone paid cash at a market price. This is the one you want.
    • S: sale.
    • M: exercising an option. Mostly compensation mechanics.
    • A: a grant or award from the company. Free shares aren’t an opinion.
    • F: shares withheld to pay tax. Also not an opinion.

    Most weeks, the large majority of Form 4s are M, A, F and plan sales. Filter to P first and the pile shrinks dramatically.

    Code P still isn’t enough

    Bar chart of insider purchase sizes for 155 Form 4 filings, Oct 2-9, 2026: most under $100K
    Most insider buys are small: purchase sizes across 155 Form 4 filings, Oct 2–9. Source: SEC EDGAR.

    Even inside the purchase pile there are traps. Three we hit in a single week:

    Employee stock purchase plans. On Oct 7, about 30 TSMC executives each filed a “purchase” at the same $79.39, most for $2,000–$11,000. The footnote says the plan bought on predetermined terms. A screener that counts insiders will tell you “30 TSMC insiders buying”. It’s payroll.

    10b5-1 plans. Nippon Life bought about $42.7M of Corebridge Financial (CRBG) Oct 1–7, but the footnote says the purchases run under a Rule 10b5-1 plan adopted in August. Pre-scheduled buying is steady accumulation, not a reaction to news. Read the footnotes. They’re where the real story is.

    Who’s actually buying. Berkshire Hathaway’s roughly $192.6M Lennar (LEN) purchase was the biggest check of the week, but Berkshire is a 10% owner, not an executive. That’s an outside investor with a big stake, not someone with a view of next quarter’s orders. Still worth knowing, but a different signal from a CFO buying.

    What makes a buy worth a second look

    Bar chart of insider purchases by role, Oct 2-9, 2026
    Who filed the purchases, by role, Oct 2–9. Source: SEC EDGAR.

    None of these is proof of anything. They’re reasons to read the filing:

    1. Real money relative to the person. A director putting $500,000 in is different from a $5,000 token buy.
    2. Repeat buying. Tor Olav Trøim, a Borr Drilling (BORR) director, bought about $18.0M over three straight days, Oct 5–7, through an entity tied to his family trust. Sonic Automotive (SAH) had the same buyer filing in several batches the same week. Repetition looks deliberate.
    3. Timing against company events. H.B. Fuller (FUL) director R. Jeffrey Bailly bought $500,000 of stock on Oct 7, the same week the company priced $850M of 7.625% notes to fund an acquisition. Buying into your own debt raise is a vote for the deal. You only see that by reading the 8-Ks next to the Form 4s.
    4. Several insiders at once (“cluster buying”). In our week, three different insiders at AgomAb Therapeutics (AGMB) filed purchases. “Cluster” isn’t an SEC category, just a screening idea: more than one person reaching the same conclusion with their own money.

    And one honest caveat: research generally finds purchases more informative than sales (people sell for taxes, houses and divorces; they buy for one reason), but the evidence on how well this translates into returns is mixed. Treat insider buys as a reason to research, not a trade.

    The tools

    • SEC EDGAR: the source. Free, complete, and painful to read at volume. Every link in our digest goes straight to the filing.
    • OpenInsider: the classic free screener on top of the same Form 4 data. Fast, sortable, and it lets you filter by purchase. You still have to read the footnotes yourself.
    • Paid alert services: several sites sell Form 4 alerts and dashboards. Worth it if you want push notifications; check whether they filter out plan purchases before paying.
    • The milo Insider Digest: our weekly, free write-up. We pull the code-P filings, drop the plan purchases and tiny buys, read the footnotes, line them up with 8-Ks and congressional disclosures, and tell you which ones are worth reading and why. Issue #1 is here.

    A weekly routine that takes 20 minutes

    1. Read the week’s filtered buys (the Digest, or OpenInsider set to purchases only).
    2. Open the Form 4 for anything that catches your eye. Check the footnotes for plan language and check who the buyer is.
    3. Look at the company’s recent 8-Ks. Is there a deal, a debt raise or an executive change around the same dates?
    4. Add the survivors to a watchlist and write one line on why.
    5. If you want to test the idea, do it on paper first. A month of paper results will tell you more about your filter than any backtest chart.

    That last step is where milo fits. milo is an AI research agent that tracks insider buys, congressional disclosures and 8-Ks for the tickers you care about. On US stocks it’s research and paper trading only, so you can let an agent follow your filter and see how it does without putting money on it.

    Try milo free and set up an insider-buy watchlist →

    Quick answers

    What is a Form 4? An SEC filing insiders must submit within two business days of trading their company’s shares.

    Is insider buying a good signal? Purchases tend to be more informative than sales, but the evidence is mixed. Use them to decide what to research, not what to buy.

    What’s a free alternative to OpenInsider? SEC EDGAR itself (raw), and the free weekly milo Insider Digest (filtered and explained).

    What is cluster buying? Several insiders at the same company buying within days or weeks of each other. It’s a screening term, not an official category.

    Does “P” always mean a real open-market buy? No. Employee purchase plans and 10b5-1 plans can show up as purchases. Check the footnotes.

    Not investment advice. Figures come from public SEC filings for Oct 2–9, 2026; filings can be amended.

    milo Insider Digest #1: Buffett buys a homebuilder, and a director buys into his company’s debt week

    0

    Data sources for this issue. Insider buys: SEC EDGAR Form 4 filings, filtered to open-market purchases (transaction code “P”), filed Oct 2–9, 2026, and parsed straight from the filings. Congress: official House Clerk Periodic Transaction Reports (disclosures-clerk.house.gov) filed in September 2026. 8-Ks: EDGAR company filings. Every figure links to its filing. Dollar values are shares × reported price, summed across that week’s filings; where a filing reports a weighted-average price, so do we.

    Week of Oct 5–9, 2026

    Over 5,000 Form 4s hit EDGAR this week. Most were option exercises, grants, tax withholding and plan sales, which is paperwork, not opinion. Very few were insiders paying market price with their own cash. Those are the ones below.

    Insider buys worth your attention

    Bar chart of the top 10 companies by insider buying in Form 4s filed Oct 2-9, 2026, led by Lennar at $192.6M
    Top 10 companies by reported insider purchases, Form 4s filed Oct 2–9. Source: SEC EDGAR.

    Lennar (LEN): Berkshire Hathaway, about $192.6M.
    2,418,637 Class A shares bought Oct 1–2 at roughly $77–82 (weighted averages), filed Oct 5. After this, Berkshire subsidiaries hold 28,438,045 Class A shares. Berkshire is a 10% owner, not an employee, so this is an outside investor’s conviction, not insider knowledge. Still, it’s the biggest open-market check of the week, and it’s going into housing. Form 4

    Borr Drilling (BORR): director Tor Olav Trøim, about $18.0M.
    4,250,000 shares across Oct 5–7 at $4.13–4.31, through Drew Holdings, an entity owned by a trust of which he’s the beneficiary. Three straight days of buying in an offshore driller is the most deliberate-looking pattern on the list. Form 4

    Corebridge Financial (CRBG): Nippon Life, about $42.7M.
    1,248,331 shares bought Oct 1–7, which takes it to about 127.4M shares. Read the footnote: these purchases run under a Rule 10b5-1 plan adopted Aug 7, 2026. That means a pre-scheduled program, not a reaction to this week. It’s still steady accumulation, just not a signal. Form 4

    H.B. Fuller (FUL): director R. Jeffrey Bailly, $500,000.
    10,000 shares at $50.00 on Oct 7. The timing is what makes it interesting: that same week the company priced $850M of 7.625% notes due 2034 to fund its Advanced Medical Solutions acquisition (see 8-Ks below). A director buying stock into a debt raise is a vote for the deal. Form 4

    Sonic Automotive (SAH): Paul P. Rusnak, about $3.8M.
    64,221 shares at $59.50–59.90 across Oct 1–7, filed in several batches. Repeat filings by the same buyer within a week deserve more weight than one big print. Form 4

    Immersion (IMMR): CEO Eric Singer, $292,800.
    41,000 shares at $7.11–7.15 on Oct 7, the same day as the annual meeting, where say-on-pay passed by only 10.8M votes for to 9.2M against. A CEO buying the day shareholders nearly reject his pay package is either confidence or optics. Probably some of both. Form 4

    Hormel (HRL): director William Newlands, $201,000.
    10,000 shares at $20.10 on Oct 5, a week after Hormel signed a $1.055B cash deal to buy Brakebush. A small check by Berkshire standards, but a director buying right after a billion-dollar acquisition is worth noting. Form 4

    One that looks like a signal and isn’t. About 30 Taiwan Semiconductor (TSM) executives each filed a “purchase” on Oct 7 at the same $79.39, most of them for $2,000–$11,000. The footnote says the employee stock purchase plan bought these shares on predetermined terms. If a screener shows you “30 TSMC insiders buying”, this is why.

    Congress: what got disclosed (and how late)

    These are September filings to the House Clerk. The trades themselves happened weeks earlier, and the reports give dollar ranges, not exact amounts. Treat this as history, not a tip.

    • Rep. Rick Allen (R-GA), spouse’s account: bought Broadcom (AVGO) and Taiwan Semiconductor (TSM) ($1,001–$15,000 each) and sold Rollins (ROL) ($15,001–$50,000). Traded Aug 12, disclosed Sep 15, a 34-day lag. PTR
    • Rep. Kevin Hern (R-OK): a run of Boston Scientific (BSX) sales across family trusts, the largest $50,001–$100,000 each, Aug 31–Sep 9, plus partial Apple (AAPL) sales. PTR
    • Rep. Pete Sessions (R-TX), spouse’s IRA: sold Apple (AAPL), $100,001–$250,000, on Sep 22, disclosed the same day. That speed is rare. PTR
    • Rep. Sheri Biggs (R-SC), spouse’s managed account: a $500,001–$1,000,000 structured note tied to the S&P 500 (SPX), bought Sep 1, after selling a same-size note tied to the energy-sector ETF XLE on Aug 19. Read loosely, it’s a rotation out of energy and into the broad index. PTR

    Our honest take: by the time you can read these, the market has had a month. The useful part is the pattern over many filings, not any single trade.

    8-Ks worth reading

    • H.B. Fuller, Oct 5 and Oct 8. It launched a $950M note offering for the AMS acquisition, then priced it at $850M at 7.625%. That’s smaller than launched, at a coupon that tells you what credit costs right now. Read it next to the director’s $500K buy above. Oct 5 8-K · Oct 8 8-K
    • Hormel, Sep 30. A deal to acquire Brakebush Brothers for $1.055B in cash, expected to close in Q1 of fiscal 2027, pending antitrust clearance. 8-K
    • Prothena (PRTA), Oct 2. Its Chief Development Officer resigned to join a strategic partner and lead a program partnered with Prothena. That same week William Scully bought about $2.68M of PRTA (315,000 shares, Form 4). An executive leaving while a big holder buys is a contrast worth watching. 8-K

    Want this for your own tickers? milo tracks insider buys, congress disclosures and 8-Ks, and you can set up an agent to watch your watchlist and flag filings like these. On US stocks, milo is research plus paper trading: you can test an agent’s ideas without risking money. → andmilo.com

    Not investment advice. This is a summary of public filings, and filings can be amended. Insider and congressional buying does not predict returns. Do your own research.