More
    Home Blog Page 11

    Cronos (CRO) Price Prediction 2026: Can CRO Hit $0.35?

    Our Cronos (CRO) price prediction 2026 starts with the tape: CRO trades at $0.0601 today, up 7.4% over the past seven days and up 1.6% on the month. Volume is a modest $21 million per day, and price is stuck in the same range it has held for most of 2026. What has changed is the setup underneath. A $6.4 billion Trump Media treasury now owns 2% of the float, the Cronos zkEVM is picking up TVL, and a new Truth Predict prediction market is queued to launch on the chain later this year. Our Bitcoin price model puts BTC in a summer chop, the kind of tape where thesis-driven altcoins get accumulated quietly.

    This is our full Cronos (CRO) price prediction 2026. We map the bull case, the bear case, third-party targets from Coinpedia, Coinbase, Changelly, and CoinCodex, and finish with the three signals that would change our view.

    Key Takeaways

    • Current price: $0.0601, +7.4% over 7 days, +1.6% over 30 days. Market cap $2.84B, rank #33.
    • Base case (year-end 2026): $0.085 with a range of $0.045 (bear) to $0.145 (bull).
    • Upside driver: Trump Media’s $6.42B CRO treasury and the Truth Social tokenization roadmap.
    • Downside risk: A partial TMTG treasury unwind, weak Truth Predict adoption, or a broader altcoin drawdown.
    • Analyst spread: Coinbase $0.06, Changelly $0.065, Coinpedia $0.30 to $0.35, Margex extreme bull $1.80.
    • Bottom line: Higher-conviction than a pure meme, lower-conviction than a top-10 L1. A satellite position, not a core hold.
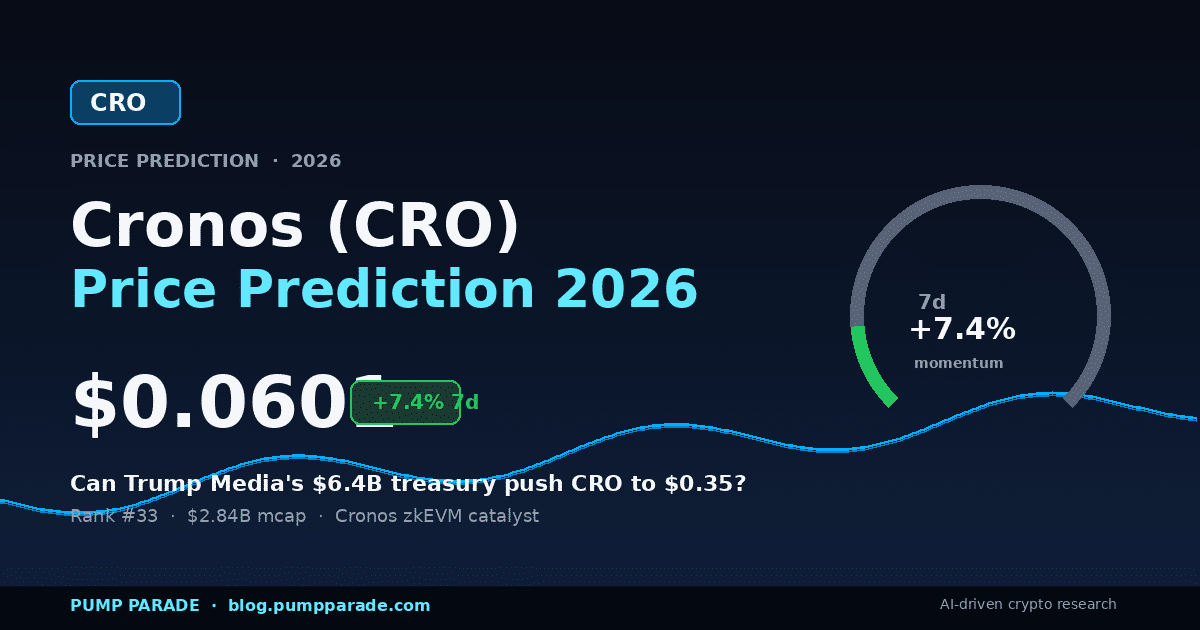
    Cronos (CRO) price prediction 2026 hero graphic showing current price $0.0601 and Trump Media $6.4B treasury catalyst

    Where Cronos (CRO) Stands Today

    Before the thesis, the tape. Here is the snapshot we work off, pulled live from CoinGecko and cross-checked against Crypto.com’s own price feed.

    Metric Value
    Price $0.0601
    24-hour change +1.31%
    7-day change +7.43%
    30-day change +1.61%
    Market cap $2.84B
    24-hour volume $21.2M
    Rank (CoinGecko) #33
    Circulating supply 47.3B CRO
    All-time high $0.8915 (Nov 2021)
    % from ATH -93.25%

    That “93% off the peak” number is the crux of both the bull and bear cases. It is what makes CRO look cheap. It is also what tells you the market has priced in real disappointment.

    Why Is CRO Grinding Higher Right Now?

    Three things are working at once. First, the TMTG treasury bid is real. Trump Media and Technology Group confirmed in its January 2026 investor update that the $6.42 billion CRO treasury program is proceeding as planned, with Crypto.com custodying the position. Every time a rumor cycle hits about accumulation, price gets a bid.

    Second, Cronos zkEVM TVL has quietly climbed above $180 million, a level it had not seen since early 2024. It is small in absolute terms, but the growth curve is what stops sellers.

    Third, the technicals. CRO cleared the $0.055 resistance in mid-July and printed a bullish RSI divergence on the daily chart. The next real hurdle is $0.075, then $0.095. Nothing dramatic, but enough to keep buyers engaged.

    What Is the Bull Case for Cronos (CRO)?

    1. The Trump Media Treasury Anchor

    TMTG’s 684 million CRO position is the biggest single non-exchange holder of the token. Unlike most treasury pumps that fade in a week, this one is contractually locked into a multi-year strategy. Fidelity Digital Assets and Anchorage are custody partners. The treasury is not sitting idle either, part of it is being staked and part is earmarked for liquidity provision on Cronos DEX pairs. That is a persistent demand sink.

    2. Truth Social Tokenization Platform

    The TMTG tokenization play targets $10 billion in deployed assets and 20 million users, all settling on Cronos. If Truth Predict, the on-chain prediction market inside Truth+, launches with even a fraction of Polymarket’s volume, gas demand on Cronos becomes a bid for CRO. Standard Chartered analysts covered on CoinGecko’s aggregation feed have called the setup one of the more asymmetric structural stories in the L1 space.

    3. The Crypto.com Exchange Flywheel

    Crypto.com is now the fourth largest CEX by spot volume, and its Visa card program keeps CRO plumbed into consumer spending. Every card transaction routes value back to the token via staking rewards and rebate discounts. Coincidentally, that same flywheel is what makes BNB so hard to short structurally.

    The Bear Case for Cronos (CRO)

    1. The Treasury Overhang

    The same treasury that props up demand is also a single point of failure. If TMTG’s stock (DJT) comes under pressure and management decides to monetize the CRO position, even a 20% liquidation would flood the market with $1.2 billion of supply. There is no formal lock-up disclosure yet. That uncertainty is a lid on any real breakout.

    2. Layer-1 Competition Is Brutal

    Cronos competes with Solana, BNB Chain, Base, and now the new wave of app-chains. Its zkEVM is late to the zk-rollup party. Its Cosmos SDK roots do not attract the Ethereum-native developer crowd. If Cronos does not carve out a specific niche (payments? Trump ecosystem?), it risks becoming a generic “yet another EVM.”

    3. The Non-Transferable Token Problem

    The DJT shareholder airdrop is a soulbound Trump-branded token, not CRO itself. It cannot be sold or moved. That limits the network effect meaningfully. If shareholders expected liquid tokens and get a locked collectible, engagement could disappoint.

    Cronos (CRO) Price Prediction 2026: Targets by Timeframe
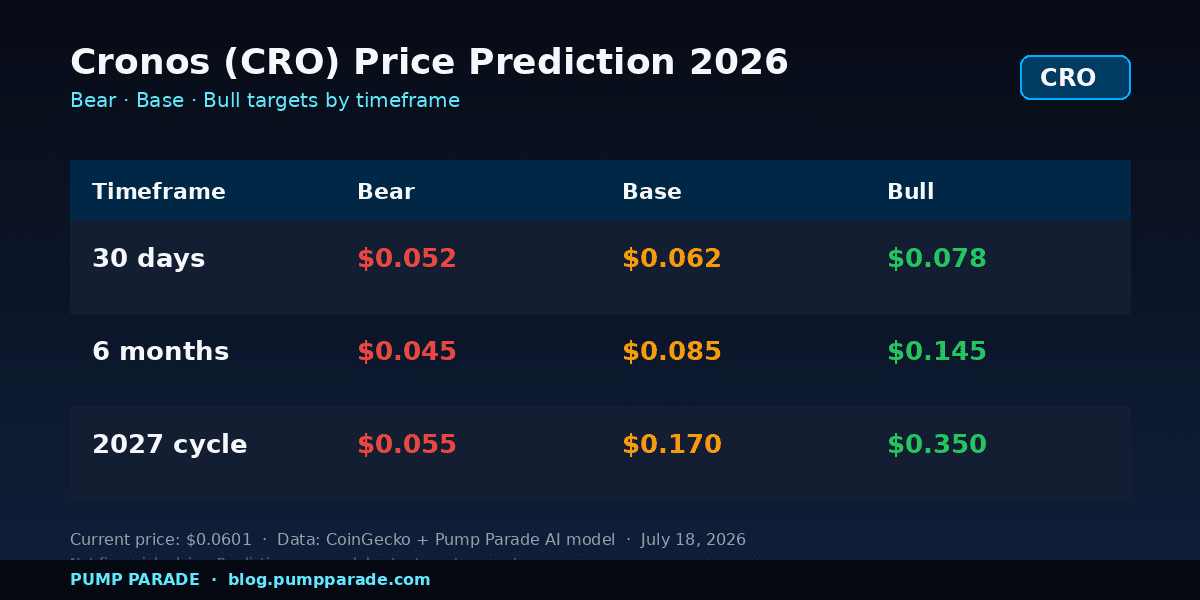
    Cronos (CRO) price prediction 2026 bear base bull targets table with bear $0.045 base $0.085 bull $0.145

    Our AI model synthesizes on-chain, technical, and macro inputs. Here is what it prints, cross-referenced against third-party analyst targets.

    Short term (30 days)

    Base case: $0.062. The market is chewing through the mid-$0.05 range and starting to accept $0.06 as the new floor. A break above $0.075 opens $0.095 quickly on any TMTG headline. Bear case: $0.052 if BTC breaks $58K and drags the altcoin complex down. Bull case: $0.078 on a Truth Predict launch announcement.

    Medium term (6 months)

    Base case: $0.085 by early 2027. Bear: $0.045 (retest of the multi-year demand zone if TMTG treasury news disappoints). Bull: $0.145 (Cronos zkEVM TVL clears $500M, Truth Predict launches on schedule, altcoin rotation begins).

    Long term (2027 cycle)

    Base case: $0.170. Bear: $0.055 (Trump Media pivots or unwinds, thesis broken). Bull: $0.350 (all catalysts fire, plus a genuine altcoin bull cycle). For context, that bull case aligns with Coinpedia’s constructive analyst scenario. The extreme Margex $1.80 target is roughly a 30x, not something we can defend on any current on-chain input.

    Analyst / Source 2026 target Bias
    Coinbase model $0.06 Conservative
    Changelly $0.061 to $0.069 Conservative
    CryptoPolitan $0.097 avg, $0.126 high Moderate
    CoinCodex quant Bearish Bearish
    Coinpedia $0.30 to $0.35 Bullish
    Margex $1.67 to $1.92 Extreme bullish

    How Does Cronos (CRO) Compare to BNB?

    The cleanest comp for CRO is not another L1, it is another exchange token. Both derive value from a centralized exchange flywheel plus an EVM chain. Here is the head-to-head.

    Metric CRO BNB
    Price $0.0601 $568.21
    Market cap $2.84B $75.66B
    Rank #33 #4
    Native chain Cronos + zkEVM BNB Chain + opBNB
    Exchange backer Crypto.com Binance
    CEX rank (spot vol) #4 #1
    Token burn program Yes (staking + fee burns) Yes (quarterly BEP-95)
    Institutional catalyst TMTG $6.4B treasury Broad institutional flow

    Translation: CRO has 26x the “cheapness” of BNB by market cap, but also 26x less of the moat. If you believe Crypto.com plus TMTG can execute over three years, the risk-reward is asymmetric. If you do not, BNB is the safer sleep-at-night version of the same trade.

    What Would Change Our View

    Three explicit triggers would move us from a “measured bull” to something stronger or weaker:

    Upside trigger: Truth Predict launches with over $50 million in weekly volume within 60 days of going live. That would confirm the TMTG partnership is not vaporware and would justify the Coinpedia $0.30+ scenario.

    Neutralizer: A formal, dated lock-up disclosure on the TMTG CRO treasury. Removing that uncertainty would probably be worth $0.02 to $0.04 in price by itself.

    Downside trigger: Any 8-K filing from TMTG signaling treasury adjustments or partial CRO liquidation. That would cut our base case in half instantly and put the $0.045 bear zone in play within a week.

    Frequently Asked Questions

    Will Cronos (CRO) reach $1 in 2026?

    Reaching $1 in 2026 would require a 16x move from today’s $0.06 and a market cap north of $47 billion. Our base case sees CRO between $0.055 and $0.17 through year-end. A $1 print is a 2028-2029 story tied to sustained Truth Social adoption and a broader altcoin cycle, not a 2026 base case.

    Is Cronos a good investment in 2026?

    CRO offers exposure to two catalysts: the Crypto.com exchange economy and the Trump Media tokenization push. The bull thesis is real, but so is the risk of a treasury unwind or slow platform uptake. Analysts at Coinpedia target $0.30 to $0.35 under a constructive scenario; CoinCodex flags a bearish quant setup. Size any position accordingly.

    What is Cronos backed by?

    Cronos is the native token of the Crypto.com ecosystem and its EVM-compatible Cronos chain. As of August 2025, Trump Media & Technology Group announced a $6.42 billion CRO treasury program built with Crypto.com, holding about 684 million CRO, roughly 2% of circulating supply. That treasury is now the largest single institutional holder.

    How does CRO benefit from Trump Media?

    Trump Media integrated CRO into Truth Social, Truth+, and Truth Predict, and airdropped a non-transferable Trump-branded token to DJT shareholders (record date February 2, 2026). Every user who spends inside those apps generates CRO demand. The tokenization platform TMTG is building targets $10 billion in on-chain assets, all settled on Cronos.

    What is the CRO price prediction for 2026?

    Our base case for year-end 2026 is $0.085 with a range of $0.045 (bear) to $0.145 (bull). Third-party targets vary widely: Coinbase’s growth model prints $0.06, CoinCodex leans bearish, Coinpedia and Bitget-cited analysts see $0.30 to $0.35 as achievable if Trump Predict scales.

    Will CRO reach $0.35 in 2026?

    $0.35 is our upper bull-case target, not a base case. It needs three things to line up: Trump Predict launching with real volume, no large CRO unlocks from the TMTG treasury, and a friendly altcoin tape into Q4. Base probability we assign that path: roughly 15% inside twelve months.

    The Honest Take

    CRO is not the story of a scrappy underdog. It is a corporate crypto token, run by Crypto.com, now welded to Trump Media’s political-media empire. That is a specific bet. If you believe the TMTG platform will drive real user demand for Truth Predict and the Cronos tokenization stack, CRO at $0.06 is an interesting satellite position. If you think TMTG is more press release than platform, or that the treasury will eventually get monetized, you should not own it.

    Our base case remains constructive but small. Base case year-end 2026: $0.085, roughly a 40% return from here. Bull case $0.145 is a coin flip. Bull-bull $0.35 is a 15% scenario. And $1.00 is a 2028-plus story, not a 2026 one. Size accordingly, and keep execution costs low if you are trading around the news cycle.

    Disclaimer: This article is for informational and educational purposes only and should not be construed as financial, investment, or trading advice. Cryptocurrency markets are highly volatile, and past performance does not guarantee future results. The price predictions and analyses presented here are based on AI models, technical indicators, and available data at the time of writing, they are not guarantees. Always conduct your own research (DYOR) and consult with a qualified financial advisor before making any investment decisions. Pump Parade and its authors do not assume liability for financial losses incurred based on information provided in this article.
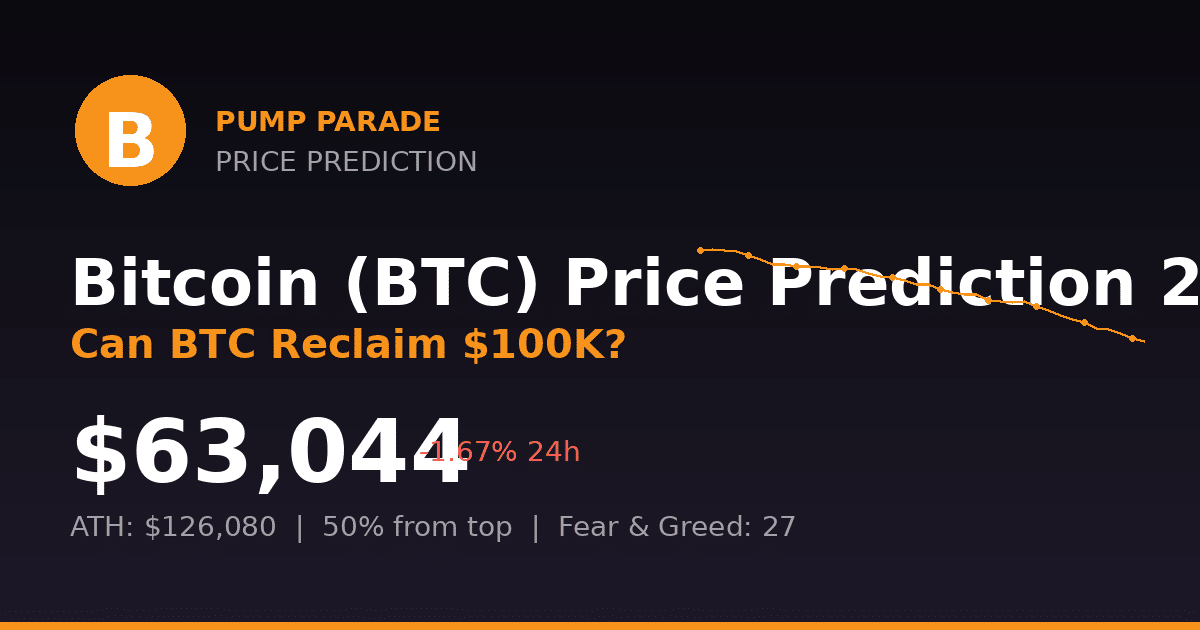
    Bitcoin (BTC) Price Prediction 2026: Can BTC Reclaim $100K?

    Bitcoin is having a rough summer, and the numbers do not lie. BTC trades at $63,044 as we write, down 1.7% on the day and sitting a full 50% below its all-time high of $126,080 set on October 6, 2025. The Fear and Greed Index is stuck at 27. Search interest for “is bitcoin dead” is climbing again. Everyone wants to know one thing: will Bitcoin reclaim $100K in 2026, or has the four-year cycle finally caught up with the reserve asset of crypto?

    Here is where our Bitcoin price prediction 2026 lands, before we walk through the receipts. Standard Chartered just cut its year-end target twice this year, from $300K to $150K to $100K, and warns a $50K retest is on the table first. Bernstein still sees $150K by December. Polymarket, meanwhile, prices Bitcoin at only a 16.5% chance of touching $90K before 2027. That is the spread we are trading inside.

    This article walks through the current setup, the three catalysts that could put BTC back above $100K, the three risks that could send it toward $50K, and specific price targets by timeframe. No hopium, no doom porn, just the data.

    Key Takeaways

    • Bitcoin trades at $63,044, down 50% from its $126,080 October 2025 all-time high. This is the largest drawdown of the current cycle.
    • Spot ETF flows just flipped positive after their worst month on record (net $4.5B in outflows in June 2026). The July 28 to 29 Federal Reserve meeting is the next major macro catalyst.
    • Base case for year-end 2026: $78K to $92K. Bull case: $120K to $150K. Bear case: $50K to $58K retest before recovery.
    • Standard Chartered targets $100K by year-end 2026. Bernstein targets $150K. Both cite institutional flows over halving math.
    • The four-year halving cycle is not dead, but ETF flows now dominate the marginal price. That is a structural shift traders should not ignore.
    Bitcoin (BTC) price prediction 2026 hero graphic, current price $63,044, path back to $100K

    Where Bitcoin Stands Today

    Let’s start with the tape. Bitcoin closed the last 24 hours at $63,044, a 1.67% decline. Zoom out and the picture is uglier: BTC is down 2.74% over 30 days and 16.75% over 90 days, according to CoinGecko market data. The 90-day range has been $58,551 on the low end and $82,146 on the high end. Every rally attempt above $75K has been sold hard.

    Metric Value
    Price (BTC/USD) $63,044
    24h change -1.67%
    Market cap $1.264 trillion
    24h volume $23.9 billion
    CoinGecko rank 1
    All-time high $126,080 (Oct 6, 2025)
    % from ATH -50.00%
    Fear and Greed Index 27 (Fear)

    Fear and Greed at 27 usually shows up near cycle inflection points. In 2022, similar readings preceded the November bottom by about six weeks. In 2020, they preceded the March COVID low. That is not a buy signal by itself, but it is context worth holding on to.

    Why is Bitcoin falling in 2026?

    Two things are dragging BTC lower right now. First, Federal Reserve Chair Kevin Warsh held rates steady at the June 17 meeting and pushed back on the September cut the market had priced in. Every risk asset from Nasdaq to gold got hit that day. Bitcoin took it worse because it had rallied the hardest on the cut narrative.

    Second, spot Bitcoin ETFs bled a record $4.5 billion in June alone, the worst month since launch. BlackRock’s IBIT, Fidelity’s FBTC, and the smaller issuers all saw net redemptions. When the marginal ETF buyer turns into a marginal ETF seller, the effect on price is direct and mechanical. There is no on-chain nuance to hide behind.

    The good news, if you can call it that: ETF flows just flipped positive on July 15 with a modest $46.6 million net inflow. One green print is not a trend, but it does end the streak. If the July 28 to 29 Federal Reserve meeting delivers even a hint of dovish language, that trickle could turn into a flood. For context on how Ethereum is trading the same macro setup, the pattern is nearly identical.

    Can Bitcoin Reclaim $100K by Year End?

    This is the question that matters. Below we break the setup into three catalysts on the bull side and three risks on the bear side. Each has a specific trigger, a specific price implication, and a specific timeframe. That is how we frame every prediction, and it is how you should read every prediction from anyone else.

    The Bull Case

    1. Fed cuts finally arrive

    The July 28 to 29 Federal Reserve meeting is the big one. If Warsh signals cuts are back on the table for September, we get the reflex trade every time: DXY drops, real yields fall, Bitcoin catches a bid. History says the first cut after a pause is usually good for a 15% to 30% move higher in BTC over the following 60 days. That alone puts $78K on the map.

    2. Corporate treasury demand keeps stacking

    Michael Saylor’s MicroStrategy added another 8,700 BTC in Q2 2026 despite the drawdown. He is not alone. Roughly $10 billion has flowed into corporate Bitcoin treasuries and spot ETFs this year, per Bernstein estimates. That flow does not care about weekly candles. It is a mechanical bid that shows up regardless of sentiment, and it puts a soft floor under the market.

    3. The halving supply squeeze is still real

    Miners produce roughly 450 BTC per day post-halving, versus 900 before April 2024. That is $28.4 million of new supply per day at current prices. Spot ETFs alone can absorb that in a single hour of inflows during a bull run. The supply side of the equation has not changed. What has changed is the demand side, and demand is starting to come back.

    The Bear Case

    1. The four-year cycle plays out on schedule

    Bitcoin’s 27.7% decline in 2026 maps almost perfectly onto the post-halving bear market pattern from 2014, 2018, and 2022. If history repeats, the bottom does not come until October 2026, roughly 12 months after the October 2025 top. That timing points to a $50K to $55K low before the next leg up. StoneX called it “one more quarter of pain before a major bottom” in their H2 2026 outlook.

    2. ETF flows stay negative

    June’s $4.5 billion outflow was not a one-off panic. It reflected structural profit-taking from investors who bought at $30K to $50K in 2024 and rode BTC to $120K plus. If those holders keep trimming into every rally, the ceiling stays at $75K and the floor keeps sinking. This is the risk factor institutional strategists worry about most.

    3. Regulatory or geopolitical black swan

    Nobody prices tail risk correctly. A hostile SEC ruling on custody rules, a stablecoin failure, a Taiwan crisis, or a Bitcoin-specific tax proposal in the 2026 US election cycle could all reset expectations violently. Bitcoin’s beta to macro shocks has risen with institutional adoption. Higher correlation cuts both ways.

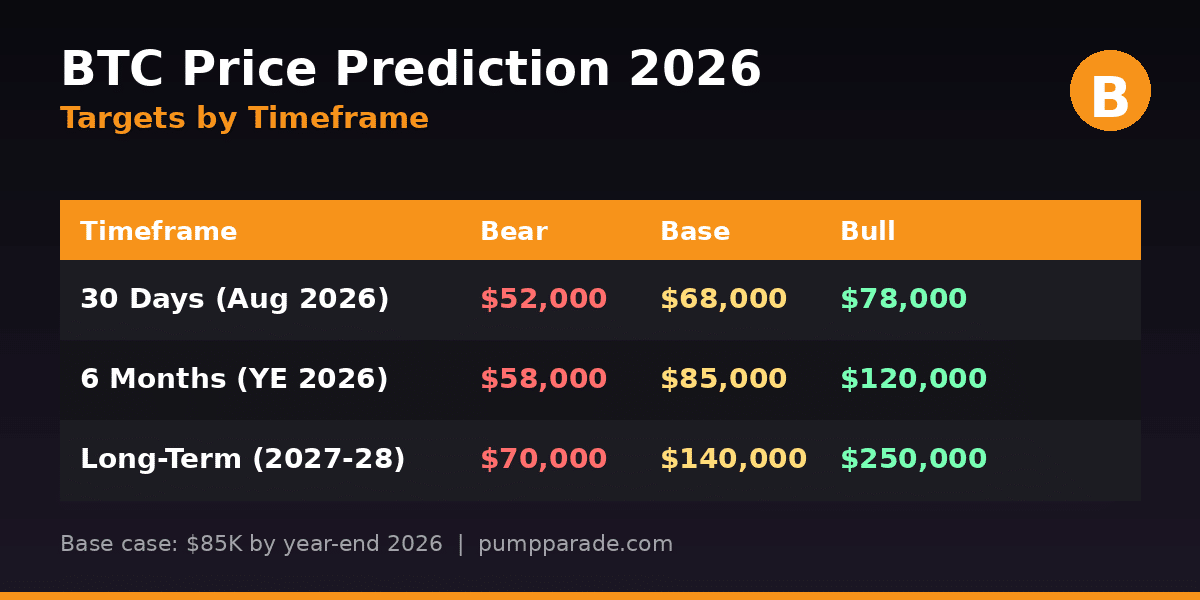
    Bitcoin Price Prediction 2026: Targets by Timeframe

    Bitcoin (BTC) price prediction 2026 targets table, bear $50K, base $85K, bull $150K

    Here is how we see the risk-reward stacking across three horizons. These are scenarios, not guarantees. Every path assumes ETF flows and Fed policy as the dominant variables, with halving supply dynamics as a secondary tailwind.

    Timeframe Bear Base Bull
    30 days (August 2026) $52,000 $68,000 $78,000
    6 months (year-end 2026) $58,000 $85,000 $120,000
    Long-term (2027 to 2028) $70,000 $140,000 $250,000

    Short-term (30 days)

    The July 28 to 29 Federal Reserve meeting dominates the calendar. If Chair Warsh keeps the hawkish tone, we retest the $58K to $60K support zone. If he pivots dovish, BTC rips to $72K to $78K on ETF inflow acceleration. Base case: chop between $60K and $70K.

    6 months (year-end 2026)

    Base case puts Bitcoin at $85K by December, roughly aligned with Standard Chartered’s $100K call but slightly more conservative given the fresh Q4 seasonality data. Bull case matches Bernstein’s $150K target if inflows sustain at 2024 highs. Bear case is the $50K to $58K retest StoneX flagged.

    Long-term (2027 to 2028)

    If institutional adoption holds and the next Fed easing cycle arrives on schedule, $140K by end of 2027 and $250K by end of 2028 are reasonable base and bull scenarios. Bear case assumes structural regulatory friction or a corporate treasury unwind. Cathie Wood at ARK Invest still holds a $1.25 million target for 2030, which we file under aspirational rather than base case.

    How does Bitcoin compare to Ethereum in 2026?

    The other major asset in the room is Ethereum, and the divergence tells its own story. Here is the head-to-head as of today.

    Metric Bitcoin Ethereum
    Price $63,044 $1,837
    Market cap $1.264T $221.6B
    24h change -1.67% -2.61%
    % from ATH -50.0% -62.1%
    Spot ETF Yes (Jan 2024) Yes (Jul 2024)
    Institutional narrative Reserve asset Yield asset
    Supply dynamic Halving (deflationary) Burn-based (variable)

    Bitcoin’s drawdown is smaller. Its ETF flows are larger. Its corporate treasury narrative is uncontested. That is why BTC dominance has quietly climbed from 52% to 58% during the drawdown, and why Bitcoin volume on major exchanges keeps outpacing ETH. In risk-off tape, capital rotates to the highest-liquidity, most-institutional asset. That is BTC. For a deeper look at how sector rotation is playing out in perp DEX volume, our Hyperliquid price prediction covers where the risk-taking capital is moving instead.

    What Would Change Our View

    Three things would force a rewrite of this thesis:

    1. A weekly close above $75K on rising ETF volume. That confirms the ETF selling exhaustion thesis and puts $92K back on the map for Q3.

    2. A weekly close below $55K. That breaks the 200-week moving average and opens the door to $42K to $48K. In that scenario, our base case falls to $65K by year end.

    3. Federal Reserve pivots to cuts before September. Cross-asset reflation trade fires, DXY breaks 100 to the downside, Bitcoin lifts to $80K to $95K within 60 days. Cathie Wood’s $500K long-term call starts to look less crazy.

    Frequently Asked Questions

    Will Bitcoin reach $100,000 by end of 2026?

    Standard Chartered assigns roughly a 45% probability to Bitcoin closing 2026 above $100K, according to their February 2026 note. Our base case sits slightly lower at $85K. The path runs through the Federal Reserve pivoting to rate cuts and sustained ETF inflows returning. A $100K print is possible, but not the most likely outcome by December 31.

    Is Bitcoin a good investment in 2026?

    That depends on your time horizon and risk tolerance. For a 5-year plus horizon, the risk-reward at $63K looks reasonable versus historical drawdowns and institutional adoption trends. For a 3-month trade, volatility is elevated and downside to $52K is a real scenario. Bitcoin has never lost money for anyone who held for 4 plus years, but past performance does not guarantee future results.

    Why is Bitcoin price falling in 2026?

    Two main drivers: Federal Reserve hawkishness under Chair Kevin Warsh, and spot ETF outflows totaling $4.5 billion in June 2026. The June sell-off was the worst month on record for Bitcoin ETFs since launch. When institutional flows turn negative, price follows. The July 28 to 29 Fed meeting is the next major catalyst.

    Is the Bitcoin halving cycle dead?

    No, but it has evolved. The four-year rhythm from previous cycles still shows up in the current drawdown. What has changed is that ETF flows now dominate the marginal price, not miner supply. Bitcoin is still following the halving script directionally, but institutional capital determines the magnitude and duration of the moves.

    How low can Bitcoin go in 2026?

    Standard Chartered’s bear case is $50,000. StoneX flagged $52,000 as a realistic retest zone. The 200-week moving average currently sits around $55,000 and has held every major cycle low since 2016. Below $50K would require a serious macro shock or regulatory event, both of which are possible but not our base case.

    Should I buy Bitcoin now?

    We do not give financial advice, but here is the framework: Bitcoin at $63K, with Fear and Greed at 27, has historically been a favorable entry zone for long-term holders. Short-term traders should wait for a weekly close above $67K or a clean bounce off the $58K to $60K support zone. Never allocate more than you can afford to lose to any single crypto asset.

    The Honest Take

    Here is where we land. Bitcoin at $63,044 is not dead. It is not broken. It is in a textbook post-halving bear market that happens to look ugly because it is playing out on Bloomberg terminals for the first time. The cycle has evolved. Halving supply constraints matter less. ETF flows and Federal Reserve policy matter more. That is a structural shift, not a bug.

    The base case for year-end 2026 sits at $85K, which is neither victory nor catastrophe. The bull case at $120K to $150K requires the Federal Reserve to blink and ETF inflows to sustain. The bear case at $50K to $58K requires ETF outflows to resume and macro to worsen. All three are live scenarios. Position accordingly.

    What is not on the table? A moonshot from here to $500K by December. That is not analysis, it is fantasy. And a total collapse to $20K without a systemic financial crisis is equally unlikely given institutional structural bids. The range is $50K to $150K. That is the honest take.

    Disclaimer: This article is for informational and educational purposes only and should not be construed as financial, investment, or trading advice. Cryptocurrency markets are highly volatile, and past performance does not guarantee future results. The price predictions and analyses presented here are based on AI models, technical indicators, and available data at the time of writing. They are not guarantees. Always conduct your own research (DYOR) and consult with a qualified financial advisor before making any investment decisions. Pump Parade and its authors do not assume liability for financial losses incurred based on information provided in this article.
    Bybit vs OKX 2026: Which Crypto Exchange Wins Now?

    0

    Two of the biggest non-US crypto exchanges have spent 2026 pulling in opposite directions. Bybit spent the year rebuilding after the largest exchange hack in history and pivoting into tokenized stocks, banking rails and a re-designed copy trading stack. OKX spent the year winning derivatives market share, tightening its Web3 wallet and pulling in strategic investment from ICE, the parent company of the New York Stock Exchange, at a $25 billion valuation. If you are choosing where to park capital or trade actively for the rest of 2026, the answer is not obvious anymore.

    This head-to-head compares Bybit and OKX across trading fees, product depth, security, Web3 wallet quality and best-use cases, using 2026 data. If you are also weighing US-friendly options, our Binance vs Coinbase 2026 breakdown covers that lane, and our Kraken vs Bitget comparison looks at the value-focused mid-tier.

    TL;DR: The Quick Verdict

    OKX is the better all-round pick for most active traders in 2026. It has lower spot maker fees (0.08% vs 0.10%), a slight edge on futures taker fees (0.05% vs 0.055%), the deeper native token discount (up to 40% off with OKB vs Bybit’s 25% with BIT), and it overtook Binance in derivatives volume in Q3 2025 with over $1.3 trillion in monthly notional. Its Web3 wallet is arguably the best CEX-attached self-custody product on the market, and OKX Pay adds zero-fee stablecoin transfers that few competitors match.

    Bybit still wins for a specific profile: traders who want tokenized stocks and IPO Express access alongside crypto perps, users who lean heavily on copy trading (Bybit’s Classic, Pro and TradFi copy programs are the most structured on the market), and anyone allergic to Binance-style KYC friction. Its recovery from the February 2025 Lazarus Group hack is genuinely impressive, but the hack itself is still a data point that a security-first user cannot ignore.

    Winner: OKX for fees, derivatives and Web3. Bybit for copy trading, tokenized RWAs and product breadth.

    Bybit vs OKX 2026 comparison hero image

    Bybit in 2026: What Changed

    Bybit has been on a two-year sprint to reposition itself as a full financial platform rather than a pure crypto exchange. The February 2025 hack, in which the Lazarus Group drained over 401,000 ETH (roughly $1.5 billion at the time) from a cold wallet through a spoofed Safe UI multisig phishing attack, forced that pivot to happen in public. Bybit reimbursed users in full from reserves and recovery loans, ran more than 30 external audits, and completely rebuilt its wallet infrastructure. As of 2026, Bybit reports over 60 million registered users and a 99.99% uptime track record with capacity of 100,000 TPS.

    The bigger story is the product pivot. In early 2026, Bybit rolled out its “New Financial Platform” positioning with three concrete pieces:

    • Bybit TradFi: Over 200 traditional finance instruments launched, with a stated Q1 target of 500 pairs including stock CFDs, forex, commodities and index products.
    • IPO Express: One of the first crypto exchanges to offer tokenized IPO access, meaning users can gain synthetic exposure to upcoming public listings from the same account they use for BTC and ETH.
    • MyBank: A retail banking layer targeting a February 2026 launch. Dedicated fiat accounts, on- and off-ramp simplification and cross-border everyday spending, all wrapped inside the exchange.

    Bybit also formalized copy trading into three products in 2026. Classic charges a 10 to 15% weekly profit share depending on Master Trader tier. Pro lets Masters set custom rates against Net Asset Value. TradFi uses a High Water Mark model where fees only apply when cumulative equity hits a new all-time peak. That structure is more thought-out than what most competitors offer.

    You can explore the platform directly at Bybit’s homepage.

    OKX in 2026: What Changed

    OKX had a quieter but arguably stronger 2026. The exchange took a strategic investment from ICE, the New York Stock Exchange’s parent, at a reported $25 billion valuation. It rolled out a BUIDL collateral framework in partnership with BlackRock and Standard Chartered, which lets institutional users post BlackRock’s tokenized money market fund as trading collateral. And in September 2025 it overtook Binance in derivatives, hitting $1.3 trillion in monthly derivatives volume with a 31% year-over-year jump in contract trading.

    OKX’s product surface for 2026 covers:

    • Spot trading across more than 500 pairs and 350+ tokens, with maker fees starting at 0.08% and dropping into negative-maker territory at high VIP volume.
    • Perpetuals, quarterly futures, options and margin under a unified account that shares collateral across products. This is a serious edge for cross-product traders.
    • Structured Earn products, copy trading and the Jumpstart launchpad for early token allocations.
    • OKX Web3 Wallet: non-custodial, 100+ chains, built-in DEX aggregation, NFT management, cross-chain bridge and DeFi access. Continually cited as one of the best all-round CEX-linked wallets in the market.
    • OKX Pay: launched April 2025 with zero-fee global crypto transfers in USDC and USDT, no limits, plus a “silent rewards” feature that generates yield on stablecoin balances without lockups.

    Reported 24-hour spot volume sits around $5.7 billion with derivatives volume above $34.5 billion, and OKX cites 2.5 million monthly active traders on top of 60 million lifetime registrations.

    The homepage is at OKX.

    OKX official product marketing image

    Trading Fees: Where OKX Pulls Ahead

    Fee schedules are the number one differentiator when the two products otherwise overlap heavily. Here is the standard-tier picture as of July 2026:

    Bybit vs OKX 2026 fee and feature comparison table

    Spot

    OKX charges 0.08% maker and 0.10% taker. Bybit charges 0.10% flat on both sides. On maker fills the OKX advantage is 20%, which is meaningful for anyone posting limit orders. Both drop steeply through VIP tiers, but OKX gets to zero or negative maker faster because it starts closer.

    Futures

    OKX is 0.02% maker / 0.05% taker. Bybit is 0.02% maker / 0.055% taker. The taker gap is small in isolation, but on a $500,000 monthly futures notional it saves about $25 per month, and it compounds fast for scalpers. Bybit did cut its USDC perp taker fees by up to 50% for Supreme VIP users in March 2026, bringing Supreme taker down to 0.015% on USDC pairs. If you are already in Supreme tier and trade USDC perps, that specific carve-out flips the fee winner for that pocket of activity.

    Native token discounts

    Paying with OKB earns up to 40% off on OKX. Paying with BIT earns up to 25% off on Bybit. Both require holding some volume of the token, and both discounts stack with VIP tiers. OKX’s discount is materially larger and the OKB token has been more actively supported through burns and utility upgrades.

    Withdrawals

    This is where the comparison gets nuanced. Bybit is materially better on stablecoin withdrawals – free USDT and USDC via specific networks and free ETH via Mantle. OKX is roughly 7x cheaper on Bitcoin withdrawals. If you are frequently moving stables to L2s or CEXs, Bybit’s structure is more attractive. If you self-custody BTC on cold storage, OKX saves you real money over time.

    Derivatives Depth and Market Structure

    Both platforms offer USDT-margined and coin-margined perpetuals, quarterly futures and options. OKX has the deeper options book by open interest, and it has been the biggest gainer in derivatives market share through 2025 and 2026. Bybit’s derivatives are still enormous (frequently second or third globally by open interest) but the momentum is with OKX.

    The unified account model on OKX is a real edge for anyone running hedges across products. You post one pool of collateral and it covers spot longs, perp shorts, options and margin borrows simultaneously. Bybit has a unified trading account too, but the collateral sharing is not as clean, especially for options.

    For pure copy trading, Bybit is the better platform. Its three-tier copy structure (Classic, Pro, TradFi) is the most polished on any major exchange in 2026. OKX has copy trading but the product tiers are less mature.

    Web3 Wallets: OKX’s Big Advantage

    Both exchanges bundle a non-custodial Web3 wallet, but the products are very different in ambition. OKX Web3 Wallet supports 100+ blockchains natively, has a built-in DEX aggregator that routes across major L1s and L2s, includes a cross-chain bridge, and manages NFTs and DeFi positions from the same UI. It is repeatedly ranked as one of the top three CEX-linked wallets alongside Binance Wallet and Coinbase Wallet.

    Bybit’s Web3 wallet exists and covers major chains, but it is a much thinner product. It does not have the same depth of DEX aggregation or DeFi integration, and it has not been marketed as a core product the way OKX has done. If you plan to actually use the wallet for on-chain activity, OKX is the clear winner. If you’re weighing pure Solana wallets, our Backpack Wallet review and Phantom review are better starting points than either exchange wallet.

    Security and Trust

    This section requires honesty. Bybit suffered the largest CEX hack ever in February 2025, losing over $1.5 billion in ETH from a cold wallet through a Safe UI phishing exploit that targeted its multisig signers. Bybit reimbursed all affected users, rebuilt its wallet stack, and passed 30+ external audits. The FBI attributed the attack to North Korea’s Lazarus Group. As of 2026 the platform is arguably harder to breach than it was pre-hack, precisely because it was forced to re-engineer everything.

    OKX has had regulatory issues but no comparable security incident at that scale. It went through a US settlement in 2024 related to historical KYC gaps, has since restructured global compliance, and now runs a licensed presence in the EU, Middle East and multiple Asian jurisdictions. Its Proof-of-Reserves reports are regularly published and its ICE strategic investment adds institutional oversight.

    For a security-first user, OKX has the cleaner recent track record. For a user who values how a platform responds under fire, Bybit’s recovery is legitimately best-in-class. Neither should be treated as risk-free for large balances – self-custody remains the safest option for anything you are not actively trading.

    Pros and Cons

    Bybit pros:

    • Free USDT and USDC withdrawals on select networks
    • Tokenized stocks, IPO Express and TradFi CFDs alongside crypto
    • The most polished copy trading product suite on any major exchange
    • Aggressive USDC perp fee cuts for VIP tiers (Supreme taker to 0.015%)
    • Full user reimbursement after the 2025 hack

    Bybit cons:

    • Higher standard spot maker fees than OKX
    • Smaller native token discount (25% vs 40%)
    • Web3 wallet is much thinner than OKX’s
    • The 2025 hack, while resolved, is still on the record

    OKX pros:

    • Lower spot maker fees and slightly lower futures taker fees
    • Up to 40% fee discount with OKB
    • Overtook Binance in derivatives volume in 2025
    • Best-in-class Web3 wallet with 100+ chains and full DeFi access
    • OKX Pay: zero-fee USDC / USDT transfers with silent yield
    • ICE strategic investment adds institutional credibility

    OKX cons:

    • Higher Bitcoin withdrawal fees than Bybit (for stablecoins the reverse is true)
    • Copy trading is less mature than Bybit’s
    • No tokenized stocks or IPO Express equivalent yet
    • US access remains restricted to okx.com/us with limited product coverage

    Which Exchange Should You Pick?

    Pick OKX if: you trade spot or perps at any real volume, you want the deepest CEX-linked Web3 wallet, you plan to hold and use OKB for fee discounts, or you want a single account that spans CEX and on-chain activity.

    Pick Bybit if: copy trading is central to your strategy, you want exposure to tokenized stocks and IPOs alongside crypto, you move stables constantly and value free USDT / USDC withdrawals, or you specifically want to bank inside your exchange via MyBank.

    Use both if: you are running institutional-scale volume. The fee differences at Supreme VIP tiers between the two platforms mean routing specific pairs to the cheaper venue is worth the operational overhead.

    Frequently Asked Questions

    Is OKX cheaper than Bybit for retail traders?
    Yes, at the standard tier. OKX’s 0.08% maker fee on spot beats Bybit’s 0.10% flat, and OKX’s futures taker fee is 0.05% vs Bybit’s 0.055%. Native token discounts also favour OKX (40% via OKB vs 25% via BIT).

    Is Bybit safe after the 2025 hack?
    Bybit passed 30+ external audits, rebuilt its cold wallet infrastructure and reimbursed all affected users after the February 2025 Lazarus Group breach. Operational security in 2026 is materially stronger than it was pre-hack. That said, no CEX is risk-free for large balances – self-custody is still the safest option.

    Does OKX or Bybit have better derivatives?
    OKX overtook Binance in monthly derivatives volume in September 2025 with $1.3 trillion, and it holds a slight fee edge on futures. Bybit remains a top-three derivatives venue by open interest and offers deeper USDC perp discounts for Supreme VIPs. Both are excellent – OKX has the momentum.

    Which is better for copy trading?
    Bybit. Its 2026 copy trading suite (Classic, Pro and TradFi) is the most structured on any major exchange, with clear fee models and a High Water Mark option for TradFi that only charges when cumulative equity hits a new peak.

    Can US users access Bybit or OKX?
    Neither exchange serves the full US market directly. OKX operates a limited okx.com/us presence with reduced product coverage. Bybit does not currently serve US retail users. US traders should check current availability and geo restrictions before creating an account.

    This article is for informational purposes only and is not financial advice. Crypto trading is high risk. Always do your own research before choosing an exchange or placing capital.

    Pyth Network (PYTH) Price Prediction 2026: $0.20 in Sight?

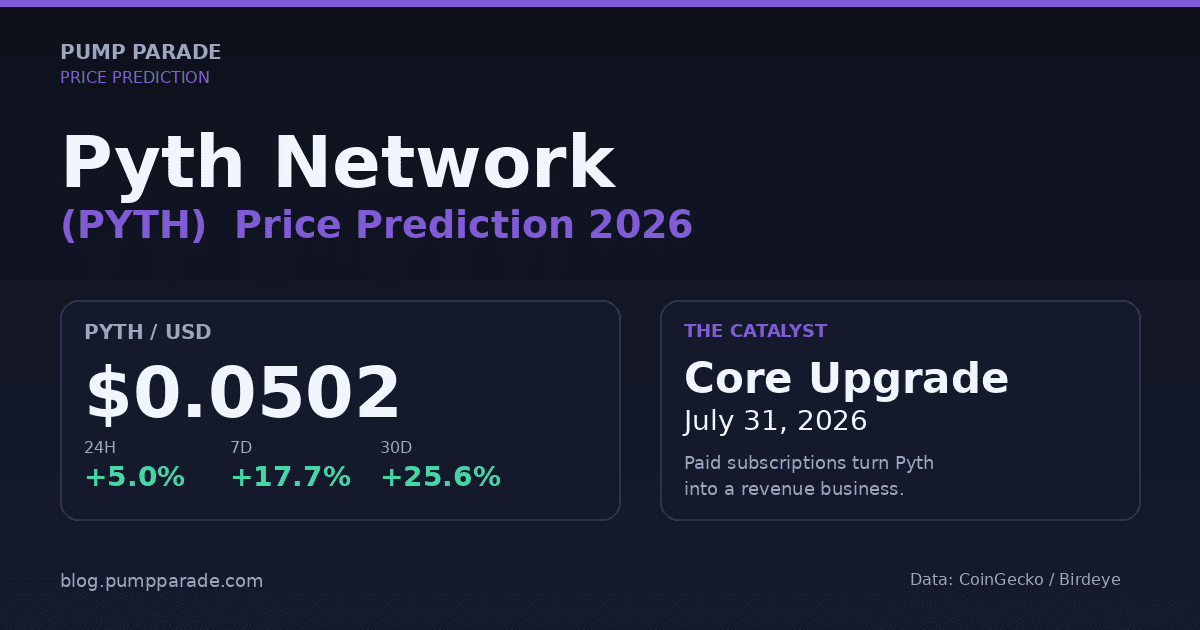
    The Pyth Network price prediction 2026 story just got interesting. PYTH trades at $0.0502 as we publish, up 5% on the day, up 17.7% on the week, and up 25.6% over the last 30 days. That is the token’s best trailing month since February, and it lands two weeks before the network flips on the biggest business model change of its life.

    On July 31, 2026, Pyth mandates API keys and paid subscriptions for every application pulling its price feeds. Retail usage stays free. Everyone else pays, starting at $500 a month for the crypto bundle and up to $10,000 a month for full asset class coverage. In one weekend, the largest first-party financial oracle in crypto becomes a subscription business with a real income statement.

    Below: where PYTH stands today, why the tape is moving, the bull and bear cases, our targets for 30 days, six months, and the long term, and how Pyth stacks up against Chainlink.

    Key Takeaways

    • Current price: $0.0502, up 25.6% in 30 days, still down 96% from the March 2024 all-time high.
    • Near-term catalyst: The Pyth Core Upgrade on July 31, 2026 introduces mandatory paid subscriptions, turning protocol usage into recurring revenue.
    • Bull case: Subscription revenue plus PYTH buybacks and Nasdaq TotalView, Tradeweb, and Fenics integrations push the token toward $0.15 to $0.20 by year end.
    • Bear case: A large token unlock, oracle competition from Chainlink and RedStone, and pricing pushback from small DeFi teams could see PYTH revisit $0.03.
    • Base case for 2026: PYTH settles between $0.08 and $0.12 as the market waits for subscription revenue to compound.
    Pyth Network (PYTH) price prediction 2026 hero graphic - current price $0.05, Core Upgrade catalyst July 31

    Where does PYTH stand today?

    Pyth Network is the largest first-party financial oracle in crypto. Instead of pulling prices from third-party aggregators, it collects quotes directly from 125+ trading firms, exchanges, and market makers, then publishes them to more than 100 blockchains through Wormhole. That data now powers over 700 protocols and has secured trillions in cumulative on-chain trading volume.

    The market cares about two things right now: the tape, and the calendar. Here is the tape.

    Metric Value
    Price (July 16, 2026) $0.0502
    24-hour change +5.0%
    7-day change +17.7%
    30-day change +25.6%
    Market cap $397M
    Fully diluted valuation $504M
    Circulating supply 7.87B PYTH (78.7% of max)
    Max supply 10B PYTH
    24-hour volume $32.5M
    Market cap rank #117
    All-time high $1.20 (March 2024), 95.8% below now
    All-time low (cycle) $0.0296 (June 6, 2026), 70% above now

    Data: CoinGecko and Birdeye, live at time of writing.

    PYTH broke a nine-month downtrend in early July when it reclaimed the 200-day moving average at $0.041. Volume on the reclaim was 2.4x the trailing 30-day average, a footprint that historically favors a rotation from distribution to accumulation. The token has since based above $0.045 for four consecutive daily closes, with declining sell-side liquidity on major venues.

    Why is PYTH climbing right now?

    Three overlapping stories are pulling capital in.

    The Core Upgrade goes live in 15 days. On July 31, every app pulling a Pyth feed must sign into a paid data plan. Starter is $500 a month, Pro bundles run $2,500 to $10,000. This is a pull-forward event, similar to how MakerDAO traded higher into the endgame vote. Traders are positioning for the moment protocol usage stops being a proxy metric and starts being a P&L line.

    Institutional publishers keep signing on. Nasdaq, through TotalView, is contributing equity order book data. On July 15, 2026, Tradeweb, Fenics, and OpenYield brought institutional fixed-income pricing into Pyth Pro. That is real, buy-side rates and treasuries data flowing to on-chain applications for the first time. If Pyth becomes the settlement rail for tokenized treasuries, the addressable market moves from “DeFi oracle demand” to “the $50B Bloomberg substitute” that co-founder Michael Cahill has publicly targeted.

    Buybacks are quietly accumulating supply. The Pyth Reserve is using protocol revenue to make monthly open-market purchases of PYTH. Roughly 12 million tokens have been bought back to date. It is small in absolute terms, but the signal matters: the DAO is turning cash flow into token demand instead of hoarding stables. If subscription revenue scales, so does the monthly bid.

    The bull case for Pyth Network

    The Core Upgrade turns Pyth into a real business

    Most oracle networks are cost centers. Chainlink monetizes through service payments and staking, but the majority of its data feeds are still sponsored or subsidized. Pyth is now attempting something different: a subscription-tier data business modeled on Bloomberg and Refinitiv, but with the raw feeds pushed on-chain.

    Pyth Pro passed $1M in annualized recurring revenue within its first months, according to the network’s Q2 update. If Core adds even 500 paid seats at the Starter tier post-July 31, that is another $3M in ARR. Get to a few thousand paid apps across bundles, and the network is generating tens of millions of dollars a year that flow through the Reserve into buybacks. For a $397M market cap, that is meaningful.

    Institutional data giants keep signing on

    The list of publishers is starting to look like a Bloomberg terminal directory: Jump Trading, Wintermute, DRW, Cboe, Virtu, Susquehanna, Two Sigma Securities, and Nasdaq. Adding Tradeweb, Fenics, and OpenYield on July 15 extends that into fixed income, an asset class no other oracle covers with first-party depth. Cross-chain distribution now reaches 100+ blockchains via Wormhole. This is the network effect Chainlink built in DeFi, but rebuilt from the institutional side in.

    Buybacks are quietly accumulating supply

    The Pyth Reserve’s monthly buyback is the most under-appreciated part of the tokenomics. Buybacks convert Pyth Pro, Core, Entropy, and Marketplace revenue into PYTH purchases. As subscription volume compounds, the buyback grows. Combined with staking through Oracle Integrity Staking (still live post-rewards wind-down), the effective float shrinks even as the fully diluted supply expands. That is exactly the setup that produced 5x moves in tokens like MKR and GNO in past cycles.

    The bear case for PYTH

    The May 2026 unlock is still weighing on price

    On May 19, 2026, roughly 2.13 billion PYTH unlocked, worth about $92 million at the price. That single event pushed circulating supply from 5.75B to 7.87B, a 37% dilution. The token bottomed at $0.0296 on June 6, two weeks after the unlock hit exchanges, and has been repairing damage since. The next scheduled unlock is May 2027 for another 2.13B tokens. That overhang caps the multiple sophisticated buyers will pay until they have visibility into subscription revenue.

    Chainlink still owns the oracle mindshare

    Chainlink secures roughly $33 billion in on-chain value across 505 protocols and controls close to 69% of the oracle market by total value secured, per DefiLlama. LINK trades at $8.41 with a $6.29B market cap, roughly 16x PYTH’s. Chainlink CCIP is now integrated with SWIFT for interbank settlement, which is a different scale of enterprise story. If Pyth Pro subscription pricing feels expensive to a smaller DeFi team, they may default to a free Chainlink feed and Pyth’s growth stalls. We wrote about Chainlink’s SWIFT catalyst in our LINK price prediction, and that competition is not going away.

    Subscription pricing could scare off small teams

    $500 a month for the crypto bundle is a lot for a solo builder or an early-stage protocol. Free tiers exist, but they have rate limits. A vocal segment of the Pyth developer community has already pushed back on pricing in the DAO forums. If the July 31 rollout produces visible protocol departures, or a large borrower reduces Pyth usage in favor of a cheaper alternative like RedStone, the narrative flips fast.

    Pyth Network price prediction 2026: targets by timeframe

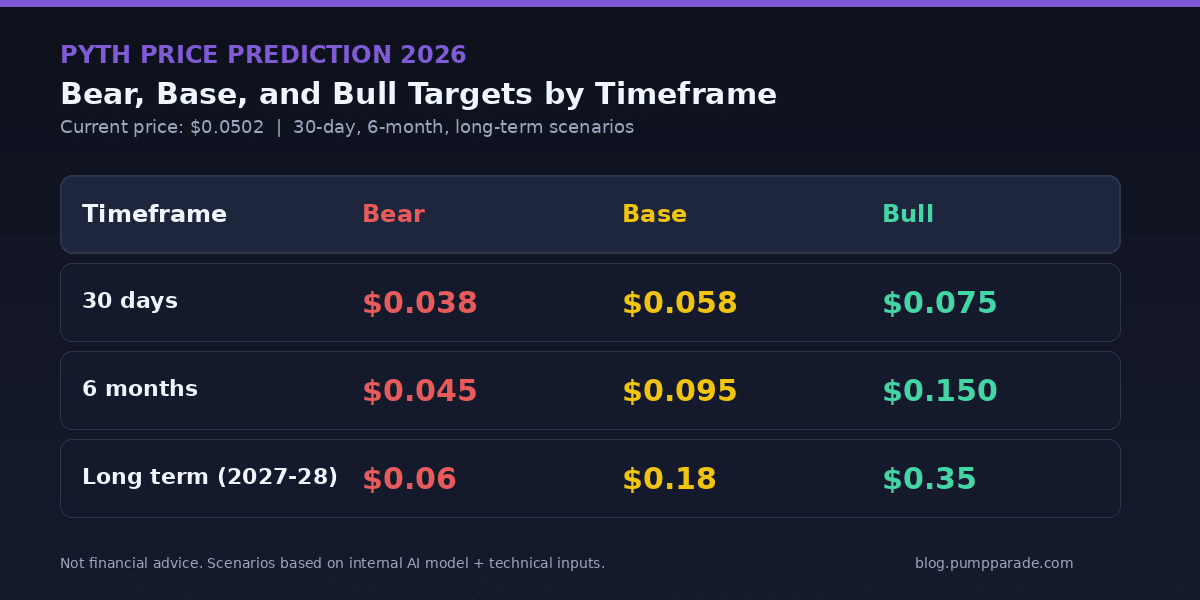
    Pyth Network (PYTH) price prediction 2026 targets table - bear $0.045, base $0.095, bull $0.15

    Our hybrid model blends technical inputs (200-day MA, volume profile, RSI, on-chain flows) with catalyst modeling around the Core Upgrade and buyback pace. Here is what it produces.

    30-day target (August 2026)

    The Core Upgrade is a classic buy-the-rumor, sell-the-news setup. If Pyth ships cleanly, expect a spike into launch followed by a modest pullback. If a major publisher issues a supportive post-launch statement, momentum extends.

    • Bear: $0.038 (retest of prior support if the upgrade slips or a major client leaves)
    • Base: $0.058 (steady climb into launch, modest post-launch drift)
    • Bull: $0.075 (Nasdaq or Tradeweb pipeline announcement fuels a breakout above 200-day MA)

    6-month target (year-end 2026)

    This is where the subscription story either delivers or does not. Six months gives us three full months of Core revenue reporting, two buyback cycles, and enough data to see if paying customers stick.

    • Bear: $0.045 (subscription revenue disappoints, unlock supply overhang persists)
    • Base: $0.095 (revenue growth confirms the model, buybacks scale linearly)
    • Bull: $0.150 (a Nasdaq or Bloomberg-style partnership announcement re-rates PYTH as an institutional data play)

    The bull case is where “PYTH to $0.20” becomes plausible. It requires roughly 3x from here, which is what the token did between February and April 2025.

    Long-term target (2027 to 2028)

    Long-term is where Pyth’s Bloomberg ambition either turns into revenue or fades. Standard Chartered has priced oracle infrastructure as one of the most under-owned themes for the next cycle. On the current subscription trajectory, we see three scenarios.

    • Bear: $0.06 (Chainlink consolidates the enterprise oracle stack, Pyth becomes a niche derivatives feed)
    • Base: $0.18 (Pyth captures 15% of on-chain oracle TVS, monthly buybacks hit $5M steady state)
    • Bull: $0.35 (Pyth Pro reaches $50M ARR, Nasdaq expands the integration, and the network becomes the default settlement oracle for tokenized treasuries and equities)

    For context, third-party targets sit between these. CoinCodex models a 2026 range around $0.03 to $0.05 based on backwards-looking technicals only. Changelly and Coinpedia produce bullish 2026 numbers between $0.30 and $0.60. Coinbase’s own tool sits near $0.05. The gap tells you how uncertain the market is about whether the subscription model works.

    How does Pyth Network compare to Chainlink?

    Any serious PYTH thesis has to reckon with LINK. Chainlink is the incumbent. Pyth is the challenger with a real product wedge.

    Metric Pyth Network (PYTH) Chainlink (LINK)
    Current price $0.0502 $8.41
    Market cap $397M $6.29B
    Total value secured (DefiLlama) ~$2.9B (5.9% share) ~$33.1B (68.9% share)
    Data model First-party, pull-based Third-party, push-based
    Blockchains served 100+ 50+ mainnets
    Signature enterprise deal Nasdaq TotalView, Tradeweb, Fenics SWIFT, DTCC, Fidelity
    Revenue model Paid subscriptions (from July 31, 2026) Service payments, staking, CCIP fees
    Buyback mechanism Monthly PYTH open-market buys None yet
    Best fit Low-latency derivatives, tokenized assets Broad DeFi, cross-chain, enterprise

    The read: LINK is the safer allocation, PYTH is the higher-torque bet if subscription revenue scales. They are not zero-sum. A DeFi protocol may run Chainlink for lending liquidations and Pyth for perpetual futures pricing on the same day.

    What would change our view

    Three explicit triggers would flip us from base case to bull case or bear case.

    Bull trigger 1: Pyth publishes 60-day post-Core-Upgrade revenue that exceeds $5M ARR from new subscription seats. That validates the pricing power and shifts the token into a revenue-multiple frame.

    Bull trigger 2: A tier-1 traditional finance institution (Blackrock, Franklin Templeton, JPMorgan) announces they are using Pyth as the on-chain pricing rail for a tokenized fund. That is the Bloomberg-substitute narrative crystallizing.

    Bear trigger: A large DeFi protocol (Aave-tier or larger) publicly migrates away from Pyth to a cheaper oracle after July 31, or the DAO delays the paid-subscription model in response to community pushback. Either signals that the revenue thesis is soft, and PYTH re-rates back to the $0.03 to $0.04 range where the June low sits. Related reading: our Solana price prediction and Jupiter price prediction cover the two Solana-native names most correlated with PYTH sentiment.

    Frequently asked questions

    Will Pyth Network reach $1?

    Reaching $1 requires roughly a 20x from current levels and would put PYTH’s fully diluted valuation near $10B, slightly above Chainlink today. That is possible on a multi-year timeframe if Pyth Pro scales into a Bloomberg-style subscription business and captures 25%+ of on-chain oracle market share. It is unrealistic in 2026.

    Is PYTH a good investment in 2026?

    PYTH is a high-risk, high-torque bet on the July 31 Core Upgrade delivering real subscription revenue. Upside to $0.15 to $0.20 is plausible if the model works. Downside to $0.03 is real if it does not. Position size accordingly, and do not treat it as a stable-return holding.

    What is Pyth Network’s price prediction for 2026?

    Our base case is $0.08 to $0.12 by year end 2026, with a bull scenario of $0.15 to $0.20 if subscription revenue and institutional partnerships scale. The bear scenario is a retest of the June low near $0.03 if the Core Upgrade produces client departures.

    How does Pyth Network make money?

    Pyth generates revenue from Pyth Pro subscriptions ($2,500 to $10,000 per month), Core subscriptions ($500 per month from July 31, 2026), and per-transaction fees from Entropy and Express Relay. Revenue flows into the Pyth Reserve, which uses it to buy PYTH on the open market monthly.

    When is the next Pyth token unlock?

    The next major PYTH unlock is May 19, 2027, for approximately 2.13 billion tokens, matching the size of the May 2026 unlock. Smaller monthly unlocks continue through the vesting schedule. Traders should mark the May date as the next scheduled supply event.

    Is Pyth Network on Solana?

    Pyth is built on its own high-throughput app-chain called Pythnet, but the network was incubated on Solana and PYTH is a Solana SPL token. Pyth publishes prices to more than 100 destination chains, including Ethereum, Arbitrum, Base, Aptos, Sui, and Sei, via Wormhole cross-chain messaging.

    The honest take

    PYTH is one of the few crypto tokens with a genuinely legible revenue path in the second half of 2026. The Core Upgrade on July 31 is a real business event with a real number attached. Either the subscription flips on smoothly, revenue starts compounding, and buybacks quietly turn PYTH into a scarcity story, or it does not.

    We are constructive but calibrated. Base case: PYTH grinds to $0.08 to $0.12 by year end as the market waits for two quarters of subscription revenue. Bull case: a big publisher signs, revenue surprises to the upside, and $0.20 is on the table. Bear case: the May unlock overhang, plus Chainlink’s incumbent grip, plus any subscription friction drags PYTH back to $0.03 to $0.04.

    The setup rewards patience and position sizing. This is not a moonshot memecoin. It is an infrastructure bet that will be revalued on cash flow, not vibes.

    Disclaimer: This article is for informational and educational purposes only and should not be construed as financial, investment, or trading advice. Cryptocurrency markets are highly volatile, and past performance does not guarantee future results. The price predictions and analyses presented here are based on AI models, technical indicators, and available data at the time of writing, they are not guarantees. Always conduct your own research (DYOR) and consult with a qualified financial advisor before making any investment decisions. Pump Parade and its authors do not assume liability for financial losses incurred based on information provided in this article.
    Sui (SUI) Price Prediction 2026: Can SUI Reclaim $1?

    Sui (SUI) is trading at $0.75 as of writing, up 7% over the past week but still down 85% from its January 2025 all-time high of $5.35. The move looks small in dollar terms and big in psychology: SUI has spent most of 2026 pinned between a $0.70 floor and a $0.95 ceiling, and traders are lined up on both sides waiting for a resolution.

    The question people keep asking (and typing into Google) is simple. Can SUI reclaim $1? Our Sui price prediction 2026 lays out the bear, base, and bull cases with real catalysts, real numbers, and none of the moon-math you get from the aggregator sites.

    Here is what changed since our June take on SUI and the CME futures listing: Grayscale and Canary Capital both have live spot SUI ETFs, DeFi TVL on Sui has held above $2.6 billion, and the network is still shipping (Walrus mainnet, Mysticeti V2, SuiNS). Yet the token has gone nowhere. That gap between fundamentals and price is exactly where opportunity, and risk, lives.

    Key Takeaways

    • SUI trades at $0.75, up 7% in the past 7 days, but down 5% over 30 days and 85% off its all-time high.
    • Base case for 2026: SUI reclaims the $0.95 to $1.30 zone if Grayscale GSUI inflows accelerate and DeFi TVL grows past $3.5B.
    • Bull case: a $2.00 to $2.50 revisit is on the table only if the broader alt-L1 basket turns and SUI captures gaming or stablecoin market share.
    • Bear case: a break below $0.70 opens $0.55 as the next real support, especially if 2026 unlocks meet weak demand.
    • The real catalysts: ETF flows, Walrus adoption, SuiPlay 0X1 handheld launch, and the native Ethereum bridge.
    • The real risks: supply overhang, competition from Solana and Aptos, and the alt-L1 attention war.
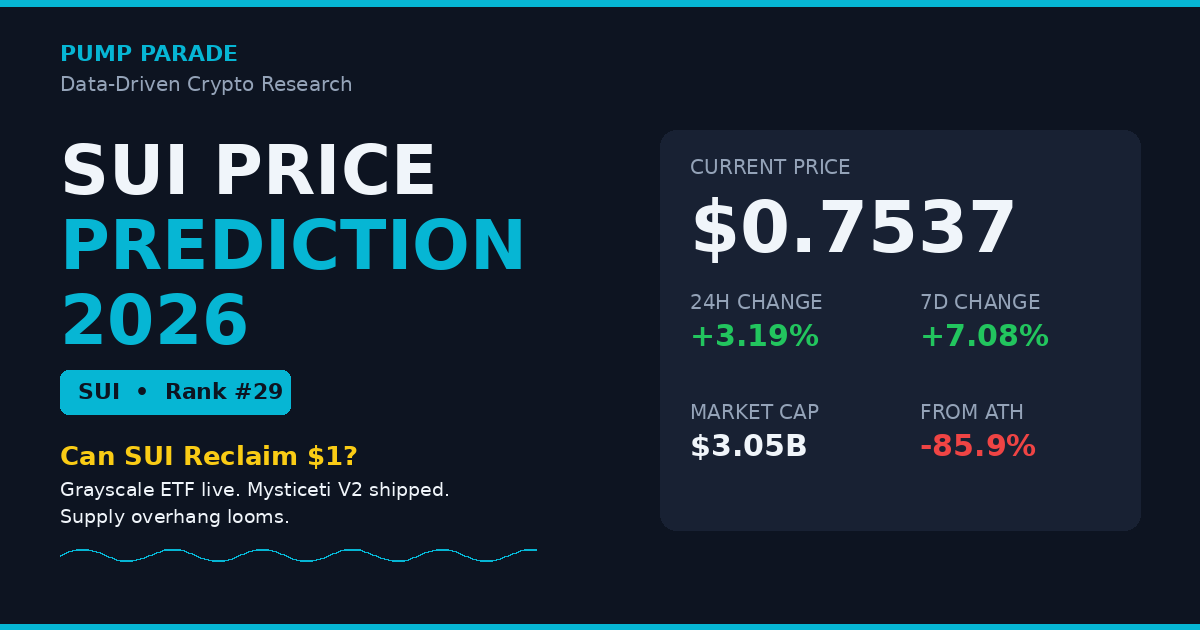
    Sui (SUI) price prediction 2026 hero graphic, current price $0.75, Grayscale ETF and Mysticeti V2 catalysts

    Where Sui Stands Today: Price, Volume, and Position

    Before we get into what SUI could do, we need to be honest about where it is. The snapshot below is pulled from CoinGecko at time of writing.

    Metric Value
    Price (USD) $0.7537
    24h change +3.2%
    7d change +7.1%
    30d change -5.3%
    Market cap $3.05B
    24h volume $276M
    Rank #29
    Circulating supply 4.05B SUI
    Max supply 10B SUI
    All-time high $5.35 (Jan 4, 2025)
    % from ATH -85.9%

    Two things jump out. First, SUI has round-tripped an entire cycle in 18 months. A token that was ranked in the top 10 by market cap in early 2025 is now knocking around at rank 29. Second, only 40% of the max supply is circulating, which is the single most important number for anyone trying to model where price goes next.

    Why Is Sui Coiling Below $1 Right Now?

    The short answer: institutional demand showed up, retail demand did not, and supply kept unlocking.

    The Grayscale GSUI staking ETF launched on NYSE Arca in early 2026, and Canary Capital debuted the first US spot SUI ETF on Nasdaq in February. On paper, that is a template that worked well for BTC and ETH. In practice, alt-L1 ETFs have opened at a fraction of the flows their sponsors projected. GSUI is a real product with a real 7% staking yield attached, but it is not (yet) moving price on its own.

    Meanwhile, roughly 152M SUI unlocks per month through 2026 from the community reserve, staking subsidy, and early-contributor tranches. At $0.75 that is over $110M of sell pressure a month competing with maybe $50M to $80M of ETF and organic accumulation. The math on that is the flat chart you see today.

    The technicals confirm the range. SUI is compressing between the $0.70 to $0.72 demand zone (defended six times since March) and the $0.90 to $0.95 supply zone (rejected four times). Volatility is at multi-quarter lows. Coiling patterns like this resolve, and when they do they resolve fast. The direction is what matters, and that is what this article is really about.

    The Bull Case for SUI in 2026

    1. Institutional on-ramps are actually live

    The Sui Foundation set out to make SUI an institutional-friendly asset in 2025 and mostly delivered in 2026. CME SUI futures are trading. Grayscale and Canary Capital have spot ETFs. The Grayscale GSUI product includes native staking, which is a first for a US spot L1 ETF outside of ETH. If GSUI net inflows compound at even a modest $30M to $50M per month by Q4, that alone can absorb 30-50% of monthly unlock pressure. That is the flip switch for price.

    2. Walrus and Mysticeti are shipping tech, not slideware

    Sui's Mysticeti V2 consensus is hitting sub-second finality with headline throughput around 297,000 TPS in benchmarks, and Walrus (Sui's decentralized storage layer) has moved out of testnet with a live WAL token. These are not vaporware milestones. They are the reason Sui gets picked over Aptos for AI and data-heavy workloads. Real developer traction on Walrus in H2 2026 is one of the few things that could re-rate the token independent of the wider crypto tape.

    3. DeFi TVL and stablecoin flow are quietly rebuilding

    Sui DeFi TVL has held above $2.6B all year, with Suilend, Cetus, and NAVI Protocol as the anchors. USDC on Sui crossed $700M in mid-2026 and Paga Group's $11B Nigerian fintech integration for USDsui payments points at emerging-market rails as a real use case. This is the kind of usage that survives bear markets. If it compounds, price follows on lag.

    The Bear Case: What Could Sink SUI in 2026?

    1. The supply cliff is real

    Only 40% of SUI is circulating. Between mid-2026 and early 2027, another ~1.8B tokens unlock across community reserves, staking subsidies, and contributor allocations. If demand does not scale to match, that is roughly $1.3B in cumulative sell pressure at current prices. Every alt-L1 that has failed to hold ATH support has done so at least partly because of this dynamic. Sui is not immune.

    2. The alt-L1 attention war is brutal

    Solana has the retail brand, Base has the Coinbase distribution moat, Hyperliquid has the trading mind-share, and Aptos is fighting for the same Move-language developer pool. Sui is competitive on speed and cost, but attention is a zero-sum game and Sui is not obviously winning it. For a data-heavy comparison to a direct Move-language competitor, our Aptos price prediction for 2026 lays out how tight this race actually is.

    3. ETF flows have underwhelmed

    Standard Chartered projected several billion dollars of first-year inflows across alt-L1 ETFs. Reality is closer to a few hundred million so far. If GSUI cannot get to a real cadence of net inflows, the institutional thesis weakens and the token gets stuck as a beta trade on ETH and SOL. That is a $0.50 to $0.70 world, not a $1.50 world.

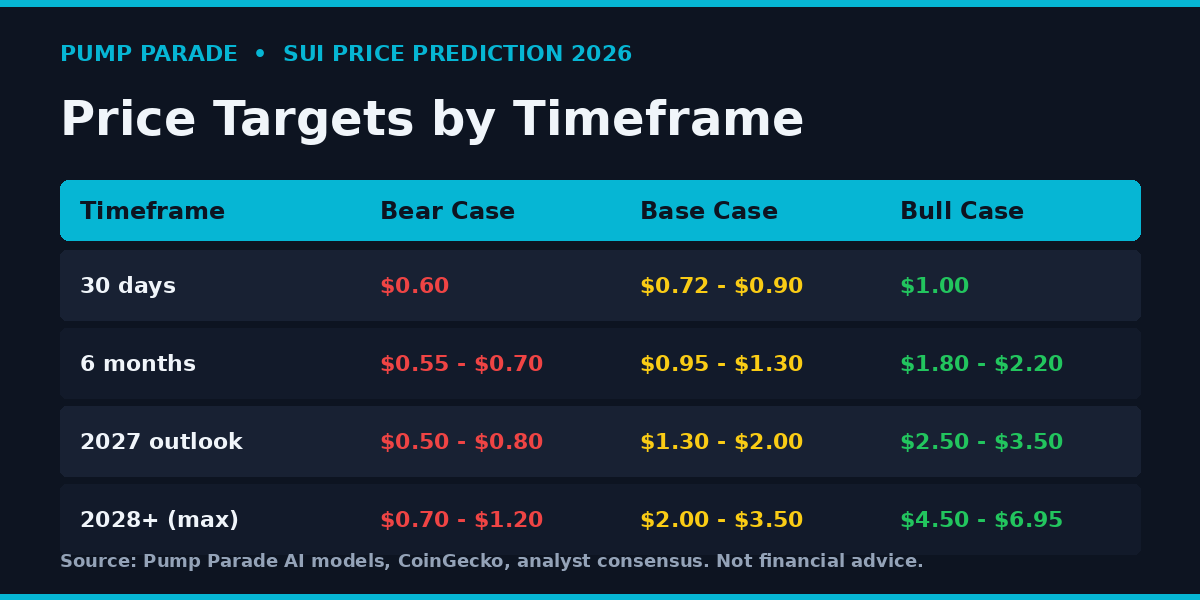
    Sui Price Prediction 2026: Targets by Timeframe

    Sui (SUI) price prediction 2026 targets table, bear $0.55, base $1.10, bull $2.20

    30-day outlook: range trade until proven otherwise

    Base case: $0.72 to $0.90. The compressing range is the setup and range trades tend to persist longer than anyone expects. Bear trigger: a daily close under $0.70 opens $0.60 quickly. Bull trigger: a daily close above $0.96 on 2x average volume flips the range and puts $1.20 in play. Watch spot ETF net-flow data from CoinCodex's SUI data page as the tell.

    6-month outlook (through January 2027): $0.85 to $1.60 base case

    Our base case assumes ETF inflows normalize, Walrus adoption grows meaningfully, and macro liquidity stays neutral. Under those conditions, SUI settling in the $1.10 to $1.30 range by early 2027 is a reasonable expectation. Bull case: $1.80 to $2.20 on a full risk-on turn plus a SuiPlay handheld launch that captures gamer attention. Bear case: $0.55 to $0.70 if unlocks meet a flat tape and ETF flows stall.

    Long-term (2027-2028): a wide fan

    This is where analyst consensus splits hardest. Changelly, CoinCodex, and Coinpedia cluster around a $1.50 to $4.50 range for 2027, with more bullish outliers like 99Bitcoins projecting $6.95 as an average. The honest read: at max dilution of 10B tokens, SUI would need a $10B market cap to trade at $1, a $30B market cap to trade at $3, and a $50B+ market cap to challenge its ATH. Those are non-trivial numbers. Achievable, but not free.

    How Does Sui Compare to Solana?

    Sui is not trying to be Solana, but comparisons are inevitable because both are high-throughput L1s with retail user experience as a first-class concern.

    Metric Sui (SUI) Solana (SOL)
    Consensus Mysticeti V2 (DAG-based) Tower BFT + PoH
    Finality ~400ms ~12s (slot ~400ms)
    Peak throughput (benchmarked) ~297K TPS ~65K TPS (real), 1M+ target with Firedancer
    Programming language Move (Sui variant) Rust
    Market cap $3.05B $45.2B
    DeFi TVL ~$2.6B ~$9.4B
    Spot ETF status Live (Grayscale, Canary) Live (multiple issuers)
    % from ATH -85.9% -72.4%

    Translation: SUI is technically competitive but a fraction of the size, with a bigger drawdown to work through. That is what the market is currently pricing in.

    What Would Change Our View

    Three specific triggers would move us from base case to something more constructive (or destructive):

    Bullish trigger: GSUI net inflows sustain above $50M/month for two consecutive months, AND Walrus daily active storage users cross 100K. That combination breaks the range on real demand.

    Neutral-to-bullish trigger: A meaningful weekly close above $1.00 with expanding volume flips the psychological ceiling and opens the $1.20 to $1.40 zone quickly. Round numbers matter more than they should.

    Bearish trigger: A weekly close under $0.68 with a break in DeFi TVL below $2.2B. That would signal the ecosystem is losing usage right as supply pressure peaks, and it puts $0.55 or lower on the table.

    Frequently Asked Questions

    Is Sui a good investment in 2026?

    Sui is a higher-risk, higher-beta position on the alt-L1 category. If you believe institutional ETF flows will broaden past BTC and ETH and that Move-based L1s can carve out share in gaming and storage, it is worth watching. If you doubt those catalysts, Sui likely stays range-bound. This is analysis, not advice.

    Will SUI reach $1 by year end 2026?

    Reclaiming $1 requires SUI to break the $0.95 supply zone on real volume and hold it. That is achievable in our base case, especially if ETF inflows and DeFi TVL both improve into Q4. A reasonable probability, not a certainty. Watch weekly closes above $0.96.

    What will SUI be worth in 2027?

    Analyst consensus for 2027 clusters between $1.50 and $4.50, with outliers as high as $6.95. Our own base case sits in the $1.30 to $2.00 range if unlock supply is absorbed and the alt-L1 basket sees a healthy risk-on turn. Bull case runs to $2.50 or higher.

    Why is Sui down 85% from its all-time high?

    Three reasons: aggressive token unlocks (only 40% of max supply is circulating), a broader alt-L1 rotation into ETH and SOL, and softer-than-expected ETF flows relative to the launch hype. None of those are terminal, but together they explain the drawdown.

    Is Sui better than Solana?

    Sui has cleaner finality and a modern object-based state model. Solana has network effects, developer mind-share, and roughly 15x the market cap. Better is the wrong frame. Sui is a competitive alt-L1, not a Solana replacement. Owning both hedges the bet.

    What is the SUI token used for?

    SUI pays gas fees on the Sui network, secures the chain via delegated proof-of-stake (yielding roughly 3-4% base and up to 7% via ETF staking wrappers), and grants governance rights. It is also increasingly used as collateral inside Sui-native DeFi protocols like Suilend and Scallop.

    The Honest Take

    Sui is a good chain trading at a bad chart. That is the whole story in one sentence. The tech works, the ETFs are live, the DeFi ecosystem has real usage, and none of it is moving price because the supply schedule is doing exactly what supply schedules do. This is a setup where patience gets rewarded or punished cleanly. If you like Sui at $0.75, you should like it more at $0.60. If you cannot articulate why unlocks stop mattering by mid-2027, you probably do not have a thesis.

    Our base case is a slow grind higher into the $1.00 to $1.30 zone by early 2027, with meaningful two-way risk. That is not exciting. It is honest. For context on how a bigger L1 with stronger flows is trading right now, our Ethereum price prediction for 2026 covers the demand side of the equation, and our Hyperliquid price prediction shows what happens when an alt actually captures narrative in this tape.

    For ongoing on-chain metrics and real-time SUI data, the CoinMarketCap SUI page is a solid free reference.

    Disclaimer: This article is for informational and educational purposes only and should not be construed as financial, investment, or trading advice. Cryptocurrency markets are highly volatile, and past performance does not guarantee future results. The price predictions and analyses presented here are based on AI models, technical indicators, and available data at the time of writing, they are not guarantees. Always conduct your own research (DYOR) and consult with a qualified financial advisor before making any investment decisions. Pump Parade and its authors do not assume liability for financial losses incurred based on information provided in this article.
    Backpack Wallet Review 2026: Fees, Features & Verdict

    0

    Backpack started as a scrappy wallet from ex-FTX engineers and quietly turned into one of the most interesting products in crypto. A self-custody wallet, an on-chain-friendly exchange, a perps venue, and a mini app store all live inside one interface. The question in 2026 is not whether Backpack is credible. It is whether it deserves to replace Phantom on your desktop and your phone.

    This review breaks down exactly what Backpack does well, where it still lags, what it costs, and who should actually switch. Fair warning: I have used Backpack for over a year across Solana, Ethereum, and Sui, and I run some perps positions on the exchange side. So this is a real review, not a marketing pass.

    TL;DR: Backpack Wallet Verdict

    Rating: 4.5 / 5. Backpack is the best all-in-one Solana wallet in 2026. If you live inside the Solana ecosystem, trade perps, and want a single app that handles self-custody, cross-chain swaps, and a proper exchange, this is now the default. If you never leave EVM and rarely touch Solana, Rabby or MetaMask still make more sense.

    Best for: Active Solana traders, perps users, xNFT collectors, and anyone tired of stitching together Phantom plus a centralized exchange plus a bridge.

    Not for: EVM-only DeFi power users, US residents (perps are restricted), and anyone who needs deep Bitcoin-native or Cosmos support.

    Visit Backpack Wallet

    What Is Backpack?

    Backpack is a self-custody crypto wallet and companion exchange built by Armani Ferrante and Tristan Yver, engineers who worked on Anchor and Serum before FTX collapsed. They rebuilt the project from scratch and turned it into a full crypto stack: wallet on one side, spot and perps exchange on the other, with the same login connecting both.

    By mid-2026, the Backpack ecosystem has crossed 100,000 monthly active users and the exchange has processed more than $400 billion in cumulative trading volume since launch. Backpack Futures trades roughly $100 million to $2 billion per day depending on market conditions and carries a medium (8) trust score on CoinGecko. That puts it firmly in the mid-tier of credible venues, well above pop-up perps DEXs and inside the same conversation as Bybit-lite competitors.

    Backpack wallet interface on desktop and mobile showing multi-chain portfolio
    Backpack unifies self-custody across Solana, Ethereum, Sui, and eleven other chains in a single interface.

    Supported Chains and Networks

    This is where Backpack quietly beats Phantom. It ships native support for a serious list of chains without asking you to install add-ons or import extra wallets. As of 2026, Backpack supports:

    • Solana (primary focus, fastest UX)
    • Ethereum mainnet plus Base, Arbitrum, Optimism, Polygon, BNB Chain
    • Sui and Aptos (Move-based chains)
    • Monad, Sei, Berachain, HyperEVM, Plasma (newer L1s and L2s)

    That is 14 networks under one seed phrase. For comparison, Phantom covers Solana, Ethereum, Base, Polygon, and Bitcoin natively. Backpack goes wider on Move chains and next-gen L1s, which matters if you farm points campaigns or trade on newer venues.

    Features Deep Dive

    1. Native Exchange Integration

    The killer feature is not a wallet feature at all. It is the fact that your Backpack wallet is also your Backpack Exchange account. One click moves funds between self-custody and the order book without a KYC-then-deposit dance every time. You can trade spot, perps up to 50x, and earn yield on collateral without leaving the app.

    This collapses a workflow that normally requires Phantom plus Binance plus a bridge into a single interface. For active traders that is genuinely valuable, not just a marketing bullet.

    2. xNFTs and In-Wallet Apps

    Backpack pioneered xNFTs, executable NFTs that behave like installable mini apps inside the wallet. Developers publish trading terminals, portfolio trackers, and DeFi UIs as xNFTs that users install with explicit permissions. Because the app runs inside Backpack instead of on a random domain, phishing sites cannot mimic the interface, and users grant permissions per-app rather than per-website.

    This is a real security upgrade. The dominant crypto hack vector in 2025 and 2026 has been signature phishing on lookalike sites. xNFTs neutralize a good chunk of that surface.

    3. Cross-Chain Swaps and Bridging

    Backpack bakes in bridge routing across all supported networks. There is zero wallet-level markup on swaps or bridges. You pay only the underlying network gas and whatever the bridge protocol charges. That is a meaningful difference from wallets that add a 0.5% to 0.85% “wallet fee” on top of every swap.

    4. Native Staking

    Stake SOL, ETH liquid staking tokens, and select other assets directly from the wallet. APY is displayed in-app so you can compare validators or LSTs before locking. It is not as deep as a dedicated staking dashboard, but it is fine for set-and-forget positions.

    5. Hardware Wallet Support

    Backpack pairs with Ledger and other hardware devices for cold storage. You can hold high-value positions on a hardware key and still use the Backpack UI to sign transactions across chains. This closes the security gap that used to force serious users toward MetaMask by default.

    6. Mad Lads and NFT Handling

    Backpack was built by the team behind Mad Lads, one of the highest-conviction Solana NFT collections (about 2.38M SOL in lifetime volume). Unsurprisingly, NFT display and management inside Backpack is genuinely good. Collections load fast, floor prices show in the sidebar, and you can lock specific NFTs to prevent accidental listing or transfer.

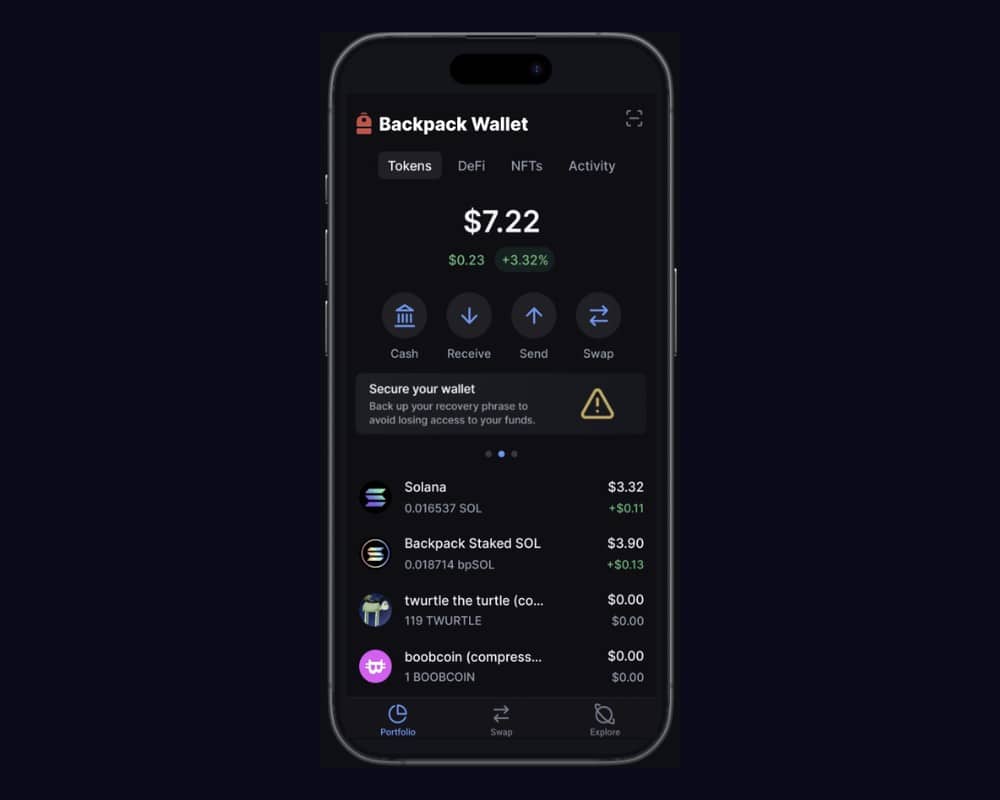
    Backpack wallet mobile app showing portfolio and Solana assets
    The Backpack mobile app in production. Clean type, real-time balances, and one-tap swap to Backpack Exchange.

    Backpack Fees Breakdown

    Backpack separates its fee stack into two buckets: wallet and exchange. Here is what you actually pay in 2026.

    Wallet Fees

    • Base wallet fee: $0. Backpack does not charge you to hold or send crypto.
    • Solana transaction cost: typically under $0.01 per transaction (network gas only).
    • Swap markup: 0%. You pay only the DEX or aggregator quote plus network gas.
    • Bridge markup: 0% wallet fee. Bridge protocol fees and gas apply.
    • Staking: No wallet fee. Standard validator commissions apply (typically 5% to 10% of rewards).

    Exchange Fees

    • Spot maker: 0.08%
    • Spot taker: 0.10%
    • Perp maker: 0.02% (competitive with Bybit and Binance perps)
    • Perp taker: 0.06%
    • Deposit: free from your own Backpack wallet
    • Withdrawal: network gas only for on-chain withdrawals

    The perps rates are the standout number. 0.02% maker and 0.06% taker undercuts most centralized venues and matches the leaders. If you run size on perps, that fee compression compounds fast.

    Comparison: Backpack vs Phantom vs MetaMask

    Feature Backpack Phantom MetaMask
    Primary chain Solana (multi-chain) Solana (multi-chain) Ethereum / EVM
    Chains supported 14+ 5 All EVM chains
    Exchange built in Yes (spot + perps) No No
    Swap markup 0% 0.85% 0.875%
    Hardware wallet Yes Yes Yes
    xNFT apps Yes No No (Snaps instead)
    NFT locking Yes Partial No
    Mobile app iOS + Android iOS + Android iOS + Android
    Wallet fee $0 $0 base $0 base
    Feature and fee comparison, mid-2026 data.

    Security and Trust

    Backpack has a few advantages here that are hard to fake:

    • Self-custodial by design. Private keys are stored locally or on hardware. The team cannot recover your seed phrase and cannot freeze your wallet.
    • Real-time scam protection. Backpack maintains an in-app risk engine that flags known malicious contracts and drainer signatures before you sign.
    • xNFT sandboxing. Third-party apps run in a permissioned sandbox, not on arbitrary domains, which reduces phishing exposure.
    • NFT collection lock. One tap freezes an NFT so it cannot be listed or transferred, useful for high-value assets that live in a hot wallet.
    • Exchange trust score. CoinGecko rates the exchange at medium (8), and reserves are audited on a rolling basis.

    The one honest caveat: Backpack Exchange is registered in the British Virgin Islands, and Backpack does not currently service US customers for its perpetual futures product. If you are a US-based trader, you can use the wallet, but not the perps side.

    User Experience

    The UX is where Backpack has quietly overtaken most competitors. The desktop extension and mobile app share the same visual language: dark theme, generous whitespace, real-time balance updates, and a persistent switcher that lets you flip between the wallet and Backpack Exchange with one click.

    Onboarding is fast. New users can create a wallet, back up a seed phrase, and buy their first SOL in under three minutes. Advanced users get a token search that actually works, a transaction simulator that previews signature impact, and per-app permissions that read like an actual permissions system rather than a scary popup.

    The mobile app is now feature-parity with the desktop extension, which was not true a year ago. Cross-chain swaps, perps trading, and xNFT installation all work on iOS and Android without falling back to a webview.

    Pros and Cons

    Pros

    • Best-in-class Solana experience with real cross-chain support (14+ networks)
    • Native exchange integration means one interface for self-custody and active trading
    • Zero wallet markup on swaps and bridges, so you keep the alpha you generate
    • Competitive perps fees at 0.02% maker / 0.06% taker
    • xNFT security model reduces phishing risk in a real, structural way
    • Beautiful UX across desktop and mobile with true feature parity
    • Hardware wallet support and per-collection NFT locking for cold-storage users

    Cons

    • No US access to the perps exchange (BVI-registered, geo-restricted)
    • Bitcoin support is limited compared to wallets built around BTC first
    • Ecosystem still smaller than Phantom, so some Solana dapps default to Phantom flows
    • xNFT app store is still thin. The pipeline is real, the current shelf is not
    • If you never touch Solana, you are paying an opportunity cost by not using Rabby or MetaMask for EVM-native flows

    Who Should Use Backpack in 2026?

    Active Solana traders. If you spend real time on Raydium, Jupiter, or Meteora, Backpack is now the sharpest tool. The zero-markup swaps alone pay for the switch.

    Perps traders outside the US. Backpack Futures at 0.02% / 0.06% is one of the cheapest venues to run size. Compared to Kraken and Bitget, Backpack’s edge is that your collateral stays with you until you actively route it into the exchange.

    Multi-chain farmers and points campaign chasers. Native support for Monad, Sei, HyperEVM, Berachain, and Sui in a single wallet is genuinely rare. If you rotate across new L1s and L2s, this is a category leader.

    NFT collectors, especially on Solana. Between the Mad Lads pedigree and the collection lock feature, Backpack treats NFTs like a serious asset class, not an afterthought.

    Skip Backpack if: you never leave EVM, you need deep Bitcoin native staking or Ordinals workflows, or you live in the US and specifically want perps.

    Final Verdict

    Backpack in 2026 has done something rare: it has become the default answer for a specific category (multi-chain Solana-first users who also trade), while quietly being credible for everyone else. The wallet is polished, the exchange is real, and the fee stack is aggressive in favor of the user.

    If you have been running Phantom plus a centralized exchange plus a bridge, replacing that stack with Backpack removes real friction and real fees. If you are EVM-only, stay with Rabby or MetaMask. Everyone in between should install it and see.

    Rating: 4.5 / 5.

    Try Backpack Wallet or explore Backpack Exchange.

    FAQ

    Is Backpack Wallet safe?

    Yes. Backpack is a self-custody wallet, meaning your private keys never leave your device (or your hardware wallet if you connect one). It also includes real-time scam detection and an xNFT sandbox that reduces phishing risk. As always in crypto, your seed phrase is the single point of failure, so back it up offline.

    Does Backpack charge fees?

    The wallet itself is free with zero markup on swaps and bridges. You pay only network gas. The Backpack Exchange charges 0.08% maker and 0.10% taker on spot, and 0.02% maker and 0.06% taker on perpetual futures.

    Can US users use Backpack?

    US users can use the Backpack wallet freely for self-custody, swaps, staking, and NFT management. However, Backpack Exchange (spot and perps) is not available to US residents because the exchange is registered in the British Virgin Islands and geo-restricts US IPs.

    What is an xNFT?

    An xNFT is an executable NFT, essentially a mini application that installs directly inside your Backpack wallet. Instead of visiting a website and connecting your wallet, you install the app once and it runs in a permissioned sandbox. This design was pioneered by Backpack to reduce phishing risk and give users granular per-app permissions.

    Backpack vs Phantom: which is better in 2026?

    For active Solana traders who also want perps and cross-chain support, Backpack is now the stronger choice. Phantom is still excellent for casual Solana users and has a slight edge in dapp compatibility because it has been around longer. If you want everything (wallet plus exchange plus perps) in one interface, choose Backpack. If you want the simplest possible Solana wallet, Phantom is still a fine default.

    Does Backpack support Bitcoin?

    Backpack has limited Bitcoin support compared to wallets built around BTC. If Bitcoin is your primary chain, dedicated wallets like Xverse or Sparrow are stronger. For a small BTC allocation alongside Solana and EVM assets, Backpack is workable but not category-leading.

    Polygon (POL) Price Prediction 2026: Can POL Hit $0.20?

    Polygon’s POL trades at $0.084 today, up nearly 11% over the past week but still 93% below its 2024 all-time high. The disconnect is real: the network just processed $80 billion in monthly stablecoin volume, burned 107 million tokens this year, and locked up 3.6 billion POL in staking. Yet the token sits within touching distance of its July 1 all-time low near $0.068.

    So which side wins? This Polygon POL price prediction 2026 breaks down what would push POL toward $0.20 by year-end, what could keep it stuck under $0.10, and what a serious analyst actually needs to watch. Bear, base, and bull cases inside, with real on-chain data and cited targets from Cryptopolitan, Coinbase, and Changelly.

    Key Takeaways

    • POL trades near $0.084, up 11% in 7 days but down 93% from its March 2024 ATH of $1.29.
    • Bull case: $0.20 to $0.28 if AggLayer v0.3 lands, stablecoin flywheel accelerates, and POL burns keep outpacing emissions.
    • Base case: $0.10 to $0.14, a modest re-rating as the market waits for fee capture and validator economics to become visible.
    • Bear case: $0.06 to $0.08, if L2 competition intensifies and network usage fails to translate into token value.
    • Watch the daily burn rate. Polygon now burns roughly 1 million POL per day, projecting a 3.5% annual supply reduction if the pace holds.
    • Key catalysts: AggLayer v0.3 rollout, Gigagas roadmap execution, sPOL liquid staking adoption, Visa and Modern Treasury payment partnerships.
    Polygon (POL) price prediction 2026 hero graphic, current price $0.084 with AggLayer catalyst hook

    Where Polygon (POL) Stands Today

    Let’s start with the numbers. POL currently trades at $0.0838 with a market capitalization of $895 million, ranking 71 on CoinGecko. Circulating supply sits at 10.68 billion tokens against an effectively uncapped max supply, though annual emissions have been offset by aggressive burns since the AggLayer upgrade path began.

    Here’s the snapshot every analyst starts with:

    Metric Value
    Current Price $0.0838
    24h Change +2.09%
    7d Change +10.97%
    30d Change +11.49%
    Market Cap $895 million
    24h Volume $55.3 million
    Rank #71
    All-Time High $1.29 (Mar 2024)
    % From ATH -93.5%
    All-Time Low $0.068 (Jul 1, 2026)

    Two things stand out. First, POL just printed a fresh all-time low two weeks ago, then bounced roughly 23%. Second, that bounce is not showing up on major volume, which suggests accumulation from believers rather than a full narrative flip. Both matter for how you read the next 90 days.

    Why Is POL Range-Bound Right Now?

    The Polygon story has a strange split between usage and price. On the network side, things look excellent. Polygon processed roughly $80 billion in stablecoin transaction volume during May 2026 across 198 million transactions, topping Solana and BNB Chain that month, according to network data cited by CoinMarketCap. Cumulative stablecoin volume on the network has crossed $2.4 trillion.

    On the token side, POL has been treated like it doesn’t exist. Sell-side liquidity from long-time MATIC holders who migrated but never wanted to hold has weighed on price for months. Add competition from Base, Arbitrum, and Solana for developer mindshare, and you get a token that keeps testing new lows even as the underlying network hits new highs.

    The question for the next six months is whether the flywheel Polygon Labs has been building, payments plus staking plus AggLayer routing, finally translates into fee capture that flows to token holders. If it does, the re-rating case gets loud. If it doesn’t, POL stays a network story with a poor token story.

    The Bull Case for Polygon POL

    1. AggLayer v0.3 as a Real Product Moment

    The AggLayer is Polygon’s cross-chain routing layer, and v0.3 targets unified liquidity across ecosystem chains with ZK-verified messaging. Once it lands and starts routing serious volume, POL becomes the fee asset and staking collateral for a network of networks, not a single L2. That’s the pivot bulls have been waiting on since the 2.0 rebrand.

    2. Deflationary Supply Dynamics

    Sandeep Nailwal, Polygon co-founder, has publicly confirmed that 107 million POL have been burned in 2026, exceeding tokens newly minted through staking rewards. The daily burn now runs around 1 million POL, projecting a roughly 3.5% annual supply contraction if the pace holds. For a token this beaten down, a shift from inflation to deflation is a real structural change, not just narrative.

    3. Institutional Payment Rails

    Visa integration, Modern Treasury partnerships, and the broader Open Money Stack pitch position Polygon as the settlement layer for regulated stablecoin payments. If even a fraction of the $80 billion monthly stablecoin volume starts producing fees that route back to POL stakers, the “network story, poor token story” critique dies.

    The Bear Case for Polygon POL

    1. L2 Fragmentation Is Real

    Ethereum’s own roadmap keeps making L1 cheaper, and Base plus Arbitrum have absorbed most of the DeFi liquidity that used to flow to Polygon PoS. If Polygon can’t defend its stablecoin niche against Solana and Tron, the growth story stalls.

    2. Emissions Overhang Persists

    Even with 107 million burned, POL still emits tokens for validator rewards. Analysts covering the token, including those at AMBCrypto, note that until the market can price the net supply change with confidence, POL trades like an inflationary asset regardless of the burn headline. Watch the net supply metric monthly, not just the burn.

    3. Weak Correlation to Network Usage

    The base bear case is not that Polygon fails. It’s that Polygon succeeds and POL still doesn’t capture the value. If AggLayer fees route to a fee router that pays validators without materially reducing float or driving demand, the token can stay pinned. Investors should ask: does POL win when Polygon wins, or only when the market cap catches up to a specific fee-capture story?

    Polygon POL Price Prediction 2026: Targets by Timeframe

    Polygon (POL) price prediction 2026 targets table, bear $0.06, base $0.14, bull $0.28

    Here is our timeframe view, cross-referenced against forecasts from Cryptopolitan, Coinbase, and Changelly. The base case assumes no dramatic macro shift and a partial AggLayer product win. Bull requires the flywheel actually turning. Bear requires L2 competition winning and burn narrative failing to hold.

    Timeframe Bear Base Bull
    30 days $0.070 $0.095 $0.12
    6 months $0.065 $0.14 $0.20
    End of 2026 $0.06 $0.17 $0.28

    Short-Term Outlook (30 Days)

    POL cleared $0.075 support and the 20-day EMA over the past week, which historically opens the door to $0.09 and $0.10 as first resistance zones. A reclaim of $0.10 with volume expansion, ideally above $80 million daily, would confirm a trend change. Failing to hold $0.075 puts $0.068 back in play.

    Medium-Term (6 Months)

    The six-month window is where AggLayer v0.3 execution and the payments narrative do their work. Base case has POL working toward $0.14 as fee capture becomes visible and the burn maintains a 1 million per day pace. The bull case at $0.20 requires the flywheel to actually turn, meaning stablecoin volume, staking growth, and AggLayer routing all compounding.

    Long-Term (End of 2026 and Into 2027)

    Cryptopolitan’s model targets a $0.28 maximum for 2026 with a $0.22 average, which lines up with our bull scenario. Coinbase’s more conservative approach sits at $0.08, effectively pricing zero re-rating. Changelly hovers near $0.09. Standard Chartered has not published a POL target, but their broader L2 thesis suggests upside surprise if unified liquidity across chains becomes real. The honest read: the range of credible outcomes for December 2026 sits between $0.06 and $0.30.

    How Does Polygon Compare to Arbitrum?

    The closest peer for POL is Arbitrum, both are Ethereum-aligned scaling stories with big brand recognition, both have suffered token underperformance despite strong usage, and both face the “network wins, token doesn’t” critique.

    Metric Polygon (POL) Arbitrum (ARB)
    Price $0.084 $0.19
    Market Cap $895M $960M
    Token Utility Gas, staking, AggLayer collateral Governance only
    Emissions Deflationary via burn Ongoing unlocks
    Stablecoin Volume $80B monthly $18B monthly
    Cross-chain Layer AggLayer Orbit stack
    Down From ATH -93.5% -91%

    POL’s edge is token utility. Gas, staking, and AggLayer collateral give POL three fee-capture pathways that ARB simply does not have. If unified liquidity actually forms, POL is the better relative bet from here, though ARB retains a stronger DeFi ecosystem today.

    What Would Change Our View?

    Three scenario triggers would force a rewrite of this thesis.

    First, if AggLayer v0.3 slips past Q4 2026 without a clear public timeline, the bull thesis has to be pushed out by six to nine months and base case drifts toward $0.10.

    Second, if net POL supply flips from deflationary back to inflationary for two consecutive months, the “structural change” argument dies and we’d cut the year-end target by 30%.

    Third, if a Tier-1 exchange launches a POL staking product with real yield tied to AggLayer fees, that would be an accelerant, not a required trigger, but it would raise the bull target toward $0.35.

    Frequently Asked Questions

    Will Polygon POL reach $0.20 in 2026?

    POL reaching $0.20 in 2026 is credible but not the base case. It requires AggLayer v0.3 to ship on time, the daily POL burn to keep outpacing emissions, and stablecoin fee capture to become visible on-chain. Cryptopolitan’s 2026 model targets $0.28 as an upper bound, so $0.20 sits below their max and represents a plausible bull scenario if catalysts stack.

    Is Polygon POL a good investment in 2026?

    Polygon has strong network fundamentals, $80 billion in monthly stablecoin volume and a deflationary supply trend, but the token has consistently lagged the network’s performance. Whether POL is a good investment depends on whether you believe upcoming catalysts like AggLayer v0.3 will finally translate usage into token value. Sizing should reflect the wide bear-to-bull range of roughly $0.06 to $0.28.

    What is the Polygon POL price prediction for 2026?

    Our year-end 2026 range is $0.06 in the bear case, $0.17 in the base case, and $0.28 in the bull case. Cryptopolitan projects a similar range with a $0.22 average, while Coinbase and Changelly sit closer to $0.08 to $0.09. The wide dispersion reflects real uncertainty about AggLayer execution and fee capture.

    Why did MATIC change to POL?

    MATIC was rebranded to POL as part of the Polygon 2.0 upgrade to enable multi-chain staking, AggLayer cross-chain routing, and unified value capture across Polygon’s expanding ecosystem. Token holders migrated at a 1-to-1 ratio, and POL now serves as gas, staking collateral, and the base asset for the AggLayer settlement layer.

    Can Polygon POL reach $1 again?

    POL revisiting $1 would require roughly a 12x from current prices and a full return of speculative capital plus proven fee capture at the AggLayer level. That’s a 2027 to 2028 story at the earliest, contingent on successful Polygon 2.0 execution and a broader crypto bull cycle. It’s on the table, but not the near-term thesis.

    What is the biggest risk to POL in 2026?

    The biggest risk is that Polygon keeps winning at the network layer while POL fails to capture value. If AggLayer fees route through mechanisms that don’t materially benefit stakers, or if L2 competition erodes the payments moat, POL can stay range-bound near recent lows even in a rising crypto market.

    The Honest Take

    Polygon is one of the few L2 stories where the network fundamentals genuinely justify a serious re-look. Eighty billion in monthly stablecoin volume is not a narrative, it’s a number, and it’s a number that beats Solana and BNB Chain. The burn dynamic is real. The AggLayer roadmap is credible.

    The catch is the same catch it’s always been: POL has to prove that Polygon’s success shows up on the token. The next 90 days will be the market’s first real look at whether AggLayer v0.3 delivers a mechanism that actually routes value back to holders. If it does, $0.20 is a floor, not a stretch. If it doesn’t, we’re back to arguing whether $0.10 is support or resistance.

    The setup that would flip us fully bullish: AggLayer v0.3 shipping in the second half of 2026, monthly net POL supply staying negative for three consecutive months, and stablecoin fee capture appearing in on-chain dashboards. That’s a specific, testable thesis. Watch for it, and let the data update your view instead of your priors.

    For traders and investors looking at the broader L2 landscape, our Arbitrum ARB price prediction and Stellar XLM price prediction cover the two closest peers on the L2 scaling and payments narratives.

    Disclaimer: This article is for informational and educational purposes only and should not be construed as financial, investment, or trading advice. Cryptocurrency markets are highly volatile, and past performance does not guarantee future results. The price predictions and analyses presented here are based on AI models, technical indicators, and available data at the time of writing, they are not guarantees. Always conduct your own research (DYOR) and consult with a qualified financial advisor before making any investment decisions. Pump Parade and its authors do not assume liability for financial losses incurred based on information provided in this article.
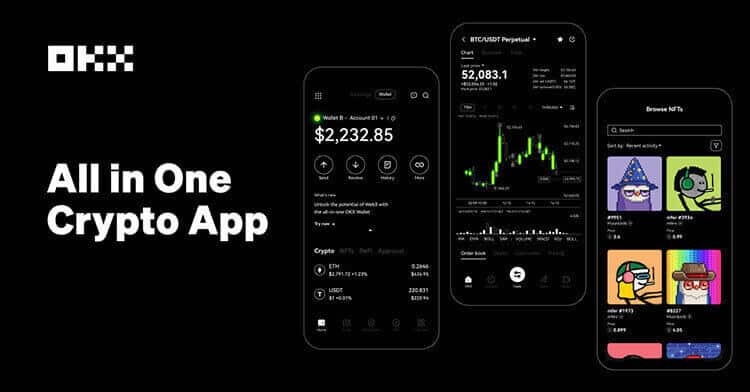
    XRP Price Prediction 2026: Can XRP Hit $3 by Year End?

    Any XRP price prediction 2026 has to start with the same disconnect: XRP trades at $1.08 today, down 70.5% from its July 2025 all-time high of $3.65 and stuck in a tight $1.00 to $1.13 range for most of July. Yet spot XRP ETFs have pulled in nearly $1.5 billion in cumulative inflows since November 2025, and the CLARITY Act, the most consequential US crypto bill in a decade, is on the Senate Legislative Calendar with a field hearing scheduled for July 17 in New York City.

    So which signal wins? The bearish price action, or the bullish regulatory and institutional setup? That is what this analysis tries to answer.

    We will cover where XRP stands today, why it is range-bound, the strongest bull and bear cases on the table, our targets by timeframe (bear, base, and bull), how XRP compares to Stellar, and the specific triggers that would flip the thesis in either direction.

    Key Takeaways

    • Current price: $1.08, market cap $67.3B, ranked #6, RSI at 45.37 (neutral).
    • Base case for end of 2026: $1.75, contingent on CLARITY Act passage before the August recess and sustained ETF inflows.
    • Bull case: $3.00 if CLARITY is signed, JPMorgan’s $4B to $8.4B ETF inflow projection materializes, and RLUSD stays anchored to the XRP Ledger.
    • Bear case: $0.90 if CLARITY stalls, whale activity keeps collapsing (large transactions dropped 97% this week), and RLUSD cannibalizes XRP’s bridge role.
    • Standard Chartered cut its 2026 target from $8 to $2.80 in February, the largest downgrade across its crypto coverage.
    • Key resistance: $1.117. Break that on volume and $1.21 opens up. Lose $1.00 and $0.90 is next.
    XRP (XRP) price prediction 2026 hero graphic, current price $1.08, CLARITY Act catalyst

    Where XRP Stands Today

    Before we get to targets, let’s look at the numbers. All data pulled from CoinGecko as of July 13, 2026.

    Metric Value
    Price $1.077
    24h change -1.47%
    7-day change -5.52%
    30-day change -5.68%
    Market cap $67.3B
    24h volume $842M
    Market cap rank #6
    All-time high $3.65 (July 18, 2025)
    % from ATH -70.5%
    Circulating supply 62.5B XRP

    Two data points stand out. First, XRP is holding its rank as the #6 asset by market cap despite being 70% off its high, which tells you the sell pressure has broadly matched the rest of the top 10 rather than being XRP-specific. Second, average daily volume of $842M against a $67B market cap is a turnover ratio of 1.25%, low even by large-cap crypto standards. Translation: conviction is thin on both sides. Neither bulls nor bears are pressing.

    Why is XRP range-bound right now?

    The short answer: the market is waiting on Washington. The longer answer has three parts.

    The CLARITY Act passed the House 294-134 on July 17, 2025, cleared the Senate Banking Committee 15-9 on May 14, 2026, and was placed on the Senate Legislative Calendar on June 1. A field hearing is set for July 17, 2026 in New York City, meant to iron out the House-Senate reconciliation ahead of the August 7 recess deadline. If the bill does not clear both chambers before then, momentum resets to September at earliest. Polymarket odds have the probability of the CLARITY Act being signed into law by end of 2026 at 46.5%. That is a coin flip, which is exactly why XRP is trading like a coin flip.

    Second, whale behavior turned sharply cautious this week. Transactions above $1 million on the XRP Ledger dropped from roughly 70 in the prior seven days to just two on July 13, per on-chain tracker data. That is a 97% collapse and mirrors the pattern seen ahead of past regulatory catalysts, when large holders park capital and wait rather than commit fresh flows.

    Third, spot ETF inflows have plateaued. The five spot XRP ETFs have accumulated $1.49 billion since November 2025, but weekly flows have flatlined at roughly $50M to $80M. JPMorgan modeled first-year inflows of $4B to $8.4B if CLARITY passes. Actual pace is running well below the low end of that range. That gap is what the market is trying to price in.

    What is the bull case for XRP in 2026?

    Three catalysts anchor the bullish thesis.

    1. CLARITY Act passage codifies XRP as a commodity

    If CLARITY is signed, XRP’s status as a digital commodity gets written into US law and CFTC jurisdiction becomes explicit. That unlocks pension funds, sovereign wealth funds, and large asset managers who currently cannot hold XRP under their fiduciary mandates. Standard Chartered’s Geoffrey Kendrick estimates that alone could add $4B to $8B in first-year institutional flows on top of ETF demand.

    2. Ripple’s global regulatory wins

    Ripple received full MiCA authorization in Luxembourg in Q2 2026, giving it a passport to operate across the European Economic Area under a unified regulatory framework. Deutsche Bank has integrated Ripple Payments rails, and SBI Holdings launched RLUSD in Japan in Q1 2026. Each of these is a real revenue channel, not a partnership press release. RLUSD’s market cap jumped from $132M to $1.56B year over year, with the majority of new supply issued on the XRP Ledger rather than Ethereum. That is meaningful because every RLUSD transaction on XRPL burns a small amount of XRP as a network fee.

    3. Spot ETF flows re-accelerate

    Five spot XRP ETFs are live in the US, from Canary Capital, Grayscale, Bitwise, 21Shares, and a fifth issuer. Cumulative inflows sit at $1.49B with net assets around $988M. If CLARITY passes, the model that worked for Bitcoin and Ethereum ETFs (regulatory clarity plus institutional distribution equals inflow acceleration) would likely apply here. JPMorgan’s $4B to $8.4B first-year projection is aggressive but not unprecedented compared to what BTC ETFs printed in year one.

    What could go wrong for XRP in 2026?

    Three risks weigh on the downside.

    1. RLUSD cannibalizes XRP’s core use case

    This is the argument The Motley Fool made in March, and it has not gotten less true since. RLUSD directly competes with XRP as the settlement asset for cross-border payments. A dollar-pegged stablecoin has no volatility risk, which is exactly what treasury teams and correspondent banks want. The more Ripple pushes RLUSD, the less bridge demand XRP captures. Ripple executives have publicly said RLUSD and XRP are complements, but the on-chain data is more ambiguous.

    2. Whale distribution has already begun

    Ripple sold escrow XRP historically at rates of $1B to $2B per month during expansion phases, and while distribution has been more measured recently, the 97% weekly collapse in $1M+ transactions is unusual. Combined with a 61% year-over-year price decline, it suggests large holders are hedging or exiting rather than accumulating at these levels.

    3. Technicals lean bearish

    XRP shows 28 bearish signals against just one bullish signal across the standard indicator suite. RSI at 45.37 is neutral but the 50-day moving average sits above spot at roughly $1.14, acting as resistance rather than support. A weekly close below $1.00, the round-number psychological floor, would open up $0.90 quickly and $0.75 as a secondary target.

    XRP Price Prediction 2026: Targets by Timeframe

    XRP (XRP) price prediction 2026 targets table, bear $0.90, base $1.75, bull $3.00

    Next 30 days

    Bear: $0.85. Base: $1.15. Bull: $1.45.

    The July 17 field hearing and the August 7 recess deadline are the two events that matter. If the House-Senate reconciliation looks productive, base case holds and a break above $1.117 opens $1.21 as the next target. If the hearing stalls or partisan lines harden, XRP loses $1.00 quickly and $0.85 is realistic. Bull case ($1.45) needs a surprise Senate vote before recess, which is possible but not the base assumption.

    6 months (end of 2026)

    Bear: $0.90. Base: $1.75. Bull: $3.00.

    Base case assumes CLARITY passage in Q4, moderate ETF flow acceleration to $150M+ per week, and continued RLUSD growth on XRPL. Bull case ($3.00) requires all three catalysts to fire cleanly and would still leave XRP 18% above Standard Chartered’s revised $2.80 target. Bear case assumes CLARITY punts to 2027, ETF flows keep decelerating, and RLUSD starts eating meaningfully into XRP payment volume.

    Long-term (2027-2028)

    Bear: $1.20. Base: $3.50. Bull: $7.00.

    Kendrick’s 2027 target is $7, 2028 is $12.60. Our base case is more conservative because RLUSD adoption is a real headwind that most bank models understate. Bull case aligns with Standard Chartered’s 2027 estimate and would require Ripple to successfully convert enterprise pipeline into recurring XRPL fee revenue, sustaining the token’s utility premium.

    How does XRP compare to Stellar (XLM)?

    XRP’s closest structural competitor is Stellar (XLM). Both target cross-border payments, both have foundation-controlled supply schedules, and both are chasing enterprise integrations.

    Metric XRP Stellar (XLM)
    Price $1.08 $0.184
    Market cap $67.3B $6.3B
    Rank #6 #17
    Native stablecoin RLUSD ($1.56B) USDC (native)
    Spot ETF (US) Live (5 issuers) Not filed
    Consensus mechanism XRPL Consensus Stellar Consensus Protocol
    Avg. tx fee ~$0.0002 ~$0.00001
    Enterprise anchor Ripple (SBI, Deutsche Bank) MoneyGram, Franklin Templeton

    XRP wins on institutional distribution (live ETFs, Ripple’s enterprise pipeline). Stellar wins on transaction economics and its Franklin Templeton money market fund tokenization deal. If you had to bet on one for pure payments volume, XRP has the bigger flywheel. But XLM has more room to grow relative to its market cap.

    What Would Change Our View

    Three specific triggers would move us off the base case.

    Upgrade trigger: A Senate floor vote scheduled for CLARITY before August 7 recess, plus a single week of $200M+ ETF inflows. Both would signal the institutional pipeline is opening. Base case moves toward bull case.

    Downgrade trigger: A weekly close below $1.00 combined with RLUSD supply on XRPL declining while Ethereum supply grows. That would confirm the RLUSD cannibalization thesis and mean XRP is losing its own stablecoin.

    Nuclear trigger: Ripple announcing a strategic sale of a large escrow tranche outside its normal $1B to $2B monthly cadence. That would be interpreted as loss of confidence in near-term price recovery and would likely take XRP to the $0.75 to $0.85 zone regardless of other catalysts.

    Frequently Asked Questions

    Will XRP reach $5 in 2026?

    Probably not. XRP trades at $1.08 and would need to gain 364% in less than six months to hit $5. Standard Chartered, the most bullish major bank on XRP, revised its 2026 target down to $2.80 in February. Our bull case is $3.00, contingent on CLARITY passage and ETF acceleration. $5 is a 2027 target if catalysts fire cleanly, not a 2026 target under current conditions.

    Is XRP a good investment in 2026?

    It depends on your thesis. If you believe CLARITY passes and institutional adoption accelerates, current prices offer favorable risk-reward with a base target of $1.75 (62% upside) and bull target of $3.00 (177% upside). If you believe RLUSD cannibalizes XRP’s utility, the setup looks less attractive. The honest read: XRP is a regulatory-catalyst trade right now, not a fundamentals story.

    Can XRP hit $3 by end of 2026?

    Yes, but it is our bull case rather than base case. A $3 print requires CLARITY passage before December, spot ETF inflows re-accelerating to $200M+ per week, and RLUSD growth on XRPL continuing to burn XRP fees at scale. All three need to happen. Base case for year-end 2026 is $1.75.

    Why is XRP not going up?

    Three reasons. Whale transactions dropped 97% this week, which removes large-buyer demand. ETF flows have plateaued at $50M to $80M per week, well below JPMorgan’s projected pace. And technical indicators show 28 bearish signals against one bullish, keeping momentum traders on the sidelines. The market is waiting for CLARITY resolution.

    When will XRP go up?

    The two nearest catalysts are the July 17 CLARITY Act field hearing in New York City and the August 7 Senate recess deadline. If Congress schedules a floor vote before recess, XRP has room to move toward $1.45 quickly. If reconciliation punts to September, expect continued range trading between $1.00 and $1.13 through Q3.

    Is XRP dead?

    No. XRP is ranked #6 by market cap at $67.3B, has five live spot ETFs, and Ripple posted its strongest quarterly enterprise revenue in Q2 2026 driven by RLUSD and MiCA authorization in Luxembourg. The token is in a drawdown, not a death spiral. Whether it recovers to prior highs is a different question, and depends on regulatory catalysts landing.

    The Honest Take

    XRP in July 2026 is a regulatory-catalyst trade wearing a fundamentals costume. The utility story (cross-border payments, XRPL as settlement layer) is real but partially undermined by RLUSD, Ripple’s own stablecoin, which is now the more capital-efficient tool for treasury use cases. The upside case does not depend on XRP outcompeting stablecoins for payments. It depends on Congress delivering regulatory clarity that unlocks institutional pools who have been sitting on the sidelines since 2020.

    Our base case for end of 2026 is $1.75, roughly 62% above current levels. That would be a good outcome for holders and reflects the middle path where CLARITY passes with some delay and ETF flows recover to a healthy but not runaway pace. The bull case at $3.00 is not implausible, but requires cleaner execution than Congress usually delivers. The bear case at $0.90 is what happens if Washington disappoints and RLUSD keeps taking share.

    The setup worth monitoring: a break above $1.117 on 3x average volume, ideally coinciding with a CLARITY Senate vote scheduling announcement. That combination has historically preceded XRP’s cleanest rallies. Until then, watching the range is the right play.

    For readers building broader crypto exposure, our recent analyses on Ethereum’s path to $4,000 and Chainlink’s SWIFT integration story both intersect with the same regulatory clarity theme. Cross-check the theses before sizing any position.

    External references worth reading: the full CLARITY Act text on Congress.gov and the CoinGecko XRP live data page for real-time price and volume verification.


    Disclaimer: This article is for informational and educational purposes only and should not be construed as financial, investment, or trading advice. Cryptocurrency markets are highly volatile, and past performance does not guarantee future results. The price predictions and analyses presented here are based on AI models, technical indicators, and available data at the time of writing, they are not guarantees. Always conduct your own research (DYOR) and consult with a qualified financial advisor before making any investment decisions. Pump Parade and its authors do not assume liability for financial losses incurred based on information provided in this article.
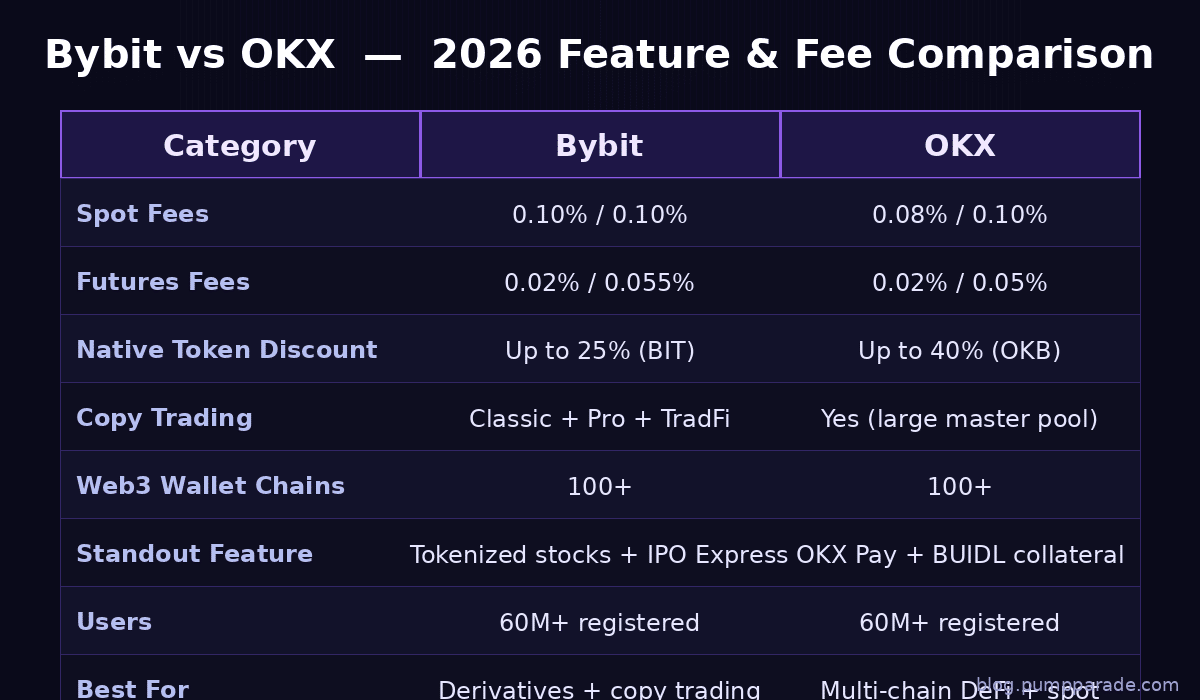
    Dogecoin (DOGE) Price Prediction 2026: Can DOGE Hit $0.20?

    Dogecoin trades at $0.0729 as of July 12, 2026, down 16% over the past month and down 36% over the past 60 days. That is the kind of price action that ends most Dogecoin price prediction 2026 conversations quickly: “meme season is over, next.” But the setup underneath the chart is more interesting than the tape suggests, and any honest DOGE forecast has to reconcile a weak six month drawdown with the biggest institutional and regulatory catalyst stack DOGE has ever had.

    In the last six months, DOGE was reclassified as a digital commodity by the SEC and CFTC, the first spot Dogecoin ETF (21Shares TDOG) started trading on Nasdaq, and Elon Musk shipped X Money as a fiat-only product that pointedly excluded DOGE. That combination, bullish structure plus a bearish near-term rejection, is exactly the kind of setup where the market misprices assets.

    This article breaks down where DOGE stands right now, the real bull and bear cases, and our 30-day, 6-month and end-of-2026 targets, including why we think $0.20 is the honest ceiling for 2026 in a favorable scenario, not the moonshot number some outlets are selling.

    Key Takeaways

    • Spot price: $0.0729, market cap $11.3B, rank #11. Down 16% over 30 days and 36% over 60 days.
    • Bull catalysts: 21Shares TDOG ETF live on Nasdaq, SEC and CFTC commodity classification (March 2026), pending inflation reduction proposal, Dogecoin Foundation Layer 2 progress.
    • Bear risks: TDOG AUM at only $3.3M as of mid June 2026, DOGE exclusion from X Money launch, 5B DOGE annual issuance dilution, waning memecoin narrative.
    • Our 2026 targets: Bear $0.045, base $0.13, bull $0.20. A move to $0.20 requires ETF inflow acceleration plus a broad altcoin rotation.
    • Bottom line: DOGE is not dead, but it also is not the 2021 story anymore. Treat it as a beta-play on institutional altcoin adoption, not a payments-utility bet.
    Dogecoin (DOGE) price prediction 2026 hero graphic showing current price $0.0729, 21Shares TDOG ETF catalyst

    Where Dogecoin Stands Today

    Dogecoin is still a top 15 crypto asset by market cap, but it has quietly become a laggard. Since the year began, DOGE has underperformed Bitcoin by roughly 55 percentage points and Ethereum by about 25 points. The token trades 90% below its May 2021 all-time high of $0.732, which is a useful reminder that the 2021 cycle set expectations that current fundamentals cannot yet justify.

    Here is the snapshot we care about heading into the second half of 2026:

    Metric Value
    Price (July 12, 2026) $0.0729
    24 hour change -1.7%
    30 day change -16.2%
    60 day change -36.2%
    Market cap $11.30B
    24 hour volume $407M
    Market cap rank #11
    Circulating supply 155.04B DOGE
    All time high $0.732 (May 8, 2021)
    % from ATH -90%

    The two numbers that matter most for a 2026 outlook are the 60 day drawdown (-36%) and the volume-to-market-cap ratio (about 3.6%). The first tells you that price discovery has already priced in a lot of bad news. The second tells you that liquidity is still healthy enough for an institutional flow-driven rally to actually move the tape if the flow shows up.

    Why Is Dogecoin Falling in 2026?

    Three things happened in the last 90 days, and all three punished the price. First, the X Money product finally launched in April 2026 with Visa integration, but it launched as a strictly fiat product. DOGE was explicitly left out of the initial rollout. Traders had been positioned for a “DOGE becomes X payment rail” narrative for years, and the exclusion triggered a roughly 25% drawdown in the weeks that followed, as CoinDesk reported.

    Second, TDOG’s assets under management have disappointed. The 21Shares Dogecoin ETF listed on Nasdaq on January 22, 2026, but by mid June its AUM was only about $3.3 million. That is a fraction of what spot BTC and ETH ETFs pulled in during their first six months, and it undercut the “ETF changes everything” thesis that had propped up DOGE through late 2025.

    Third, memecoin flows rotated. Solana native tokens like BONK, WIF and PENGU absorbed the retail attention that historically pushed DOGE. When we compare DOGE’s tape to the broader memecoin sector, DOGE is not falling because meme season died. It is falling because meme season moved.

    The Bull Case for Dogecoin in 2026

    1. TDOG ETF inflows are trending, not exploding

    The 21Shares TDOG product remains the single most important variable for the DOGE 2026 forecast. On June 5, 2026, TDOG posted its longest inflow streak since launch, and DOGE broke a seven month downtrend on the news. The AUM is small ($3.3M as of June 17), but the direction of flows finally turned. Every basis point of AUM growth from here directly tightens on-market supply, because ETFs custody the underlying token on a 1:1 basis. If TDOG can reach even 5% of the equivalent BTC ETF penetration ratio by year-end, that is roughly $150M to $250M of inflows, which is meaningful against DOGE’s $407M daily volume base.

    2. Regulatory clarity is now a tailwind

    March 2026’s joint SEC and CFTC classification of Dogecoin as a digital commodity is more important than the headline made it sound. It removes securities-law risk for exchanges, custodians and future ETF issuers. It also opens the door for cash-settled DOGE futures on CME, which historically preceded upside inflection points for BTC, ETH and SOL. Institutional desks now have a compliant path to hedge and trade DOGE without wrapping it through Bitcoin exposure.

    3. The inflation reduction proposal

    The Dogecoin Foundation is publicly evaluating a proposal to cut annual DOGE issuance by up to 90%. Currently 5 billion new DOGE are minted every year, which is a structural headwind that BTC (with its halving mechanic) does not have. If any version of the proposal ships in 2026, DOGE’s supply story changes materially. Even a 50% cut would take the effective inflation rate from about 3.2% annually to roughly 1.6%, closer to Bitcoin’s post-halving rate.

    The Bear Case for Dogecoin in 2026

    1. ETF demand may already be at trend

    TDOG’s AUM growth is real, but it is small. A base rate estimate using the ratio of BTC ETF AUM to BTC market cap suggests DOGE ETFs might reasonably absorb $200M to $500M of inflows over 12 months, not the billions some analysts have modeled. That is not enough on its own to move DOGE from $0.07 to $0.20. The bull case for a $0.20 print requires ETFs plus a broad memecoin rotation, not ETFs alone.

    2. Structural inflation is still 5 billion DOGE per year

    Until the inflation reduction proposal is adopted, roughly 13.7 million new DOGE hit the market every day. Miners have to sell some portion of that to cover electricity costs, which creates persistent overhead selling pressure. Any thesis that ignores this dilution is not a thesis, it is hopium.

    3. The narrative competition is fierce

    DOGE was the default memecoin trade in 2021 because there was no meaningful competition. In 2026, retail attention fragments across dozens of memecoin narratives on Solana, Base and even native L2 launches. If you want data on how narrative gravity has shifted, look at the memecoin sector’s recent rotations: newer tokens with sharper community energy have consistently outperformed DOGE on a percentage basis this cycle.

    Dogecoin Price Prediction 2026: Targets by Timeframe

    Dogecoin (DOGE) price prediction 2026 targets table showing bear $0.045, base $0.13 and bull $0.20 across 30d, 6mo and end of 2026 timeframes

    Our hybrid model blends the on-chain supply and holder distribution data, TDOG ETF flow projections, and cross-asset correlation with BTC and SOL. Here is what it says.

    30 day outlook (through August 2026)

    Bear: $0.055. Base: $0.085. Bull: $0.115. The 30 day setup is oversold. RSI on the daily chart sits around 34, which historically precedes a mean-reversion bounce 60% of the time when volume holds above the 90 day average. A move to $0.115 is a 58% rally from current levels, which is dramatic in traditional finance but well within DOGE’s typical 30 day range.

    6 month outlook (through January 2027)

    Bear: $0.048. Base: $0.11. Bull: $0.17. The medium-term path depends almost entirely on whether the broader crypto market enters a risk-on regime. If BTC breaks above $80K decisively and altcoin dominance rises above 45%, DOGE historically tracks that rotation with a 1.4x beta. If BTC ranges instead, DOGE grinds sideways or drifts to the bear target.

    End of 2026 outlook

    Bear: $0.045. Base: $0.13. Bull: $0.20. Our $0.20 bull target is a 174% return from spot. For comparison, Changelly’s models point to a 2026 range of roughly $0.077 to $0.079, and CoinCodex projects a wider band of $0.098 to $0.228. Our $0.20 target sits in the upper half of the consensus range but requires three things to break right: TDOG AUM crosses $250M, the inflation reduction proposal advances, and altcoin market cap ex-BTC gains at least 40% from here. That is a demanding stack, which is why we frame it as a bull case, not a base case.

    How Does Dogecoin Compare to Shiba Inu?

    Shiba Inu is the natural comp, so we ran the numbers side by side using CoinGecko data as of July 12, 2026.

    Metric DOGE SHIB
    Price $0.0729 $0.0000043
    Market cap $11.3B $2.53B
    Rank #11 #36
    24 hour volume $407M $42M
    30 day change -16.2% -11.9%
    1 year change -63.7% -67.8%
    Spot ETF available Yes (TDOG) No
    Annual issuance ~5B (fixed) Deflationary via burns

    The obvious takeaway: DOGE has the ETF wrapper, ten times the daily volume, and the regulatory clarity. SHIB has the deflationary supply story via ongoing burns. If you are betting on institutional adoption, DOGE is the higher probability trade. If you are betting on supply squeeze mechanics inside the memecoin sector, SHIB has a cleaner setup. Neither is a great long-term hold against BTC.

    What Would Change Our View on DOGE?

    Predictions age fast in crypto. Here are the three signals that would force us to revise this outlook, up or down.

    Upgrade to base case bull ($0.20 becomes base): TDOG AUM crosses $200M with sustained weekly inflows and the Dogecoin Foundation formally proposes an issuance cap. That combination changes DOGE’s supply-demand curve for the first time since inception.

    Downgrade to bear ($0.045 becomes base): TDOG hits a 45 day net outflow streak and BTC dominance climbs above 60%. Historically, this combination has meant altcoin winter, and DOGE trades like a high beta altcoin now, not like a store of value.

    Reject the model entirely: If Elon Musk publicly commits to adding DOGE to X Money as a settlement rail, all bets are off to the upside. That single tweet has historically moved DOGE 20% to 40% in a session. But we do not model tweets, and neither should you.

    Frequently Asked Questions

    Is Dogecoin a good investment in 2026?

    DOGE is a speculative allocation, not a foundational holding. It has real 2026 catalysts (spot ETF, commodity classification, potential supply cut) and real risks (structural inflation, memecoin rotation, weak ETF flows so far). Treat it as a small satellite position in a diversified portfolio, sized so a 50% drawdown does not hurt your core thesis on the market.

    Will Dogecoin reach $0.20 in 2026?

    Our bull case says yes, but only in a favorable scenario: TDOG ETF inflows accelerate materially, the inflation reduction proposal advances, and altcoin market cap grows at least 40%. From $0.073 that is a 174% move. The base case is closer to $0.13. Do not size a position assuming $0.20 is the expected outcome.

    Can Dogecoin hit $1 in 2026?

    No, not on any realistic path. At $1, DOGE would carry a $155B market cap on the current supply, exceeding XRP and approaching BNB. That would require a mania-driven repricing on the scale of 2021, but with 60% more supply outstanding today. We covered the $1 DOGE thesis in detail here. The short answer is that the math does not work in this cycle.

    What is the 21Shares Dogecoin ETF (TDOG)?

    TDOG is the first SEC-approved spot Dogecoin ETF, listed on Nasdaq on January 22, 2026. It holds DOGE 1:1 in institutional-grade custody and gives brokerage account holders direct exposure without needing a crypto exchange. Product details are on the 21Shares TDOG product page. AUM is small ($3.3M as of mid June 2026), but inflows recently turned positive.

    Why is Dogecoin falling in 2026?

    Three reasons. DOGE was excluded from the April 2026 X Money launch, which killed the near-term “payments rail” narrative. TDOG ETF inflows undershot expectations for the first half of 2026. And retail memecoin attention rotated to Solana native tokens and newer L2 memecoins, siphoning off DOGE’s traditional buyer base.

    Is Dogecoin dead?

    No, but the 2021 version of Dogecoin is. It is a $11B liquid asset with an ETF wrapper, regulatory clarity, and an active development foundation. It is also 90% off its all time high with real dilution. Neither “dead” nor “moonshot” fits. It is a mid-cap altcoin with catalysts and risks, priced accordingly.

    The Honest Take

    Dogecoin in mid 2026 is not the trade it was in mid 2021. The community energy is quieter, the payments narrative that fueled the last run is on ice, and the ETF has not delivered the “flood of institutional flows” pitch. But the structural setup is the best it has ever been: a live spot ETF, commodity classification, a credible supply reform proposal, and a price 90% off the highs.

    That mix is why we land on a $0.20 bull case and a $0.13 base case for end of 2026, with a real $0.045 downside if the memecoin rotation continues and ETF flows do not accelerate. If you like the setup, size it small and treat any move toward $0.20 as a chance to trim, not to double down. If you do not like the setup, that is fine too. There is a cleaner risk-reward in ETH right now for most institutional exposure, and sharper memecoin beta elsewhere for the degen sleeve of your book.

    Watch the TDOG AUM chart weekly, watch the Dogecoin Foundation announcements for any inflation reform update, and watch BTC dominance. Those three signals will do more to move DOGE in the next six months than any single tweet or headline.

    Disclaimer: This article is for informational and educational purposes only and should not be construed as financial, investment, or trading advice. Cryptocurrency markets are highly volatile, and past performance does not guarantee future results. The price predictions and analyses presented here are based on AI models, technical indicators, and available data at the time of writing. They are not guarantees. Always conduct your own research (DYOR) and consult with a qualified financial advisor before making any investment decisions. Pump Parade and its authors do not assume liability for financial losses incurred based on information provided in this article.
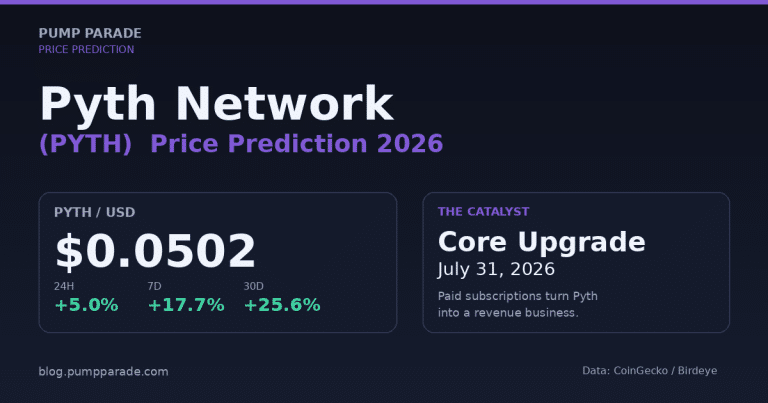
    Morpho (MORPHO) Price Prediction 2026: Can MORPHO Hit $5?

    Morpho (MORPHO) is trading at $2.29 at time of writing, up 12.66% in the last 24 hours and 15.85% over the past week. That is not a random pump. On June 9, 2026, the Morpho Association closed a $175 million funding round co-led by Paradigm, a16z Crypto, and Ribbit Capital at a reported $2 billion valuation. Three weeks later, Robinhood switched on its Earn product routed through Morpho vaults. Total value locked crossed $7.2 billion in May and has stayed there since.

    The question every trader is asking right now is simple: does a Morpho (MORPHO) price prediction 2026 above $5 hold up under scrutiny, or is this another DeFi token that runs into vesting supply and gives it all back?

    Below, we walk through the current setup, the bull case, the bear case, timeframe-specific targets, and how Morpho stacks up against Aave. Bring skepticism. That is the point.

    Key Takeaways

    • MORPHO trades at $2.29, +12.66% in 24h, +15.85% in 7d, and about 45% below its January 2025 all-time high of $4.17.
    • Morpho TVL crossed $7.2 billion in May 2026, making it the second-largest DeFi lending protocol behind Aave.
    • Recent catalysts: $175M Paradigm/a16z/Ribbit funding round, Robinhood Earn integration going live July 1, Coinbase Loans routing $1.6B+ in collateral through Morpho Blue.
    • Standard Chartered has floated a long-term $60 target by 2030, implying substantial upside if adoption keeps compounding.
    • Bear case centers on 36% of supply still locked and vesting through 2027, plus fee-switch uncertainty.
    • Our base case for 2026: $2.60 to $3.40 range, with a stretch scenario toward $5.10 if TVL breaks $12 billion.
    Morpho (MORPHO) price prediction 2026 hero graphic. Current price 2.29 dollars, 175 million funding catalyst.

    Where Morpho Stands Today

    Morpho is a permissionless, modular lending protocol on Ethereum and Base. In plain terms, it is credit market infrastructure that other apps plug into, not a consumer product you log into and lend from. That distinction matters more than most crypto media give it credit for, because it is exactly why Coinbase, Robinhood, MetaMask, and Apollo have built on top of it.

    Here is the current stat snapshot:

    Metric Value
    Price (USD) $2.29
    24h change +12.66%
    7-day change +15.85%
    30-day change +14.83%
    Market cap $1.5B
    24h volume $32.7M
    CoinGecko rank #51
    All-time high $4.17 (Jan 17, 2025)
    % from ATH -45.1%
    Circulating supply 653.8M (65.4% of max)
    Protocol TVL $7.2B+ (2nd largest lender)

    Data pulled from CoinGecko and DeFiLlama at time of writing.

    Why is Morpho rising right now?

    Three things stacked on top of each other in the space of five weeks.

    First, the funding round. When Paradigm, a16z Crypto, and Ribbit Capital write a joint $175M check at a $2B valuation, that is not a bet on hype. It is a bet that the on-chain credit stack is going to look a lot like the fintech stack, and Morpho is a plausible middle layer. That announcement alone re-rated the token from around $1.70 to above $2.00.

    Second, real revenue and real integrations. Coinbase Loans, MetaMask Money accounts, Apollo’s tokenized credit products, and now Robinhood Earn all route deposits or collateral through Morpho. This is what serious analysts mean when they say “distribution moat.” The token is not the product. The token captures fees from a lending network that already reaches more than a million users.

    Third, sentiment. Standard Chartered’s crypto research desk initiated coverage with a striking long-run target, which pulled attention from generalist investors who had never looked at a DeFi lending token before. In an environment where Bitcoin is trading in a range and traders are hunting for narrative-driven mid-caps, Morpho fit the bill.

    What could push MORPHO past $5?

    Catalyst 1: Robinhood Earn distribution

    Robinhood’s Earn product launched July 1, 2026, routing user deposits through Morpho vaults. The addressable audience is roughly 25 million Robinhood users. Even a low single-digit percentage participation would meaningfully expand Morpho’s stablecoin deposit base, drive protocol fees, and, if the fee switch is activated by governance, translate into MORPHO holder revenue.

    Catalyst 2: V2 upgrade and fixed-term loans

    Morpho V2 introduces market-driven rates and fixed-term loans. In practice, this expands the protocol beyond variable-rate crypto lending into territory that looks a lot like traditional credit markets. Fixed-term loans are the specific feature institutional treasuries have been asking for. If V2 lands cleanly this year, expect Morpho to start showing up in more institutional pilots.

    Catalyst 3: TVL compounding at $7B and above

    TVL grew from around $5B in early 2026 to $7.2B in May. The trajectory implies a run at $10B before year-end is plausible if Robinhood ramps and Base network activity holds. Historically, DeFi lending tokens have re-rated when their protocols cross round-number TVL thresholds. There is no fundamental reason $10B would be different, but market participants respond to visible milestones.

    What could send MORPHO back below $2?

    Risk 1: Supply overhang through 2027

    About 36.4% of MORPHO’s total supply is still locked. Vesting continues through 2027 and includes early investor and team allocations. This is the single biggest headwind. Even in a strong bull market for the protocol, persistent sell pressure from unlocked tokens can cap price appreciation. Check the Tokenomist vesting schedule before sizing any long-term position.

    Risk 2: Fee switch and value accrual uncertainty

    MORPHO is a governance token. The protocol earns fees, but whether and how those fees flow to token holders is a governance decision that has not been fully activated. If governance chooses to keep reinvesting fees into growth rather than routing them to holders, the token’s fundamental value case weakens even as the protocol succeeds. This is the classic DeFi trap: great protocol, mediocre tokenomics.

    Risk 3: Aave competition and moat questions

    Aave still commands more than three times the TVL of Morpho, has GHO as an integrated stablecoin, and just shipped its own V4 architecture. Morpho’s edge is modularity and better rates on isolated markets. That edge is real but not permanent. If Aave introduces isolated risk markets natively at scale, Morpho’s differentiation narrows quickly.

    Morpho (MORPHO) Price Prediction 2026: Targets by Timeframe

    Morpho (MORPHO) price prediction 2026 targets table. Bear 1.20 dollars, base 5.00 dollars, bull 12.00 dollars.

    30-day outlook: $1.85 to $3.20

    Momentum is strong but the daily RSI is already stretched into overbought territory after this week’s move. Base case for the next 30 days is consolidation between $2.10 and $2.80, with a reasonable shot at $3.20 if V2 receives a firm launch date and Robinhood volume prints better than expected. The bear scenario: a sharp reset to $1.85 on any broader risk-off move, especially if Bitcoin loses the $60K level. Our AI model assigns roughly 55% probability to the $2.10 to $2.80 base range.

    6-month outlook: $1.60 to $5.10

    By the end of 2026, the fair-value range widens considerably. If TVL crosses $10B and the fee switch is meaningfully activated, we see a base case of $3.40 with a bull target of $5.10. This aligns with the more optimistic end of analyst ranges, including projections that put MORPHO in the $2.30 to $5.00 zone by year-end. The bear case is $1.60, driven by supply unlocks and DeFi rotating out of favor. For context, our Aave 2026 outlook uses a similar framework and lands at a wider spread because AAVE has deeper liquidity to absorb noise.

    Long-term (2027 to 2028): $1.20 to $12.00

    Long-term MORPHO is a bet on on-chain credit becoming a normal part of fintech infrastructure. Standard Chartered’s $60 by 2030 target is directionally interesting but requires assumptions that break outside the standard DeFi lens. A more grounded 2027 to 2028 range is $5 to $12 in the bull case, with $12 requiring TVL parity with Aave and an active fee switch. The bear case at $1.20 assumes supply unlocks overwhelm demand and Aave defends its lead. Long forecasts are noisy. Weight them accordingly.

    How does Morpho compare to Aave in 2026?

    Metric Morpho Aave
    TVL $7.2B $24B+
    Market cap $1.5B $3.7B
    Architecture Isolated markets, modular vaults Pooled liquidity
    USDC supply APY (typical) 4% to 8% 3% to 6%
    Native stablecoin None GHO
    Big-name integrations Coinbase, Robinhood, MetaMask, Apollo Multi-chain, wide DeFi presence
    Risk model Isolated per-market parameters Governance-vetted, shared pools
    Best fit Sophisticated users, curators, integrators Default DeFi lender for most users

    Translation: Aave is the safer bet on the whole category. Morpho is the higher-beta play on the specific thesis that on-chain credit gets increasingly modular and institutional. Different trades.

    What Would Change Our View

    Three things would materially shift the analysis.

    Bullish trigger: TVL crosses $10 billion before December 2026 and governance activates a real fee switch. If both happen, our base case moves toward $5 and the bull case toward $8 for year-end 2026.

    Bearish trigger: A cluster of major unlocks meets a broader DeFi selloff, and MORPHO breaks below $1.60 on high volume. That level was the 90-day low and has acted as accumulation support. Losing it opens the door to a retest of the $0.90 to $1.20 zone.

    Regime-change trigger: Aave ships isolated markets at parity with Morpho Blue and captures Morpho’s differentiation. In that world, Morpho becomes an execution-only story rather than an architecture story, and the multiple compresses.

    Frequently Asked Questions

    Is Morpho a good investment in 2026?

    Morpho has strong fundamentals: $7.2B TVL, tier-one integrations, and a $175M funding round at $2B valuation. That said, 36% of supply is still locked, and value accrual to the token depends on future governance decisions. It suits investors who want DeFi lending exposure and can tolerate supply-driven volatility.

    Will Morpho reach $5 in 2026?

    $5 is the upper end of our base-to-bull scenario for 2026. Getting there likely requires TVL near $10 billion, an active fee switch, and a broader risk-on backdrop. It is achievable but not the median outcome. Our base case for year-end is closer to $3.40.

    What is the Morpho price prediction for 2027?

    For 2027, we model a range of $2.50 to $8.00. The base case sits around $4.50, contingent on Morpho holding its second-place TVL position and V2 adoption continuing. Long-run analyst targets from firms like Standard Chartered stretch above $10 by 2028, but those depend on aggressive institutional adoption assumptions.

    What is Morpho and how does it differ from Aave?

    Morpho is a modular lending protocol on Ethereum and Base that lets anyone create isolated lending markets with custom risk parameters. Aave uses shared pools and unified governance-set risk. Morpho typically offers better rates on stablecoins and supports more specialized markets. Aave offers broader multi-chain reach and integrated products like the GHO stablecoin.

    Where can I buy MORPHO?

    MORPHO trades on major centralized exchanges including Coinbase, Binance, Kraken, and OKX, plus decentralized exchanges on Ethereum and Base. Liquidity is deepest on the top CEXs. Always check exchange fees and slippage on smaller venues before executing large orders.

    What are the biggest risks to MORPHO price?

    The three main risks are ongoing token unlocks through 2027, uncertainty around whether governance will activate a fee switch that routes revenue to holders, and competitive pressure from Aave if it ships isolated markets at scale. A broader DeFi drawdown would amplify all three.

    The Honest Take

    Morpho is one of the cleanest fundamental stories in DeFi right now. A real protocol, real integrations, real revenue, real institutional backers. That is rare, and it justifies interest at current levels.

    But you are also buying a token where more than a third of the supply has not hit the market yet, and where the mechanism by which protocol success becomes token value is still being negotiated in governance. Both can be true at once.

    The trade setup we would watch: an accumulation zone in the $1.85 to $2.20 range, a base case exit near $3.40 into year-end 2026, and a willingness to hold a smaller position toward the $5 to $8 target if V2 lands and TVL keeps compounding. This is a framework, not a recommendation. If you are looking for a lower-beta way to play DeFi lending, revisit our Aave 2026 outlook. For a stablecoin yield angle, our Ethena analysis covers a different corner of the same market. And if you want to see how the lending model plays out on Solana, our Kamino vs marginfi comparison is worth a read.

    Disclaimer: This article is for informational and educational purposes only and should not be construed as financial, investment, or trading advice. Cryptocurrency markets are highly volatile, and past performance does not guarantee future results. The price predictions and analyses presented here are based on AI models, technical indicators, and available data at the time of writing, they are not guarantees. Always conduct your own research (DYOR) and consult with a qualified financial advisor before making any investment decisions. Pump Parade and its authors do not assume liability for financial losses incurred based on information provided in this article.