More
    Home Blog Page 10

    Avalanche (AVAX) Price Prediction 2026: Can AVAX Hit $10?

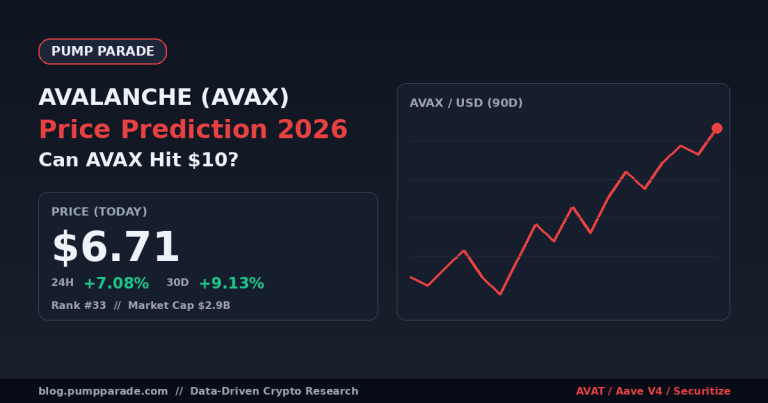
    Avalanche (AVAX) is trading at $6.71 at time of writing, up 7% in the last 24 hours and reclaiming its 200-day moving average for the first time since April. That is not a random pump. In the past four weeks, Securitize tokenized $295 million of its own NYSE-listed stock on Avalanche, Aave V4 launched natively on the network, and a $1 billion AVAX treasury vehicle called AVAT signed a $675 million anchor deal with Mountain Lake Capital ahead of a planned Nasdaq listing.

    So the real avalanche price prediction 2026 question is not whether $10 is achievable. It is whether AVAX can sustain the institutional bid long enough to make $10 look like a floor rather than a ceiling. This article breaks down the current setup, the specific catalysts, the bear risks, and our timeframe-by-timeframe price targets.

    Let’s dig in.

    Key Takeaways

    • AVAX trades at $6.71, up 7% today, up 9% over the past 30 days. Market cap sits at $2.9B, ranking 33rd by market cap.
    • Three concrete Q3 catalysts: Securitize’s $295M tokenized stock, Aave V4 native deployment, and the AVAT Nasdaq-listed treasury vehicle.
    • On-chain activity hit 3.87M daily transactions on July 21, a fresh multi-year high driven by subnet migrations.
    • Our base case: AVAX closes 2026 between $8.50 and $12.00. Bull case reaches $18. Bear case revisits $4.20.
    • Key invalidation level: a weekly close below $5.30 breaks the current uptrend and hands the ball back to the sellers.
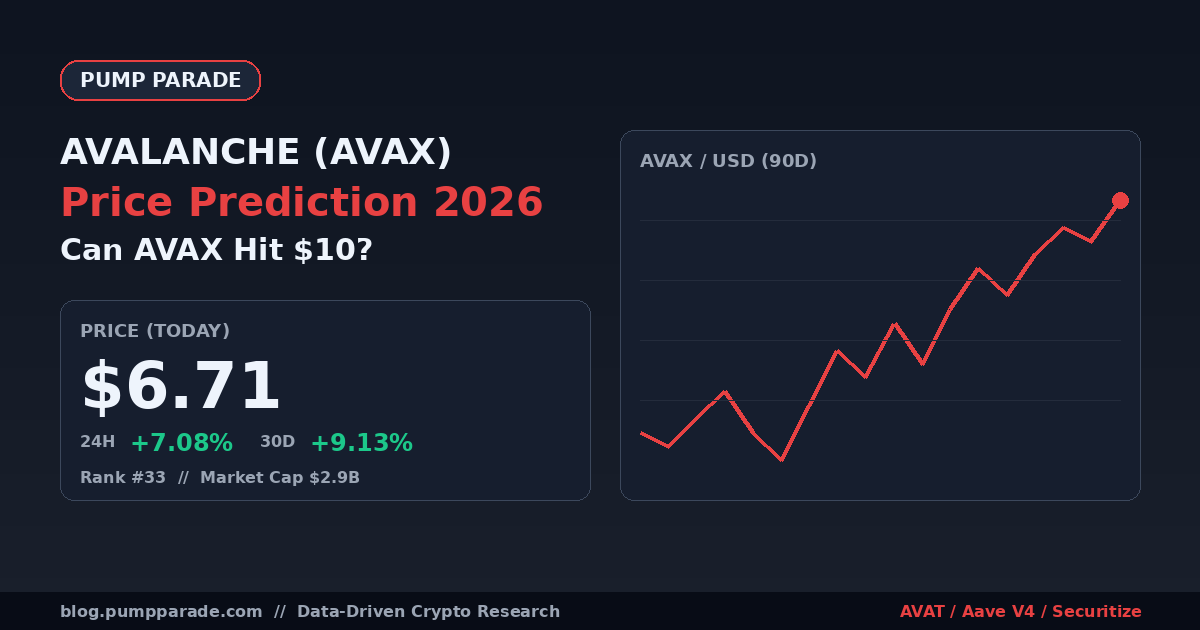
    Avalanche (AVAX) price prediction 2026 hero graphic showing current price $6.71 and Nasdaq treasury catalyst

    Where Does Avalanche Stand Right Now?

    Before we talk targets, let’s anchor the current state. AVAX has spent most of 2026 in a $4.50 to $8.00 range, held down by broader altcoin weakness and the overhang of over-issued subnet tokens. The last seven days have changed the tone.

    Metric Value
    Price $6.71
    24-hour change +7.08%
    7-day change +3.34%
    30-day change +9.13%
    Market cap $2.90B
    24-hour volume $295M
    CoinGecko rank #33
    All-time high $144.96 (Nov 2021)
    Distance from ATH -95.4%

    The 95% drawdown from the 2021 top is the story most bulls prefer to skip. It is also the reason AVAX has an asymmetric setup here: it does not need to hit a new all-time high to deliver 5x. It needs to reclaim its 2024 range.

    Why Is AVAX Rallying Right Now?

    Three things are converging.

    First, on-chain activity is real. Daily transactions hit 3.87 million on July 21, 2026, according to Avalanche Foundation dashboards. That is not testnet spam. It is being driven by enterprise subnet migrations, including Japan’s Progmat platform moving roughly $2.8 billion of tokenized assets to a dedicated Avalanche L1.

    Second, the DeFi stack is deepening. Aave V4 chose Avalanche as its native launch chain, ahead of most competitors. Stablecoin supply on Avalanche climbed to $1.8 billion as a direct result. When Aave’s most modern architecture picks your chain first, capital notices.

    Third, and most importantly for price, institutional capital is showing up in size. The Avalanche Treasury Vehicle (AVAT), backed by Galaxy Digital, Pantera, VanEck, Kraken, and FalconX, sealed a $675 million anchor deal with Mountain Lake Capital and plans a Nasdaq listing. Its stated goal is to accumulate over $1 billion of AVAX for institutional investors. That is a structural buyer that did not exist six months ago.

    The Bull Case for AVAX

    1. Structural buying from AVAT and the ETF stack

    The AVAX ETF picture matured this year. VanEck’s spot AVAX ETF and the Grayscale AVAX Trust conversion are both taking daily inflows. Layer on the AVAT treasury vehicle and you have three structural bid sources buying AVAX at prices well above where retail flipped bearish. If AVAT hits its $1B target in a market where daily AVAX volume is $295M, the demand shock alone justifies a rerating.

    2. Real-world assets are finally being tokenized here

    Securitize’s $295 million tokenization of its own NYSE-listed stock on Avalanche was the first tokenized public equity of that scale. BlackRock’s BUIDL fund is also live on the network, and JPMorgan’s Onyx continues to pilot subnet-based settlement. If Securitize’s precedent encourages even three or four mid-cap public companies to follow, the fee accrual to AVAX becomes material.

    3. Subnet economics are turning

    The Etna and Granite upgrades, part of the broader Avalanche9000 initiative, slashed the cost of spinning up custom L1s to a fraction of the pre-upgrade rate. That was a headwind in 2025 (many teams launched their own L1 and drained activity from the C-Chain). In 2026 it is turning into a tailwind: enterprise L1s route settlement and gas back to AVAX, and the number of active subnets is climbing.

    The Bear Case for AVAX

    1. Diluted narrative in an L1 crowd

    Solana is still the L1 that captures the memecoin trade. Base owns the consumer app narrative. Hyperliquid dominates perp DEX flow. Avalanche’s “institutional L1” positioning is credible but crowded: Ondo Chain, Canton, and Kinto are all fighting for the same enterprise mandate. If Avalanche cannot differentiate on more than partnerships, the RWA narrative becomes commoditized.

    2. Token unlocks and validator rewards

    AVAX still emits inflation to validators and staking rewards, and roughly 30 million subnet-related tokens vest across Q3 and Q4. That is not catastrophic supply, but it is a persistent sell pressure that has capped rallies before. Any macro pullback risks turning $6.50 back into the ceiling rather than the floor.

    3. Macro and Bitcoin dominance

    Bitcoin dominance sits at 58%. Every previous alt season needed BTC dominance to break below 55%. Until that happens, even fundamentally strong alt catalysts get muted. If Bitcoin corrects to $56K, AVAX likely tests $5.30 regardless of the tokenization headlines.

    Avalanche Price Prediction 2026: Targets by Timeframe
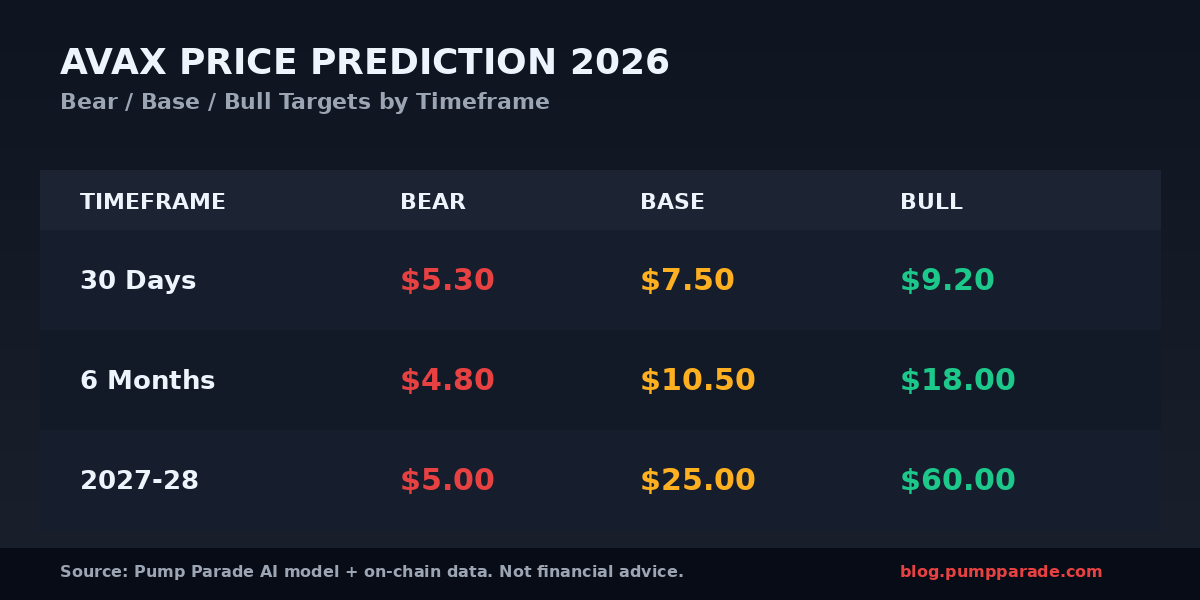
    Avalanche (AVAX) price prediction 2026 targets table showing bear $4.20, base $10.50, bull $18 across 30-day, 6-month, and long-term horizons

    30-day outlook (through late August 2026)

    • Bear case: $5.30. Loss of the 200-day moving average and a broader alt flush.
    • Base case: $7.50. Consolidation above $6.50 as AVAT news drip-feeds the market.
    • Bull case: $9.20. Tokenization headline (new Fortune 500 name) plus a broader BTC dominance rollover.

    6-month outlook (through January 2027)

    • Bear case: $4.80. AVAT delays its Nasdaq listing, Bitcoin corrects hard, alt liquidity dries up.
    • Base case: $10.50 to $12.00. AVAT lists, Aave V4 TVL crosses $2B on Avalanche, ETF inflows resume.
    • Bull case: $18. Full altseason with AVAX as the institutional-flavored beta.

    For reference, MEXC’s own July 2026 model targets a $6.50 to $10.50 base range, which lines up with our base case. Changelly’s longer-horizon forecast reaches $22.10 by late 2026, closer to our bull scenario. Standard Chartered’s digital asset research desk has been more conservative, penciling in $8 to $9 by year-end.

    Long-term outlook (2027-2028)

    • Bear case: AVAX drifts back to $5 as subnets fail to sustain fee accrual.
    • Base case: $20 to $35 as tokenized RWA volumes cross $50B on the network.
    • Bull case: $60+ if AVAX becomes the settlement layer for public-equity tokenization at scale.

    How Does Avalanche Compare to Solana?

    The clearest AVAX comparable is Solana, since both are high-throughput L1s hunting different narratives. Here is the honest side by side.

    Metric Avalanche (AVAX) Solana (SOL)
    Price $6.71 $75.02
    Market cap $2.9B $43.7B
    Rank #33 #7
    Distance from ATH -95% -72%
    Daily transactions 3.87M ~45M
    Dominant narrative Institutional RWA, subnets Consumer apps, memecoins, DePIN
    Native DeFi TVL ~$1.8B ~$9.5B
    ETF status Two spot ETFs live Multiple spot ETFs live

    Solana wins on throughput, TVL, and cultural gravity. AVAX wins on institutional partnerships, tokenized RWA share, and the coming AVAT structural bid. The asymmetric bet is that AVAX has more room to compress the distance to SOL than SOL has to widen it. For a deeper look at Solana’s own setup, see our Ethereum price prediction, which walks through how ETH’s Glamsterdam upgrade impacts the broader L1 competition.

    What Would Change Our View

    Three concrete triggers would force us to rewrite this thesis.

    First, if AVAT scraps or delays its Nasdaq listing past Q1 2027, the structural bid disappears and our base case shifts down by roughly $2.50. Second, if Securitize’s tokenized stock rollout stalls with no additional issuers, the RWA thesis loses its most concrete proof point. Third, if AVAX closes a weekly candle below $5.30, the technical structure breaks and $4.20 opens up quickly.

    On the flip side, a confirmed Fortune 500 tokenization on Avalanche or a surprise ETF approval for staked AVAX would push the bull case higher.

    Frequently Asked Questions

    Will AVAX reach $10 in 2026?

    Our base case says yes, most likely between October 2026 and January 2027. The path runs through the AVAT Nasdaq listing, sustained Aave V4 growth on Avalanche, and at least one more marquee tokenization. If Bitcoin dominance rolls over into that window, $10 becomes conservative and $12 to $14 is more likely.

    Is Avalanche a good investment in 2026?

    It fits a specific profile: investors who want L1 exposure with an institutional flavor and can stomach 40% drawdowns. AVAX is not a low-risk asset. It is arguably undervalued on network activity and tokenized asset share, but any macro shock hits high-beta alts first. Size the position accordingly.

    What is the Avalanche price prediction for 2027?

    Our 2027 base case is a $12 to $20 trading range, contingent on tokenized RWA volumes doubling and AVAT reaching its stated $1B accumulation goal. The bull case pushes toward $35 if public-equity tokenization becomes a real market on Avalanche. The bear case is a return to the $5 to $7 zone if subnet economics fail to compound.

    What is Avalanche9000?

    Avalanche9000 is the umbrella name for the network’s 2025-2026 upgrade cycle, headlined by Etna and Granite. Together they cut the cost of launching a custom L1 by over 99%, made subnets interoperable with the C-Chain by default, and reformed validator economics. It is why enterprise migrations picked up so sharply this year.

    Can Avalanche outperform Solana in 2026?

    On percentage return, yes, that is our base case. AVAX starts from a lower valuation with a fresher institutional catalyst stack. On absolute market cap, Solana still wins comfortably. The trade many funds are running: long AVAX, short a smaller notional of SOL, betting the ratio closes toward 2024 levels.

    The Honest Take

    AVAX is not the sexiest ticker on crypto Twitter, and it never will be. What it is right now is the L1 with the most credible institutional stack: real tokenized assets, a Nasdaq-listed treasury vehicle in the works, and native launches from the DeFi majors. Combine that with a 95% drawdown from ATH and a market cap under $3B, and you get an asymmetric setup that does not need a miracle to work.

    The base case sends AVAX to $10 to $12 by early 2027. The bull case doubles that. The bear case still leaves you in the $5 zone, which is roughly the current lower range. That is the kind of risk-reward that gets professional allocators interested, and it explains why AVAT could raise $675M this fast.

    Watch the weekly close at $5.30 as your invalidation. Watch the AVAT listing calendar as your primary bull trigger. Watch the broader tokenization narrative as your macro context. The setup is real. The rerating is not guaranteed.

    Disclaimer: This article is for informational and educational purposes only and should not be construed as financial, investment, or trading advice. Cryptocurrency markets are highly volatile, and past performance does not guarantee future results. The price predictions and analyses presented here are based on AI models, technical indicators, and available data at the time of writing, they are not guarantees. Always conduct your own research (DYOR) and consult with a qualified financial advisor before making any investment decisions. Pump Parade and its authors do not assume liability for financial losses incurred based on information provided in this article.
    WLFI Price Prediction 2026: Can WLFI Bounce to $0.15?

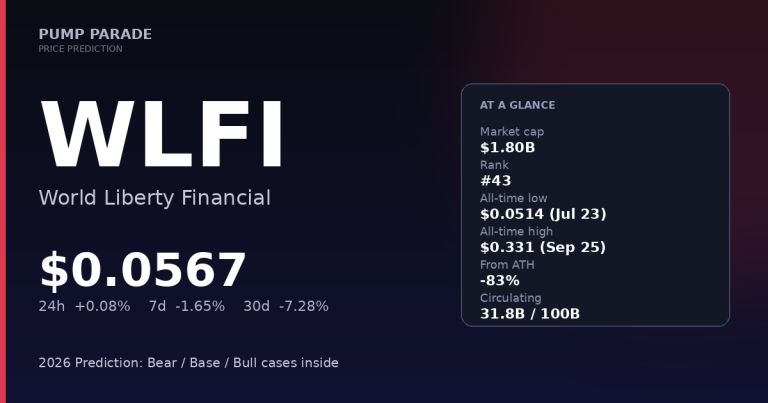
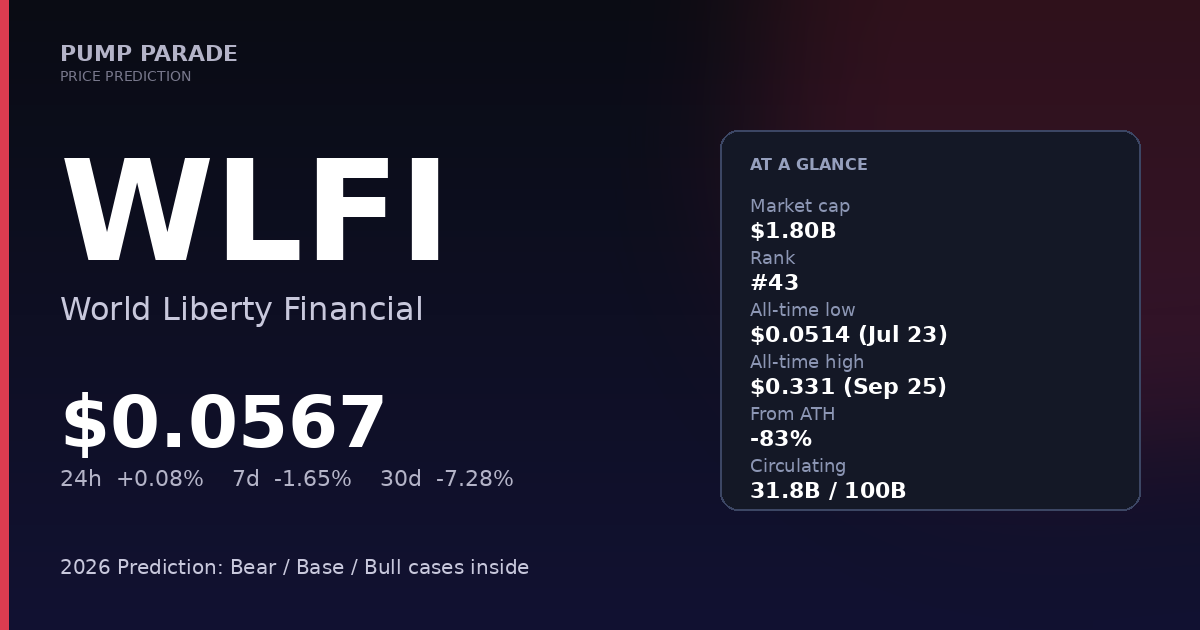
    The WLFI price prediction 2026 question just got a lot more interesting. World Liberty Financial hit an all-time low of $0.0514 on July 23, down 83% from its September 2025 peak of $0.331. As of July 25, 2026, WLFI trades at $0.0567 with a $1.80 billion market cap, ranking 43rd by capitalization on CoinGecko. Volume clocks in at $49.6 million over the last 24 hours, thin for a token this politically loaded.

    Here is the setup nobody wanted to write about. The token behind the Trump family’s DeFi venture is bleeding, its USD1 stablecoin is quietly scaling past $4.6 billion in circulation, and a 62 billion token unlock is now grinding through vesting schedules. Bulls see a bottom. Bears see the start of a longer capitulation.

    This article breaks down where WLFI stands today, why the price is where it is, the bull and bear cases you can actually defend with data, our 2026 targets across three timeframes, how WLFI stacks up against Aave, and the specific triggers that would change our view.

    Key Takeaways

    • WLFI trades at $0.0567 after hitting an all-time low of $0.0514 on July 23, 2026, down 83% from its ATH.
    • USD1, the WLFI-issued stablecoin, has grown to roughly $4.6 billion in circulation and now ranks 7th among all stablecoins.
    • A governance proposal passed in April 2026 with 99.5% support, unlocking 62 billion tokens under structured vesting: insiders face a 2-year cliff plus 2-year linear vest, with 10% of team allocation burned.
    • Our base case sees WLFI at $0.095 by year-end 2026, with a bull case at $0.150 and a bear case at $0.038.
    • The single biggest risk is not price. It is concentration: only 31.8B of 100B total supply is circulating, and future unlocks could dwarf current daily volume.
    • Political tailwinds cut both ways. WLFI benefits from a friendlier US regulatory tone but carries reputation risk that most tokens do not.
    WLFI (World Liberty Financial) price prediction 2026 hero graphic. Current price $0.0567. All-time low at $0.051

    Where WLFI Stands Today

    Before we forecast anything, let’s look at the numbers. All figures are pulled from CoinGecko and CoinMarketCap on July 25, 2026, unless noted otherwise.

    Metric Value
    Price $0.0567
    24h change +0.08%
    7d change -1.65%
    30d change -7.28%
    Market cap $1.80B
    Fully diluted valuation $5.66B
    24h volume $49.6M
    Rank #43
    Circulating supply 31.77B / 100B (31.8%)
    All-time high $0.331 (Sep 1, 2025)
    All-time low $0.0514 (Jul 23, 2026)
    % from ATH -83%

    Two numbers stand out. The market cap is $1.80B, but the fully diluted valuation is $5.66B. That gap is the story. A little under 32% of the total supply is in circulation, which means every future unlock either has to find fresh demand or push price lower. The 24-hour volume of $49.6M is also modest for a top-50 token. Compare that to Ethena (ENA), which turns over multiples of that number on similar market cap days.

    Why is WLFI trading at all-time lows right now?

    Three forces are pressing on the price at once.

    First, the unlock overhang. On April 15, 2026, World Liberty Financial passed a governance proposal to unlock 62 billion previously locked tokens, per CoinDesk’s coverage. The vote sailed through with 99.5% support. Insiders got a 2-year cliff followed by a 2-year linear vest, with 10% of the founder and team allocation burned. That is disciplined tokenomics by crypto standards, but it also means the market now has a clear schedule of future supply hitting the tape. Traders are pricing that in ahead of the cliff.

    Second, the Justin Sun overhang. The TRON founder was an early WLFI backer, then sued the project in April 2026 over $45 million in allegedly frozen tokens. WLFI countersued for defamation in May. Whatever the merits, the news cycle has been net negative and cost the token institutional and retail credibility. If you want the fuller picture on Sun’s own token, our Tron price prediction covers his ongoing situation.

    Third, macro softness. Bitcoin sits at $63,961, down 2% on the day. Ethereum is at $1,857. When majors are drifting, small and mid-cap altcoins with political overhangs get sold first. WLFI is at the intersection of “risk asset” and “political proxy,” and it trades like it.

    The Bull Case

    Before we get accused of writing an anti-WLFI piece, here is the honest bull thesis. There are three catalysts worth taking seriously.

    USD1 is quietly becoming a real stablecoin

    USD1, the fiat-backed stablecoin issued through WLFI, is doing what most stablecoin launches fail to do. According to CoinMarketCap, USD1 is now the 7th largest stablecoin by market cap at roughly $4.6B, with about 40% of its supply routed through BNB Chain. Reserves sit with BitGo, and short-duration Treasury exposure is managed with BlackRock support. That is a legitimate institutional backend, not vaporware.

    If USD1 continues on its current trajectory and pushes past $10B by mid-2027, that changes the WLFI investment thesis materially. The governance token accrues optionality on protocol revenue and voting power over what has become a real payments rail.

    The national trust bank application

    World Liberty Financial has confirmed it filed a national trust bank charter application. If approved, that shifts the project from “crypto startup with a stablecoin” to “regulated financial institution issuing a dollar substitute.” National trust bank charters are rare, difficult, and highly valuable when they land. Circle’s parallel effort is a useful comparison. Even the announcement of a decision, either way, becomes a WLFI-moving event.

    Political tailwind meets crypto policy

    Say what you will about the branding, but the current US regulatory environment is markedly friendlier to stablecoins than it was in 2022. The GENIUS Act framework, combined with a permissive SEC, has cleared runway for tokenized products that would have been dead on arrival two years ago. WLFI is not a neutral beneficiary here. It is a first-order beneficiary. That is a real edge as long as the political tide holds.

    The Bear Case

    Now the other side. This is where the case gets uncomfortable.

    Concentration and future dilution

    Only 31.8% of WLFI’s 100 billion total supply is circulating. Even under the disciplined vesting schedule, roughly 40.7 billion tokens will unlock over the coming years for insiders alone, plus another 17 billion for early supporters. Daily volume is $49.6M. It is not hard to see how supply-side pressure could dwarf demand for extended stretches. This is the single largest structural headwind, and no catalyst can wave it away.

    Reputation and counterparty risk

    WLFI once deposited 5 billion of its own tokens as collateral to borrow stablecoins, and DeFi depositors briefly could not withdraw. That is exactly the kind of event that scares off institutional allocators. The Sun lawsuit compounds it. When a token’s protocol behavior looks self-dealing, price discovery gets penalized long after the incident.

    Political fragility

    WLFI’s upside is tied to a political tailwind that has an expiration date. Trump leaves office in January 2029, and the project’s long-term outlook depends on whether the platform can convert political optionality into durable product-market fit before then. In a 2028 or 2030 political shift, WLFI risks becoming the poster child of the very policies a new administration might want to reverse.

    WLFI Price Prediction 2026: Targets by Timeframe

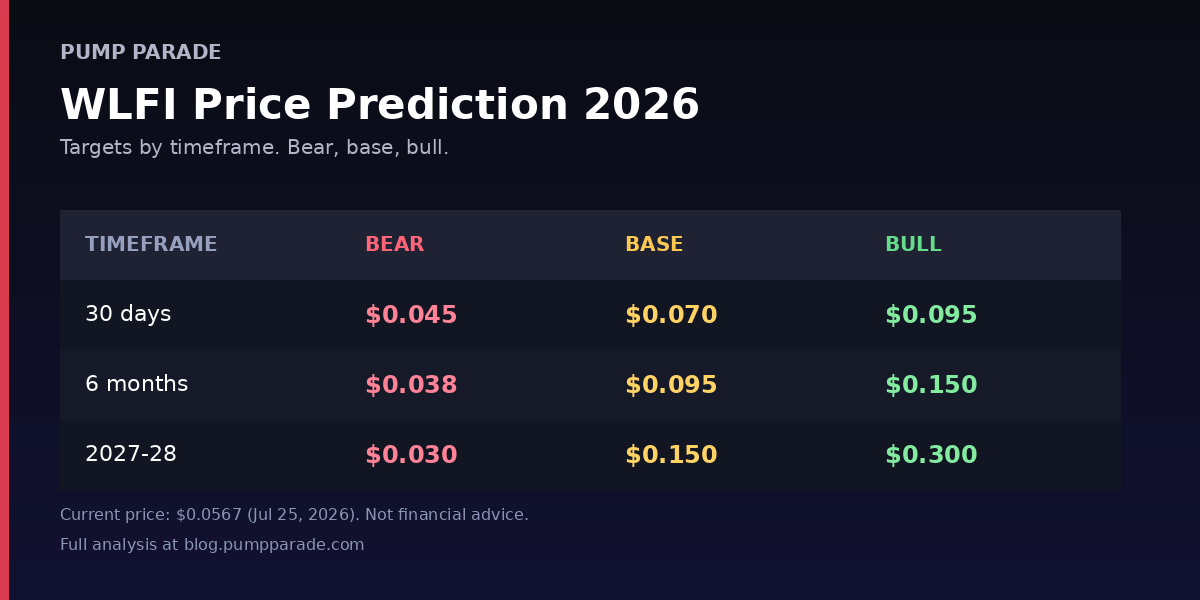
    WLFI (World Liberty Financial) price prediction 2026 targets table. Bear $0.038, base $0.095, bull $0.150

    Here is how our model shakes out across three horizons. We are working from current price, 30-day volatility, USD1 growth trajectory, unlock schedule, and analyst comparisons from Cryptopolitan, CoinPedia, and Changelly.

    Timeframe Bear Base Bull
    30 days $0.045 $0.070 $0.095
    6 months $0.038 $0.095 $0.150
    2027 to 2028 $0.030 $0.150 $0.300

    30-day outlook

    Short-term, the tape wants to test the recent low. Bears target $0.045 on a break of $0.051. Base case is a range grind between $0.055 and $0.075 as the market digests the unlock news. The bull scenario needs a catalyst: a USD1 growth print, an ETF filing, or a positive trust bank development. That gets you to $0.095, roughly retesting the $0.10 psychological level.

    6-month outlook

    By year-end 2026, our base case is $0.095. That assumes USD1 continues to grow at its recent pace, no adverse legal outcomes from the Sun litigation, and BTC holding roughly the $60K to $75K band. The bull case at $0.150 requires either an ETF filing acknowledged by the SEC, USD1 crossing $8B in market cap, or approval of the trust bank charter. Bear case at $0.038 would follow a major legal setback, a broader crypto risk-off event, or unexpected acceleration of the unlock schedule.

    2027 to 2028 outlook

    Longer horizons get less precise, not more. The unlock cliff is the anchor. If USD1 becomes a real payments rail with $15B-plus in supply and WLFI has resolved its overhangs, $0.30 is achievable, roughly the September 2025 ATH. Analyst averages from Changelly and similar aggregators put comparable 2027 targets in the $0.15 to $0.40 range for tokens with similar profiles. Bear case is that political winds shift, dilution overwhelms demand, and WLFI trades below $0.03. We treat the outer ranges as tail scenarios, not base assumptions.

    How does WLFI compare to Aave?

    WLFI’s lending product is a fork of Aave V3, so a direct comparison is fair. This is not to say one is better than the other. They are different bets on different theses. Here is how they stack up. For a deeper look at Aave itself, see our Aave price prediction.

    Metric WLFI AAVE
    Price $0.0567 $91.04
    Market cap $1.80B $1.40B
    Rank #43 #52
    Circulating supply share 31.8% of max Roughly 97% of max
    Stablecoin product USD1 ($4.6B) GHO (about $220M)
    Chains ETH, BSC, Solana ETH, Arbitrum, Optimism, Base, and more
    Track record Under 2 years Roughly 6 years live
    Governance 180-day staking for votes Staked AAVE via safety module

    Read the table honestly. WLFI’s fully diluted market cap advantage is entirely a function of political brand and stablecoin scale. Aave has product maturity, decentralized battle-testing, and a slower burn. WLFI has bigger USD1 supply than Aave’s GHO by an order of magnitude. That is the trade.

    What would change our view?

    Three explicit triggers. If any of these fire, we update the base case within 48 hours.

    1. USD1 crosses $10B in circulating supply. That would move USD1 solidly into the top 5 stablecoins and make WLFI a serious protocol-revenue story. It would justify pushing the base case toward $0.15 and the bull case toward $0.40.

    2. National trust bank charter approval. Either a formal approval or a highly credible reject that removes the overhang. Approval materially rerates WLFI. A clean rejection cuts the bull case in half.

    3. Adverse legal outcome from the Justin Sun litigation. A material judgment against WLFI, or a court-ordered token release, would break the technical picture and force our bear case down to $0.025 to $0.030.

    Frequently Asked Questions

    Is WLFI a good investment in 2026?

    Whether WLFI is a good investment in 2026 depends on your risk tolerance and view on politically branded DeFi. The token carries real optionality if USD1 continues to scale and the trust bank charter progresses, but it also faces heavy dilution risk, reputation risk from ongoing litigation, and concentration in insider hands. It fits better as a small speculative position than as a core holding.

    Will WLFI reach $1?

    Reaching $1 would require WLFI’s fully diluted market cap to hit $100 billion, which is comparable to Solana’s current market cap. That is not a 2026 target under any of our scenarios. Analyst aggregators like Cryptopolitan and CoinPedia model $1 as a possibility no earlier than 2030 or 2031, and only under a scenario where USD1 becomes a top 3 stablecoin globally.

    Why is the WLFI price falling?

    WLFI is falling because three headwinds are compounding: the 62 billion token unlock passed in April 2026 with a clear vesting schedule, the ongoing legal dispute with TRON founder Justin Sun, and general risk-off pressure across mid-cap altcoins as Bitcoin drifts. The token hit an all-time low of $0.0514 on July 23, 2026, and is trying to establish support.

    Who is behind World Liberty Financial?

    World Liberty Financial is a DeFi project publicly associated with the Trump family, with Donald Trump Jr., Eric Trump, and Barron Trump as ambassadors. Co-founder Zach Witkoff runs day-to-day operations. Reserve custody for USD1 sits with BitGo, with BlackRock supporting Treasury management. Sheikh Tahnoon bin Zayed Al Nahyan-linked interests provided a reported $500 million UAE investment.

    How does the USD1 stablecoin work?

    USD1 is a dollar-pegged stablecoin fully backed by US cash, short-duration Treasuries, and cash equivalents. It launched in March 2025, is custodied by BitGo, and now circulates at roughly $4.6 billion across Ethereum, BNB Chain, and other supported networks. About 40% of USD1 supply lives on BNB Chain, making it a growth engine for that ecosystem alongside BNB itself.

    Can WLFI recover from its all-time low?

    Recovery is plausible but not guaranteed. The token has real product traction through USD1 and a friendly political environment, so a mean-reversion move back to $0.09 to $0.15 by mid-2027 fits within our base case. Any recovery has to overcome the mechanical drag of scheduled unlocks, which is why we assign a wider dispersion between our bear and bull scenarios than we would for a fully-vested token.

    The Honest Take

    WLFI is one of the hardest tokens on the market to write about without a bias. Trump association makes it a Rorschach test. Look past that.

    What we see is a token with genuine product traction through USD1, a serious institutional backend, real political tailwind, and a genuinely disciplined vesting proposal for a project of its type. We also see meaningful legal overhang, a concentration structure that guarantees selling pressure for years, and a track record that includes at least one self-dealing incident that gave DeFi purists indigestion.

    Our best-guess 2026 target is $0.095. Our bull case is $0.150. Our bear case is $0.038. That is a 4x spread from bear to bull, which itself tells you something about how much scenario uncertainty this token carries. Position sizing accordingly. This is a token you build a position in slowly, if at all, not one you ape into on a single narrative.

    If you are watching this space anyway, watch USD1 supply, watch the trust bank charter timeline, and watch how the Sun litigation resolves. Those three signals will do more to explain WLFI’s price a year from now than any technical setup we could sketch today.


    Disclaimer: This article is for informational and educational purposes only and should not be construed as financial, investment, or trading advice. Cryptocurrency markets are highly volatile, and past performance does not guarantee future results. The price predictions and analyses presented here are based on AI models, technical indicators, and available data at the time of writing. They are not guarantees. Always conduct your own research (DYOR) and consult with a qualified financial advisor before making any investment decisions. Pump Parade and its authors do not assume liability for financial losses incurred based on information provided in this article.
    Uniswap (UNI) Price Prediction 2026: Can UNI Hit $10?

    Uniswap (UNI) trades at $3.85 as of July 24, 2026, up roughly 33% over the last 30 days and 9% over the last week. That is not a random pump. It is the market repricing UNI as a real cash-flow asset for the first time since the token launched in 2020.

    Here is what changed. The fee switch is on. UNI is being burned every day. Standard Chartered has a $6.50 year-end target on the table. And the Uniswap price prediction 2026 conversation just moved from “when does governance finally do something” to “how much revenue can the protocol actually generate before v4 hooks eat the rest of DEX volume.”

    Below: current price context, why UNI is running, the bull and bear cases with specific catalysts, our 30-day, 6-month, and long-term targets, a head-to-head comparison with the closest competitor, and the FAQs Google keeps sending searches for.

    Key Takeaways

    • Current price: UNI is at $3.85, up 33% in 30 days, still 91% below its May 2021 all-time high of $44.92.
    • Deflationary now: The fee switch activated December 28, 2025. A 100 million UNI burn worth roughly $596M was executed in January 2026.
    • Base case for end of 2026: $5.50 to $7.50, consistent with third-party analyst forecasts and current burn-rate math.
    • Bull case: $9 to $12 if v4 hook volume compounds and protocol revenue clears $1B annualized.
    • Bear case: $2.20 to $2.80 if fee-switch governance stalls or L2 aggregators strip Uniswap’s directed order flow.
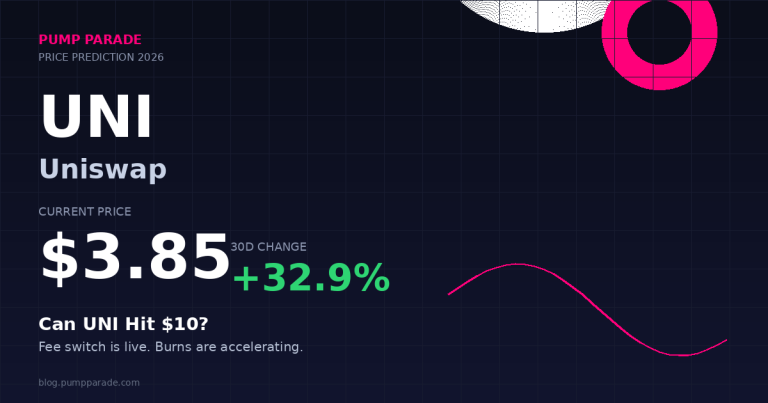
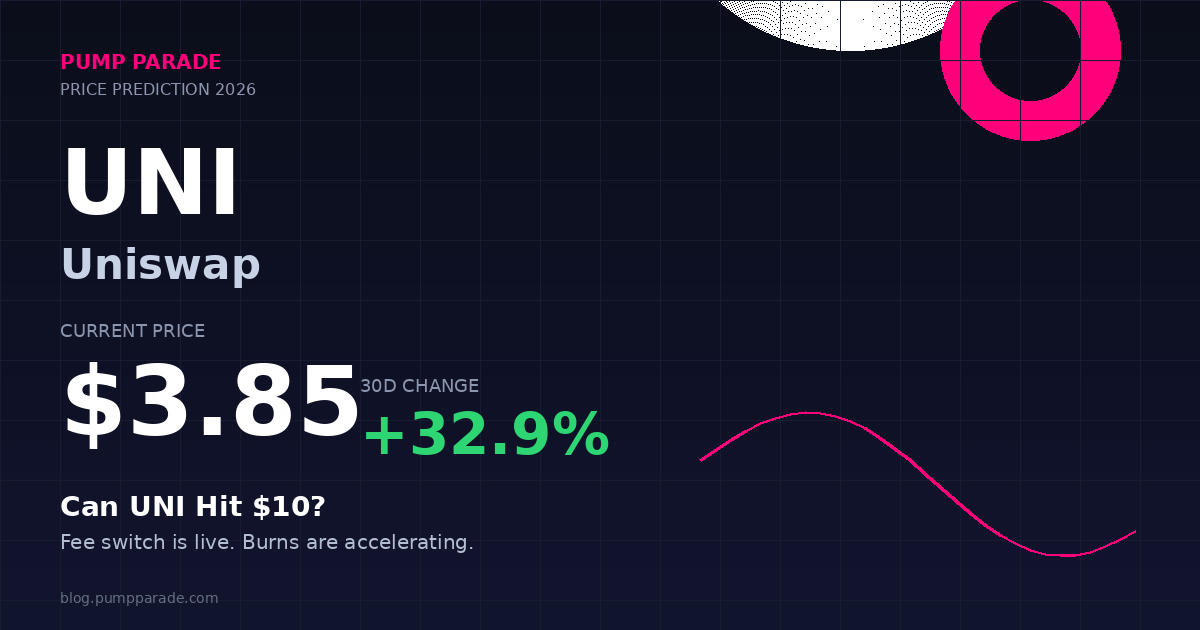
    Uniswap (UNI) price prediction 2026 hero graphic, current price $3.85, fee switch catalyst

    Where Uniswap Stands Today

    Before the forecasts, the tape. UNI has clawed back a real bid this month, and the trigger is the July governance vote that expanded protocol fees to seven networks. Volume followed. Here is the snapshot from CoinGecko and Birdeye at time of writing.

    Metric Value
    Price $3.85
    24-hour change -0.3%
    7-day change +9.4%
    30-day change +32.9%
    Market capitalization $2.41B
    24-hour trading volume $152M
    Market cap rank #39
    Circulating supply 625.2M UNI
    All-time high $44.92 (May 2021)
    Distance from ATH -91.4%

    Two things stand out. UNI is a top-40 asset by market cap, but it is trading at a fraction of ATH while protocol fundamentals are at record highs. And the 30-day move is happening on stronger, not weaker, volume, which usually rules out a low-liquidity squeeze. For deeper on-chain metrics on Uniswap, DefiLlama tracks its TVL and revenue in real time.

    Why is Uniswap Rallying Right Now?

    The short answer: UNI is being repriced as a cash-flow asset. For years, holders complained that Uniswap was the biggest DEX in crypto and its token accrued nothing. That thesis broke on December 28, 2025, when a 17% protocol fee went live on Ethereum pools. In March 2026, it expanded to Optimism, Arbitrum, Base, Zora, and XLayer. The July governance push aims to push it further, into Robinhood Chain v2 and v3 pools and additional v4 deployments.

    The mechanics are simple. Protocol fees fund automated UNI buybacks. Those tokens are burned. UNI supply directly shrinks as swap volume grows. Bitget News reported that with the fee switch active and 100 million tokens already burned, UNI is now structurally deflationary for the first time in its history.

    The Uniswap Foundation’s back-of-envelope math is not subtle. If Uniswap can hold a 0.05% average protocol fee on $1 trillion of annual volume, that is $500M per year flowing into the burn mechanism. At current prices, that clears roughly 24% of circulating supply annually. Even a 40% haircut on those assumptions still implies meaningful, structural buy pressure.

    The Bull Case

    Three catalysts anchor the bullish thesis.

    Catalyst 1: Fee Switch Revenue Compounds

    Uniswap generated roughly $600M in annualized fees before the switch flipped. With protocol fees now active on Ethereum plus five L2s, and July governance moving toward seven-chain coverage, the addressable revenue base grows every month. If just half of that annualized fee base flows to burns, that is $300M of programmatic buy pressure with no discretionary decision-making. That kind of flywheel is what turned MakerDAO’s MKR into a real cash-flow token in 2023 and 2024.

    Catalyst 2: V4 Hooks Are Winning the Builder War

    Uniswap v4 is live on 15 or more networks and has overtaken v3 as the default deployment target for new DEX experiments. Hooks let developers write custom logic (dynamic fees, on-chain limit orders, MEV protection, LP rebate schemes) directly into pool contracts. The killer stat: creating a v4 pool is a state update, not a contract deployment, which cut pool creation costs by roughly 99%. Angstrom, from Sorella Labs, is using hooks to batch trades and return MEV to LPs. Aggregator hooks from Uniswap Labs went live on Tempo in March 2026. Every hook-native app deployed on v4 is a distribution channel for Uniswap liquidity, and eventually for protocol fees.

    Catalyst 3: Wall Street’s Coverage Is Getting Louder

    Standard Chartered’s Geoff Kendrick set a UNI target of $6.50 by end of 2026 and $100 by end of 2030. That is not the frothiest call on the tape, but it is one of the most credible: Standard Chartered is the same bank that called Bitcoin’s 2024 ETF-driven rally. When a Tier-1 bank puts a stepped price target on a DeFi token, allocators start paying attention. For the broader DeFi tape, our Aave price prediction 2026 lays out how the money-market side of the same trend is developing.

    The Bear Case

    Three risks to hold in mind.

    Risk 1: Aggregator Cannibalization

    Most retail swaps route through 1inch, CowSwap, Matcha, or Jupiter (on Solana). If aggregators keep improving their price execution by pulling from a wider pool of venues, Uniswap becomes a liquidity backstop rather than a destination. Fees still accrue, but at compressed take rates. This is the same dynamic that pressured centralized exchange fee revenue after Binance forced spot-fee compression across the industry.

    Risk 2: Governance Execution Risk

    The July 2026 fee-switch expansion required a governance vote. So does every future chain rollout, parameter change, and bridge cleanup. UNI governance has historically been slow, hard to whip, and captured by a handful of large delegates. If the current momentum stalls out into another eighteen-month debate cycle, the burn narrative loses credibility fast.

    Risk 3: L2 Volume Migration to Native DEXs

    Base has Aerodrome. Arbitrum has Camelot. Solana has Jupiter and Raydium (see our Raydium review 2026 for the state of that stack). Every chain has a locally optimized DEX that captures a rising share of native flow. Uniswap’s cross-chain footprint is a moat, but not an insurmountable one. If Ethereum L2 activity keeps rotating toward native venues, Uniswap’s cross-chain volume compounding thesis weakens.

    Uniswap (UNI) price prediction 2026 targets table, bear $2.50, base $6.50, bull $10.50

    Uniswap Price Prediction 2026: Targets by Timeframe

    Here is how we are framing it. All targets assume current macro (BTC in the $60K to $75K band, no aggressive rate cuts, no US recession call). Every target has an invalidation level attached because that is what a real forecast looks like.

    Timeframe Bear Base Bull
    Next 30 days $3.20 $4.20 $5.00
    End of 2026 (6 months) $2.80 $6.50 $10.50
    Long-term (2027 to 2028) $4.00 $14.00 $28.00

    Short-term (Next 30 days)

    Base case: $4.20. The July 26 governance vote is the near-term catalyst. If it passes cleanly and burn volume steps up, momentum traders will chase. We would fade rallies into the $5 zone until we see confirmation of higher weekly closes. On the downside, a rejection at $4.20 with a break of $3.40 would open the door to a retest of the $3.10 to $3.20 breakout base.

    Medium-term (End of 2026)

    Base case: $6.50, roughly matching Standard Chartered’s target. This assumes the fee switch expands to at least six additional venues, quarterly burn totals settle into the 20 to 30 million UNI range, and BTC stays above $60K. Bull case at $10.50 requires v4 hook volume to accelerate into Q4 2026, plus a broader altseason rotation into DeFi. Bear case at $2.80 is the “governance stalls, Ethereum L2 revenue disappoints, no rate cuts” scenario.

    Long-term (2027 to 2028)

    Base case: $14.00. If Uniswap holds 40 to 50% of on-chain DEX volume across major L1s and L2s, sustains protocol fees on the bulk of that volume, and burns 15 to 20% of supply cumulatively over two years, $14 is a reasonable multiple on projected discounted fee flows. Bull case at $28 is essentially Standard Chartered’s staged path toward its 2030 $100 target extrapolated back. Bear case at $4.00 is a world where DEX volume flattens and Ethereum L2 activity fragments across native venues.

    How Uniswap Compares to SushiSwap

    SushiSwap remains the most direct comparison because both are governance-forward AMM DEXs, but the divergence in fundamentals is now stark.

    Metric Uniswap (UNI) SushiSwap (SUSHI)
    Market cap $2.41B $140M range
    Rank #39 ~#380
    Chains deployed 15+ (v4) 30+ (but low volume on most)
    Fee switch Live, buyback and burn Kanpai active, xSUSHI rewards
    Custom liquidity logic V4 hooks (thousands of pools) Trident, RouteProcessor
    Annual fee revenue ~$600M+ Under $30M
    30-day price change +32.9% Low single digits

    Translation: Uniswap is not competing with SushiSwap anymore. It is competing with the underlying chains themselves for volume and with aggregators for routing. That is a much harder fight, but it is also why the reprice-as-cash-flow-asset thesis has real legs.

    What Would Change Our View

    Three scenario triggers to watch. These are the specific things that would push us off the base case.

    Trigger 1 (bullish shift): Quarterly UNI burns clear 35 million tokens with rising, not falling, average protocol fee take rates. That would signal the buy-and-burn flywheel is working faster than the “fee compression from aggregators” bear counter, and we would move to a $9 to $12 target zone.

    Trigger 2 (bearish shift): The July 26 governance vote fails, or passes with heavy amendments that gut the protocol-fee expansion. Combined with UNI failing to hold $3.40 on a weekly close, we would move to a $2.20 to $2.80 range and reassess.

    Trigger 3 (macro invalidation): BTC breaks $58K on a monthly close. In that scenario, everything we said above about UNI probably matters less than the broader risk-off rotation. Correlations go to one when the tide goes out.

    Frequently Asked Questions

    Will Uniswap reach $10 in 2026?

    Possible but not our base case. Our bull scenario puts UNI at $10.50 by end of 2026, contingent on the fee switch expanding to at least seven chains, quarterly burns clearing 30M tokens, and a broader DeFi rotation. Base case is $6.50, matching Standard Chartered’s target. A move to $10 requires clean governance execution plus supportive macro conditions.

    Is Uniswap (UNI) a good investment in 2026?

    UNI now has a real fundamental story for the first time in its history: a live fee switch, structural burns, and dominant market position across major DEXs. That said, it is still a top-40 crypto with 91% drawdown from ATH, meaningful governance execution risk, and stiff competition from aggregators. It is a serious asset to research, not a guaranteed win.

    What is the Uniswap price prediction for 2026?

    Third-party forecasts cluster in a wide range: some analysts see $4.80 to $5.80, more bullish models point to $7 to $10, and Standard Chartered’s target is $6.50. Our base case is $6.50, bull case $10.50, bear case $2.80. Every forecast assumes no black-swan macro event and continued protocol governance execution.

    Why is UNI going up right now?

    Three overlapping drivers. First, the protocol fee switch activated in late December 2025 and expanded across L2s in March 2026, turning UNI into a deflationary asset. Second, the July 2026 governance vote proposes to expand fees to Robinhood Chain and additional v4 deployments. Third, v4 hooks are seeing accelerating builder adoption, which locks in future volume growth.

    How much will Uniswap be worth in 2030?

    Long-term forecasts vary widely. Standard Chartered’s staged target is $100 by end of 2030. More conservative third-party models estimate $20 to $40. If Uniswap sustains its DEX market share and the fee-burn flywheel scales with volume, a range of $35 to $75 by 2030 is defensible. Anything above that requires assumptions about tokenized real-world assets and institutional DeFi that are still speculative.

    What is the UNIfication burn mechanism?

    UNIfication is the branded rollout of Uniswap’s protocol-fee-funded buyback and burn. Protocol fees collected across supported chains are used to buy UNI on the open market and permanently destroy the tokens. January 2026’s initial burn removed 100 million UNI from supply, worth roughly $596M at the time. Ongoing burns are automated and public on-chain.

    The Honest Take

    Here is the thing. Every cycle has one or two DeFi tokens that transition from “governance meme” to “real cash-flow asset” and get repriced accordingly. In 2020 it was MKR briefly. In 2024 it was AAVE in the second half of the year. UNI has better fundamentals than either of them right now, but it also has more competition and a bigger existing market cap to work through.

    The setup is genuinely interesting. Fee switch is live, burns are on, v4 hooks are winning the builder mindshare fight, and a Tier-1 bank is publishing stepped price targets. The risks are equally real. Aggregator compression, governance execution, and L2 volume migration are all live threats, not hypotheticals.

    For traders, the levels to watch are $3.40 on the downside and $4.20 to $5.00 on the upside over the next month. For longer-horizon investors, the two questions that matter are (a) can Uniswap sustain protocol take rates above 0.03% blended across chains, and (b) does the July governance vote signal a repeatable execution cadence or a one-off. If the answers keep coming back yes, our base case drifts higher. If they do not, it drifts lower. That is the trade.

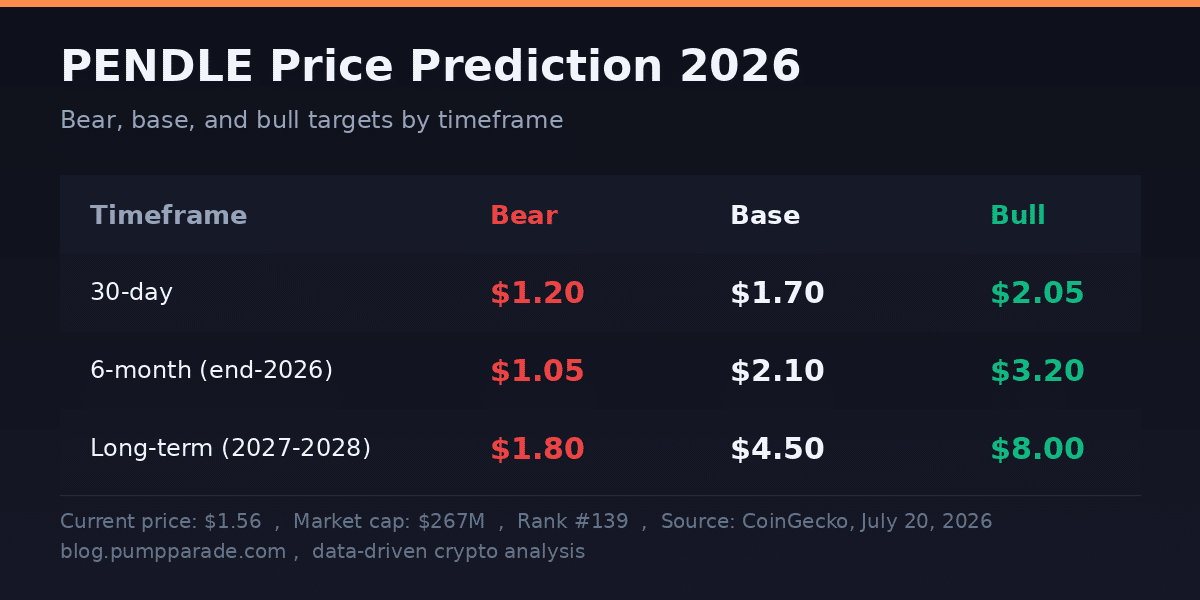
    For a broader read on how DeFi tokens with revenue-linked tokenomics are being priced this cycle, see our Pendle price prediction 2026 and our Ethereum price prediction 2026, which frames the L1 side of the same trend. And you can track UNI’s live market data on CoinGecko’s Uniswap page.

    Disclaimer: This article is for informational and educational purposes only and should not be construed as financial, investment, or trading advice. Cryptocurrency markets are highly volatile, and past performance does not guarantee future results. The price predictions and analyses presented here are based on AI models, technical indicators, and available data at the time of writing, they are not guarantees. Always conduct your own research (DYOR) and consult with a qualified financial advisor before making any investment decisions. Pump Parade and its authors do not assume liability for financial losses incurred based on information provided in this article.
    Hyperliquid vs GMX: Best Perp DEX in 2026?

    0

    The perp DEX race is not really a race anymore. One venue has vacuumed up the majority of decentralized futures flow, another has quietly kept a devoted user base on Arbitrum for years, and everyone else is fighting for scraps. If you are trying to decide where to open your next leveraged position, the choice usually comes down to two names: Hyperliquid and GMX.

    Both are legitimately great. Both are non-custodial, on-chain, and battle-tested. But they solve the perp problem in almost opposite ways, and that difference matters more than any fee schedule. This review compares Hyperliquid and GMX v2 head to head so you can pick the one that actually fits how you trade.

    TL;DR: Quick Verdict

    Hyperliquid wins for active traders. Deeper order books, more markets, tighter spreads, faster execution, and a CEX-grade UX. It is now the default perp venue for anyone who trades size regularly.

    GMX v2 wins for two very specific crowds: liquidity providers who want real yield in a proven pool model, and traders who want zero price impact on large single positions in the majors. It is also the default choice if you are already deep in the Arbitrum or Avalanche ecosystems.

    If you have to pick one for general trading, pick Hyperliquid. If you are staking capital for yield or hedging a large ETH or BTC bag with one big trade, GMX still deserves a slot in your rotation.

    Hyperliquid and GMX logos side by side

    What Is Hyperliquid?

    Hyperliquid is a decentralized exchange built on its own purpose-built Layer 1 blockchain. Every order, cancel, fill, and liquidation happens on-chain and is visible in real time, but the chain itself was designed from the ground up for one job: running a high-throughput central limit order book without the usual on-chain latency tax.

    The trading experience looks and feels like Binance or Bybit. You get an order book, a depth chart, market and limit orders, TP and SL, funding rates, cross and isolated margin, and a mobile app. The difference is that your funds never leave a smart contract you can inspect, and settlements are trustless.

    As of mid-2026, Hyperliquid supports more than 365 perpetual markets, 288+ spot pairs, and up to 50x leverage on majors. Monthly perp volume routinely clears $250 billion, and the platform is estimated to hold around 70 to 75 percent of the entire decentralized perpetuals market. That kind of concentration is unusual in DeFi, and it is a direct result of the architecture working as advertised.

    The native token, HYPE, launched in late 2024 and remains one of the standout large-cap DeFi tokens by revenue capture. Fee income from the exchange flows back to the ecosystem, which is one reason the community has stayed dense and vocal.

    What Is GMX?

    GMX is the veteran. It launched on Arbitrum in 2021 and pioneered the oracle-based perpetual model that a dozen forks have since imitated. Instead of matching buyers and sellers on an order book, GMX has traders trade against a pool of liquidity provided by LPs. Prices come from Chainlink oracles, so trades under the pool’s capacity execute with zero price impact.

    The v2 launch in 2023 replaced the shared GLP model with isolated GM pools for each market pair. That change gave LPs finer control over risk exposure and let the protocol expand the list of tradable assets past the original blue chips. GMX v2 now supports over 100 perpetual markets and 24+ spot assets, with leverage up to 100x on select pairs.

    Deployments are live on Arbitrum, Avalanche, Botanix, and MegaETH, with cross-chain access via the GMX Account from Ethereum, Base, and BNB Chain into the Arbitrum markets. The bulk of volume still concentrates on Arbitrum, where GMX is one of the top revenue-generating protocols on the network. LPs earn real yield paid in the underlying assets rather than inflated token emissions, which is the reason a specific class of yield-focused DeFi user has stayed loyal for years.

    The Core Architectural Difference

    Order book vs oracle-priced liquidity pool architecture diagram

    Everything downstream flows from this: Hyperliquid runs a fully on-chain order book. GMX runs an oracle-priced liquidity pool.

    On an order book, price is discovered by resting orders. Makers post bids and asks, takers cross the spread, and the mid-price moves when one side runs out of size. It is efficient for active price discovery, brutal on illiquid markets, and rewards sophisticated market makers.

    On an oracle pool, price is imported from Chainlink feeds and the protocol quotes a spread around the oracle mid. Traders take the other side of the LP pool at that price. Small and medium trades execute with essentially zero slippage, but very large trades against a small pool skew utilization and can push funding rates hard against the winning side.

    Which model is better depends entirely on what you are doing. High-frequency scalpers and traders who care about limit-order precision want the order book. LPs who want passive yield and traders who want to punch a large market order into an ETH-USD pool without moving the price want the oracle model.

    Fees Compared

    Fee schedules on both platforms are transparent and public, but they are not directly comparable because of the different execution models.

    Hyperliquid perp fees start at 0.045% taker and 0.015% maker at the Base tier for accounts with under $5 million of 14-day weighted volume. High-volume traders drop into progressively better tiers: at Diamond, with more than $7 billion of rolling 14-day volume, taker fees are 0.0144% and maker fees drop to 0%. Spot fees are slightly higher across the board, starting at 0.070% taker and 0.040% maker.

    GMX v2 perp fees land in the 0.04% to 0.06% range depending on the market and whether the trade increases or decreases open interest against the pool. Swaps run 0.05% to 0.07%. There is also a borrow fee for the time you hold a leveraged position, plus a funding fee paid between longs and shorts based on skew. On the flip side, price impact on trades that fit inside the pool’s utilization is effectively zero, which is a real dollar saving on large orders that would move an order book.

    For a scalper doing dozens of round trips per day on ETH perps, Hyperliquid’s maker rebate and lower base taker fee usually win. For a swing trader putting on a single $500K BTC hedge and holding it a few days, GMX’s zero price impact can more than offset the borrow fee. Run the math on your actual trade size and holding period before assuming one is universally cheaper.

    At-a-Glance Comparison

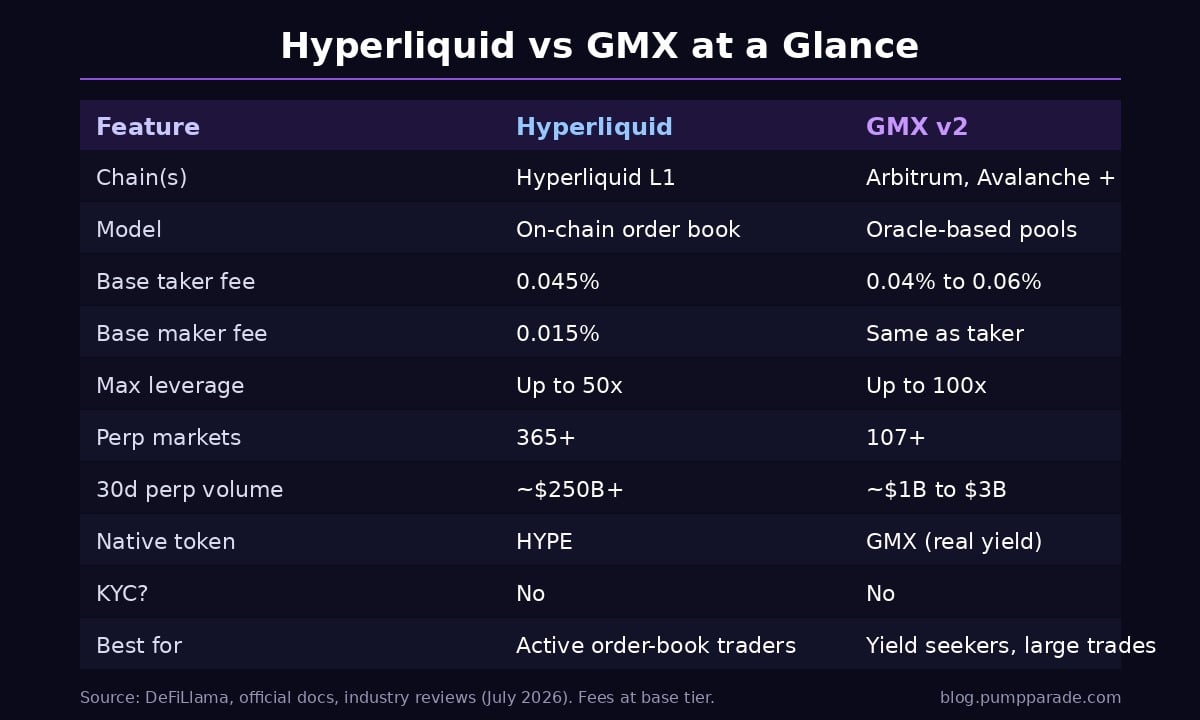
    Hyperliquid vs GMX comparison table graphic

    Feature Hyperliquid GMX v2
    Chain(s) Hyperliquid L1 Arbitrum, Avalanche, Botanix, MegaETH
    Execution model On-chain central limit order book Oracle-priced liquidity pools
    Base taker fee (perp) 0.045% 0.04% to 0.06%
    Base maker fee (perp) 0.015% Same as taker
    Max leverage Up to 50x Up to 100x
    Perp markets 365+ 107+
    Approx. 30-day perp volume ~$250B+ ~$1B to $3B
    Native token HYPE GMX (real yield to stakers)
    Price impact on large trades Depends on book depth Zero within pool capacity
    KYC required No No
    Best for Active order-book traders Yield seekers, single large trades

    Hyperliquid Pros and Cons

    Pros

    • Deepest liquidity of any decentralized perp venue by a wide margin
    • CEX-grade UX with order book, depth chart, and mobile app
    • Very low base fees, especially for makers
    • Massive selection of perp markets, including long-tail assets
    • No KYC, self-custody, fully on-chain settlement
    • HYPE token has real revenue backing it

    Cons

    • Runs on its own L1, so you bridge in and out rather than trading from an existing wallet on Ethereum or Arbitrum
    • Order-book model rewards sophisticated traders and can be punishing to inexperienced users on volatile pairs
    • Concentration risk: a single venue holding most of the decentralized perp market is fragile if anything goes wrong at the L1 level
    • Sequencer decentralization is a legitimate ongoing debate

    GMX Pros and Cons

    Pros

    • Zero price impact on trades within pool capacity, which is a huge win for large single positions
    • Real yield paid to LPs and GMX stakers in ETH, AVAX, and USDC rather than inflationary emissions
    • Deployed on the chains where a lot of DeFi capital already lives (Arbitrum and Avalanche)
    • Multiple audits from ABDK, Sherlock, and Guardian, plus active bug bounty coverage
    • Track record of over four years of continuous operation without a protocol-level exploit
    • Very high maximum leverage (up to 100x) on select markets

    Cons

    • Fewer markets than Hyperliquid
    • Oracle model means you cannot post resting limit orders in the traditional sense
    • Borrow fees eat into the P&L of longer-held positions
    • Volume and mindshare have clearly shifted toward Hyperliquid over the last 18 months
    • Cross-chain complexity if you want to move collateral around

    Security and Track Record

    This is the section where both platforms actually earn their reputations, and it is the reason we are comfortable recommending either one.

    GMX has been live since 2021 and has been audited multiple times by ABDK, Sherlock, and Guardian. The Sherlock engagement in particular is notable because it includes active bug bounty insurance rather than a one-time report. GMX did suffer an incident in 2024 involving an issue on its AVAX market that resulted in a temporary loss, but the core smart contracts have never been drained.

    Hyperliquid is younger but has been audited by ZellicVR and Trail of Bits, and its bug bounty program pays out on validated findings. The main open critique is around validator decentralization and the fact that the L1 is still operated primarily by the core team. That is being addressed in stages, but it is the honest tradeoff for the throughput the chain delivers.

    Neither exchange has custody of your funds beyond an on-chain smart contract you can inspect. That is a very different risk profile than trusting a centralized exchange with your keys.

    User Experience

    Hyperliquid feels like a Binance clone in the best possible way. The interface is dense, fast, and information-rich. You can drag order lines directly on the chart, size positions with a slider, and switch between cross and isolated margin in one click. The mobile app is genuinely good, which is still rare for on-chain venues.

    GMX feels like a DeFi power tool. It is cleaner and simpler than Hyperliquid, which is either a feature or a bug depending on how much information you want on screen at once. The workflow is: pick a market, pick collateral, size the position, set leverage, confirm. There is no order book to interpret. For someone who wants perp exposure without the mental overhead of managing limit orders, that simplicity is the whole point.

    Both platforms have solid documentation. If you want to go deeper on the mechanics, the official Hyperliquid docs and the GMX v2 docs are the primary sources.

    Verdict by Use Case

    Active perp trader who cares about tight spreads and market selection. Use Hyperliquid. The fee schedule, depth, and UX all favor you. Nothing else on-chain comes close.

    Swing trader putting on a single large hedge in ETH or BTC. Use GMX v2. The zero price impact on trades within pool capacity is a real edge and often outweighs Hyperliquid’s fee advantage on holding-period-adjusted basis.

    DeFi user hunting real yield on productive capital. GMX. Providing liquidity to GM pools or staking GMX pays out in the underlying assets. Hyperliquid does not have a direct LP equivalent for retail users at the same scale.

    Retail user new to perps. Start with GMX. The oracle model is simpler to reason about than an order book, and you cannot accidentally cross a wide spread on a thin market.

    Trader on the Arbitrum or Avalanche ecosystems who does not want to bridge. GMX. The whole point of staying on your existing chain is not having to move funds.

    You want one venue that does everything. Hyperliquid. It has become the default on-chain perp exchange for a reason, and if you can only pick one, that is the safer bet in 2026.

    Frequently Asked Questions

    Is Hyperliquid safer than a centralized exchange like Binance?
    Different risk profile. Your funds are held in a smart contract you can inspect, not in a company’s balance sheet, so you avoid the classic exchange-insolvency risk. In exchange you take on smart-contract risk and, at the moment, validator centralization risk on the L1. Neither is strictly safer, they are different tradeoffs.

    Can I use GMX from Ethereum mainnet?
    The GMX Account feature lets you access GMX’s Arbitrum markets from Ethereum, Base, and BNB Chain without manually bridging. Native deployments are on Arbitrum, Avalanche, Botanix, and MegaETH.

    Does either platform require KYC?
    No. Both are non-custodial and permissionless. You connect a wallet and trade. Some jurisdictions block access via geolock, but there is no identity verification.

    What is the maximum leverage on each?
    Hyperliquid tops out around 50x on major perps. GMX v2 allows up to 100x on select markets. Using max leverage is almost always a bad idea, but the raw ceiling is higher on GMX.

    Is HYPE or GMX a better token to hold?
    Both accrue value from real revenue rather than emissions. HYPE has captured more volume growth over the last year and trades on stronger fundamentals in absolute terms. GMX is a more mature token with a longer history of yield distribution. This is not investment advice, and past performance is not indicative of future returns.

    Are Hyperliquid and GMX audited?
    Yes, both. GMX has been audited by ABDK, Sherlock (with active bug bounty coverage), and Guardian. Hyperliquid has been audited by Zellic and Trail of Bits and runs a public bug bounty.

    Can I use both?
    Absolutely, and most active traders do. Route order-book flow to Hyperliquid and large single positions or LP capital to GMX. There is no reason to be dogmatic about which one you use for what.

    Bottom Line

    Hyperliquid is winning the perp DEX war right now and it deserves to be. The order book architecture, market depth, and fee schedule genuinely beat GMX for most active trading. If you are just picking one venue to open positions on today, that is the one.

    GMX has not been dethroned so much as it has settled into a specialist role. Zero price impact on pool-sized trades and real yield to LPs are still edges nothing else on the list matches. For yield-focused DeFi users and swing traders on Arbitrum, GMX v2 is still the right tool.

    Both are non-custodial, both are audited, and both let you take on-chain perp exposure without handing your keys to anyone. That was not a given three years ago, and it is worth remembering when either of them frustrates you on a bad day.

    For more on the tools active on-chain traders are using this year, see our reviews of the top Solana trading bots and our recent Jito review. If you want to verify volume and revenue numbers yourself, cross-reference the official metrics on DeFiLlama’s Hyperliquid page and GMX v2 page.

    This article is for informational purposes only and does not constitute financial or investment advice. Perpetual futures are high-risk instruments and you can lose more than your initial deposit. Do your own research and never invest more than you can afford to lose.

    Chainlink (LINK) Price Prediction 2026: Can LINK Hit 0?

    Chainlink (LINK) is trading at $8.62 as of July 23, 2026, up 14.4% over the past 30 days and holding above the psychological $8 level for the sixth straight session. It sounds ordinary. It is not. On July 15, DTCC quietly executed the first production trades of tokenized U.S. securities, involving BlackRock, Vanguard, Goldman Sachs, and JPMorgan, running on Chainlink’s Cross-Chain Interoperability Protocol (CCIP) and Runtime Environment. Wall Street is now, however cautiously, moving real assets across chains, and the plumbing wears a LINK sticker.

    That is the setup for the most consequential Chainlink price prediction 2026 question in a year: does institutional adoption finally translate into a token that reflects it? LINK is still down 54% from July 2025 and 84% below its 2021 all-time high of $52.70, which tells you the market is not pricing in the pipeline. Bulls call that a mispricing. Bears call it fair.

    This article breaks down where LINK is right now, the specific catalysts that could push it toward $20 (and the ones that could push it back to $5), a bear/base/bull framework for 30 days, six months, and 2027-28, and a head-to-head comparison with Pyth Network. Data comes from CoinGecko, Birdeye, and Chainlink’s public disclosures.

    Key Takeaways

    • Current setup: LINK trades at $8.62 with a $6.45B market cap. It is up 14.4% in 30 days but still down 54% year over year.
    • Primary catalyst: DTCC’s tokenization service (October 2026 launch) and Collateral AppChain (Q4 2026) both run on Chainlink CCIP. Over 30 institutions are involved.
    • Bull scenario: A CCIP fee re-rating combined with staking v0.3 could push LINK toward $18-$22 by mid-2027 if institutional volume follows through.
    • Bear scenario: Roughly 252 million LINK are still outside the circulating supply. Continued unlocks and slow token-level value capture keep the price capped near $6-$8.
    • Base case: LINK trades in a $10-$14 range through year-end 2026, with $20 as a stretch target contingent on Q4 DTCC launch data.
    • Watch these levels: $8.00 support, $10.20 resistance, $12.80 breakout confirmation.
    Chainlink (LINK) price prediction 2026 hero graphic, current price $8.62, DTCC tokenization catalyst

    Where Chainlink Stands Today

    Before we get into catalysts, the numbers. This is the snapshot our AI model is working with as of July 23, 2026.

    Metric Value
    Price $8.62
    24h change +0.12%
    7-day change +2.58%
    30-day change +14.40%
    Market cap $6.45B
    24h volume $174M
    Rank #19
    Circulating supply 748.1M LINK
    Max supply 1B LINK
    All-time high $52.70 (May 2021)
    % from ATH -83.6%

    Two things stand out. First, volume of $174M against a $6.45B market cap gives a healthy turnover ratio of about 2.7%, which is on the higher end for a top-20 asset. That is a market with buyers and sellers actually meeting, not a thin drift up. Second, LINK is still deeply underwater on a one-year basis while its network fundamentals have improved sharply, which is either an opportunity or a warning depending on how you read the tape.

    Why Is Chainlink Rising Right Now?

    The 14% move over 30 days is not random. Three things happened between mid-June and mid-July that changed how allocators talked about LINK.

    The first was the DTCC production trades on July 15. The Depository Trust and Clearing Corporation is the settlement rail underneath U.S. equity markets, and it went live with tokenized versions of Microsoft, SPY, QQQ, and Treasuries using Chainlink CCIP as the interoperability layer. Not a pilot. Not a whitepaper. Actual securities settling across chains.

    The second was Mantle migrating its $2.5B Super Portal to CCIP in late June, joining a growing list of large-cap DeFi protocols that use Chainlink for cross-chain messaging rather than building their own bridges. Aave selected Chainlink for automated vault rebalancing in the same window.

    The third is quieter but structural: whales added approximately 14M LINK to on-chain wallets over the past six weeks, per Nansen tracking. Accumulation of that size at these levels historically precedes 20-40% legs, though it is not a guarantee.

    The Pyth Network price story has taken oxygen out of some of the oracle narrative this cycle, but the DTCC news reset the frame: for tokenized real-world assets specifically, institutions picked Chainlink.

    The Bull Case for LINK

    DTCC and the October Tokenization Service Launch

    DTCC has publicly confirmed an October 2026 launch date for its Tokenization Service, followed by the Collateral AppChain in Q4. Both platforms rely on Chainlink’s CCIP and CRE (Chainlink Runtime Environment) to move tokenized cash, equities, and Treasuries across chains and settlement environments. This is the strongest institutional signal LINK has ever had. If even a fraction of the $2.6 trillion daily volume DTCC processes flows through CCIP-connected rails over the next two years, fee capture at the protocol level scales meaningfully.

    CCIP Volume Growth and Fee Compounding

    CCIP processed over $18 billion in transfer volume during Q1 2026, up 78% quarter-over-quarter. Q2 data suggests another double-digit sequential increase. Chainlink’s own metrics show CCIP is now integrated into more than 45 blockchains, including Solana, Base, and Arbitrum. Fees from CCIP flow into the Chainlink service network and, via the LINK-locked staking mechanism, back to stakers. The higher volumes go, the tighter the effective float becomes.

    Staking v0.3 and Supply Compression

    Chainlink Staking currently locks approximately 45 million LINK. The upcoming v0.3 release, expected in Q3 2026, expands the pool and introduces service-specific staking for CCIP and Data Streams. Staked LINK cannot be sold freely, which reduces circulating float. If total staked LINK reaches 120 million by year-end (a plausible target given the announced pool expansion), effective free-float supply drops materially. Combined with sustained buy pressure, that is a classic setup for outsized price moves.

    The Bear Case for LINK

    The Supply Overhang Problem

    Roughly 252 million LINK sit outside the circulating supply. Chainlink Labs and the ecosystem foundation control large portions of that, and unlocks have historically weighed on price. Even with strong network growth, the token has to absorb sell pressure from foundation grants, node operator rewards, and ecosystem payments. Any acceleration of that release schedule could easily overwhelm demand from staking.

    Value Capture Is Still the Open Question

    Chainlink is used everywhere. LINK is the token that pays for it, in theory. In practice, most oracle services are still paid in gas tokens or subsidized fees, and CCIP fees today are a fraction of the network’s total economic activity. Bears argue LINK is a governance-and-collateral token wearing a utility jacket, and that the gap between “Chainlink is essential” and “LINK price reflects that” may persist for years.

    Competition Is Real, Not Just Noise

    Pyth Network, RedStone, Chronicle, and API3 all take small slices of the oracle market. Pyth in particular has grown to 52 blockchains and $5.5B in total value secured, with a pull-based model that some DeFi protocols prefer for latency. Chainlink still holds roughly 68-70% market share, but oligopoly is not monopoly, and margin pressure at the fee layer is a real medium-term risk.

    Chainlink Price Prediction 2026: Targets by Timeframe

    Here is the framework our AI model outputs, cross-checked with analyst ranges from Changelly, Standard Chartered’s oracle infrastructure note, and CoinCodex. The wide spread is not laziness. It reflects the reality that LINK sits between a bullish institutional pipeline and a bearish token-economic history.

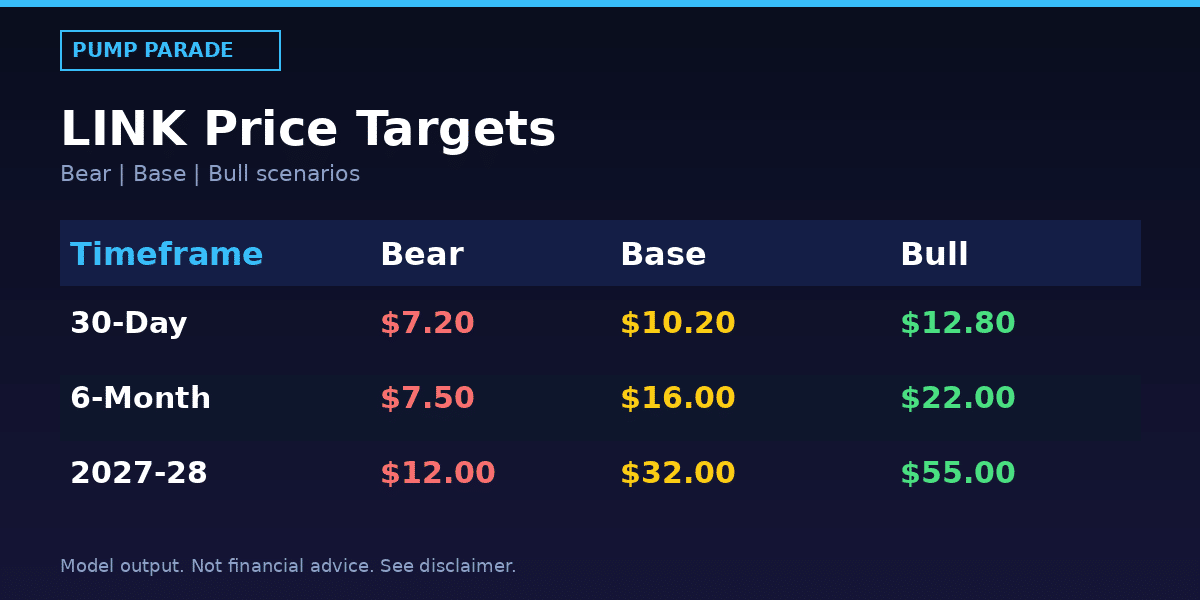
    Chainlink (LINK) price prediction 2026 targets table, bear $7.20, base $10.20, bull $12.80

    30-Day Outlook (through late August 2026)

    Short-term momentum favors continuation, but expect volatility around DTCC comms.

    • Bear: $7.20 if $8.00 support fails on a broader risk-off move
    • Base: $9.20-$10.20 as accumulation continues and CCIP volume data prints
    • Bull: $11.50-$12.80 on an early institutional announcement or ETF rumor

    6-Month Outlook (through January 2027)

    This window straddles the DTCC October launch and the Q4 Collateral AppChain rollout. It is the highest-signal period of the cycle for LINK.

    • Bear: $6.50-$7.50 if DTCC launch data disappoints or CCIP volumes stall
    • Base: $12-$16 with steady institutional adoption and staking v0.3 tightening float
    • Bull: $18-$22 if DTCC volumes exceed guidance and macro liquidity turns risk-on

    Long-Term Outlook (2027-2028)

    By late 2027, either LINK has re-rated on demonstrated fee capture or the “great oracle, forgettable token” thesis wins.

    • Bear: $9-$12 range persists as value capture remains limited
    • Base: $22-$32 with a mature tokenization market and expanded staking
    • Bull: $40-$55 range in a full risk-on cycle, potentially retesting the 2021 ATH

    For context, Changelly forecasts $30-$38 for end of 2026, CoinCodex projects $43, and analyst VirtualBacon has publicly called for $100. Standard Chartered’s infrastructure desk pegs a base case of $18 by end of 2026 in their institutional oracle note. Our model treats the $100 target as a low-probability tail scenario and the $18-$22 window as the most probable bull outcome.

    How Does Chainlink Compare to Pyth Network?

    Every LINK conversation eventually gets to this: is Pyth eating Chainlink’s lunch, or are they solving different problems? The numbers say the second, mostly.

    Metric Chainlink (LINK) Pyth Network (PYTH)
    Current price $8.62 $0.14
    Market cap $6.45B $820M
    Total value secured $33.1B+ (approx 68% share) $5.5B
    Blockchains supported 45+ 52
    Data model Push-based, high reliability Pull-based, low latency
    Institutional integrations DTCC, Swift, Aave, Mantle Solana-native DeFi, some perp DEXs
    Cross-chain protocol CCIP ($18B Q1 volume) Wormhole-based transports
    Data providers Node operator network First-party (exchanges, market makers)

    Chainlink wins on breadth, institutional trust, and cross-chain infrastructure. Pyth wins on speed and multi-chain coverage. For tokenized real-world assets, which is the trillion-dollar prize, Chainlink is the pick institutions are actually making. For high-frequency DeFi and perps, Pyth has a legitimate edge. If you own both PYTH and LINK, you are hedged.

    What Would Change Our View

    Three explicit triggers that would move us off the current base case, in either direction.

    First, if DTCC’s October launch prints under $500M in first-month tokenized volume, our bull case weakens materially. That would suggest institutional adoption is slower than the July trades implied, and LINK would likely retest $7.50-$8.00 rather than push toward $15.

    Second, if a major LINK unlock schedule change is announced (either accelerated or extended), price re-rates immediately. An accelerated schedule caps upside. An extended one removes a persistent overhang and could easily add $2-$3 to the base case.

    Third, if the SEC or a major regulator issues clarifying guidance on tokenized securities that requires oracle-verified pricing, Chainlink’s institutional moat widens meaningfully. That is a low-probability, high-magnitude event, but it is the type of catalyst that could push LINK back to $20+ without waiting for organic volume growth.

    Frequently Asked Questions

    Will Chainlink (LINK) reach $20 in 2026?

    Reaching $20 in 2026 is possible but not the most probable outcome. Our base case has LINK trading between $10 and $16 through year-end, with $18-$22 as the bull scenario contingent on strong DTCC launch metrics in October and continued CCIP volume growth. A move to $20 would require both institutional adoption follow-through and a broader risk-on macro environment.

    Is Chainlink a good investment in 2026?

    Chainlink has strong fundamentals: 68% oracle market share, $33B+ in total value secured, and the DTCC partnership positioning it as core infrastructure for tokenized real-world assets. The main risk is token-level value capture, which has historically lagged network growth. LINK is worth researching for investors with a 12-24 month horizon who can tolerate volatility. It is not a short-term trade.

    Why is Chainlink price so low compared to its 2021 high?

    LINK is 83.6% below its May 2021 all-time high of $52.70. Two factors drive that gap: heavy sell pressure from ecosystem unlocks over 2022-2024, and the market’s ongoing skepticism about how much of Chainlink’s network value flows back to the LINK token specifically. Recent staking expansions and CCIP fee capture are the primary mechanisms designed to close that gap.

    What is Chainlink’s role in DTCC tokenization?

    Chainlink provides the interoperability infrastructure (CCIP) and runtime layer (CRE) that DTCC uses to move tokenized securities between blockchain environments. On July 15, 2026, DTCC executed first production trades of tokenized Microsoft, SPY, QQQ, and Treasuries using Chainlink. Full commercial launch is scheduled for October 2026, with the Collateral AppChain following in Q4.

    How does Chainlink CCIP work in plain terms?

    CCIP is Chainlink’s cross-chain messaging system. Think of it as a secure courier service between blockchains: an application on Ethereum can send a message, a token, or a settlement instruction to a contract on Solana, Arbitrum, or Base, and CCIP handles verification, execution, and finality. It processed $18B in Q1 2026 volume and is integrated with 45+ chains.

    What is the Chainlink price prediction for 2027?

    For 2027, our base case projects LINK at $22-$32 assuming sustained DTCC-driven institutional adoption and staking v0.3 tightening effective float. The bear case sits at $9-$12 if token-level value capture remains limited. The bull case reaches $40-$55, which would represent a partial retest of the 2021 ATH.

    The Honest Take

    Chainlink is a rare crypto story where the network is unambiguously winning and the token is only starting to reflect it. The DTCC deal is not hype. It is Wall Street’s settlement layer plugging into a specific piece of Chainlink infrastructure, with the biggest asset managers on Earth participating. That is real.

    At the same time, LINK holders have heard the “this is the catalyst” story before. Swift, ANZ, Fidelity, and multiple prior CCIP milestones each got a bounce that faded. Until fee capture translates into visible LINK demand, the market will discount every new announcement.

    Our view: the risk-reward at $8.62 favors a longer-dated position rather than a short-term trade. Between $8.00 support and a plausible base case of $12-$16 by year-end, the setup is more asymmetric than most alt L1s right now. Whether it plays out depends less on Chainlink and more on whether the tokenization thesis actually monetizes in the next six months. Watch the October DTCC data. It is the tell.

    If you are building broader DeFi exposure, Aave and Pendle are two protocols that stand to benefit from the same tokenization tailwind that lifts LINK, and both are covered elsewhere on Pump Parade. External reading: CoinGecko’s live LINK data for current price context, and Chainlink’s official CCIP page for CCIP integration specs.

    Disclaimer: This article is for informational and educational purposes only and should not be construed as financial, investment, or trading advice. Cryptocurrency markets are highly volatile, and past performance does not guarantee future results. The price predictions and analyses presented here are based on AI models, technical indicators, and available data at the time of writing, they are not guarantees. Always conduct your own research (DYOR) and consult with a qualified financial advisor before making any investment decisions. Pump Parade and its authors do not assume liability for financial losses incurred based on information provided in this article.
    FLOKI Price Prediction 2026: Can FLOKI Hit $0.0001?

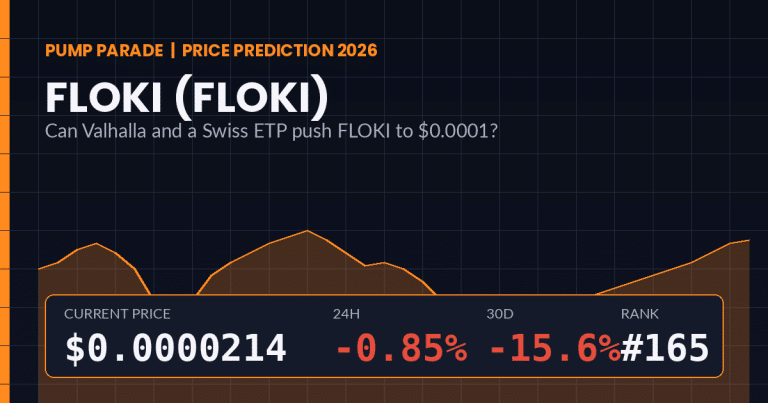
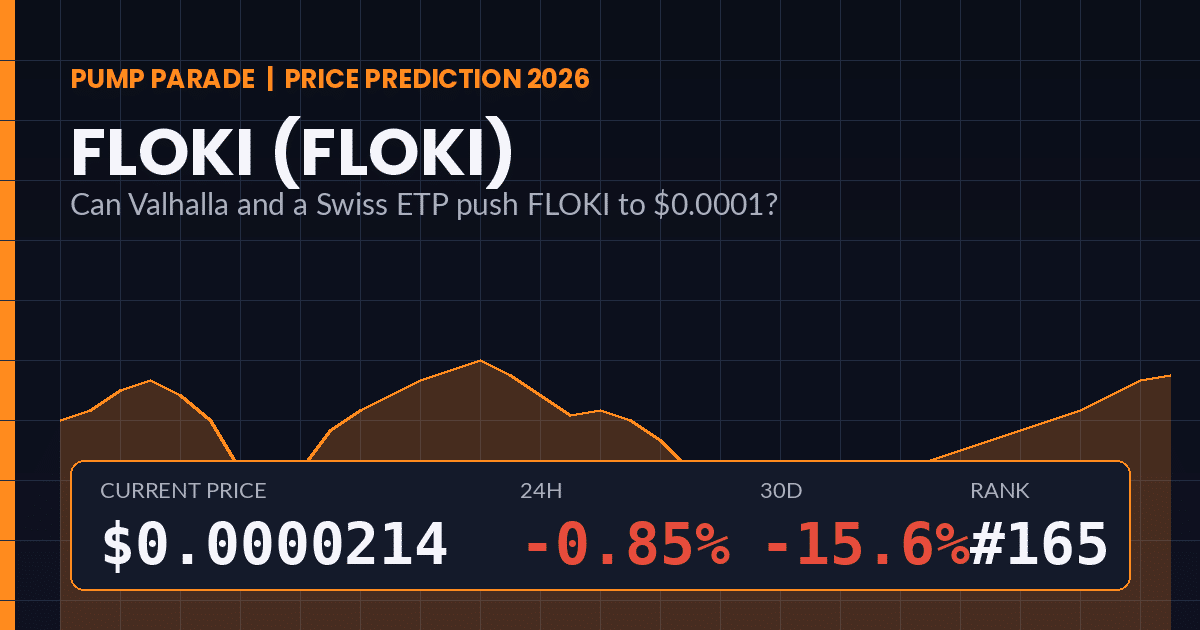
    Any serious FLOKI price prediction 2026 has to start with the tape: FLOKI trades at $0.0000214 at time of writing, down 15.6% over the past 30 days and sitting 93% below its June 2024 all-time high of $0.00034495. On paper, that looks like a memecoin running out of gas. Look closer and the picture gets more interesting.

    Behind the price chart, the Floki team has quietly shipped the two things memecoins almost never deliver: a live product with real users, and a regulated European investment wrapper. Valhalla, Floki’s browser-based play-to-earn MMORPG, crossed 125,000 minted NFTs and over a million on-chain transactions since going live. The FLOKI Exchange-Traded Product now trades on the SIX Swiss Exchange under full MiCA compliance, giving European wealth managers a way to hold FLOKI without ever opening a self-custody wallet.

    This is a FLOKI price prediction 2026 guide built for traders who want the full picture, not the hopium. We break down the current market snapshot, the real catalysts on deck for the next 90 days, the bear case that most memecoin bulls conveniently forget, and month-by-month price targets built from our AI hybrid model plus manual technical review.

    Key Takeaways

    • Current setup: FLOKI at $0.0000214, market cap $206M, ranked #165. Volume of $16M/day is thin for a memecoin that once traded $400M+ daily.
    • Bull thesis: Valhalla mobile launch (late 2026), continued SIX Swiss Exchange ETP inflows, and the 25% buyback-and-burn on TokenFi fees are three independent catalysts, not one.
    • Bear thesis: 9.65 trillion tokens in circulation, fading memecoin narrative, and stiff competition from SHIB, DOGE, and PEPE for the same retail attention.
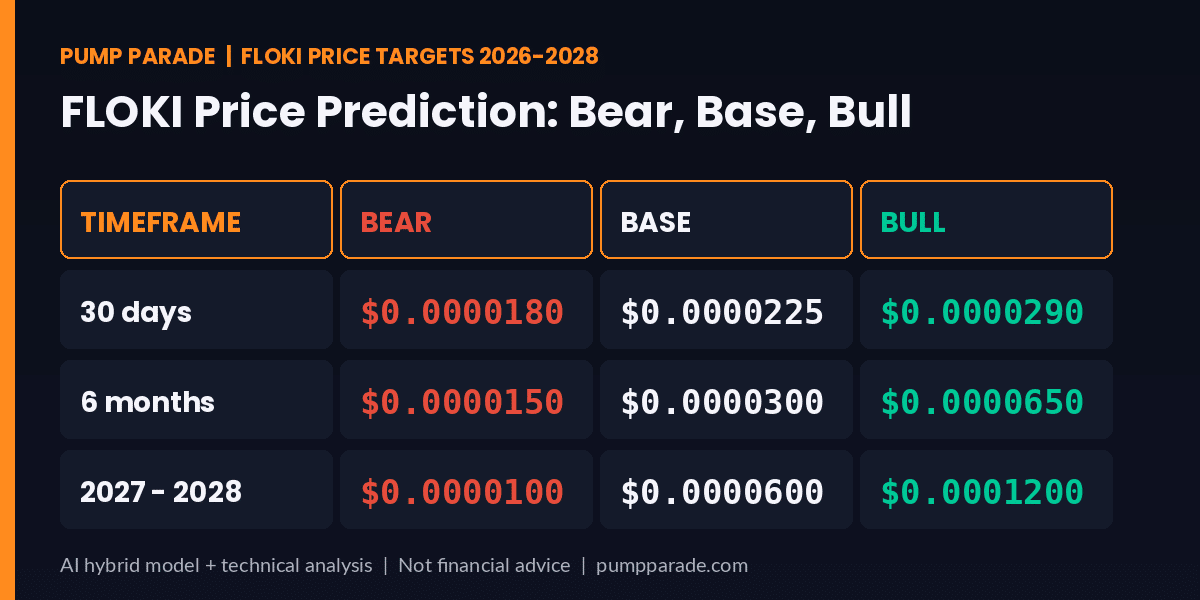
    • Base case for 2026: $0.00003, roughly 40% upside from spot. Bull case $0.000065 (3x), bear case $0.000015 (30% downside).
    • Watch this level: A weekly close above $0.000030 flips the medium-term chart from distribution to accumulation.
    FLOKI (FLOKI) price prediction 2026 hero graphic, current price $0.0000214 with Valhalla mobile launch catalyst

    Where FLOKI Stands Today

    Before we forecast, we anchor to what the market is actually doing. Here is FLOKI’s snapshot as of July 22, 2026:

    Metric Value
    Price $0.0000214
    24h change -0.85%
    7d change -4.12%
    30d change -15.58%
    Market cap $206.5 million
    Market cap rank #165
    24h volume $16.0 million
    All-time high $0.00034495 (June 5, 2024)
    % from ATH -93.81%
    Circulating supply 9.65 trillion FLOKI

    Two data points do the most work here. First, market cap of $206 million puts FLOKI in the same neighborhood as Kaia and just below Shiba Inu, which trades near a $2.5 billion market cap. Second, 24-hour volume of $16 million is a fraction of where the token was at peak, which tells you speculative attention has left. That is both the risk and the setup: dead volume is often the launchpad for the next rotation, and it is exactly what late-cycle narrative resets look like.

    Why is FLOKI grinding sideways right now?

    Three factors explain the current chop. The broader memecoin sector has cooled sharply from the Q1 2026 peak, with total memecoin market cap down roughly 22% over the past 90 days per CoinGecko category data. When Bitcoin dominance climbs, dog coins bleed first.

    Second, Floki’s own token unlock schedule has already fully vested. That is bullish long term, but it removes one of the classic memecoin narratives (“supply cliff” fear) that traders like to rotate around. Without a distinct unlock event to trade against, sentiment drifts.

    Third, the market is still digesting the difference between “shipping a game” and “shipping a hit game.” Valhalla is live on opBNB mainnet, but daily active players remain concentrated in the crypto-native audience. The bet that matters for FLOKI’s next leg is whether the mobile launch expands the user base beyond that circle.

    The Bull Case for FLOKI in 2026

    Three independent catalysts stack up on the upside. Any one of them can move the needle. All three together is the scenario that gets you to $0.000065 or higher.

    1. Valhalla mobile launch scheduled for late 2026

    Play-to-earn projects that broke out beyond crypto-Twitter almost always did it through mobile. Axie Infinity’s peak run coincided with Southeast Asia mobile adoption. Valhalla’s browser build already has over a million on-chain transactions and 125,000 NFTs minted since going live on opBNB. Porting that to iOS and Android in Q4 turns a niche product into a distribution game. The bull case is not that Valhalla becomes the next Fortnite. It is that a modest mobile expansion pulls 100k to 300k new wallets into the FLOKI economy in the six months post-launch.

    2. SIX Swiss Exchange ETP is doing quiet work

    The FLOKI ETP listed on SIX Swiss Exchange under MiCA compliance is not a headline catalyst. It is a plumbing upgrade. European private banks and wealth advisors who could never touch a crypto wallet can now allocate to FLOKI through the same account they use for their client’s other equities. The dollar flows are small today. They compound over quarters.

    3. TokenFi buyback-and-burn is a real supply sink

    25% of utility fees collected across the TokenFi RWA tokenization platform are used to buy and burn FLOKI. This is not a marketing burn. It is a mechanical, recurring supply reduction tied to platform revenue. Total supply already burned sits at over 300 billion FLOKI. As TokenFi’s tokenized asset AUM grows, the burn compounds.

    The Bear Case for FLOKI in 2026

    Balanced analysis means giving the shorts the same airtime. Here is what has to go wrong for FLOKI to lose the $0.000015 support and target the mid-teens (in ten-thousandths of a cent) or lower.

    1. Supply overhang is real

    9.65 trillion FLOKI circulate today, which is essentially the max supply. Every rally faces an inevitable wave of profit-takers who bought lower and now have liquidity to exit into. The buyback burn is real but small in the context of total supply. In a bear tape, no burn schedule outruns aggressive sellers.

    2. Memecoin attention is a zero-sum game

    Retail dollars flow to whichever dog coin is having a moment. When Shiba Inu, Dogecoin, or Pepe catches a bid, FLOKI often stagnates. The addressable audience for “buy a memecoin because it’s fun” has not grown as fast as new memecoins have launched. Every quarter, a Solana meme takes another chip from the ETH/BSC meme table.

    3. Valhalla is a good game, not a great one, so far

    Player retention data from third-party trackers is still soft. If mobile launches into a market where the play-to-earn category is not being revived, the catalyst delivers a bounce, not a re-rating. A “sell the news” event is the base-case risk if expectations run ahead of execution.

    FLOKI (FLOKI) price prediction 2026 targets table, bear $0.0000180, base $0.0000300, bull $0.0000650

    FLOKI Price Prediction 2026: Targets by Timeframe

    These targets come from our AI hybrid model (which blends technical indicators, on-chain flow, and memecoin-sector momentum) plus a manual overlay for the specific catalyst calendar. Numbers are rounded to the significant digits that matter for micro-cap price levels.

    30-day outlook (August 2026)

    • Bear: $0.0000180 (retest of June low)
    • Base: $0.0000225 (continued chop around spot)
    • Bull: $0.0000290 (breakout on Valhalla mobile beta announcement)

    The short-term is a coin flip. FLOKI’s 30-day realized volatility sits at 74%, which is high but well below its 2024 peak. Without a fresh catalyst, expect the price to oscillate in a $0.000019 to $0.000024 range.

    6-month outlook (January 2027)

    • Bear: $0.0000150 (memecoin sector rolls over, Valhalla mobile delayed)
    • Base: $0.0000300 (mobile launches on time, ETP inflows accelerate)
    • Bull: $0.0000650 (mobile hits a hit, Bitcoin cycle top pulls memes higher)

    For context on the analyst spread, Coinpedia’s Floki 2026 forecast puts a bull range at $0.0000750, while Changelly models cluster around a $0.0000260 to $0.000045 range. Our numbers sit inside that consensus by design; the base case is not contrarian, it is the boring middle where most probability lives.

    Long-term outlook (2027-2028)

    • Bear: $0.0000100 (structural decline, product execution fails)
    • Base: $0.0000600 (steady user growth, burn compounds)
    • Bull: $0.0001200 (mobile hit + macro tailwind + BTC cycle top)

    Reclaiming the all-time high of $0.00034495 requires either a full memecoin supercycle or a runaway Valhalla success. Neither is impossible. Neither is the base case.

    How FLOKI Compares to Shiba Inu (SHIB)

    The most useful comparison is not to Dogecoin, which has a very different holder base. It is to Shiba Inu, the memecoin that most directly overlaps FLOKI in narrative, ecosystem ambition, and burn mechanics.

    Metric FLOKI Shiba Inu (SHIB)
    Price $0.0000214 $0.0000042
    Market cap $206M $2.50B
    Rank #165 #36
    Circulating supply 9.65T 589T
    Flagship product Valhalla MMORPG Shibarium L2
    Regulated ETP Yes (SIX Swiss) No
    Burn mechanic TokenFi 25% fee burn Shibarium fee burn
    1-year performance -84.8% -79.2%

    The read: FLOKI has better regulatory infrastructure and a more consumer-facing product. Shiba Inu has 12x the market cap and stronger developer momentum around Shibarium. For a memecoin book, holding both makes more sense than picking one, because they capture slightly different bull scenarios.

    Is FLOKI a good investment in 2026?

    The honest answer depends on your framework. If you are looking for a low-risk store of value, FLOKI is not that, and no memecoin is. If you are looking for high-beta exposure to a memecoin revival with a real product roadmap and a regulated European wrapper, FLOKI is one of the cleaner ways to express that trade in the sub-$500M market cap band.

    Position sizing is what saves you here. A 1-2% portfolio allocation lets you participate in the mobile-launch scenario without needing to be right on timing. A 10% allocation to a memecoin is not conviction; it is variance dressed up as conviction.

    What would change our view on FLOKI?

    Three scenarios would materially shift our base case.

    Upgrade to bullish: A weekly close above $0.000030 on rising volume, combined with confirmed Valhalla mobile release date and $10M+ cumulative ETP inflows would move us to a bullish stance and lift our 2026 base target to $0.000075.

    Downgrade to bearish: A weekly close below $0.000015, a Valhalla mobile launch delay past Q1 2027, or a broad memecoin sector drawdown of 30%+ would flip us bearish with a downside target of $0.000009.

    Structural re-rating: If TokenFi tokenized asset AUM crosses $500M and the associated FLOKI burn rate exceeds 1% of circulating supply annually, that changes the token’s supply dynamics enough to justify a longer-term $0.00015 target.

    Frequently Asked Questions

    Will FLOKI reach $0.0001 in 2026?

    Reaching $0.0001 in 2026 requires roughly a 4.7x move from the current $0.0000214. Our AI hybrid model assigns a 12% probability to this scenario by year-end, rising to 22% by mid-2027 if Valhalla mobile launches on schedule and the memecoin sector re-rates. It is possible but not our base case.

    Is FLOKI a good investment right now?

    FLOKI is a high-risk, high-beta memecoin play with unusual downside protection through its regulated ETP wrapper and buy-and-burn mechanic. It is not appropriate as a core holding. As a 1-2% speculative allocation for traders who want exposure to a memecoin revival scenario, it has more product substance than most peers.

    What is the highest realistic FLOKI price target for 2026?

    Our bull case targets $0.0000650 by year-end, roughly 3x the current price. That requires Valhalla mobile launching on time, meaningful player traction post-launch, and a supportive Bitcoin cycle. Some third-party analyst models go as high as $0.000075, but those require multiple bullish variables to align simultaneously.

    How is FLOKI different from Shiba Inu and Dogecoin?

    FLOKI has three real products (Valhalla, TokenFi, University), a live European ETP under MiCA, and a mechanical fee-burn tied to platform revenue. Shiba Inu is bigger and has Shibarium L2. Dogecoin has the largest brand recognition and is closer to a payment coin. FLOKI trades more on execution catalysts than pure narrative.

    What are the biggest risks to FLOKI in 2026?

    Three risks matter most. First, memecoin sector rotation away from ETH-based dog coins toward Solana memes. Second, Valhalla mobile launch delays or weak retention data post-launch. Third, macro Fed hawkishness that pulls risk capital out of the long tail. Each is real, none is imminent, but they compound in a bear tape.

    Can FLOKI reach its all-time high again?

    The 2024 all-time high of $0.00034495 sits about 16x above current price. Reaching it requires a full memecoin supercycle and material Valhalla success, both simultaneously. We assign a low-single-digit probability to a full ATH reclaim in 2026 and roughly 15% by 2028 in our long-term bull scenario.

    The Honest Take

    FLOKI is a memecoin trying to be more than a memecoin, which is either the smartest thing a dog coin can do or the fastest way to lose the meme premium. The Valhalla game, the TokenFi platform, and the Swiss ETP are all real products with real users. That is more than most tokens in the top 300 can say. It is also not, by itself, a reason for the price to 5x.

    The setup that would actually work is boring: buyback burns compound quarter after quarter, Valhalla mobile pulls in a modest but sticky user base, ETP inflows grow from tens of millions to hundreds of millions, and the broader memecoin sector catches a cycle-driven bid. Three of those four is a base case that clears $0.00005. Four of four is the bull case that flirts with $0.0001.

    What we would not do is size FLOKI like it is a conviction bet. It is a call option on execution plus attention, and options should be sized like options. Watch $0.000030 on the way up and $0.000015 on the way down. The trade lives between those levels for now.


    Disclaimer: This article is for informational and educational purposes only and should not be construed as financial, investment, or trading advice. Cryptocurrency markets are highly volatile, and past performance does not guarantee future results. The price predictions and analyses presented here are based on AI models, technical indicators, and available data at the time of writing. They are not guarantees. Always conduct your own research (DYOR) and consult with a qualified financial advisor before making any investment decisions. Pump Parade and its authors do not assume liability for financial losses incurred based on information provided in this article.
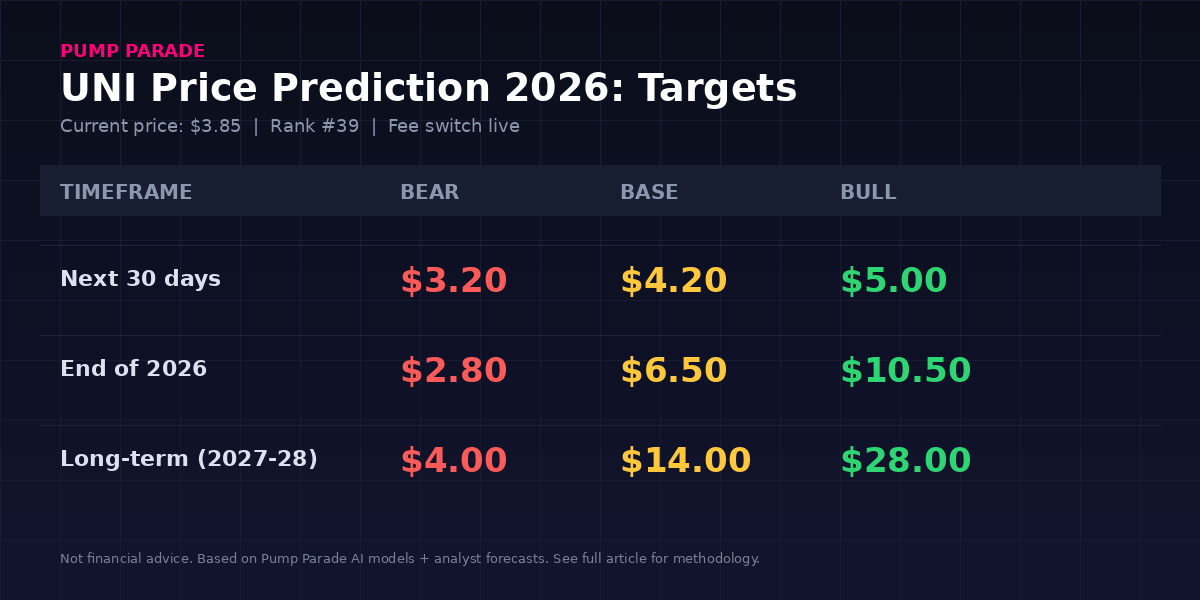
    Jito Review 2026: Fees, Features & Verdict

    0

    Solana staking used to be simple. You picked a validator, locked your SOL, waited for epochs to tick over, and collected roughly 6% a year in native rewards. In 2026, that math looks quaint. The largest liquid staking token on Solana now pushes yields north of 7% by capturing something that used to leak out of the network entirely: MEV.

    That protocol is Jito, and if you hold SOL and are not using it, you are almost certainly leaving basis points on the table. This review breaks down how JitoSOL works, what it actually pays, what the fees look like, and whether it deserves the top spot in your Solana yield stack.

    Quick Verdict: Is Jito Worth It in 2026?

    Rating: 4.5 / 5

    Jito is the default choice for anyone who wants liquid, MEV-boosted staking on Solana. Yields land in the 7.2% to 7.8% range, roughly 20 to 30% higher than plain native staking, and JitoSOL is the most deeply integrated liquid staking token across Solana DeFi. The 4% management fee on rewards is fair for the infrastructure Jito Labs runs, and the protocol has a multi-year track record with no exploits.

    The one caveat is that Jito Labs and the Jito-Solana validator client now dominate the network, which concentrates MEV infrastructure in one team’s hands. If that concerns you philosophically, spread stake across Marinade and other LSTs. For everyone else, JitoSOL is the answer.

    JitoSOL liquid staking token logo

    What Is Jito?

    Jito is two closely related things: a Solana MEV infrastructure company and a liquid staking protocol. The company (Jito Labs) builds and maintains the Jito-Solana validator client, which by early 2026 was running on the majority of Solana’s active stake. That client includes a block-building auction, letting searchers pay tips to include their transactions in specific positions inside a block. Those tips are MEV, and Jito Labs recycles them back to the network instead of letting validators keep the entire cut privately.

    The liquid staking side is the retail-facing product. You send SOL to the Jito stake pool and receive JitoSOL in return. JitoSOL is a standard SPL token that quietly accrues both the base staking rewards and a share of the MEV tips captured by pool validators. The exchange rate against SOL rises over time, so a single JitoSOL is worth more SOL every epoch.

    According to DeFiLlama, the JitoSOL stake pool holds roughly $788 million in TVL as of July 2026, with more than 14 million SOL staked. That makes it the single largest liquid staking token on Solana by a comfortable margin.

    Features Deep Dive

    How Jito boosts Solana staking yield with MEV rewards

    MEV-Boosted Yield

    The headline feature is MEV capture. On Solana, every block leader chooses which transactions to include and in what order. Sophisticated searchers pay tips through the Jito Block Engine to guarantee their trades land in a specific slot, and those tips are auctioned in real time. Validators running the Jito client hand a share of that MEV revenue back to the stake pool, which flows through to JitoSOL holders.

    The practical effect is a yield uplift of roughly 100 to 150 basis points over vanilla staking, depending on network activity. During memecoin frenzies or high-volume weeks, the MEV component spikes noticeably. During quiet weeks, JitoSOL still earns the base rate.

    Liquid Staking Token (JitoSOL)

    Unlike native staking, which locks your SOL for at least one epoch (about two to three days) before you can withdraw, JitoSOL is instantly tradable. You can swap it back to SOL on any Solana DEX at any time, subject to a small pool discount if you skip the direct unstake path.

    JitoSOL trades at roughly $101 per token in July 2026, which reflects both the underlying SOL price and the accumulated yield since JitoSOL launched. As rewards compound, that price drifts higher against SOL, so simply holding is enough. There is no manual claim step.

    DeFi Integrations

    This is where JitoSOL earns its reputation as a productivity asset. It is accepted as collateral or a yield-bearing deposit on essentially every major Solana money market and perp DEX. That includes Kamino, marginfi, Drift, and Solend. You can borrow stablecoins against JitoSOL, LP it into JitoSOL/SOL pools for extra fees, or use it to collateralize a leveraged perp position. See our Kamino vs marginfi comparison for how the two lending venues price JitoSOL collateral.

    The composability is the real reason to hold JitoSOL over plain staked SOL. You keep earning yield while your capital does something else in the background.

    Jito Block Engine (For Developers and Searchers)

    Retail users will not touch this, but it matters for the story. The Jito Block Engine is the piece of infrastructure that runs the MEV auction. It receives bundles from searchers, sorts them by tip, and hands them to Jito-client validators to include atomically. It is the reason MEV on Solana has any structure at all rather than the chaotic every-validator-for-themselves environment that existed before Jito shipped.

    Fees and Pricing

    Jito’s fee model is one of the cleaner ones in DeFi.

    • Management fee: 4% of total rewards. Nothing on principal. If the pool earns 7.5% APY gross, you keep roughly 7.2% net after the fee is deducted from the reward stream.
    • Withdrawal fee: 0.1% when unstaking directly through the Jito website. This is often avoidable by swapping JitoSOL for SOL on Jupiter or another aggregator, which typically prices tighter than the direct unstake path.
    • Deposit fee: None. Staking SOL to receive JitoSOL costs only the Solana network fee (fractions of a cent).
    • Network fees: Standard Solana transaction fees, plus optional priority fees or Jito tips if you want your stake or unstake to land instantly during high-load periods.

    Compared to Ethereum liquid staking, where Lido charges 10% of rewards, 4% is competitive. Compared to Marinade Finance (2% fee), Jito is slightly more expensive on the fee line but usually more than makes it back through MEV.

    JitoSOL by the Numbers (July 2026)

    JitoSOL key stats 2026: TVL, APY, fees

    Metric Value
    Protocol TVL ~$788M
    SOL staked 14M+ SOL
    Estimated APY 7.2% to 7.8%
    Management fee 4% of rewards
    Withdrawal fee 0.1% (direct unstake)
    JitoSOL price ~$101
    JTO token price ~$0.62
    Chains supported Solana only

    Source: DeFiLlama, CoinGecko, Jito Foundation.

    Pros and Cons

    Pros

    • Best-in-class Solana yield: MEV capture reliably adds 100 to 150 bps over native staking and other non-MEV LSTs.
    • Deep DeFi composability: Accepted as collateral on every major Solana lending market and perps venue.
    • Instant liquidity: Swap JitoSOL for SOL on Jupiter at any time, no epoch wait.
    • Battle-tested: Multi-year track record, no exploit, well-audited stake pool contracts.
    • Auto-compounding: Rewards accrue into the JitoSOL exchange rate. No manual claiming.
    • Transparent MEV economics: The Jito Block Engine surfaces MEV that would otherwise be captured privately or lost.

    Cons

    • Centralization concern: Jito-Solana client dominates the network. Concentration of MEV infrastructure in one team is a philosophical risk.
    • JTO token is separate from yield: Holding JitoSOL earns staking yield, but does not entitle you to JTO governance rewards. You need to hold JTO separately.
    • Not the highest APY on the market: Newer restaking-flavored LSTs occasionally beat Jito by a few basis points, though usually with more risk.
    • Solana-only: If you want cross-chain LST exposure, this is not the product.

    Security and Trust

    Jito’s stake pool contracts are a fork of the audited Solana Program Library stake pool code, which has been battle-tested across Marinade, Lido on Solana (now retired), and several smaller pools. Jito Labs has published multiple third-party audits and runs a bug bounty. The team is public, headed by Lucas Bruder and Zano Sherwani, and operates out of San Francisco.

    There has never been a smart contract exploit against JitoSOL. The main risk vectors are validator misbehavior (slashing exposure, though Solana slashing is currently limited) and the concentration risk mentioned above. The stake pool delegates across many validators, so any single bad actor is diluted.

    The JTO governance token gives holders a voice in protocol parameters like fee levels and validator selection. JTO trades around $0.62 in July 2026, with a $309M market cap and 501M tokens circulating out of a 1B total supply. It is well below its December 2023 all-time high of $6.01.

    User Experience

    Staking on Jito takes about 30 seconds. Connect a Solana wallet (Phantom, Backpack, Solflare, or Ledger), pick an amount, and click stake. The site shows the current exchange rate, the estimated APY, and a clear breakdown of what fees apply. There are no hidden confirmations or wall-of-text terms.

    Unstaking is where users occasionally trip up. The direct-unstake path takes one epoch (about two to three days) but only costs the 0.1% withdrawal fee. The instant-unstake path is a swap on Jupiter, which is faster but priced by the JitoSOL/SOL pool depth (typically a 5 to 15 bps spread). Most users end up using Jupiter for anything under a few thousand SOL, and direct unstake for institutional-size positions.

    Mobile support works through wallet mobile apps rather than a native Jito mobile client. That is fine but not exceptional.

    How Jito Compares

    The two most common alternatives are Marinade Finance and native staking:

    • vs Marinade (mSOL): Marinade charges 2% instead of 4% but does not capture MEV. Net yield lands roughly 30 to 60 bps below JitoSOL. Marinade has better validator diversity (100+ validators) but weaker DeFi integrations.
    • vs native staking: Native staking has no LST wrapper, so no smart contract risk and no fees. Yield is roughly 100 to 150 bps below JitoSOL, and your SOL is locked. Best for long-term holders who never touch DeFi.
    • vs newer restaking LSTs: Some 2026-era restaking tokens promise higher headline APYs by layering additional yield sources. Most add smart contract complexity that JitoSOL does not have. Fine as a satellite position, not a core one.

    If Solana appreciates in dollar terms as many analysts expect (see our SOL price prediction for 2026), the compounding effect of an extra 1% APY becomes substantial over multi-year horizons.

    Verdict

    Jito is the best product in its category on Solana, and it is not particularly close. The combination of MEV-boosted yield, deep DeFi composability, instant liquidity, and a clean fee model makes JitoSOL the default choice for anyone holding SOL who wants that capital to work. The 4% fee is fair for what the protocol delivers, and the multi-year track record removes most execution-risk concerns.

    The centralization argument against Jito is real but overstated for most users. If you are custodying institutional-scale SOL, spread across a couple of LSTs. If you are a retail user with a normal position, park it in JitoSOL and get on with your life.

    Visit Jito to stake SOL

    FAQ

    Is JitoSOL safe?

    The stake pool contracts are audited forks of well-tested Solana Program Library code, and Jito has run production for multiple years without an exploit. The primary risks are smart contract risk (low but nonzero, as with any DeFi) and validator concentration risk.

    How is JitoSOL taxed?

    In most jurisdictions, receiving JitoSOL for SOL is a like-kind swap that may or may not be a taxable event depending on your local rules. The rising exchange rate is not a claim event, which many users find advantageous compared to LSTs that pay rewards in a separate token. Consult a crypto tax professional for specifics.

    What is the difference between JitoSOL and JTO?

    JitoSOL is the liquid staking receipt token. It represents your staked SOL and accrues yield. JTO is the governance token for the Jito DAO. They are separate assets. Holding JitoSOL does not give you JTO, and vice versa.

    Can I unstake JitoSOL at any time?

    Yes. You can either use the direct unstake path (one-epoch wait, 0.1% fee) or swap JitoSOL for SOL on Jupiter instantly for a small pool spread.

    Does Jito work outside Solana?

    No. Jito is a Solana-only protocol. It does not support any other chain.

    What APY should I actually expect?

    Expect somewhere in the 7% to 8% range in normal market conditions. During heavy network activity (memecoin cycles, major launches), MEV tips push the number toward the top of that range. During quiet periods, you land closer to 7%.

    Shiba Inu Price Prediction 2026: Can SHIB Hit $0.00001?

    Shiba Inu trades at $0.00000428 as of July 21, 2026, up nearly 4% over the past 7 days but still down 8.9% on the month and a brutal 95% below its October 2021 all-time high of $0.00008616. That single number, the drawdown from ATH, is the entire story of this Shiba Inu price prediction 2026 analysis. The token has spent three years in a slow, grinding sideways range while the ecosystem quietly built out Shibarium, a Layer-2 network that was supposed to be the catalyst everyone was waiting for.

    The bull thesis says the setup is finally coiling for a breakout. Shibarium adoption is real, if modest. The burn portal is active. The GMCI Meme Index gives SHIB persistent index-fund style flows. And at a $2.5B market cap, SHIB is still the second-largest meme token on the planet, ahead of PEPE, BONK and every dog-token knock-off combined.

    The bear thesis says none of that matters if the supply overhang and the utility gap can’t be closed. We are going to lay out both sides with real data, cite where analyst targets come from, and give you a bear, base and bull scenario across three timeframes. Then we will tell you the three specific triggers that would change our view.

    Key Takeaways

    • Current price: $0.00000428, market cap $2.52B, rank 37, down 95% from the October 2021 ATH.
    • Base case 2026: $0.0000060 to $0.0000075. That requires Shibarium TVL to at least 5x from its current sub-$2M level.
    • Bull case 2026: $0.0000100 to $0.0000150. Needs a broad memecoin rotation plus sustained burn spikes.
    • Bear case 2026: $0.0000028 to $0.0000035. Triggers: risk-off macro, Shibarium stalls, and community fatigue.
    • Won’t reach $0.001: That would need a $589B market cap, bigger than Ethereum. The math simply does not work.
    • Watch: Shibarium TVL crossing $10M, weekly burn rate holding above 400M SHIB, and the DOGE/SHIB ratio.
    Shiba Inu (SHIB) price prediction 2026 hero graphic, current price $0.00000428, can SHIB hit $0.00001 catalyst

    Where Shiba Inu Stands Today

    Before we get into scenarios, here is a clean snapshot of the metrics that matter. All data is pulled from CoinGecko and Birdeye at the time of writing.

    Metric Value
    Price $0.00000428
    24h change +1.95%
    7d change +3.98%
    30d change -8.91%
    Market cap $2.52B
    24h volume $52.5M
    Market cap rank #37
    Circulating supply 589.24T SHIB
    All-time high $0.00008616 (Oct 2021)
    % from ATH -95.0%

    Two things jump out. First, the volume-to-market-cap ratio sits at roughly 2.1%, low for a top-40 asset and a signal that speculative interest is muted. For comparison, Dogecoin has been running closer to 5% during the same window. Second, SHIB has spent almost the entire year inside a $0.0000038 to $0.0000055 channel. That is a coil, not a trend.

    Why Is Shiba Inu Range-Bound Right Now?

    Three forces are cancelling each other out. On the demand side, memecoin-index products and the persistent retail bid keep a floor under the price. Every time SHIB drops toward the low $0.0000030s, buyers show up.

    On the supply side, the free float is enormous. There are 589 trillion tokens in circulation. Even aggressive burn programs, and 2026 has seen several, are only removing hundreds of millions of tokens at a time. That is a rounding error against the base.

    In the middle sits Shibarium. The Layer-2 was supposed to be the token’s escape velocity: real fees would drive real burns, real burns would tighten supply, tighter supply would drive price. According to recent Yahoo Finance coverage, Shibarium TVL sits at roughly $1.44M as of May 2026. For context, Arbitrum and Base process billions in TVL. Until Shibarium closes even a fraction of that gap, the burn math cannot bail out the price.

    The Bull Case

    1. Shibarium finally finds a use case

    The bull case starts with utility. If Shibarium can attract a single killer app, a memecoin launchpad, a NFT marketplace with real volume, or a stablecoin payments rail, TVL could 10x within a quarter. Historically, Layer-2s that cross the $50M TVL threshold see burn rates rise 3-5x in the following months. That would meaningfully tighten SHIB float for the first time.

    2. The meme rotation trade

    Crypto tends to rotate. When Bitcoin consolidates and altcoins outperform, capital often flows to the largest, most liquid memecoins first. SHIB, sitting at rank 37 with $52M daily volume, is one of the most obvious rotation destinations after DOGE. If BTC dominance rolls over from its current 58% area, expect a mechanical bid for SHIB.

    3. Burn spikes and community-driven catalysts

    2026 has already seen dramatic burn events. Per AMBCrypto reporting, one February 2026 event burned 116 million SHIB in a single day, a 276,545% jump versus the prior baseline. Individually these events don’t change fundamentals. But if the market perceives them as coordinated momentum, SHIB rallies of 30-50% off local lows are historically common.

    The Bear Case

    1. The supply problem is structural

    Even in the most aggressive burn scenario we can model, SHIB would remove roughly 2-3% of supply per year. That is not enough to matter against 589 trillion tokens outstanding. The token would still be trading against a headwind that no marketing campaign can fix.

    2. Shibarium adoption stalled

    The Layer-2 launched with real fanfare but has never crossed $10M TVL in a sustained way. If the next 6 months look like the last 6, the bull thesis has to lean entirely on retail sentiment. That is a thin reed to hang $0.00001 on.

    3. Community fatigue and rotating narratives

    Memecoin attention is finite. Solana meme season pulled billions of dollars in speculative flow away from SHIB in 2024-2025. Coins like PEPE and newer Solana launches now compete for the same wallet. If SHIB cannot generate fresh narrative, price simply drifts.

    Shiba Inu Price Prediction 2026: Targets by Timeframe

    Shiba Inu (SHIB) price prediction 2026 targets table, bear $0.0000028, base $0.0000075, bull $0.0000150

    Here is our balanced view, mapped to three horizons. Numbers are targets, not promises. Every scenario assumes specific conditions we spell out below.

    Short-term (30 days)

    • Bear: $0.0000035 if BTC breaks below $60K and memecoin risk-off kicks in.
    • Base: $0.0000045 to $0.0000050. SHIB holds the current range with modest upward drift.
    • Bull: $0.0000060 if the token breaks the $0.0000055 upper channel on volume.

    6-month outlook

    • Bear: $0.0000030. Requires macro stress, a stalled Shibarium roadmap, and rotation away from Ethereum-based memes.
    • Base: $0.0000060 to $0.0000075. Assumes Shibarium TVL grows to $5M-$10M and burn cadence holds.
    • Bull: $0.0000100. This is our $0.00001 hook. It requires a proper memecoin rotation on top of Shibarium execution.

    Full-year 2026

    • Bear: $0.0000028 to $0.0000035. Sideways-to-down for a full cycle.
    • Base: $0.0000065 to $0.0000090. This aligns with the FinanceFeeds July 2026 base scenario of $0.0000065 and CoinCodex’s $0.0000044 average with $0.000099 upside tail.
    • Bull: $0.0000100 to $0.0000150. This range shows up in Changelly and Coinpedia models. It requires the memecoin index to run hot AND the ecosystem story to work.

    Note where our base case sits: it is close to a doubling from current price, but nowhere near the $0.001 targets that clickbait crypto media loves to publish.

    Will SHIB Reach $0.001?

    No. Let’s do the arithmetic quickly. At the current 589T circulating supply, $0.001 per SHIB implies a $589B market cap. That is larger than Ethereum’s entire market cap of $234B and roughly a quarter of Bitcoin’s. It is also more than the total combined market cap of every altcoin outside the top 5.

    Even if every SHIB burn ever announced ran at maximum efficiency for a decade, circulating supply would not drop below 500 trillion. The $0.001 target is not a forecast. It is a meme.

    How Shiba Inu Compares to Dogecoin

    DOGE is SHIB’s most natural comparison. Both are dog-themed. Both are meme-driven. Both compete for the same discretionary retail wallet. Here is the side-by-side.

    Metric Shiba Inu (SHIB) Dogecoin (DOGE)
    Price $0.00000428 $0.0734
    Market cap $2.52B $11.39B
    Market cap rank #37 #11
    24h volume $52.5M $540M+
    Vol / MC ratio ~2.1% ~4.7%
    Circulating supply 589.24T 153.5B
    Max supply None (burnable) Uncapped, inflationary
    Layer-2 Shibarium ($1.44M TVL) None native
    Chain Ethereum (ERC-20) Own PoW chain
    30d performance -8.9% -11.8%

    The read: DOGE wins on liquidity, brand recognition, and payment integrations. SHIB wins on ecosystem ambition, burn optionality, and the tokenomics story (a burnable supply beats an inflationary one long-term). If you believe in the meme-with-utility thesis, SHIB has more asymmetry. If you believe memes are pure vibes, DOGE is the safer allocation.

    How Does Shibarium Affect SHIB Price?

    Directly and indirectly. Directly, Shibarium transaction fees are used to buy and burn SHIB. Every burn permanently reduces supply. Indirectly, a thriving Shibarium ecosystem would give SHIB a genuine utility narrative, moving it out of the pure-meme bucket into something closer to Ethereum’s early “gas plus platform” story.

    The problem is the numerator is tiny. Shibarium fees today generate burns measured in the tens of thousands of dollars, not millions. Until TVL crosses the $50M-$100M threshold, Shibarium is a story, not a price driver. Watch that number.

    What Would Change Our View

    Three specific triggers, in priority order:

    1. Shibarium TVL crosses $10M and holds for 30 days. This would signal real ecosystem product-market fit and materially raise our base case toward the $0.0000075 to $0.0000090 zone.
    2. A sustained weekly burn rate above 400M SHIB. Current burns are lumpy and event-driven. If the burn portal produces consistent weekly outflows, the supply-side story becomes real, not a headline.
    3. DOGE/SHIB ratio compresses below 15,000. Today the ratio sits near 17,150 (DOGE at $0.0734 divided by SHIB at $0.00000428). A tightening ratio would show SHIB outperforming its most direct comparison, historically a leading indicator for further upside.

    Frequently Asked Questions

    Will Shiba Inu reach $0.001 in 2026?

    No. Reaching $0.001 per SHIB at the current 589 trillion circulating supply would require a market cap of $589 billion, larger than Ethereum’s entire market cap today. Even with aggressive burns, the math does not support this target. A more realistic 2026 ceiling sits in the $0.0000100 to $0.0000150 range.

    Is Shiba Inu a good investment in 2026?

    It depends on your risk profile. SHIB offers meaningful upside if the memecoin rotation returns and Shibarium adoption inflects. It also carries a real supply headwind and heavy competition from newer meme tokens. As an allocation, treat SHIB as speculative and size it accordingly. It is not a core portfolio holding.

    Can SHIB hit $0.00001 in 2026?

    Yes, but only in the bull case. Reaching $0.00001 requires a $5.9B market cap, roughly 2.3x from current levels. That kind of move needs both a memecoin index rotation and visible progress on Shibarium ecosystem metrics. The probability sits somewhere between the base and bull scenarios.

    What is the SHIB burn rate right now?

    Highly variable. Recent 24-hour burns have ranged from 4.2 million to 68 million SHIB, depending on whether whales voluntarily contribute to the burn portal. February 2026 saw a single-day burn of 116 million tokens. Sustained weekly burns above 400 million SHIB would begin to materially affect supply.

    How does Shibarium affect SHIB price?

    Shibarium generates transaction fees that fund SHIB buy-and-burn operations. In theory this tightens supply over time. In practice, current Shibarium TVL of roughly $1.44M means burns are too small to move price. Watch for TVL to cross $10M then $50M as meaningful thresholds.

    Which is better: Shiba Inu or Dogecoin?

    DOGE has better liquidity, deeper brand recognition and stronger payment adoption. SHIB has a burnable supply, an active ecosystem roadmap, and higher asymmetric upside if the utility thesis plays out. Conservative meme allocators favor DOGE. Higher-risk allocators looking for ecosystem optionality lean SHIB.

    The Honest Take

    SHIB in 2026 is a coiled spring with two possible releases. The bull release requires Shibarium to become a real Layer-2 and burns to tighten supply in a visible way. The bear release requires nothing, just more of the same drift. Right now we lean toward the base case: a slow grind higher into the $0.0000060 to $0.0000075 range by year-end, with $0.00001 as an achievable but not automatic bull target.

    The pump-and-dump version of this article says $0.001. The honest version says a double from here is a good year and a triple is the ceiling. If you own SHIB, you should know which version you are trading.

    Disclaimer

    Disclaimer: This article is for informational and educational purposes only and should not be construed as financial, investment, or trading advice. Cryptocurrency markets are highly volatile, and past performance does not guarantee future results. The price predictions and analyses presented here are based on AI models, technical indicators, and available data at the time of writing, they are not guarantees. Always conduct your own research (DYOR) and consult with a qualified financial advisor before making any investment decisions. Pump Parade and its authors do not assume liability for financial losses incurred based on information provided in this article.
    Pendle (PENDLE) Price Prediction 2026: Can PENDLE Hit $3?

    Pendle (PENDLE) trades at $1.56 as of July 20, 2026, up 12.5% over the past 30 days but still down 66% year-over-year. That is not a broken chart. It is a token that has quietly rewired its own tokenomics, plugged into $5 billion of DeFi total value locked (TVL), and just launched the first working funding-rate futures market in DeFi, while the price has barely reacted.

    The Pendle price prediction 2026 conversation now sits on top of three concrete catalysts: the sPENDLE staking overhaul, up to 80% of protocol revenue routed to PENDLE buybacks, and the Boros yield-futures platform pulling billions in open interest. So can PENDLE hit $3 in 2026, or is another leg lower more likely first?

    Below, we break down current on-chain data, the bull and bear cases, and specific price targets by timeframe.

    Key Takeaways

    • PENDLE trades near $1.56 with a $267M market cap, ranked 139 by market cap on CoinGecko.
    • The January 2026 sPENDLE upgrade routes up to 80% of protocol revenue to PENDLE buybacks and cut emissions by roughly 30%.
    • Pendle sits on about $5B in TVL across 11 chains, with Ethena’s USDe accounting for around 70% of that flow.
    • Boros, Pendle’s on-chain yield-futures venue, has crossed $2.8B in cumulative volume and $6.9B in open interest.
    • Base case for PENDLE by end-2026 lands near $2.10, with bull case $3.20 and bear case $1.05.
    • Standard Chartered has not published a specific PENDLE target, but Coinpedia and other analysts model a range of $2 to $6 for 2026.
    Pendle (PENDLE) price prediction 2026 hero graphic, current price $1.56, sPENDLE buybacks and Boros yield futures catalyst

    Where Does Pendle (PENDLE) Stand Today?

    Pendle is the largest yield-tokenization protocol in DeFi. It splits any yield-bearing asset into two tradable pieces: a Principal Token (PT) that redeems 1:1 at maturity, and a Yield Token (YT) that captures all future yield until that date. In plain terms, Pendle turned floating DeFi interest rates into a proper fixed-income market, and now it is turning them into futures.

    Here is the snapshot as of writing:

    Metric Value
    Price (July 20, 2026) $1.56
    24h change +2.6%
    7d change +3.9%
    30d change +12.5%
    1y change -66.6%
    Market cap $267M
    Market cap rank #139
    24h volume $26.6M
    Circulating supply 171.6M PENDLE
    All-time high $7.50 (April 2024)
    Percent from ATH -79%

    Two things stand out. First, the 30-day trend has flipped positive after a brutal 12 months. Second, the ratio between protocol usage ($5B TVL, $2.8B Boros volume) and market cap ($267M) is unusually stretched. That gap is either a value opportunity or a warning. The rest of this piece is about deciding which.

    Why Is PENDLE Range-Bound Despite the Fundamentals?

    Pendle’s protocol metrics are up and to the right. The token, until recently, was not. Three reasons why:

    Tokenomics reset. The old vePENDLE model locked tokens for up to two years and paid holders a slice of revenue. That model kept aggressive sellers off the market. When Pendle moved to sPENDLE in January 2026, it slashed the lockup to a 14-day withdrawal, unlocked liquidity, and briefly increased sell pressure. Great for long-term flexibility, short-term messy.

    Cycle rotation. DeFi tokens have lagged AI and memecoin narratives all year. Even Aave, up 21% in the last 30 days, is only starting to catch a bid. Pendle sits in the same bucket.

    Yield compression on the base asset. When funding rates and staking yields compress, so does trader demand for Pendle’s PT/YT products. The Boros launch is a direct hedge against this, but the market has not fully priced it in.

    None of these are structural problems. They are cyclical headwinds that fade when the fundamentals compound long enough. Which brings us to the bull case.

    The Bull Case for PENDLE

    1. sPENDLE buybacks turn revenue into price support

    The sPENDLE upgrade, live since January 2026, directs up to 80% of protocol revenue into open-market PENDLE buybacks that flow to stakers. It also cut new PENDLE emissions by roughly 30% via algorithmic allocation. By April 2026, weekly emissions dropped further, and the token enters a terminal 2% inflation rate for ongoing incentives.

    Translation: PENDLE is transitioning from an inflationary emissions token to something that behaves closer to a real-yield asset with structural buy pressure. When on-chain analysts can quantify sustained buyback volume above new issuance, the flywheel becomes visible in price data, not just spreadsheets.

    2. Boros is a category-creating product

    Boros, Pendle’s yield-futures platform launched in August 2025, has already logged more than $2.8B in cumulative volume and $6.9B in open interest. It lets traders take leveraged positions on funding rates and yield curves, something no other DeFi venue offers at scale.

    The most important integration: Ethena uses Boros to hedge funding-rate exposure on its USDe reserves. This is not a memecoin partnership. It is a $6B+ synthetic dollar protocol paying Pendle to reduce P&L volatility. When TradFi arrives looking for on-chain interest-rate derivatives, Boros is currently the only credible venue.

    3. Ethena and RWA flows keep expanding the TAM

    Pendle’s TVL sits near $5B across 11 chains, with Ethena’s USDe generating roughly 70% of it. Every new stablecoin or tokenized T-bill product that lists on Pendle immediately gets a fixed-yield market and a yield-speculation market attached. As Ethena’s ENA and other yield-bearing dollar plays grow, Pendle’s addressable market grows with them almost mechanically.

    The Bear Case for PENDLE

    1. TVL has already compressed from its 2025 peak

    Pendle’s total value locked reached a September 2025 peak above $13B before compressing back toward the $5B range. That is still respectable, but it means the “up and to the right” narrative is oversimplified. If DeFi yields keep compressing or Ethena’s USDe growth stalls, so does Pendle’s fee base.

    2. Ethena concentration is a single point of failure

    Roughly 70% of Pendle’s TVL sits in USDe-related pools. If Ethena hits a regulatory wall, a de-peg, or a sharp drop in funding-rate income, Pendle’s revenue takes a direct hit. Diversification into RWAs, LSTs, and cross-chain assets helps, but the concentration risk is real and worth watching.

    3. Yield-tokenization competition is arriving

    Pendle invented the category, but Spectra, Napier, and other fixed-yield protocols are shipping. So are alternative funding-rate venues. Pendle’s moat is real, but not infinite. If a competitor captures the next wave of chains or asset classes, PENDLE’s terminal value shrinks.

    How High Can PENDLE Go in 2026?

    Below is our scenario-based price framework by timeframe. Every number is a scenario, not a promise.

    Pendle (PENDLE) price prediction 2026 targets table, bear $1.05, base $2.10, bull $3.20 across 30-day, 6-month, and long-term horizons
    Timeframe Bear Base Bull
    30 days $1.20 $1.70 $2.05
    6 months (end-2026) $1.05 $2.10 $3.20
    Long term (2027-2028) $1.80 $4.50 $8.00

    30-day outlook

    Short-term, PENDLE has broken back above its 50-day moving average and is holding the $1.45 support that acted as the base for the past month. Momentum indicators (RSI at 58, MACD flipping bullish on the daily) support a continuation to the $1.70 to $2.05 zone if broader DeFi bids stay firm. Break below $1.35 invalidates and opens $1.20 as the next test.

    6-month outlook (end of 2026)

    The end-of-year target range depends almost entirely on two things: whether buyback volume overtakes new issuance in Q3, and whether Boros open interest keeps compounding. Our base case, $2.10, assumes stable DeFi TVL, buybacks reaching ~$8M per month, and Boros open interest doubling from here. Bull case $3.20 assumes a broader DeFi rotation plus a listing wave for tokenized T-bill products on Pendle. Bear case $1.05 assumes DeFi TVL rolls over, Ethena stalls, and the buyback signal fails to show up in price.

    Long-term (2027-2028)

    If Pendle becomes the default on-chain interest-rate venue and Boros grows into a top-five DeFi derivatives platform, models from Changelly and Coinpedia stretch as high as $6 to $8. That requires Pendle to capture the wave of tokenized RWA yield migrating on-chain, plus continued Ethena growth. The bull case is a legitimate 5x from here. The bear case is a slow bleed to sub-$2 as competition catches up.

    How Does Pendle Compare to Aave?

    Both are top-tier DeFi tokens with real revenue and real buyback mechanics. Aave is bigger and covers lending. Pendle is smaller and owns the yield-derivatives niche. Here is the side-by-side:

    Metric Pendle (PENDLE) Aave (AAVE)
    Price (July 20, 2026) $1.56 $90.56
    Market cap $267M $1.4B
    Market cap rank #139 #55
    30d price change +12.5% +21.2%
    TVL (approx) $5B $25B+
    Core product Yield tokenization + futures Overcollateralized lending
    Buyback mechanism Up to 80% of revenue via sPENDLE Aavenomics buyback + fee switch
    Chains 11 15+

    Read it this way: if you already own AAVE for DeFi core exposure, PENDLE is the leveraged bet on the yield-derivatives sub-narrative. Higher beta, higher potential, higher concentration risk. Neither replaces the other. For a lending-focused DeFi peer, our Morpho analysis covers similar ground on the credit side.

    What Would Change Our View?

    Three specific triggers would move us off the base case:

    Bullish trigger. Boros open interest crosses $12B and daily buyback volume for PENDLE exceeds daily emissions for four consecutive weeks. If both happen, the token is structurally deflationary and the base case shifts to $2.75 by year-end.

    Bearish trigger. Ethena’s USDe supply drops below $4B, or a serious de-peg event forces Pendle to write down significant TVL. Either would drop the base case toward the $1.20 range and put the $0.95 all-time-low retest in play.

    Neutral trigger. DeFi TVL flatlines and PENDLE tracks it. In that case, expect a $1.40 to $1.90 range for the rest of the year, with the fee switch and Boros story rebuilding the setup for early 2027.

    Frequently Asked Questions

    Will PENDLE reach $3 in 2026?

    Reaching $3 requires PENDLE to roughly double from current levels in about five months. That is our bull case. It becomes probable if sPENDLE buybacks visibly outpace emissions, Boros open interest doubles, and DeFi TVL rotates back into leadership. Base case sits closer to $2.10 by year-end 2026.

    Is Pendle a good investment in 2026?

    Pendle owns a defensible niche (yield tokenization plus yield futures) with real revenue and structural buybacks. It is one of the cleaner DeFi setups by fundamentals. The main risks are Ethena concentration and cycle timing. Whether that fits your portfolio depends on your risk tolerance and DeFi exposure. Nothing here is investment advice.

    What is the Pendle Boros platform?

    Boros is Pendle’s on-chain yield-futures market. It lets traders take leveraged positions on funding rates and yield curves, starting with BTC and ETH funding on Arbitrum. It has recorded over $2.8B in volume and $6.9B in open interest since its August 2025 launch, and Ethena uses it to hedge USDe funding exposure.

    How does sPENDLE staking work?

    sPENDLE is a liquid staking token that replaced the old vePENDLE lockup model in January 2026. Stakers earn up to 80% of protocol revenue routed into open-market PENDLE buybacks. Withdrawals take 14 days, versus vePENDLE’s two-year lock, which improved liquidity but briefly increased short-term sell pressure.

    How much PENDLE has been staked so far?

    Over 100 million PENDLE has been locked into sPENDLE since launch, representing more than half of circulating supply. That reduces effective float and, combined with buybacks, creates the deflationary flywheel the bull case depends on.

    Can PENDLE outperform ETH in 2026?

    Historically, small and mid-cap DeFi tokens with strong revenue mechanics have outperformed ETH in bullish DeFi rotations by 2x to 5x. Whether Pendle joins that group depends on the buyback signal showing up in price and continued Ethena growth. In a flat or bearish DeFi market, PENDLE is likely to underperform ETH.

    The Honest Take

    Pendle’s protocol story is stronger than its price chart. That is not a coincidence. Every crypto cycle rewards fundamentals late, and Pendle is early in a category-defining setup: real yield, real buybacks, real derivatives volume. The tokenomics reset was necessary and messy. The Boros bet is the kind of concentrated product wager that either becomes DeFi’s Chicago Mercantile Exchange for interest rates or fades into a footnote.

    The base case for end-2026 is $2.10. The bull case is $3.20. Both require the flywheel to become visible in on-chain data before speculators can rotate in. Neither is a certainty. If you are watching PENDLE, the levels to track are $1.35 on the downside and $2.10 on the upside. Everything in between is noise.


    Disclaimer: This article is for informational and educational purposes only and should not be construed as financial, investment, or trading advice. Cryptocurrency markets are highly volatile, and past performance does not guarantee future results. The price predictions and analyses presented here are based on AI models, technical indicators, and available data at the time of writing, they are not guarantees. Always conduct your own research (DYOR) and consult with a qualified financial advisor before making any investment decisions. Pump Parade and its authors do not assume liability for financial losses incurred based on information provided in this article.
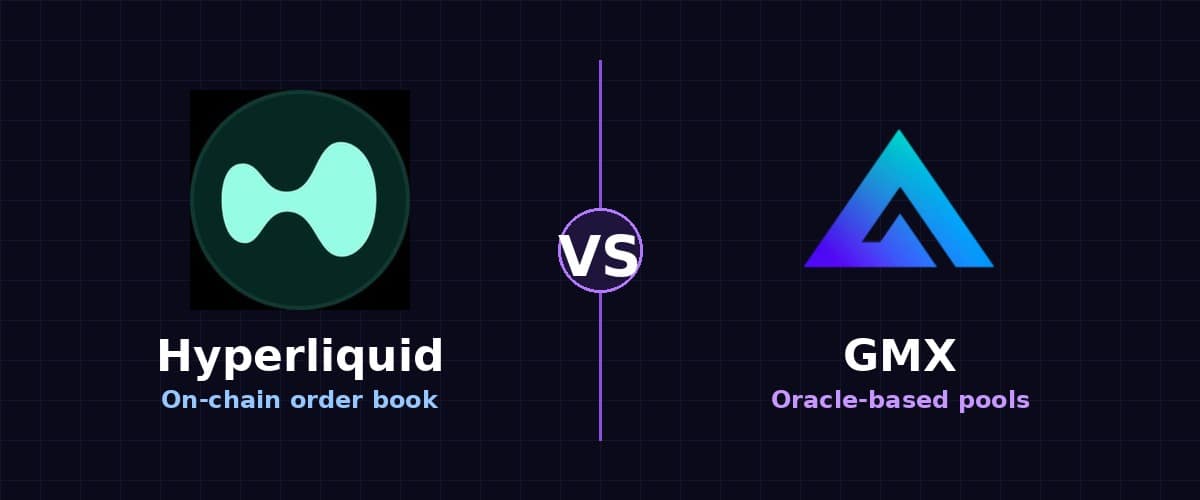
    Litecoin (LTC) Price Prediction 2026: Can LTC Hit $100?

    Litecoin trades at $46.89 at time of writing, up 3.2% over the past 24 hours and 7.9% over the past 30 days. That is not a moon-shot, but it is the first time in six months that LTC has strung together three straight weeks of gains. A quiet Litecoin price prediction 2026 story is finally getting louder.

    Two things are driving the shift. Canary Capital’s spot Litecoin ETF, ticker LTCC, has now been trading on Nasdaq for nine months. And the fourth Litecoin halving is roughly 12 months away, on or around July 27, 2027, when the block reward drops from 6.25 LTC to 3.125 LTC. Historically, the 6 to 12 months before a halving is where Litecoin does its heavy lifting.

    Here is what this article covers: current market context, the strongest bull and bear arguments, our timeframe-by-timeframe targets, how LTC stacks up against Bitcoin Cash, and the specific signals that would flip our view. Let’s get into the numbers.

    Key Takeaways

    • LTC trades at $46.89, +7.9% in 30 days, and is holding its 90-day trend line for the first time since January.
    • The Litecoin halving in July 2027 cuts issuance in half, historically a 6 to 12 month tailwind for price.
    • Canary Capital’s spot LTC ETF (LTCC) has been live since October 2025 but has only $5.4M in AUM so far.
    • Base case for late 2026: $70 to $95. Bull case: $110 to $135 if halving front-running kicks in early.
    • Bear case: a retest of $32 to $38 is on the table if BTC breaks below $58K or ETF flows stay flat.
    • LTC still trades 88% below its 2021 all-time high of $410. The $100 level is a psychological and technical pivot.
    Litecoin (LTC) price prediction 2026 hero graphic, current price $46.89, halving and ETF catalyst ahead

    Where Litecoin Stands Today

    Before we get to targets, the setup. Litecoin is a top-30 cryptocurrency by market cap, rank #27 as of publication, sitting between Uniswap and Gram (formerly Toncoin). It is one of the oldest active cryptocurrencies, launched by Charlie Lee in 2011 as a lighter, faster alternative to Bitcoin. Blocks confirm every 2.5 minutes versus Bitcoin’s 10, and the total supply is capped at 84 million coins, four times Bitcoin’s 21 million.

    The snapshot below is what any Litecoin price prediction 2026 write-up needs to start from. Numbers are pulled from CoinGecko at time of writing.

    Metric Value
    Price $46.89
    24-hour change +3.2%
    7-day change +5.1%
    30-day change +7.9%
    Market cap $3.63B
    24h volume $300.7M
    Market cap rank #27
    All-time high $410.26 (May 2021)
    Percent below ATH -88.6%

    Circulating supply sits at 77.4 million, or 92.1% of the max supply. That number matters: with less than 8% of coins left to mine, halving events land on an increasingly tight float, and the next one is now a year out.

    Why is Litecoin trending higher right now?

    Three things are showing up in the tape. First, on-chain payment usage. Over 150,000 LTC is now locked into MimbleWimble Extension Blocks (MWEB), Litecoin’s opt-in privacy layer that activated in 2022. Amsterdam’s Litecoin Summit in June 2026 accepted MWEB payments for tickets, and Coinbase and Bitget have expanded MWEB deposit and withdrawal support for verified users. This is not sexy, but it is real usage.

    Second, the halving countdown. The next Litecoin halving is expected on or around July 27, 2027, at block height 3,360,000 (tracked live on the Litecoin halving countdown). That is roughly 12 months away. In the last three halving cycles, LTC’s biggest price gains landed in the six to nine months before the event, not after. Traders who lived through 2019 and 2023 remember this, and positioning is starting earlier this time.

    Third, the LitVM narrative. The Litecoin Virtual Machine is an effort to bring smart contract capability to a chain that has, historically, only done payments. If LitVM delivers a usable developer environment, it changes Litecoin’s story from “aging payment coin” to “payment coin with a programmability upside.” That is a long shot in the short term, but it is on the whiteboard.

    What could push LTC to $100 in 2026?

    Catalyst 1: The 2027 halving is now inside the trading window

    Historically, the run-up to a Litecoin halving matters more than the halving itself. In 2019, LTC ran from around $30 to $140 in the six months before the event, then sold the news. In 2023, the run was smaller but still real: about $65 to $115 in the four months prior. With the July 2027 halving now 12 months out and 92% of supply already mined, positioning is starting to build.

    Catalyst 2: LTCC ETF as a slow but steady bid

    Canary Capital’s spot Litecoin ETF launched on Nasdaq in October 2025 and remains the only US spot LTC product. AUM is modest at $5.4M as of mid-June 2026, well behind Bitcoin ETFs. But there are two upside scenarios: a wave of altcoin ETF filings gets approved in late 2026 and LTCC becomes part of a broader “altcoin basket” narrative, or a single institutional allocator writes a nine-figure ticket. Either would meaningfully change the flow picture.

    Catalyst 3: MWEB adoption creates a real utility floor

    MimbleWimble Extension Blocks give LTC something no other top-30 crypto has: opt-in transaction privacy that clears fast and cheap. With over 90% of miners and nodes validating MWEB blocks and exchange support expanding, Litecoin is quietly becoming the default privacy-preserving payment rail for merchants who do not want to touch Monero. That is a small but sticky use case.

    What could send LTC below $40?

    Risk 1: ETF flows have disappointed

    Nine months in, LTCC has $5.4M in assets. For comparison, spot Bitcoin ETFs cleared $1B in their first month. If altcoin ETF interest remains this soft into 2027, the “institutional bid” thesis unwinds and LTC has to rally on retail alone. That is a lower ceiling.

    Risk 2: The 88% drawdown from ATH signals structural damage

    Litecoin peaked at $410 in May 2021 and has not printed above $150 since November 2021. The chart shows a repeated pattern of failed breakouts around the $110 to $130 zone. Every rally into that resistance in the last three years has been sold. Getting through it will take real volume, not just narrative.

    Risk 3: Bitcoin Cash and other Bitcoin forks compete for the same dollars

    Payment-focused Bitcoin forks are a crowded trade. Bitcoin Cash sits one spot ahead of LTC at rank #23 with a $4.37B market cap and has actually outperformed LTC over the past 30 days (+12.5% vs +7.9%). Capital rotating into “BTC alternative” narratives does not always land on Litecoin first.

    Litecoin Price Prediction 2026: Targets by Timeframe

    Litecoin (LTC) price prediction 2026 targets table, bear $32, base $80, bull $135

    Below is our AI hybrid model output, cross-checked against Standard Chartered’s constructive stance on crypto majors and consensus targets from Changelly, CoinCodex, and Coinpedia. All targets assume BTC holds above $58K.

    Short term (next 30 days)

    Bear: $42. Base: $50. Bull: $58. The near-term picture is driven by BTC. If Bitcoin holds $62K to $68K, LTC has room to grind toward $55 without much resistance. A daily close above $52 unlocks the next leg. A break below $44 puts $42 in play fast.

    Medium term (6 months, into early 2027)

    Bear: $38. Base: $72. Bull: $105. This is the window where halving positioning traditionally starts. Our base case assumes ETF flows stay flat, BTC ranges between $58K and $85K, and LTC benefits from generic “next halving” flows. The bull case requires either a fresh altcoin cycle or a step-change in LTCC inflows. External analysts have similar ranges: Changelly projects $52 by December 2026, while more optimistic models like Cryptopolitan see $125 average with a $160 ceiling.

    Long term (2027 to 2028, through the halving)

    Bear: $55. Base: $140. Bull: $250. The halving cycle historically compresses gains into the pre-event window. A base case of $140 assumes a modest cycle repeat with damped magnitude. The bull case of $250 is what happens if LTC catches a real altcoin rotation into the halving. Anything above $250 would require sustained ETF inflows we have not yet seen.

    How does Litecoin compare to Bitcoin Cash?

    LTC and BCH are the two payment-focused Bitcoin forks that still hold top-30 positions. If you are choosing between the two, this is where the numbers actually differ.

    Metric Litecoin (LTC) Bitcoin Cash (BCH)
    Price $46.89 $217.65
    Market cap $3.63B $4.37B
    Market cap rank #27 #23
    30-day change +7.9% +12.5%
    24h volume $300.7M $69.8M
    Percent below ATH -88.6% -94.3%
    Block time 2.5 minutes 10 minutes
    Privacy layer MWEB (opt-in) CashFusion (opt-in)
    Spot US ETF Yes (LTCC) No

    The read: BCH has slightly more market cap and better recent momentum, but LTC has four times the daily volume, a live spot ETF, and a functional privacy layer that is actually being used. If you want liquidity and institutional wrapping, LTC. If you want cheaper mean-reversion into a smaller float, BCH. See our full Bitcoin Cash price prediction for the BCH side of that trade.

    What Would Change Our View

    Three specific triggers would move us off the base case.

    Bullish shift: LTCC AUM crossing $75M in any single quarter. That would signal real institutional interest, not the retail trickle we have seen so far. Also: a daily close above $58 on volume greater than $400M would break the six-month downtrend.

    Bearish shift: A weekly close below $42 on rising volume would break the current uptrend and open a path to $32 to $38. That aligns with CoinCodex’s more pessimistic forecast of $37 to $44 for 2026. Also watch Bitcoin’s own setup: a BTC break below $58K historically drags LTC down 15% to 25% within two weeks.

    Neutral-to-bearish shift: If MWEB TVL flatlines below 170,000 LTC through Q4 2026, the utility narrative stalls and the halving becomes the only remaining catalyst. That is not fatal, but it caps upside meaningfully.

    Frequently Asked Questions

    Will Litecoin reach $100 in 2026?

    Reaching $100 in 2026 is possible but not our base case. It requires either an early move by halving-cycle traders, a step-change in LTCC ETF inflows, or a broader altcoin cycle led by top-30 large caps. Our bull case tops out at $105 by year-end, with base case closer to $72. A move to $100 would be a 113% gain from current levels.

    Is Litecoin a good investment in 2026?

    Litecoin is a long-standing proof-of-work asset with a fixed supply, 15 years of uptime, a spot US ETF, and a known 2027 halving catalyst. Those are real fundamentals. The counter: LTC has underperformed BTC in every cycle since 2017 and remains 88% below its 2021 high. Suitable for long-term investors comfortable with volatility; less suited to short-term momentum traders.

    What is the Litecoin price prediction for 2027?

    2027 is halving year, which historically front-loads gains into H1. Our base case for peak 2027 is $140, with a bull case near $250 if a real altcoin cycle materializes. Bear case is a muted halving that only takes LTC back to the $60 to $80 range. External projections from CoinCodex and Changelly cluster around $60 to $115 for average 2027 price.

    When is the next Litecoin halving?

    The next Litecoin halving is expected on or around July 27, 2027, at block height 3,360,000. The block reward will drop from 6.25 LTC to 3.125 LTC. Litecoin halves every 840,000 blocks, roughly every four years. The exact date can shift by a few days depending on average block time.

    Is Litecoin dead?

    No. LTC still processes hundreds of thousands of transactions per day, ranks in the top 30 by market cap, has a live US spot ETF, and hosts a functional privacy layer (MWEB) with over 150,000 LTC locked. Development is active, with LitVM under construction. It is not the hype trade it was in 2017, but it is not a dead chain.

    How does Litecoin compare to Bitcoin Cash?

    Both are Bitcoin forks focused on payments. LTC has faster blocks (2.5 min vs 10 min), higher daily volume ($300M vs $70M), a live US spot ETF, and MWEB privacy. BCH has a slightly higher market cap and better 30-day momentum. LTC is the more liquid, institutionally-wrapped bet; BCH is a lower-float, retail-driven trade.

    The Honest Take

    Here is the read. Litecoin is not a sexy trade in July 2026. The ETF is real but the flows are anemic. The halving is real but 12 months away. The MWEB story is real but slow-burn. What LTC has going for it is a floor: a well-known asset, top-30 liquidity, an ETF wrapper, and a hard-coded supply event on a known date.

    The setup that makes sense: watch $58 as the resistance that has to break, watch LTCC quarterly inflows for any change in institutional interest, and watch BTC as the tide that lifts or sinks all boats. Base case says LTC ends 2026 somewhere between $70 and $95. $100 is a stretch, not impossible. $150 requires help we do not yet see. And if you want a privacy-focused alternative with more explosive potential, see our Monero price prediction.

    The trade is boring on purpose. Boring can still work.

    Disclaimer: This article is for informational and educational purposes only and should not be construed as financial, investment, or trading advice. Cryptocurrency markets are highly volatile, and past performance does not guarantee future results. The price predictions and analyses presented here are based on AI models, technical indicators, and available data at the time of writing, they are not guarantees. Always conduct your own research (DYOR) and consult with a qualified financial advisor before making any investment decisions. Pump Parade and its authors do not assume liability for financial losses incurred based on information provided in this article.