

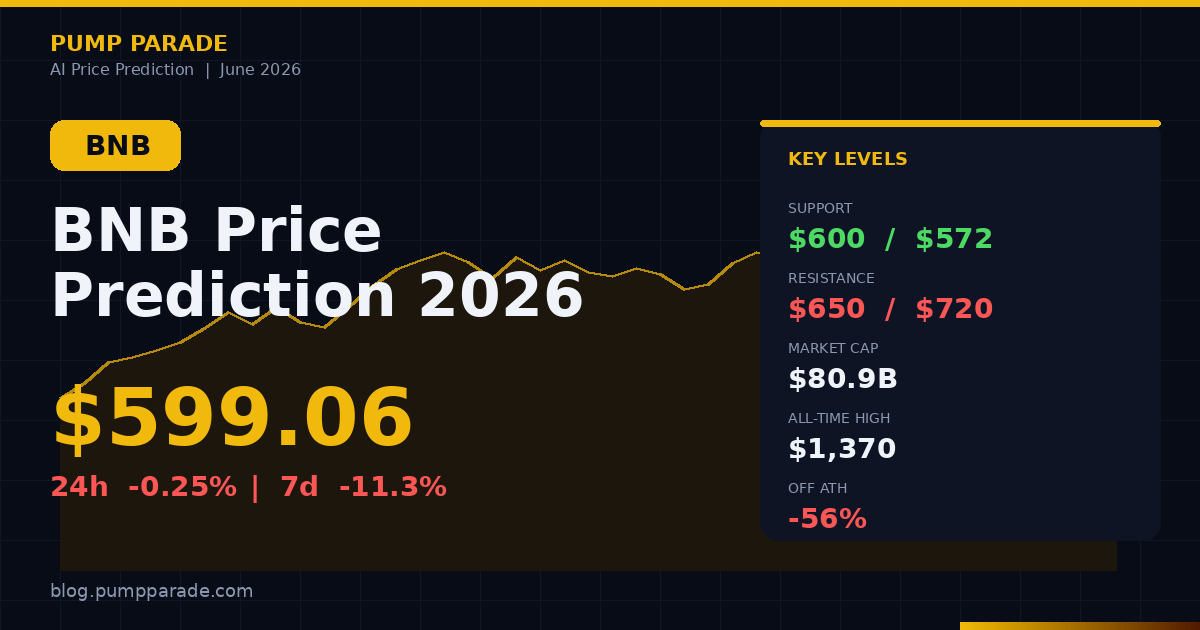
BNB is trading at $599 at time of writing, down 11% over the past 7 days and roughly 56% below its October 2025 all-time high of $1,369. The token is sitting right on the line that every BNB chart trader is watching: the $600 psychological support zone.
For a coin that just completed a $1.02 billion quarterly burn and watched its Layer-1 real-world asset value surge 76% in Q1, that price action looks disconnected from fundamentals. Our hybrid AI model assigns a 58% probability that BNB defends the $600 zone and recovers toward $720 by Q3 2026. The bear case, however, is far from dead.
Here is what the data says about BNB’s setup heading into the back half of 2026, plus our short, medium, and long-term price targets.
BNB Snapshot: Where Things Stand
BNB is the native token of the Binance ecosystem and BNB Chain, one of the most-used Layer-1 networks by daily transactions. It powers trading fee discounts on Binance, gas on BNB Smart Chain, and a growing list of DeFi, gaming, and tokenized asset applications.
Here are the numbers that matter right now:
- Current price: $599.06
- Market cap: $80.9 billion (rank #5 globally)
- 24-hour volume: $737 million
- Circulating supply: ~134.78 million BNB
- Target max supply: 100 million (via Auto-Burn)
- All-time high: $1,369.99 (October 13, 2025)
- 7-day change: -11.3%
- 30-day change: -7.8%
The 90-day range tells the story: BNB peaked at $718 in mid-March and has been grinding lower since. The recent breakdown from $650 was the first major technical failure in months. Now $600 has to hold, or the next stop is $571, the 90-day low.
The Burn: Why BNB’s Supply Story Is Still Underrated
BNB just completed its 35th quarterly burn, removing 1.56 million tokens worth about $1.02 billion from circulating supply. Combined with the 34th burn earlier in 2026, the network has destroyed roughly 2.93 million BNB this year alone. That is real, verifiable, deflationary action.
Here is why that matters in plain terms. BNB uses an Auto-Burn mechanism: a formula that adjusts each quarterly burn based on BNB’s average price and the number of blocks produced on BNB Smart Chain during the quarter. The goal is to shrink total supply from the original 200 million down to 100 million. After the 35th burn, supply now sits at about 134.7 million tokens. BNB Chain confirms roughly 65 million tokens still need to come out of circulation before the target is hit.
On top of the quarterly burns, the BEP-95 upgrade introduced a real-time gas-fee burn that runs every block. That mechanism has already removed an estimated 281,000 additional BNB tied to network activity.
Translation: every BNB still in circulation gets a structural tailwind from a shrinking float. The market sometimes ignores this during selloffs. Long-term, it compounds.
Technical Analysis: The $600 Battle
The chart is telling a clear story. BNB lost the $650 support level last week on rising volume, and bulls have spent the past few sessions defending the $600 round number. Here is what the indicators say:
- Key support: $600 (psychological), $572 (90-day low), $550 (next major demand zone)
- Key resistance: $650 (recent breakdown level), $720 (90-day high), $800 (Q1 2026 resistance)
- 200-day moving average: ~$680 (BNB is trading below it, a bearish signal)
- Relative Strength Index (a momentum gauge): hovering near 35 on the daily chart, which is approaching oversold territory but not yet at extremes
Two scenarios stand out from the chart. First, if BNB holds $600 and prints a daily close above $620, the path of least resistance shifts back to $650 and then $720. Second, if $600 fails on a daily close, the move down to $572 opens up quickly, and a flush to $530-$550 becomes the higher-probability outcome.
Our AI model gives the bullish reclaim scenario a 58% probability, mostly because of the upcoming Q3 burn catalyst and the structural support clustered between $572 and $600.
The Bull Case: Why BNB Could Reclaim $800+ in 2026
Several catalysts could fuel a BNB rebound in the second half of 2026:
Continued deflation. The 36th quarterly burn is scheduled for around late September. Based on current price action and block production, analysts estimate it could remove another 1.3 to 1.5 million BNB. That is roughly another $800 million in supply destruction. Historically, BNB has rallied an average of 8 to 12% in the two weeks following burn announcements.
BNB Chain RWA growth. The tokenized real-world asset value on BNB Chain surged 76% in Q1 2026, with stablecoins, tokenized treasuries, and gold-backed assets driving the move. RWAs are the cleanest narrative in crypto right now, and BNB Chain is quietly building share alongside Ethereum and Solana.
Binance ecosystem expansion. Binance remains the largest centralized exchange by volume globally. Every new product launch (futures markets, copy trading, staking expansions) drives BNB demand through fee discounts and platform utility.
Bull case price targets:
- 30 days: $700-$750 if $600 holds and Q3 burn anticipation kicks in
- 6-12 months: $900-$1,000 if broad crypto risk appetite returns
- 2-3 years: $1,400-$1,700 retest, with ATH breakout possible if Binance ecosystem keeps compounding
The Bear Case: What Could Go Wrong
A balanced analysis has to acknowledge what kills the BNB thesis. The risks are real:
Regulatory pressure on Binance. Binance has spent years working through global regulatory issues. New enforcement actions in any major jurisdiction could weigh on BNB sentiment, even when the token itself is unaffected. This is a constant background risk.
BNB Chain competition. Solana, Base, Hyperliquid, and other Layer-1s are aggressively pulling DeFi volume and developer attention. If BNB Chain’s share of total DEX volume keeps slipping, the ecosystem story weakens.
Broader crypto risk-off. BNB has a high correlation to Bitcoin during selloffs. If BTC loses its key support and breaks back below $55,000, expect BNB to revisit $500 or lower regardless of the burn story.
Bear case price targets:
- 30 days: $520-$550 if $600 fails on a daily close
- 6-12 months: $450-$500 if a broader risk-off move continues
- 2-3 years: $600-$800 range-bound if Binance loses market share to competitors
BNB Price Prediction: Our AI Model’s View
Pulling the bull and bear scenarios together, here is what our hybrid model is forecasting for BNB across three timeframes. These are probability-weighted ranges, not guarantees.
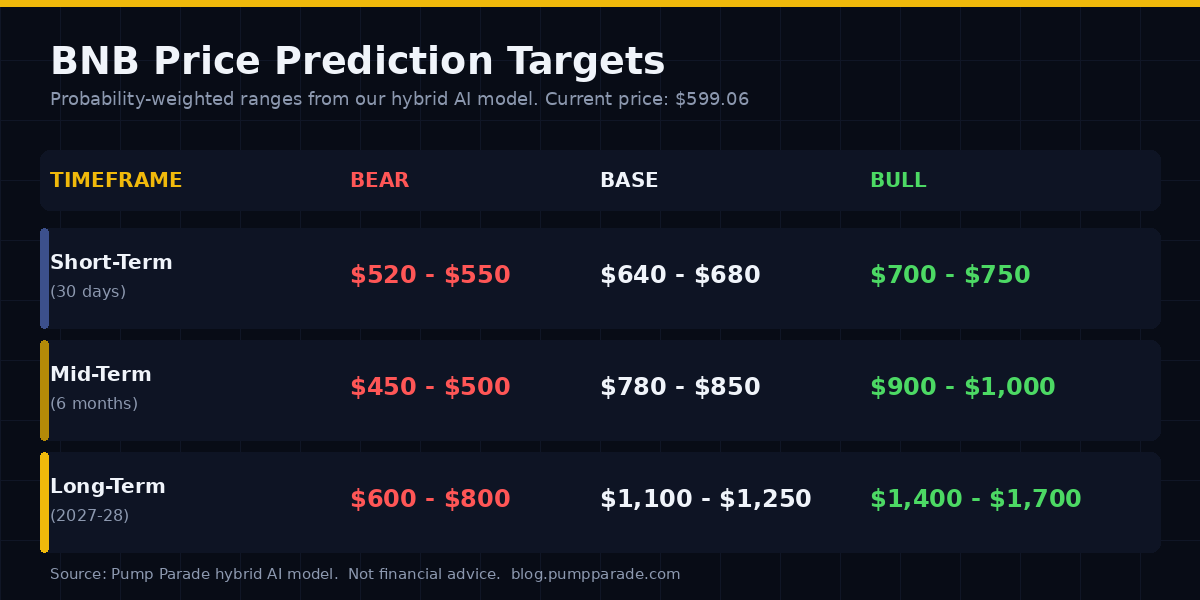
Short-term (30 days), the base case is a defense of $600 followed by a grind back toward $700. Mid-term (6 months), the Q3 burn and a possible crypto market recovery point toward $900 in the base scenario. Long-term (2027-2028), an ATH retest at $1,370 is realistic if the deflationary mechanic continues and Binance maintains its leadership position.
For context on how BNB stacks up against other Layer-1 tokens trading near key technical levels, see our Solana price prediction covering the Alpenglow catalyst.
What to Watch
BNB’s setup over the next 30 to 60 days comes down to a few clear levels and events. Here is the watchlist:
- $600 daily close. A close above $620 flips the short-term tape bullish. A close below $590 opens the door to $550.
- Bitcoin’s direction. BNB rarely fights the broader market. Watch BTC’s response to the $60K-$65K range.
- Q3 burn announcement. The 36th burn typically gets pre-announced 7-10 days before execution. That window has historically been a tradeable catalyst.
- BNB Chain TVL. If total value locked on BNB Chain holds above $5 billion and RWA value keeps climbing, the structural bull case stays intact.
- Coinbase BNB listing developments. Continued US exchange access has been a slow-burn tailwind.
Final Take
BNB is in one of those zones where the technical picture and the fundamental picture disagree. Charts look heavy. Fundamentals (the burn, the RWA growth, the ecosystem footprint) look strong. That setup usually resolves in one of two ways: a quick washout that prints a long-term bottom, or a slow basing pattern that catches everyone off guard.
The smart move is not to predict which one. The smart move is to define your levels in advance and react to what the market actually does. $600 holds, you can lean toward the bull case. $600 breaks on real volume, you respect the bear case.
BNB’s story for 2026 is still mostly intact. The token just needs the chart to catch up to the fundamentals.
Disclaimer: This article is for informational and educational purposes only and should not be construed as financial, investment, or trading advice. Cryptocurrency markets are highly volatile, and past performance does not guarantee future results. The price predictions and analyses presented here are based on AI models, technical indicators, and available data at the time of writing. They are not guarantees. Always conduct your own research (DYOR) and consult with a qualified financial advisor before making any investment decisions. Pump Parade and its authors do not assume liability for financial losses incurred based on information provided in this article.
