More
    Home Blog Page 8

    Cosmos (ATOM) Price Prediction 2026: Can ATOM Hit $5?

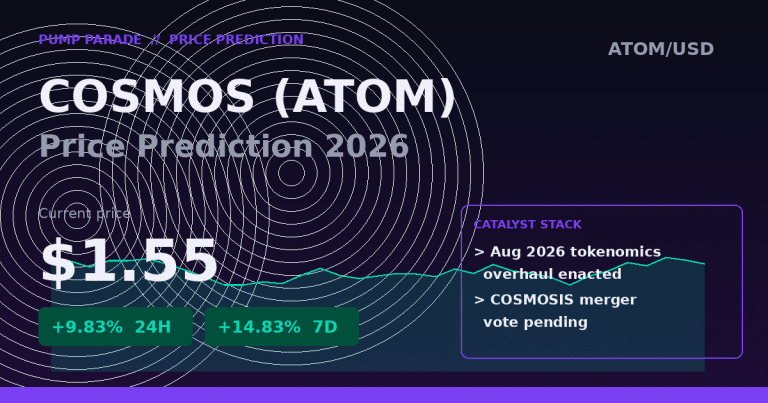
    Cosmos ATOM price prediction 2026 conversations look completely different than they did six months ago. ATOM is trading at $1.55, up 9.8% in 24 hours and 14.8% over the last week. That is the strongest weekly move ATOM has printed all summer, and it is landing right as the Cosmos Hub finalizes the most aggressive economic overhaul in its history.

    The Hub just enacted a tokenomics rewrite in August 2026 that swaps out inflationary rewards for a fee-driven buyback-and-burn model. The Osmosis merger proposal, first published in March by co-founder Sunny Aggarwal, is grinding through governance. And Interchain Security keeps quietly adding paying consumer chains that route fees back to ATOM stakers.

    So the real question is not whether ATOM bounces. It already bounced. The question is whether the fundamentals finally justify a re-rating toward $3, $5, or higher, or whether this is just another oversold pop inside a five-year downtrend. Here is what the data says.

    Key Takeaways

    • ATOM trades at $1.55, market cap $606M, ranked #90, still down 96.5% from its January 2022 all-time high of $44.55.
    • The August 2026 tokenomics overhaul flips ATOM from inflationary to potentially net deflationary under sustained fee volume.
    • The Osmosis merger would convert roughly 665 million OSMO at a 0.0355 ratio and route DEX revenue back to ATOM stakers.
    • Base case for late 2026: $2.00 to $3.25. Bull case if merger passes and burns activate: $3.50 to $5.50.
    • Biggest risk: governance stalls, the merger fails, and ATOM slips back into its multi-year descending channel.
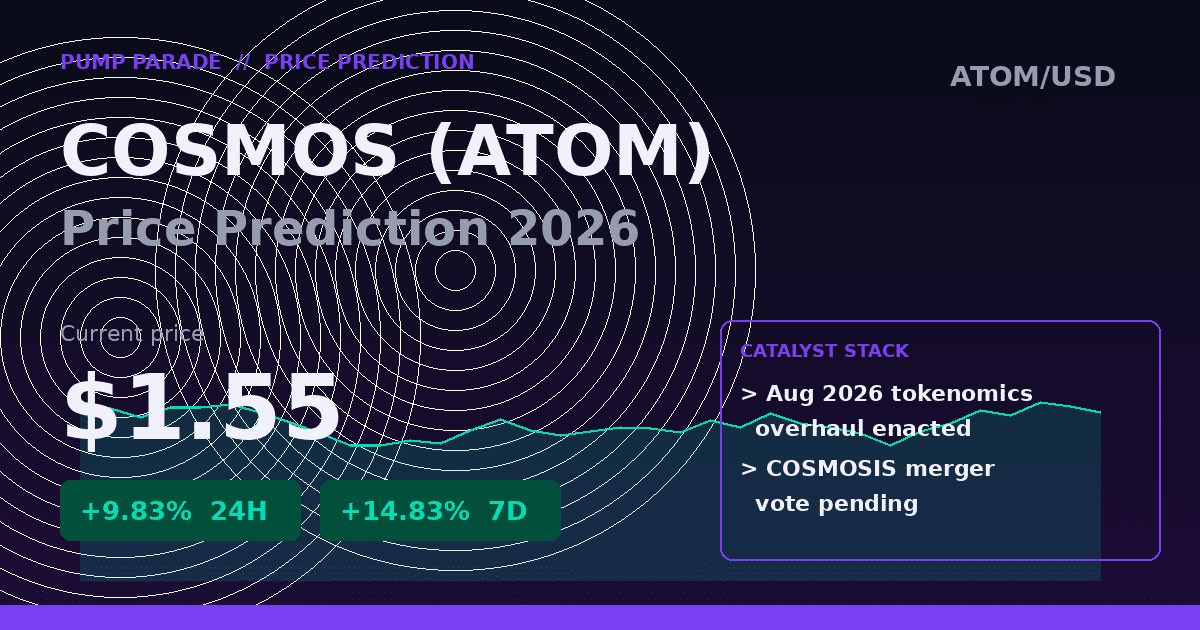
    Cosmos (ATOM) price prediction 2026 hero graphic - current price $1.55, Osmosis merger and tokenomics burn catalyst

    Where Cosmos (ATOM) Stands Today

    Before we get to targets, look at what the market is pricing right now. This is not a moonshot chart. This is a battered layer-1 with a real recovery setup and a live catalyst calendar.

    Metric Value
    Price $1.55
    24h change +9.83%
    7d change +14.83%
    Market cap $606 million
    24h volume $45.2 million
    Market cap rank #90
    All-time high $44.55 (Jan 2022)
    % from ATH -96.5%

    Volume expanded roughly 280% in the last 24 hours. That is the tell. A 15% weekly rally with contracting volume is a bounce inside a downtrend. A 15% rally with a nearly 4x volume expansion is participation, and participation is what separates real trend reversals from bear market rallies.

    Why is ATOM rallying right now?

    Three things are stacking at the same time, and that is unusual for a token that has spent most of 2026 grinding lower inside a descending channel.

    First, the August 2026 tokenomics overhaul officially enacted this month. Cosmos is moving from a high-inflation staking model to a fee-driven buyback and burn. Under the new design, protocol revenue accrues to ATOM through repurchases instead of being diluted away by fresh emissions. In plain terms: the Hub finally decided to stop paying its stakers with its own printing press.

    Second, the Osmosis merger is progressing through governance. Osmosis co-founder Sunny Aggarwal published the COSMOSIS proposal in March 2026. If it passes, roughly 665 million OSMO gets converted into ATOM at a 0.0355 exchange ratio, and Osmosis, which generated about $5.5 million in revenue last year against only $550,000 in operating costs, funnels that profit stream to ATOM holders. That is not a governance rounding error. That is DEX revenue rerouted to the Hub.

    Third, Interchain Security continues to add consumer chains that pay ATOM stakers directly. Every chain that rents Hub security is a permanent fee source. It is a slow-compounding story, but it is a story where the direction is clear.

    Stack a real economic redesign, a merger that would consolidate liquidity and governance, and a growing appchain economy paying fees back to the Hub. Now you understand why the tape moved.

    The Bull Case for ATOM

    Deflationary tokenomics finally activate

    This is the biggest one. If the new fee-burn model captures enough revenue to offset remaining emissions, ATOM becomes structurally scarce. Similar shifts on other networks (think ETH’s EIP-1559 flip) preceded meaningful re-ratings. The market has never priced ATOM as a deflationary asset because it has never been one. That could change fast.

    Osmosis merger passes

    The COSMOSIS proposal, if approved by both chains, does three things at once: reduces circulating supply pressure (converted OSMO gets locked into staking incentives), consolidates DEX revenue under the Hub, and eliminates a competing governance token in the ecosystem. Analysts at CryptoRank flag a $3.50 to $5.50 range for late 2026 as achievable if the merger executes cleanly and the burn model produces measurable supply reduction.

    IBC Eureka and CometBFT scaling

    The technical roadmap is aggressive: IBC Eureka expands interoperability beyond the Cosmos zone, and CometBFT performance work targets 10,000+ TPS on the Hub. If shipped on schedule, this repositions Cosmos as serious modular infrastructure instead of a stagnating layer-1. Markets pay a premium for credible throughput narratives, and Cosmos historically underprices delivery.

    The Bear Case for ATOM

    Governance stalls, merger fails

    Cosmos governance is famously slow and philosophically divided. The Osmosis merger requires approval on both chains. If either side fails to reach quorum or the community rejects the OSMO-to-ATOM conversion ratio, the primary near-term catalyst evaporates. That would likely send ATOM back toward the $1.20 to $1.35 support zone.

    Inflation offsets outrun burns

    The new tokenomics only work if fee revenue is large enough to actually turn the burn into net negative supply. If Hub throughput and Interchain Security adoption stay modest, ATOM’s issuance continues to outpace burns, and the deflationary narrative dies before it starts. Bearish analyst targets from Changelly cluster around $1.41 to $1.67 for December 2026.

    Competition from purpose-built rivals

    Modular blockchain competitors, from Celestia to purpose-built appchain platforms, are moving fast. Cosmos still has a technological moat around IBC, but “we shipped interop first” is a fading argument when execution speed becomes the differentiator. The bear case is not that Cosmos disappears. It is that it stays a top-100 asset instead of climbing back into the top 30.

    ATOM Price Prediction 2026: Targets by Timeframe
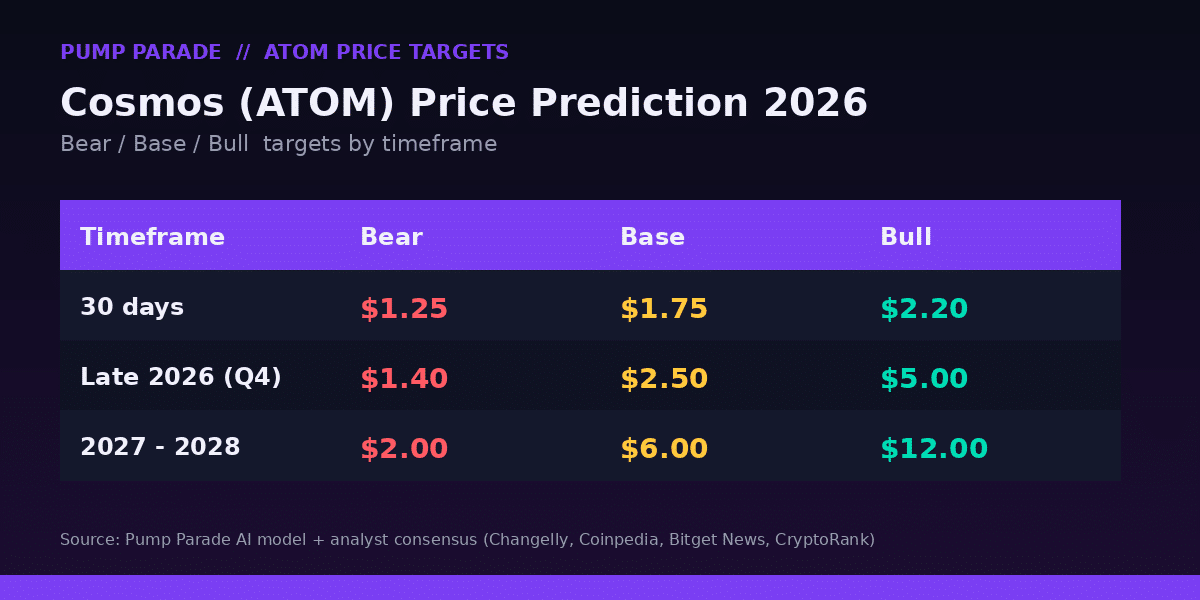
    Cosmos (ATOM) price prediction 2026 targets table - bear $1.40, base $2.50, bull $5.00 by Q4 2026

    Here is how we map the bear, base, and bull cases across three timeframes. These are scenario ranges, not point forecasts. Every target assumes the reader tracks the invalidation triggers listed further down.

    Timeframe Bear Base Bull
    30 days $1.25 $1.75 $2.20
    Late 2026 (Q4) $1.40 $2.50 $5.00
    2027-2028 $2.00 $6.00 $12.00

    30-day outlook

    Short-term momentum favors the bulls after the volume expansion, but ATOM needs to hold above $1.42 to keep the reversal thesis intact. A break of that level puts the $1.25 to $1.30 zone back in play. Upside is capped at roughly $2.20 without a clear governance win.

    6-month outlook

    By Q4 2026 the market will know whether the Osmosis merger actually passed and whether the burn model is producing measurable supply reduction. Base case is a slow grind into the $2.00 to $3.25 range, matching independent analyst forecasts. Bull case, if both catalysts land clean, extends to $5.00. That would be a 3x from current price, in line with what Coinpedia and Coinbase model under favorable ecosystem conditions.

    Long-term (2027-2028)

    Multi-year targets are wildly divergent. Changelly’s model reaches into the high-single-digits for 2027 under moderate growth assumptions. Bitget News flags a $12 aspirational scenario tied to sustained IBC growth and successful modular positioning. We think $6 is a realistic long-term base if execution stays on track, and $12 requires a broader risk-on cycle where mid-cap L1s meaningfully re-rate. See CoinMarketCap’s live ATOM page for real-time market context as this plays out.

    How does Cosmos (ATOM) compare to Polkadot (DOT)?

    The closest apples-to-apples comparison is Polkadot (DOT). Both are interop-focused layer-1s with app-chain economies, and both spent 2025-2026 trying to reboot their tokenomics. Here is how they stack up right now.

    Metric Cosmos (ATOM) Polkadot (DOT)
    Interop model IBC (permissionless) XCM (shared security)
    Consensus CometBFT GRANDPA/BABE
    App-chain security Optional (ICS) Shared by default
    Tokenomics 2026 Fee burn (new) JAM redesign
    Ecosystem strength dYdX, Neutron, Celestia lineage Parachain slots, Kusama
    Market cap $606M ~$4.5B
    % from ATH -96.5% -94%

    DOT has more market cap and more institutional attention. ATOM has the simpler upgrade story and lower entry price. If you believe interop is a winner-take-most category, DOT is the safer bet. If you believe the modular thesis rewards permissionless chain-launching plus a live catalyst calendar, ATOM has more asymmetric upside from these levels.

    Is ATOM a good investment in 2026?

    The bull side: ATOM is priced like a failed layer-1 and about to be tested against active catalysts. If any two of the three (tokenomics burn, Osmosis merger, ICS growth) deliver, the current $1.55 will look like an entry point in retrospect. The bear side: ATOM has disappointed for three straight years, governance moves slowly, and the market has learned to fade Cosmos catalysts. Both takes have receipts.

    The honest framing: ATOM is a medium-conviction recovery trade with clearly defined invalidation levels. It is not a long-term thesis you set and forget. It is a setup where the next 90 days will tell you whether the recovery holds. Position accordingly.

    What Would Change Our View

    Three explicit scenario triggers to watch:

    1. Bullish trigger: Osmosis merger governance passes with clean quorum on both chains AND the first monthly burn report shows net negative supply. That would validate the deflationary case and open the $3.50 to $5.50 zone.
    2. Bearish trigger: ATOM loses the $1.42 support on daily close with rising volume, and the merger vote fails or gets postponed. That combination sends the setup back into the descending channel with $1.20 the next real support.
    3. Long-term invalidation: Twelve months of the new tokenomics model produce burns smaller than continued emissions. That would mean the redesign is not materially deflationary, and the market will re-price ATOM as an inflating asset again.

    Cosmos ATOM Price Prediction: What are the top FAQs?

    Will Cosmos ATOM reach $5 in 2026?

    Under a bull case where the Osmosis merger passes and the new fee-burn model produces net deflationary supply, $5 is achievable by late 2026. That is roughly a 3x from current price. Under a base case, ATOM trades in the $2.00 to $3.25 range. Under a bear case, it stays sub-$1.75 for most of the year. The catalyst calendar over the next 90 days will tell you which path is unfolding.

    Is Cosmos ATOM a good investment in 2026?

    ATOM offers asymmetric upside from current levels because it is priced near multi-year lows while active fundamental catalysts are approaching governance decisions. The risk is that Cosmos governance is historically slow and past catalysts have underdelivered. Treat it as a medium-conviction recovery trade with defined stop levels, not a long-term buy-and-hold thesis.

    Why has ATOM underperformed for so long?

    ATOM’s core problem was that value accrual to the Hub never matched the growth of the wider Cosmos ecosystem. Chains built on Cosmos SDK, from dYdX to Celestia, captured huge value without paying meaningful fees back to ATOM holders. High inflation on the Hub compounded the pain. The August 2026 tokenomics overhaul directly addresses both issues, which is why this setup is different.

    What is the Osmosis merger and why does it matter?

    The COSMOSIS proposal, published in March 2026 by Osmosis co-founder Sunny Aggarwal, would convert about 665 million OSMO into ATOM at a 0.0355 ratio and merge Osmosis DEX infrastructure directly into the Cosmos Hub. It matters because it consolidates DEX liquidity under the Hub, routes DEX revenue to ATOM stakers, and reduces circulating governance token supply across the ecosystem.

    What is the long-term ATOM price prediction for 2027-2028?

    Analyst forecasts vary widely. Changelly and Coinpedia cluster around $4 to $8 for 2027 under moderate growth. Bitget News highlights $12 as an aspirational scenario tied to sustained IBC adoption and modular thesis validation. Our base case for 2027-2028 sits at $6 with $12 achievable only in a broader risk-on cycle where mid-cap layer-1s meaningfully re-rate.

    How does ATOM compare to other Cosmos ecosystem tokens?

    ATOM secures the Hub and now captures fees from Interchain Security consumer chains. Tokens like Injective (INJ) and Celestia (TIA) use Cosmos SDK but have separate token economies. If the Cosmos thesis is right long term, all three benefit, but ATOM is the coordination asset with the clearest catalyst calendar in Q3-Q4 2026.

    The Honest Take

    ATOM in August 2026 is not a story about ripping to new highs. The all-time high is $44.55 and we are 96% below that. The story is whether a battered, undervalued layer-1 with a fresh economic redesign and a live merger vote can grind back into the $3 to $5 range where the market takes it seriously again.

    The catalyst stack is real. The volume expansion is real. The competition is also real, and Cosmos governance has a documented history of underdelivering. If you are trading this, size it as a recovery play with $1.42 as your invalidation level and $5 as your bull target for late 2026. If you are long-term allocating, wait for the first monthly burn report to confirm the tokenomics are actually working before adding size.

    Either way, this is the most interesting setup ATOM has offered in eighteen months. Watch it closely.


    Disclaimer: This article is for informational and educational purposes only and should not be construed as financial, investment, or trading advice. Cryptocurrency markets are highly volatile, and past performance does not guarantee future results. The price predictions and analyses presented here are based on AI models, technical indicators, and available data at the time of writing, they are not guarantees. Always conduct your own research (DYOR) and consult with a qualified financial advisor before making any investment decisions. Pump Parade and its authors do not assume liability for financial losses incurred based on information provided in this article.


    Orca vs Meteora: Best Solana DEX in 2026

    0

    If you trade on Solana, the odds are high that your swap ends up routing through either Orca or Meteora. Together, they sit at the heart of Solana’s DEX stack, splitting billions in monthly volume and pulling in some of the deepest liquidity outside of Jupiter’s aggregation layer. But they take very different paths to get there, and that difference matters whether you’re a swap-and-forget trader or an LP hunting yield.

    This is a head-to-head review of Orca and Meteora for 2026. We compare fees, liquidity models, LP experience, security, token economics, and the situations where one wins over the other. If you’re just here for the verdict, jump to the TL;DR below. Otherwise, keep reading for the full breakdown.

    TL;DR: Quick Verdict

    Winner for casual swappers: Orca. The cleanest UI on Solana, tight blue-chip pools, and a fee structure that’s easy to reason about.

    Winner for LPs and memecoin traders: Meteora. Dynamic fees, automated bin management, and quote-only-fee support on volatile pools give it a real edge on memecoin duty.

    Winner for total market share: Meteora. It’s regularly one of the top five DEXs globally by volume in 2026, powered by DLMM sitting under the memecoin firehose.

    Winner for LP simplicity: Orca. Meteora rewards LPs who understand what they’re doing. Orca lets you deposit and mostly walk away, especially on stable and blue-chip pools.

    Orca Overview

    Orca DEX Solana Whirlpools brand image

    Orca launched in 2021 and quickly earned a reputation as the friendliest DEX on Solana. Its flagship product, Whirlpools, is a concentrated liquidity market maker (CLMM) modeled after Uniswap v3, but tuned for Solana’s fast, cheap execution. LPs pick a price range, deposit two tokens, and earn fees when the pool trades inside that range.

    As of mid-2026, Orca sits at roughly $240M in total value locked according to DeFiLlama. Daily volume runs into the hundreds of millions on active days, and Orca hit $6.7B in 30-day volume in Q2 2026, briefly leading every Solana DEX by that metric. Fee tiers on Whirlpools range from 1 basis point on ultra-stable pools up to 200 basis points on long-tail pairs, set at pool deployment.

    Orca’s design philosophy is best summarized as “boring wins.” Where other DEXs chase memecoin flow with exotic mechanisms, Orca sticks to a proven CLMM model, invests in UX polish, and lets Jupiter route memecoin volume through it when the price is right.

    Meteora Overview

    Meteora DLMM Solana brand image

    Meteora is a Solana-native liquidity layer built around three main products: DLMM (Dynamic Liquidity Market Maker), DAMM v2 (Dynamic AMM), and Dynamic Vaults. It’s the most experimental of the major Solana DEXs, and that experimentation has paid off during the 2024-2026 memecoin era.

    DLMM uses a bin-based liquidity model similar in spirit to Trader Joe’s Liquidity Book on Avalanche, but with dynamic fees that scale with volatility. When a pool goes wild, LPs earn more per swap. When it’s calm, fees settle back down. A Q1 2026 upgrade added quote-only fees, which lets LPs on memecoin pools earn fees denominated purely in SOL or USDC rather than the speculative token, a genuine game-changer for LP survivability.

    Total TVL across Meteora sits around $270M, with DLMM alone accounting for roughly $170M according to DeFiLlama. In peak volume weeks, Meteora regularly contributes 9-15% of total global DEX volume and cracks the global top five, which is remarkable for a protocol that’s Solana-only.

    Liquidity Models: CLMM vs DLMM

    The core technical difference between these two DEXs is how they park liquidity.

    Orca’s Whirlpools use continuous concentrated liquidity. As an LP, you pick a min and max price. Your capital sits between those bounds and earns swap fees when the pool price trades through your range. Move outside the range and your position stops earning until price returns. It’s efficient, but it demands active management, especially on volatile pairs.

    Meteora’s DLMM breaks liquidity into discrete price bins. Each bin holds liquidity at exactly one price. When someone swaps, they consume bins one at a time, moving through the price ladder. Meteora offers pre-built distribution strategies (Spot, Curve, Bid-Ask) so you don’t have to design a bin curve from scratch, and dynamic fees push the effective rate up during volatile moments to compensate LPs for impermanent loss.

    In practice, this means:

    • Blue-chip pairs (SOL/USDC, JitoSOL/SOL, mSOL/SOL): Orca and Meteora are close, but Orca’s clean 1bp and 5bp tiers plus deep liquidity tend to give it slightly tighter effective spreads.
    • Volatile memecoin pairs: Meteora’s dynamic fees, quote-only fees, and bin flexibility usually win. LPs who’d get vaporized on Orca can actually survive on Meteora.
    • Long-tail launches: Meteora’s DBC (Dynamic Bonding Curve) and launch tools give it a real edge for token teams, which drags trader volume there too.

    Fees Breakdown

    Orca Fees

    Whirlpools has multiple fixed fee tiers set at pool creation. Common tiers are 0.01% (ultra-stable), 0.05% (stable), 0.30% (standard), and 1.00% (exotic). A pool creator can also deploy at 2.00% for very illiquid pairs. Of every fee dollar collected, roughly 87% goes to LPs, 12% to the Orca DAO treasury, and 1% to the Orca Climate Fund. Over a rolling 30-day window in mid-2026, Orca has been generating around $2M in fees, with a bit over $240K flowing to protocol revenue.

    Meteora Fees

    Meteora’s DLMM uses a base fee plus a variable fee component. The variable fee grows with volatility, so during frantic memecoin moves an LP might see 2-4% effective fees on individual swaps. During calm periods it drops back to the base tier. Dynamic vaults and DAMM v2 pools use different mechanics, but the principle is the same: fees flex with market conditions. In May 2025 Meteora briefly generated over $5M in daily fees, exceeding the Solana base layer itself, giving you a sense of how much throughput this thing handles when memecoins go parabolic.

    Fees for Traders

    If you’re swapping through Jupiter (which routes through both), the fee is embedded in the swap and you rarely notice which DEX filled you. If you swap directly on either site, expect roughly 0.30% on standard pools, less on stables, and more on volatile pairs. Meteora’s dynamic fees can spike during high-volatility windows, which is a feature for LPs and a mild annoyance for traders.

    LP Experience

    This is where these two DEXs really diverge.

    Orca’s LP flow is one of the cleanest in DeFi. Pick a pool, pick a range, deposit. The UI shows you your projected APR based on recent fees, and pool analytics are surfaced clearly. There’s no automated range management inside Orca itself, though third parties like Kamino and Meteora’s own vaults have historically automated Orca LP positions.

    Meteora’s LP flow is more powerful and more complex. You choose a strategy shape (Spot for uniform coverage, Curve for tight-around-price, Bid-Ask for wide edge coverage), pick your bin range, and deposit. Dynamic vaults abstract this away by auto-managing bins for you, and DAMM v2 pools work like a more traditional AMM if you want to skip the bin decisions entirely.

    A useful mental model: if you’re LPing SOL/USDC and want to set-and-forget, Orca is fine. If you’re LPing a memecoin and want to survive the first 48 hours after launch, Meteora’s dynamic fees and quote-only fees are the more honest choice.

    Security & Trust

    Both protocols have long track records at this point. Orca has been live since 2021 with no serious exploit on the core Whirlpools contracts. It has been audited by multiple firms including Kudelski Security and Neodyme, and its code is open source. The team is public, based partly out of the US, and its governance token ORCA has been trading since the earliest days of the protocol.

    Meteora has been audited by OtterSec, Sec3, and Offside Labs across its DLMM, DAMM v2, and vault contracts. It has also operated without a major exploit, though DLMM as a mechanism is younger than Orca’s CLMM approach. Meteora’s MET token launched in 2026 after a long anticipated distribution to LPs and users, which added a governance and value-accrual layer that Meteora lacked in its first two years.

    Neither protocol takes custody of funds. Both are non-custodial AMMs where you interact from your own wallet, so your keys and your wallet security matter more than the DEX itself.

    User Experience

    Orca is regularly cited as the most user-friendly DEX on Solana. Its UI is clean, its swap page is fast, and the LP dashboard is arguably the best pool analytics view in the ecosystem. There is no dedicated Orca mobile app, but the site works well on mobile browsers.

    Meteora’s UI is more powerful and more busy. The DLMM pool page in particular can feel overwhelming for a first-timer because it exposes so much of the mechanism. Once you get used to it, the level of control is a genuine advantage. Meteora also has strong integration with Jupiter, so a huge fraction of its volume comes through Jupiter’s aggregator rather than Meteora’s own UI.

    Token & Governance

    ORCA has been live since 2021 and is the governance token for the Orca DAO. It captures roughly 12% of pool fees to the DAO treasury, and holders vote on protocol parameters. Circulating supply, treasury policy, and fee direction have been the main subjects of governance since launch. You can read more about ORCA’s value accrual in our Orca price prediction analysis.

    MET launched in 2026 and gives Meteora holders a claim on protocol revenue and governance rights across DLMM, DAMM v2, and vaults. The launch itself was a long-running community topic during 2024-2025, with a large portion of supply routed to LPs and community members who’d supported the protocol during its formative years.

    Head-to-Head Comparison

    Here’s the quick side-by-side, updated for mid-2026:

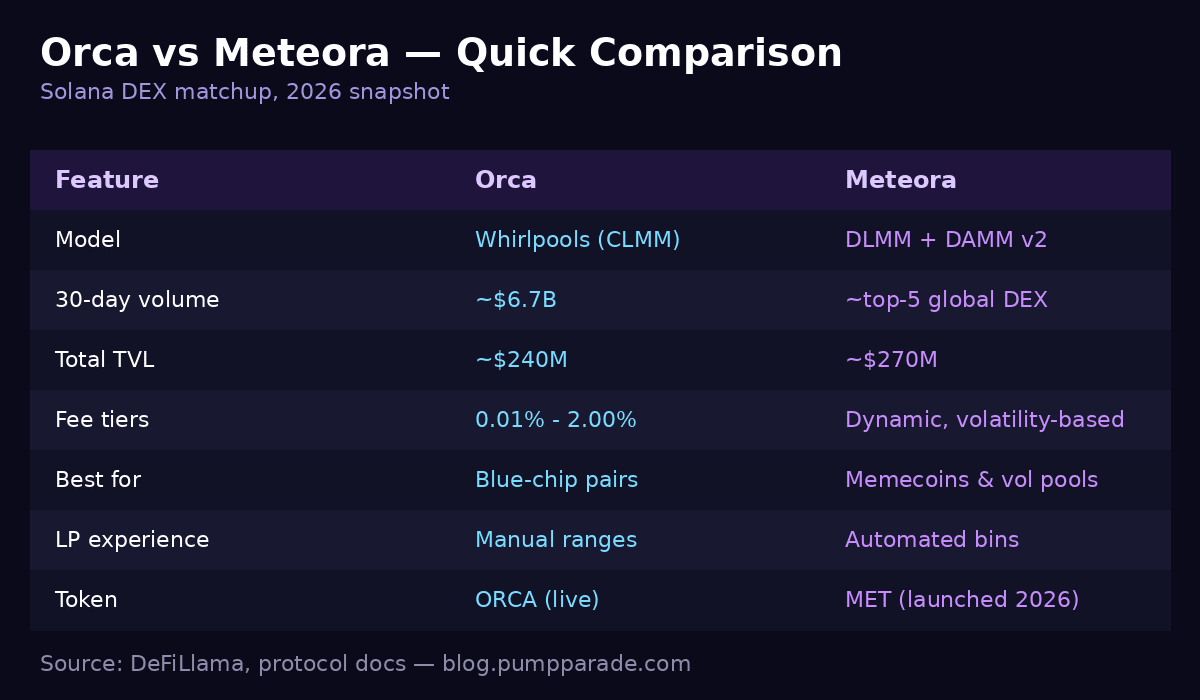
    Orca vs Meteora comparison table showing model, TVL, fees, best-for use case, LP experience, and tokens

    Pros & Cons

    Orca Pros

    • Cleanest UI on Solana, minimal learning curve
    • Predictable, fixed-tier fee model
    • Deep liquidity on blue-chip pairs, tight spreads
    • Long track record with no core exploit
    • Active DAO with real fee accrual to ORCA

    Orca Cons

    • Manual LP range management is a real burden on volatile pairs
    • Loses share to Meteora on memecoin volume
    • No native automated range management inside the protocol
    • TVL has been flat-to-down relative to peak

    Meteora Pros

    • Dynamic fees compensate LPs during volatile moves
    • Quote-only fees are a genuine innovation for memecoin LPs
    • Top-five DEX globally by volume in peak weeks
    • Full stack: DLMM, DAMM v2, Dynamic Vaults, DBC for launches
    • Strong Jupiter integration drives sustained flow

    Meteora Cons

    • Steeper learning curve for first-time LPs
    • DLMM is newer than Orca’s CLMM approach
    • UI can feel overwhelming, especially the pool page
    • MET is fresh, so long-run value accrual is still being proven

    Which Should You Use?

    Use Orca if: You want the smoothest swap experience on Solana, you’re LPing blue-chip pairs (SOL/USDC, staked SOL pairs, majors), you value predictable fee tiers, and you don’t want to babysit LP positions.

    Use Meteora if: You’re LPing memecoins or volatile pairs, you want dynamic fees that reward you during vol spikes, you’re building or launching a token and want native launch tools, or you value protocol optionality (DLMM + DAMM v2 + Vaults) in one place.

    Use both: Honestly, most Solana traders end up interacting with both DEXs regularly, usually via Jupiter aggregation. If you’re serious about DeFi on Solana, understanding how both work makes you a better trader and a better LP.

    FAQ

    Is Meteora better than Orca?
    Neither is universally better. Meteora wins for memecoin LPs and total volume. Orca wins for casual swaps, blue-chip LP positions, and UI simplicity.

    Which has lower fees for traders?
    Both are competitive. Orca is more predictable with fixed tiers (as low as 0.01%). Meteora’s dynamic fees can be lower during calm periods and higher during volatile ones.

    Can I use both through Jupiter?
    Yes. Jupiter routes through both Orca and Meteora automatically and picks whichever gives the best fill. That’s the setup we recommend for most swappers.

    Is LPing on Meteora risky?
    LPing on any AMM carries impermanent loss risk. Meteora’s dynamic fees and quote-only fees reduce that risk on volatile pools, but they don’t eliminate it. Understand the mechanism before you deposit.

    Does Orca have a mobile app?
    No dedicated app, but the site works on mobile browsers. Most Solana wallet apps embed a swap tab that routes through Orca via Jupiter anyway.

    Final Verdict: Orca and Meteora are two of the best-built protocols in Solana DeFi, and they solve different problems. Orca is the cleanest, most beginner-friendly DEX on the chain. Meteora is the most innovative, especially for LPs willing to think in bins. Pick the one that matches your trading style, or use both through Jupiter and let the aggregator sort it out.

    This article is for informational purposes only and is not financial advice. DeFi carries smart contract risk, impermanent loss risk, and market risk. Do your own research before providing liquidity or trading on-chain.

    XRP Price Prediction 2026: Can XRP Reclaim $2?

    XRP is trading at $1.01 on Binance, down roughly 1.4% on the day and pinned to the psychological $1 line that has anchored this cycle. Zoom out and the picture gets uglier: XRP is off 9% over the past 30 days, down nearly 30% over the past 90, and sits about 72% below its July 2025 all-time high of $3.65.

    That is the setup for our XRP price prediction 2026 analysis. Bulls argue this is a re-accumulation zone with a stack of catalysts: $1.51 billion in U.S. spot ETF inflows, RLUSD hitting a majority share of XRPL stablecoin supply, and a live Binance reward campaign nudging on-chain activity higher. Bears counter that ETF flows have stalled, the CLARITY Act is a coin flip at best, and $1 is the last thing standing between XRP and a much uglier chart.

    We are going to lay out both cases with real numbers, compare XRP with its closest peer, run bear, base and bull targets by timeframe, and answer the questions everyone is actually Googling right now.

    Key Takeaways

    • XRP trades near $1.01, holding critical $1 support after a 30% decline over the past 90 days.
    • U.S. spot XRP ETFs have pulled in $1.51 billion in cumulative net inflows, led by Bitwise ($510M) and Franklin Templeton ($427M).
    • Ripple’s RLUSD stablecoin now accounts for more than 50% of stablecoin supply on the XRP Ledger, with cumulative volume above $2.5 billion.
    • Base case for XRP price prediction 2026: $1.20 to $1.45 recovery range, with $2 in play only on a decisive monthly close above $1.45.
    • Standard Chartered’s $8 by year-end 2026 target is the bullish outlier, contingent on sustained ETF inflows and regulatory clarity.
    • The CLARITY Act cloture vote on September 15 is priced at just 16% odds on Polymarket, tempering the near-term regulatory tailwind.
    XRP (XRP) price prediction 2026 hero graphic, current price $1.01, ETF inflows and RLUSD catalyst

    Where XRP Stands Today

    Let’s start with the numbers, because the story XRP tells depends entirely on where you set the frame. On a one-day chart, XRP looks like every other altcoin in a lethargic August tape. On a one-year chart, it looks like a token that ran hot and is still working off the excess. Here is the snapshot:

    Metric Value
    Price (Binance USDT) $1.0091
    24h Change -1.39%
    7-Day Change -2.47%
    30-Day Change -9.26%
    90-Day Change -29.64%
    24h Volume (Binance pair) $51.7M
    Est. Market Cap ~$60B
    Market Cap Rank Top 5
    All-Time High (Jul 2025) $3.65
    % From ATH -72%

    The 52-week trading range spans roughly $0.99 to $3.35. XRP is currently kissing the low end of that range, which is either a gift for accumulators or a warning sign, depending on how you read the flow data.

    Why is XRP Range-Bound Right Now?

    The honest answer: institutional demand has cooled at exactly the moment retail momentum broke down.

    Coming out of the July 2025 peak, XRP was carried by two things: the resolution of the Ripple v. SEC case and the launch wave of U.S. spot XRP ETFs starting in November 2025. Both were textbook “buy the rumor” narratives, and the market did what markets do. It sold the news.

    Now the fundamental story is stronger than it has ever been, but the marginal buyer is missing. According to 2026 flow data from 24/7 Wall St, U.S. spot XRP ETFs pulled a monthly high in May, then decelerated through summer. The past three sessions before this analysis saw zero net creation activity across the entire XRP ETF complex.

    That is not a collapse. It is worse in some ways: it is indifference. And indifference at $1.00 is what pins a token to a level for weeks at a time.

    The Bull Case for XRP in 2026

    1. ETF Inflows Are Still Compounding, Just Slower

    Yes, the daily numbers have gone quiet, but the cumulative picture is meaningful. U.S. spot XRP ETFs now hold $1.51 billion in cumulative net inflows since the November 2025 launch. Bitwise leads with $510.21 million, and Franklin Templeton’s XRPZ has attracted $426.53 million. Between them, those two funds account for roughly 62% of all XRP ETF assets.

    To put that in context, XRP hit $1.51 billion in institutional wrapper inflows faster than most people expected given the muted price action. The story here is that ETFs are functioning as a slow accumulator, not a rocket. That matters more for a 12-month view than a 12-day view.

    2. RLUSD Is Turning XRPL Into Real Payments Rails

    Ripple’s USD-pegged stablecoin, RLUSD, is doing something few crypto payment narratives ever do: producing verifiable throughput. Cumulative RLUSD trading volume has cleared $2.5 billion since launch, and Ripple minted an additional 811,026 RLUSD on August 6 alone. The supply now represents more than half of all stablecoin value on the XRP Ledger.

    Why does that matter for the token? Because RLUSD settlement generates real fee activity, real burn, and real reason for banks and payment providers to actually route through XRPL. The FXRP-collateralized lending pool on Flare, currently valued at $280 million, is a concrete example of XRP being used as productive collateral rather than a speculative bag.

    3. The Institutional Infrastructure Buildout

    Ripple made strategic investments in ZILO, a provider of technology for tokenized investment funds, and Licuido, a UK-regulated platform for digital asset collateral. Both integrations plug straight into XRPL, extending the ledger’s role in institutional asset servicing.

    Standard Chartered’s much-quoted $8 XRP target by end of 2026 is not built on retail sentiment. It is built on the assumption that this infrastructure work compounds into meaningful settlement volume. If they are directionally right, XRP re-rates. If they are wrong, we get $1.20 and change into year-end.

    The Bear Case for XRP in 2026

    1. The Chart Is Ugly and Momentum Is Absent

    A 72% drawdown from the all-time high is not a “healthy correction.” It is a full-cycle unwind. XRP has spent the past three months trending down and consolidating just above $1, and every rally attempt has been sold. Until the token puts in a higher high on the weekly timeframe, technicians will treat every bounce as a chance to distribute, not accumulate.

    2. ETF Flows Have Genuinely Stalled

    The cumulative $1.51 billion is impressive. The recent print is not. When new spot ETF products stop pulling money, the token’s price action tends to reflect that with a lag. If the flow data does not turn back up by early autumn, the “institutional demand” leg of the bull thesis weakens materially.

    3. The CLARITY Act Is Not a Sure Thing

    The proposed CLARITY Act would classify XRP as a digital commodity under CFTC oversight, ending the last real regulatory tail risk. It also faces a cloture vote in the Senate on September 15, and prediction markets are not optimistic. Polymarket is currently pricing the vote at just 16% odds. If it fails, we get a “priced for perfection” airpocket in XRP.

    XRP (XRP) price prediction 2026 targets table, bear $0.80, base $1.35, bull $2.10 by year end

    XRP Price Prediction 2026: Targets by Timeframe

    Here is our framework. These are not guarantees. They are conditional scenarios based on the flow data, technical setup, and catalyst calendar as of this writing.

    Timeframe Bear Base Bull
    30-Day $0.85 $1.05 $1.30
    6-Month $0.80 $1.25 $1.90
    End of 2026 $0.75 $1.35 $2.10
    Stretch (2027-2028) $1.00 $2.75 $5.50

    Short-Term (30 days)

    XRP is compressing on the daily. Realized volatility is at cycle lows, which historically resolves in a move of 20% or more in either direction within four to six weeks. The base case holds $1 support and grinds back toward $1.20 as the Binance RLUSD reward campaign feeds transactional activity. The bear case is a clean break of $0.99, opening a fast $0.85 test. The bull case needs a reclaim of $1.20 with volume.

    Medium-Term (6 months)

    This is where the flow data matters. If ETF inflows re-accelerate into Q4 seasonality, our base case sees XRP grinding into the $1.25 to $1.45 zone. A monthly close above $1.45 is the technical trigger that opens $1.90. In the bear case, sustained ETF apathy plus a broader alt-market drawdown keeps XRP capped under $1.10 and eventually breaks $0.95.

    End of 2026 and Longer

    Analyst targets diverge sharply here. Mainstream consensus, as compiled by outlets covering Ripple price forecasts through 2026, clusters near $1.20 to $1.50 by year-end, with an aggressive bull path toward $2.00 to $3.00 requiring both ETF re-acceleration and CLARITY passage. Standard Chartered’s $8 remains an outlier, plausible only if XRPL captures a step-function share of institutional payment settlement.

    Historically, in similar setups where a top-5 altcoin holds a psychological round-number support for more than 60 days on decreasing volume, the resolution is a move of 30% or more within the following quarter. Direction depends on the catalyst that breaks the coil.

    How Does XRP Compare to Stellar (XLM)?

    Every XRP analysis eventually gets compared to Stellar. Same origin story (Jed McCaleb co-founded both), same cross-border payments pitch, wildly different scale. Here is where they stand in mid-August 2026:

    Metric XRP XLM
    Price $1.01 ~$0.22
    Market Cap Rank Top 5 Top 25
    Native Stablecoin RLUSD (Ripple) USDC (via SEP-24)
    Spot ETF (US) Live, $1.51B AUM None
    Institutional Focus Banks + payments + tokenization Remittances + NGO
    Regulatory Status SEC case resolved 2025 Never charged
    Drawdown From ATH -72% -70%

    The upshot: XRP has the institutional wrapper and the stablecoin flywheel; XLM has the cleaner regulatory record but no ETF, no proprietary stablecoin engine, and a smaller enterprise footprint. If you want more granular context on the sister asset, our Stellar (XLM) price prediction 2026 analysis covers XLM’s setup and $0.50 target case.

    Will XRP Reach $2 in 2026?

    This is the question the search data says everyone is asking, so let’s answer it directly.

    To hit $2 from $1.01, XRP needs to roughly double in less than five months. That is not unusual for XRP historically. It happened in Q1 2025 in a matter of weeks. The question is whether the catalyst stack lines up.

    Our read: $2 is possible but not the base case. To get there, three things need to happen in roughly the following order. First, XRP needs to reclaim $1.20 on rising spot volume. Second, ETF flows need to turn positive on a rolling 30-day basis, ideally with at least one $50M+ inflow week. Third, either the CLARITY vote surprises to the upside on September 15, or RLUSD supply crosses a psychological milestone (think $5 billion cumulative volume) that shifts the fundamental narrative.

    Miss any of the three, and $2 stays out of reach in 2026. Hit all three, and $2 is not just achievable, it is likely conservative.

    What Would Change Our View

    Three explicit scenario triggers we are watching:

    1. Weekly close below $0.95. This breaks the year-long floor and opens a measured move to $0.75 to $0.80. Bear case activated.
    2. Monthly close above $1.45. This clears cycle resistance and re-opens the $1.90 to $2.10 path. Bull case activated.
    3. Two consecutive weeks of $30M+ average daily ETF inflows. This resets the institutional demand narrative and would materially raise our base case toward $1.60.

    Anything else is noise until price acts on it.

    Frequently Asked Questions

    Will XRP reach $2 in 2026?

    Reaching $2 in 2026 is plausible but not our base case. It requires a reclaim of $1.20 with volume, sustained ETF inflow re-acceleration, and either CLARITY Act passage or a step-change in RLUSD adoption. Without those catalysts, XRP is more likely to end the year in the $1.20 to $1.45 range.

    Is XRP a good investment right now?

    XRP offers an asymmetric setup at $1: the downside to psychological support is roughly 20%, while a full bull-case reclaim of $2 offers 100% upside. That risk-reward is more attractive than earlier in the cycle, but XRP still requires patience and clear invalidation levels. It is a position, not a trade.

    What is the XRP price prediction for 2026?

    Our base case XRP price prediction 2026 target is $1.35 by year-end, with a bear scenario of $0.75 and a bull scenario of $2.10. Standard Chartered’s outlier target of $8 requires assumptions on institutional adoption that most base cases do not carry.

    Can XRP reach $3 again?

    Yes, but likely not in 2026. A return to $3 would require the same conditions as the $2 case plus a fresh wave of retail momentum. That combination looks more realistic on a 2027 to 2028 horizon, where our stretch bull case sees $5.50 as the aggressive ceiling.

    Why is XRP falling in 2026?

    XRP is not really “falling” so much as it is drifting. The catalysts that drove the 2024 to 2025 rally (SEC case resolution, ETF launches) are now priced in, ETF inflows have stalled, and no fresh narrative has replaced them yet. That produces a range-bound tape rather than a directional trend.

    How high can XRP go long term?

    Long-term ceiling estimates vary widely. Conservative long-term models put XRP in a $2 to $4 range by 2027 to 2028. Aggressive institutional-adoption cases (Standard Chartered, some cross-border payment analysts) reach $8 to $12. The variance comes down to how much of global settlement flow XRPL captures.

    The Honest Take

    XRP is a token in the middle of a story rewrite. The old story was “waiting for regulatory clarity.” That story is over. The new story is “does the infrastructure buildout convert into real settlement volume, and does that show up in the ETF flow data?”

    Right now, the answer is a shrug. RLUSD is scaling, tokenization partnerships are shipping, ETFs are quietly compounding, and the chart is doing nothing. That combination almost always resolves, and when it does the move is meaningful. Our best guess is that resolution happens later than the bulls want and earlier than the bears expect.

    If you already hold XRP, this is a level worth defending. If you do not, it is a token worth watching, with clear invalidation at $0.95 and clear confirmation at $1.45. What it is not, at least right now, is a screaming buy. And that is fine. Not every setup is a home run swing.

    For traders looking at other majors at similar drawdown levels, our Solana (SOL) price prediction 2026 breakdown and TRON (TRX) price prediction 2026 analysis apply a similar framework to different setups.


    Disclaimer: This article is for informational and educational purposes only and should not be construed as financial, investment, or trading advice. Cryptocurrency markets are highly volatile, and past performance does not guarantee future results. The price predictions and analyses presented here are based on AI models, technical indicators, and available data at the time of writing. They are not guarantees. Always conduct your own research (DYOR) and consult with a qualified financial advisor before making any investment decisions. Pump Parade and its authors do not assume liability for financial losses incurred based on information provided in this article.
    Kaito (KAITO) Price Prediction 2026: Can KAITO Hit $1?

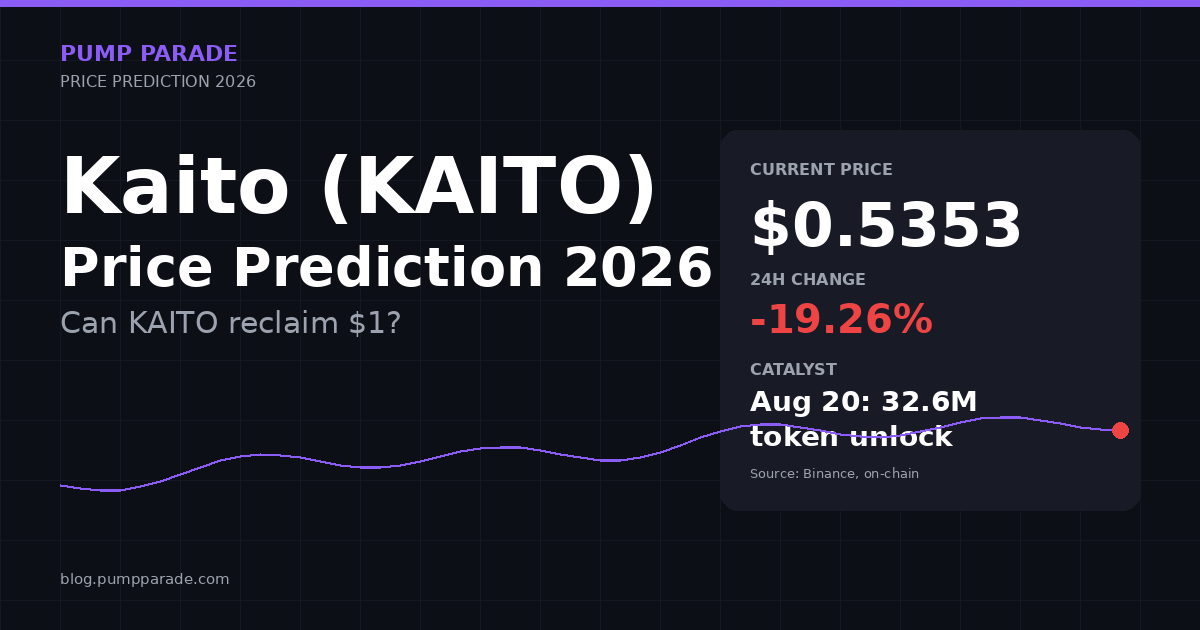
    The Kaito (KAITO) price prediction 2026 question just got a lot more urgent. KAITO is trading at $0.5353, down 19.26% in the last 24 hours and printing a fresh 30-day low of $0.5318. Volume on Binance blew past $7.3M today as sellers front-ran the August 20 token unlock that will release 32.6M KAITO into circulation.

    Zoom out and the picture is uglier. KAITO is down 31% over the past month and off 68% from its yearly high near $1.67. The attention-economy narrative that carried this token through spring has hit a hard reality check: X banned InfoFi apps in January, forcing Kaito to wind down its flagship Yaps product and pivot toward Kaito Studio.

    So can KAITO reclaim $1 by year-end, or is $0.30 the next stop? This article breaks down the on-chain data, the token unlock schedule, the Kaito Studio pivot, competitor pressure from Cookie DAO, and three price scenarios you can actually trade around.

    Key Takeaways

    • KAITO trades at $0.5353, down 19% today and 31% over 30 days as traders position ahead of the August 20 unlock.
    • The August 20 unlock releases 32.6M tokens (about 3.3% of total supply), a real supply-side headwind.
    • Bull case: post-unlock relief rally plus Kaito Studio traction targets $1.10 to $1.35 by Q4 2026.
    • Bear case: continued unlock pressure and Cookie DAO competition drag KAITO to $0.30 to $0.35.
    • Our base case for year-end 2026: $0.65 to $0.85, roughly flat to modestly higher from spot.
    • The key trigger to watch: Kaito Studio revenue signals in October or November earnings-style updates from the team.
    Kaito (KAITO) price prediction 2026 hero graphic, current price $0.5353, Aug 20 token unlock catalyst

    Where Kaito (KAITO) Stands Today

    Before we talk about targets, let us anchor on the numbers. Here is the KAITO snapshot at time of writing, pulled from Binance and public on-chain sources.

    Metric Value
    Price $0.5353
    24-hour change -19.26%
    7-day change Approximately -22%
    30-day change -31.22%
    24-hour volume (Binance USDT) $7.35M
    30-day high $1.3764
    30-day low $0.5318
    52-week high $1.6704
    52-week low $0.2656
    % from 52-week high -67.9%
    Estimated circulating supply Approximately 337M KAITO
    Approximate market cap Approximately $180M

    Two things stand out. First, today’s low almost perfectly matches the 30-day low. That is a fresh breakdown, not a bounce. Second, KAITO is still trading 100% above its 52-week floor at $0.2656, so there is real downside room if unlock pressure escalates.

    Why is Kaito Falling Right Now?

    The short answer: a supply overhang meets a story pivot. On July 20, 2026, roughly 17.8M KAITO unlocked (about 1.8% of total supply), which quietly expanded the sellable float by 7 to 8%. That was the appetizer. The main course arrives on August 20, when 32.6M more tokens hit the market. At current prices, that is roughly $17M of new supply looking for bids.

    Traders are not waiting. When you see a coin down 19% on a day with no macro news and elevated volume, the tape is telling you insiders and treasuries are trimming ahead of the event. This is a classic pre-unlock pattern, and it does not require any smoking-gun bearish catalyst beyond the calendar.

    The narrative is not helping. Since Kaito wound down Yaps under pressure from X’s platform policy earlier this year, the token has been searching for a new utility anchor. Kaito Studio, the tier-based creator platform the team is building out to YouTube and TikTok, is the answer, but the market has not seen enough revenue data yet to price it as a growth story.

    What Is the Bull Case for KAITO in 2026?

    Post-Unlock Relief Rally

    Unlock overhangs cut both ways. Once the calendar event passes and the newly liquid tokens either sell or get absorbed, forced selling ends. Historically, tokens that sell off aggressively into unlocks tend to see a 15% to 30% relief rally in the two to four weeks that follow, assuming the broader market is not collapsing. If KAITO puts in a low near $0.45 during the event, a mechanical bounce to $0.60 to $0.65 is a reasonable base case for September.

    Kaito Studio Monetization

    The bull thesis has to include Studio. The platform targets a tier of high-quality creators and expands beyond X to YouTube and TikTok. If Studio starts posting real numbers, subscribers, brand deals routed through KAITO for payments, mindshare campaign revenue, the market will re-rate the token from a “post-Yaps zombie” back toward a growth SaaS comparable. Even a modest 5% to 8% blended annual revenue growth story anchored to Studio would justify a $0.90 to $1.20 range on multiples alone.

    Buybacks and Staking Yield

    Kaito has committed roughly $3.9M in cumulative buybacks and offers an 11% staking APY. Neither number is huge, but both remove circulating supply from active trading. If the team scales buybacks in Q3 or Q4 as Studio revenue ramps, you get a self-reinforcing supply squeeze against the recurring 7% APY on staked tokens. That is the kind of tokenomics story that can compress the free float and force shorts to cover into thin liquidity.

    What Is the Bear Case for KAITO in 2026?

    Rolling Unlock Pressure

    August 20 is not the last unlock. KAITO has a scheduled emission profile that adds supply through 2027. Every unlock is a fresh test of demand. If Studio traction stalls, each event becomes a stepping stone down. A repeat of the July-to-August pattern into late Q4 could drag KAITO to $0.35 to $0.45, right back to the 52-week accumulation zone.

    Cookie DAO and Copycat Risk

    Cookie DAO is running an almost identical playbook: crypto data analytics, attention scoring, creator incentives. The problem for KAITO is that switching costs in InfoFi are low. Anyone can scrape public social data. If Cookie DAO or a well-funded newcomer wins the next wave of creator mindshare, KAITO’s moat evaporates. This is a real risk the token holders have not fully priced in.

    InfoFi Sector Fatigue

    The whole “tokenize attention” thesis is on trial. Blockworks and other institutional analysts have questioned whether InfoFi is investable as a category, given that the value creation loop depends on platforms that can change their rules overnight, as X did. If the sector loses narrative momentum through the second half of 2026, KAITO could go the way of 2022’s play-to-earn tokens: interesting product, no bid.

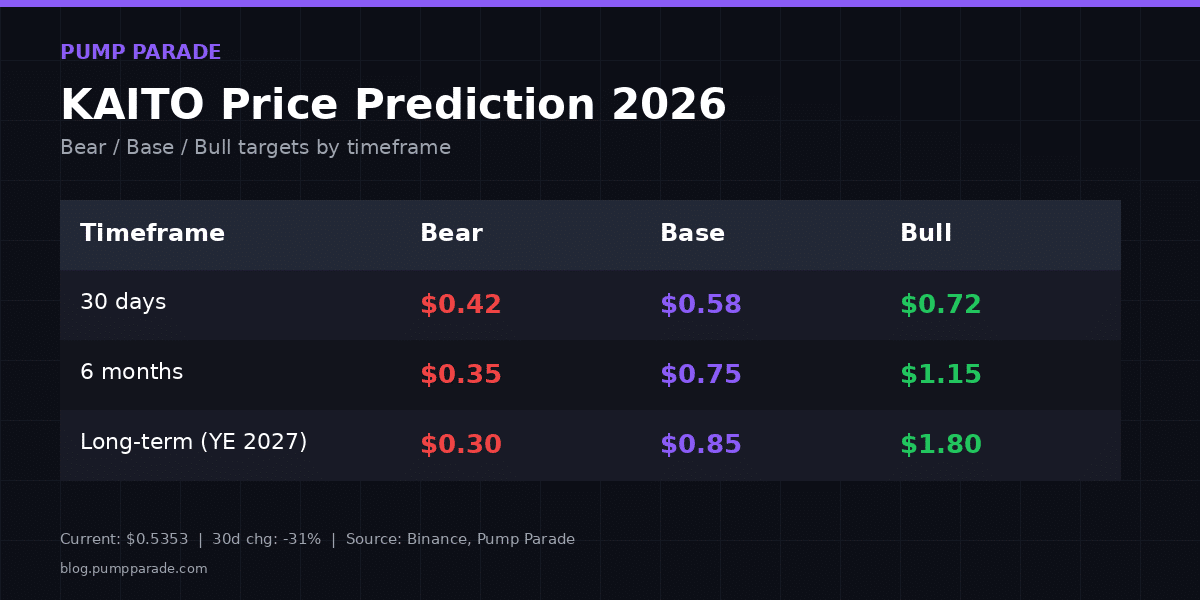
    Kaito Price Prediction 2026: Targets by Timeframe

    Here is how we are framing the ranges. These are scenario paths, not point forecasts. Each depends on the triggers we spell out in the next section.

    Kaito (KAITO) price prediction 2026 targets table, bear $0.30, base $0.85, bull $1.80
    Timeframe Bear Base Bull
    30 days (through mid-September) $0.42 $0.58 $0.72
    6 months (through February 2027) $0.35 $0.75 $1.15
    Year-end 2027 (long-term) $0.30 $0.85 $1.80

    30-Day Outlook

    The August 20 unlock dominates the next four weeks. Base case, KAITO sees more downside into the event, prints a low in the $0.45 to $0.50 zone, then bounces toward $0.58 as supply gets absorbed. Bull case, the sell was front-run, the event passes with a shrug, and KAITO reclaims $0.72. Bear case, unlock recipients dump aggressively and we see $0.42 by month-end.

    6-Month Outlook

    By February 2027, the market will have data on Kaito Studio. If the team ships a genuine monetization update at their next milestone, $1.10 to $1.15 is reachable. If not, more unlocks plus competitive drag pull KAITO back into the $0.35 to $0.50 range. Base case is $0.75, which assumes moderate Studio traction and a stable broader market.

    Long-Term (Year-End 2027)

    The long-term range is wide because it depends entirely on whether InfoFi as a sector survives. Bull case at $1.80 requires Kaito Studio to become a real revenue engine and the sector narrative to reignite, potentially on the back of an AI agent wave that Kaito can index. For comparison, Changelly’s model projects a 2026 average around $0.65, DigitalCoinPrice sees a wider $0.50 to $1.80 range, and one CMC AI forecast reaches $1.27. Our numbers sit inside that consensus band.

    How Does Kaito Compare to Cookie DAO?

    The InfoFi race is not a monopoly. Cookie DAO is the closest analog and the fairest benchmark. Here is a side-by-side.

    Metric Kaito (KAITO) Cookie DAO (COOKIE)
    Focus Attention scoring, creator mindshare, Studio Crypto AI agent data, mindshare index
    Flagship product Kaito Studio, Kaito Yaps (wound down) Cookie.fun agent index
    Primary chain Base, Solana Base
    Staking yield Approximately 11% APY Variable, generally lower
    Buyback program Approximately $3.9M cumulative Ad hoc, not systematized
    Institutional backers Dragonfly, Sequoia China, Jane Street Retail-heavy investor base
    Distance from 52-week high -68% Broadly similar drawdown
    Narrative durability Studio pivot in progress Riding the AI agent wave directly

    KAITO has the better cap table and a more institutional footing. Cookie DAO has the cleaner narrative right now because it plugs directly into the AI agent story, which is the strongest crypto sub-sector heading into late 2026. If you believe in InfoFi as a category, you probably want exposure to both rather than picking one.

    For related coverage on the AI agent sector, see our takes on AI Rig Complex (ARC) and Virtuals Protocol (VIRTUAL), both of which sit in the adjacent creator-agent lane.

    What Would Change Our View

    Three specific triggers would move us off the base case.

    Trigger 1 (bearish): KAITO closes below $0.45 on the August 20 unlock day. That level is the technical shelf where the coin last consolidated in Q1. A daily close beneath it opens the door to the $0.30 to $0.35 zone quickly, and we would shift our base case toward the bear scenario.

    Trigger 2 (bullish): A Kaito Studio revenue disclosure showing double-digit month-over-month growth. If the team publishes real numbers, Studio revenue, active brand deals, creators onboarded, in the September or October update cycle, that reframes KAITO as a growth story and unlocks a re-rating toward $1.10 or higher.

    Trigger 3 (structural): Any AI-agent partnership that routes KAITO for payments. Kaito indexing data for major agent platforms like Virtuals or ARC would be a category-defining unlock. Watch for headlines mentioning KAITO as a payment rail or data provider for on-chain AI agents. That single announcement could rewrite the multi-year thesis.

    Frequently Asked Questions

    Will Kaito (KAITO) reach $1 in 2026?

    Our base case says no. We see KAITO ending 2026 between $0.65 and $0.85, with $1 requiring Kaito Studio to post real revenue traction. The bull scenario at $1.10 to $1.35 is real but conditional on catalysts we have not yet seen delivered. If you are betting on $1, you are betting on the Studio pivot working.

    Is Kaito a good investment right now?

    KAITO is a high-volatility, catalyst-dependent play. At $0.53 it offers asymmetric upside if Studio works, but you are exposed to sustained unlock pressure through year-end and to Cookie DAO competition. It is a setup worth monitoring, not a “buy at any price” trade. Position size accordingly and know your invalidation.

    Why is Kaito price dropping in August 2026?

    Two reasons. First, the August 20 token unlock releases 32.6M KAITO, and traders are front-running the supply increase. Second, the market has not yet seen convincing evidence that Kaito Studio will replace the utility lost when Yaps was wound down after X’s InfoFi ban in January 2026.

    When is the next KAITO token unlock?

    The next scheduled unlock is August 20, 2026, releasing 32.6M KAITO tokens, or roughly 3.3% of total supply. That is approximately $17.4M at current prices. Further unlocks follow through 2027 on a rolling schedule, which is why the market is treating each event as a supply test.

    What is Kaito Studio and why does it matter?

    Kaito Studio is the team’s post-Yaps product, a tier-based marketing platform that targets high-quality creators and expands beyond X into YouTube and TikTok. It matters because Yaps generated an estimated 70% of KAITO’s utility, and Studio is the primary replacement. No Studio traction means no clean bull thesis.

    Can KAITO recover to its recent $1.37 high?

    Recovering to $1.37 would require roughly a 156% rally from spot. That is not impossible on a strong alt-season with Studio catalysts, but it is a 6 to 12 month move at minimum. The path likely runs through $0.75, then $1.00, then a retest of the $1.35 resistance. Each level is a real fight.

    The Honest Take

    KAITO is a story stock in the middle of a chapter change. The old chapter, Yaps as the utility anchor, is closed. The new chapter, Kaito Studio as a monetized creator platform, is being written in real time. The market is not sure how it ends, and neither are we.

    What we do know: this is a token with a real product, an institutional cap table featuring Dragonfly, Sequoia China, and Jane Street, and a team that has shown it can pivot. It is also a token with a real supply overhang, a real competitor in Cookie DAO, and a real narrative risk if InfoFi as a category loses steam.

    For traders, our base case sits at $0.65 to $0.85 by year-end 2026. For long-term holders willing to size small and hold through the unlock schedule, the $1.10-plus scenario is a bet on Kaito Studio, not on KAITO tokenomics. Both are defensible. Both need to survive the next 30 days of unlock pressure before the real thesis gets a fair test. As always, watch the data. Reference our related coverage on Fetch.ai (FET) for a broader read on AI-token setups heading into Q4.

    External sources worth bookmarking: CoinGecko’s KAITO market page for live data, and Blockworks’ analysis of the InfoFi sector for the broader institutional view.

    Disclaimer: This article is for informational and educational purposes only and should not be construed as financial, investment, or trading advice. Cryptocurrency markets are highly volatile, and past performance does not guarantee future results. The price predictions and analyses presented here are based on AI models, technical indicators, and available data at the time of writing, they are not guarantees. Always conduct your own research (DYOR) and consult with a qualified financial advisor before making any investment decisions. Pump Parade and its authors do not assume liability for financial losses incurred based on information provided in this article.
    Drift Protocol Review 2026: Fees, Features & Verdict

    0

    Solana is now the second-largest venue for on-chain perpetual futures, and one protocol keeps showing up at the top of the leaderboard: Drift. But 2026 has been anything but easy for the protocol. On April 1, attackers drained roughly $285 million in what became the largest DeFi hack of the year and the second-largest exploit in Solana history. This Drift Protocol review for 2026 covers what the platform actually offers today, how the recovery has played out, and whether it still deserves its reputation as Solana’s flagship perps DEX.

    Quick Verdict / TL;DR

    Rating: 3.8 / 5. On the merits, Drift is still the most feature-complete on-chain derivatives platform on Solana. Hybrid orderbook execution, up to 101x leverage on majors, gasless order placement, cross-margin across dozens of collaterals, and a growing product line (vaults, BET prediction markets, borrow/lend) are best-in-class among native Solana venues. Taker fees start at 0.10 percent and step down with volume, with DRIFT staking discounts on top. The April 2026 exploit is the elephant in the room. Tether stepped in with a recovery plan of up to $150 million, the team has commissioned fresh audits from OtterSec and Asymmetric Research, and structural changes to signer operations are underway. Users returning to Drift should size positions carefully while the relaunched stack proves itself in production. For self-custodial perps on Solana, it remains the default pick, with eyes open.

    Try Drift Protocol

    Drift Protocol Overview

    Drift is a decentralized exchange on Solana focused on perpetual futures, spot swaps, borrow/lend, prediction markets, and automated vaults. The core product is a hybrid perp DEX that combines an on-chain central limit orderbook with a dynamic AMM backstop and a Just-in-Time (JIT) auction model, letting professional market makers post tight quotes while retail liquidity still gets filled inside the visible spread.

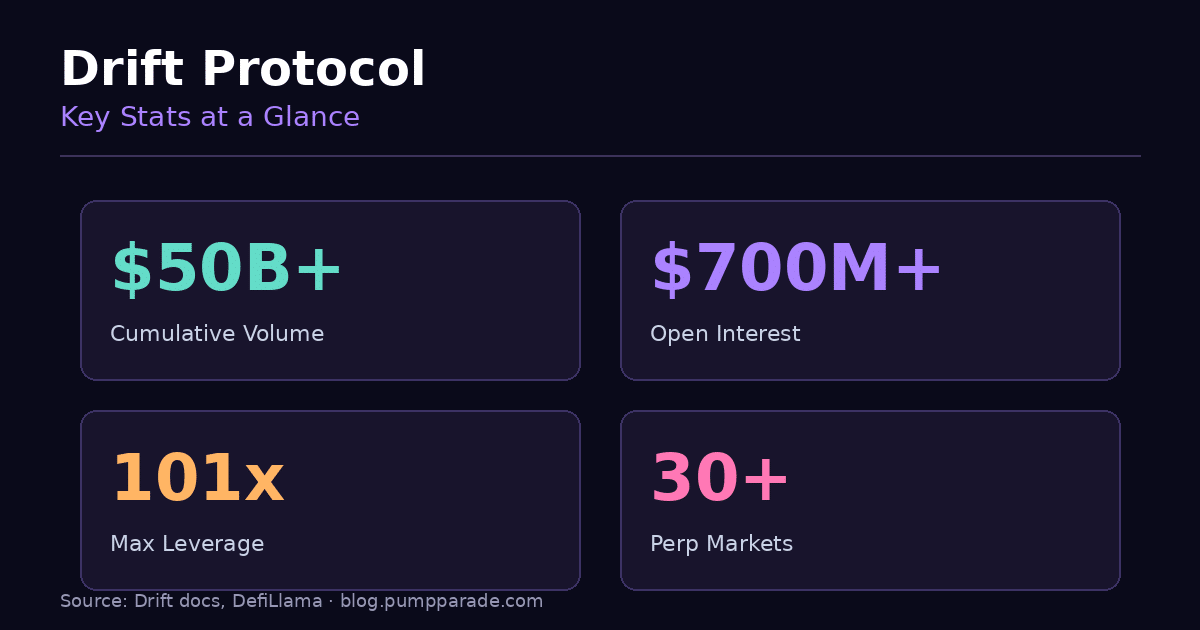
    Drift Protocol key stats 2026: $50B+ cumulative volume, $700M+ open interest, 101x max leverage, 30+ perp markets
    Drift Protocol key stats snapshot. Volume and OI figures are cumulative and pre-incident where noted. Source: Drift docs, DefiLlama.

    By 2026 the numbers are difficult to ignore. Drift has processed more than $50 billion in cumulative trading volume, historically sat around $700 million in open interest across 30+ perp markets, and manages roughly $200 million in TVL today according to DefiLlama down from over $550 million pre-exploit. The December 2025 v3 upgrade added top-of-block execution and direct market maker integration, closing most of the latency gap with the biggest centralized venues.

    Who is it for? Active perps traders, memecoin traders who want leverage without leaving Solana, delta-neutral yield strategies, and DeFi power users who want to keep collateral working (LSTs, memecoins, stables) while trading against it. If you are brand new to derivatives, you can technically start on Drift, but you will want to read the docs before opening a position, and consider whether you want exposure to a protocol still digesting a major incident.

    Features Deep Dive

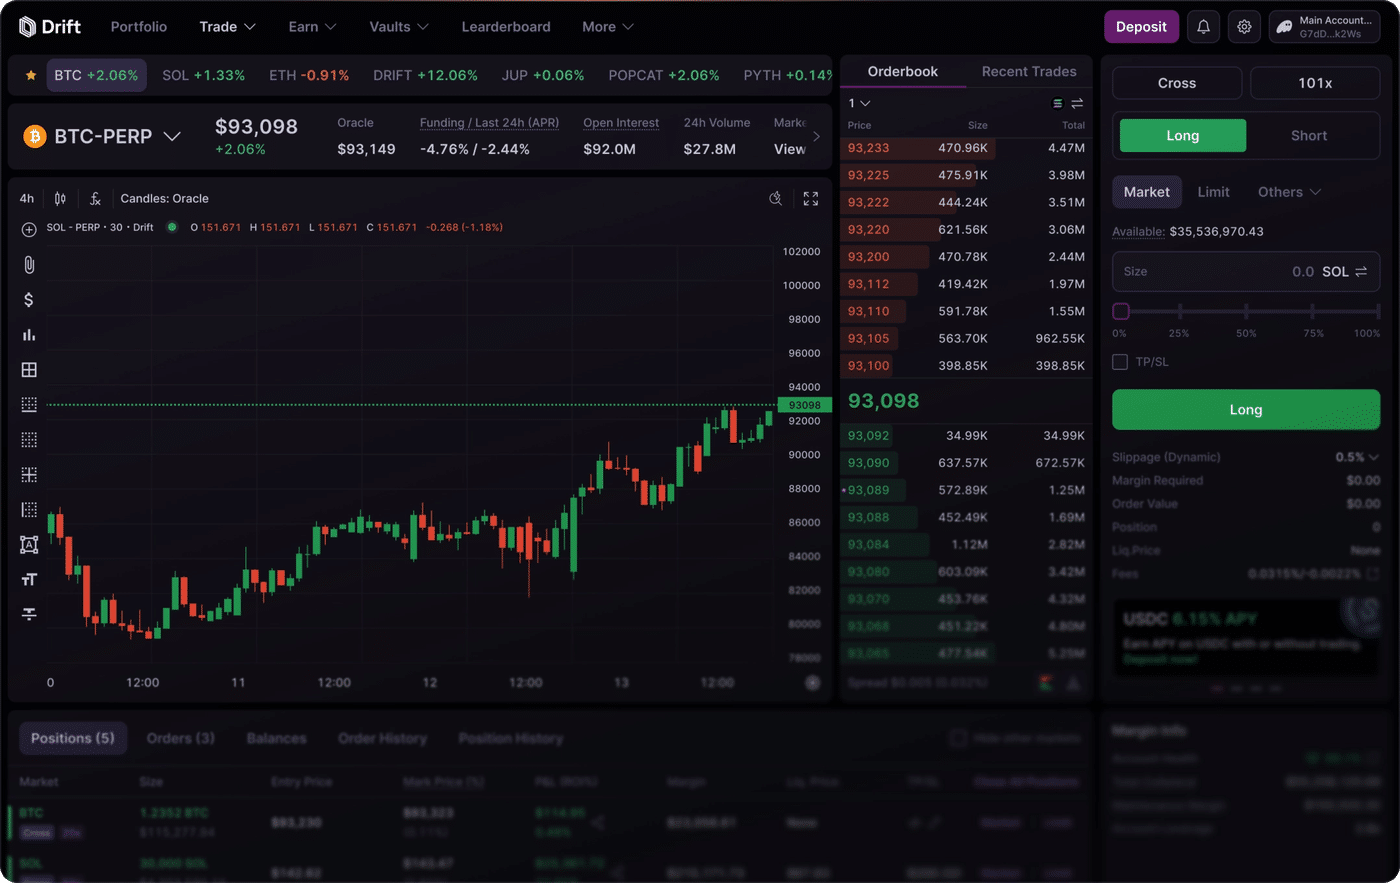
    Drift Protocol trading interface showing perp orderbook and TradingView charts on Solana
    Drift’s trading interface: orderbook, TradingView charts, cross-margin positions in one view.

    Perpetual Futures

    Perps are the flagship product. Drift supports over 30 markets including BTC, ETH, SOL, majors like DOGE and AVAX, and a rotating shelf of Solana memecoins and AI tokens. Leverage goes up to 101x on the largest markets, with sensible caps on smaller pairs. Cross-margin is enabled by default, so your entire collateral portfolio backs every position and you can use LSTs, stables, or even memecoins as margin.

    Spot Trading and Borrow/Lend

    Drift also runs a spot orderbook and an integrated money market. You can swap SPL tokens directly, deposit assets to earn yield, or borrow against your collateral. This is what makes cross-margin so powerful: a jitoSOL deposit earns staking yield, backs your perp positions, and can be borrowed against, all in one account.

    Vaults

    Drift Vaults are automated, non-custodial strategies run by third-party managers. Depositors get exposure to market-making, delta-neutral, and directional strategies without operating them themselves. Managers earn a performance fee, depositors keep the rest, and everything sits inside on-chain smart contracts you can inspect. Vaults have become one of the fastest-growing pieces of the protocol as passive users chase yield they cannot get from a simple LST.

    BET Prediction Markets

    In mid-2026 Drift shipped BET (Bullish on Everything), an on-chain prediction market pitched as a Solana-native answer to Polymarket. What makes BET interesting for a DeFi audience is capital efficiency: you can post over 30 different tokens as collateral, including liquid staking tokens and memecoins, and continue to earn yield on that collateral while your prediction sits open. That alone gives it a real angle against Polymarket, which is USDC-only.

    Just-in-Time (JIT) Auctions and Additional Tools

    Every market order kicks off a short Dutch auction where market makers compete to fill inside the visible spread. Beyond that, the trader stack includes sub-account isolation for risk management, a mobile app, TradingView charts, in-app funding-rate dashboards, insurance staking (stake USDC or SOL to backstop the exchange and earn a slice of fees), and referral rebates. If you have used a modern CEX, most of what you expect is here.

    Fees & Pricing

    Perp fees on Drift are competitive with the tighter end of centralized exchanges.

    • Taker fee: starts at 10 bps (0.10 percent) and steps down with 30-day volume.
    • Maker rebate: negative fees on majors, with rebates up to 2 bps for the highest tier makers.
    • DRIFT staking discount: holding staked DRIFT (sDRIFT) can cut taker fees by up to 40 percent.
    • Spot swap fee: routes via the Drift orderbook, no additional platform markup on top of maker/taker.
    • Borrow/lend: variable rates by asset, published live in the app.

    You also pay Solana network fees, which are usually a fraction of a cent, plus optional priority fees during congestion. There is no gas fee to place, cancel, or update orders because Drift subsidizes those transactions inside its orderbook. Compared with EVM perp DEXs like Hyperliquid and GMX, Drift lands in the same fee neighborhood on majors and undercuts most of them on Solana-native pairs.

    The April 2026 Exploit and Recovery

    Any honest Drift review in 2026 has to address the elephant in the room. On April 1, 2026, attackers drained roughly $285 million from Drift in about 12 minutes, making it the largest DeFi hack of the year and the second-largest security incident in Solana history, behind only the 2022 Wormhole exploit.

    According to reports from TRM Labs and Chainalysis, the exploit was not a smart contract bug in the traditional sense. Attackers, later attributed to DPRK-linked actors, spent months socially engineering multisig signers and eventually pushed a fictitious collateral token (CarbonVote Token) with manipulated oracle pricing. The token was recognized as valid collateral, and the attackers used it to drain real assets from the vaults. Most stolen funds were bridged to Ethereum within hours.

    Drift’s TVL fell from over $550 million to roughly $200 million in the immediate aftermath. Tether then stepped in with a recovery plan of up to $150 million to help users recoup losses. The team has commissioned fresh audits from OtterSec and Asymmetric Research, is rebuilding operational security around signer devices and pre-signed authorizations, and is moving toward a community-governed multisig for core protocol assets.

    For traders, the practical implication is that Drift’s relaunched stack should be treated as a new system on its first laps. The response so far has been credible: transparent communication, a real recovery package, dual independent audits, and structural operational changes. None of that fully erases the incident, but it is roughly as good as post-incident responses get in DeFi.

    Pros & Cons

    Pros

    • Largest orderbook-style perps venue on Solana with deep liquidity in majors.
    • Up to 101x leverage on BTC, ETH, SOL, with cross-margin across dozens of collaterals.
    • Gasless order placement and cancellation.
    • Real DeFi composability: LSTs, memecoins, and stables all work as margin.
    • Vaults and BET expand the product line well beyond a simple perp DEX.
    • Transparent post-incident response backed by Tether and independent auditors.

    Cons

    • April 2026 exploit ($285M) is significant; users should size positions cautiously.
    • Interface is dense and can overwhelm first-time derivatives traders.
    • Liquidity on some longtail alts is thinner than on top-tier CEXs.
    • Solana network congestion still occasionally impacts execution during frenzy events.
    • DRIFT staking discounts are meaningful only for higher-volume traders.
    • No fiat on-ramp; you need SOL or supported SPL tokens to get started.

    Security & Trust

    Pre-incident, Drift had been audited multiple times and operated for years without a major exploit. The April 2026 attack targeted human and operational weaknesses rather than a single vulnerability in audited contract logic, which is why the recovery plan focuses heavily on signer hygiene, dedicated devices, and a community-governed multisig in addition to fresh code audits.

    OtterSec, one of the most respected Solana security firms, is leading the codebase redesign and pre-launch audit. Asymmetric Research is conducting a parallel independent review. Both firms will sign off before the relaunched stack goes live. The protocol also maintains a publicly-funded insurance vault backed by USDC and SOL stakers who earn a share of exchange fees in exchange for taking on backstop risk.

    None of that removes on-chain risk. You are trusting the rebuilt code, the oracle set, and the market-maker liquidity to hold up under stress. But by the standard of on-chain derivatives platforms post-incident, Drift’s handling has been credible, and the team has a multi-year track record of shipping through bull and bear cycles.

    User Experience

    The web app at app.drift.trade is where most of the trading happens. It is fast, uses TradingView charts, and offers a genuinely professional layout: orderbook and depth on one side, positions and PnL below, and a market list on the left. Order types include market, limit, stop, and take profit, plus advanced options like scale orders and trigger orders.

    Onboarding is quick if you already have a Solana wallet. Connect Phantom, Backpack, or another Solana wallet, deposit collateral, and you are trading in under a minute. The mobile app covers most of the same ground for anyone who wants to manage positions on the go. Support is handled through Discord and an in-app help center, with active mods and a responsive team.

    The learning curve is the biggest UX complaint. Between sub-accounts, cross-margin, funding, and vaults, there is a lot to absorb. The docs are strong, but expect to spend an evening reading before you deploy real size.

    Verdict & Rating

    Rating: 3.8 / 5

    Drift remains the clear default for serious perps trading on Solana. The combination of orderbook liquidity, cross-margin across a huge collateral set, low fees, and shipping velocity around vaults and BET makes it stand out from every other Solana derivatives venue. Compared with EVM heavyweights it holds its own on fees and, thanks to Solana’s throughput, feels closer to a centralized experience than most on-chain competitors. The April 2026 exploit costs Drift a full grade in this review, but the response has been credible enough to keep it in the “use with appropriate size” category rather than “avoid entirely.”

    Use-case recommendations:

    • Active Solana traders: Drift is the right home base for leveraged bets on SOL and Solana memecoins, with position sizes calibrated to your risk tolerance.
    • Delta-neutral yield hunters: the combination of LST collateral and negative-funding shorts opens real basis-trade opportunities.
    • Passive DeFi users: Drift Vaults or insurance staking are the right entry points, not perps.
    • Beginners: start on spot SOL first, get comfortable with self-custody, then graduate to perps once the relaunched stack has more time in production.

    Open Drift Protocol

    FAQ

    Is Drift Protocol safe to use after the April 2026 exploit?
    The protocol has secured a recovery plan of up to $150 million from Tether, is re-auditing its codebase with OtterSec and Asymmetric Research, and is rebuilding operational security. It is reasonable to use the platform with appropriately sized positions, but treat the relaunched stack as a new system on its first laps and monitor closely. Do not deposit more than you are willing to lose.

    What is the maximum leverage on Drift?
    Up to 101x on the largest markets like SOL, BTC, and ETH. Leverage is capped lower on smaller and more volatile pairs to protect the insurance fund.

    What fees does Drift charge?
    Taker fees start at 0.10 percent and decline with 30-day volume. Makers can earn rebates of up to 2 bps on majors. Staking DRIFT can reduce taker fees by up to 40 percent.

    Does Drift have a token?
    Yes. DRIFT is the governance token. Staked DRIFT (sDRIFT) grants voting rights, fee discounts, and a share of protocol revenue. Insurance stakers can also stake USDC or SOL directly to earn from exchange fees.

    How is Drift different from Hyperliquid or GMX?
    Drift lives on Solana and leans into cross-margin with a huge collateral set, plus adjacent products like BET prediction markets and Vaults. See our full Hyperliquid vs GMX comparison for how the EVM leaders stack up. If you already hold Solana assets, Drift usually wins on capital efficiency and speed. If you prefer EVM liquidity or hold HYPE, one of the other two may fit better.

    Can I use LSTs like jitoSOL as collateral?
    Yes, that is one of Drift’s standout features. You can deposit jitoSOL or mSOL, keep earning staking yield, and use the same balance as margin for perps. See our Jito review for more on Solana’s largest liquid staking token.

    Disclaimer: This article is for informational purposes only and does not constitute financial or investment advice. Trading derivatives is high risk and can result in the loss of all deposited capital. Always do your own research before using any DeFi protocol.

    Hyperliquid (HYPE) Price Prediction 2026: HYPE Back to $75?

    0

    HYPE trades at $55.27 in early August 2026, down roughly 28% from the June all-time high of $76.67. That is not a collapse. That is a token digesting the biggest 6-month run in perpetual DEX history while the market waits for the next narrative catalyst. Q2 delivered a 79.2% HYPE gain against a 14.1% Bitcoin decline, and revenue snapped back to an ~$840M annualized run rate. Yet spot ETF flows just flipped to their first monthly outflow.

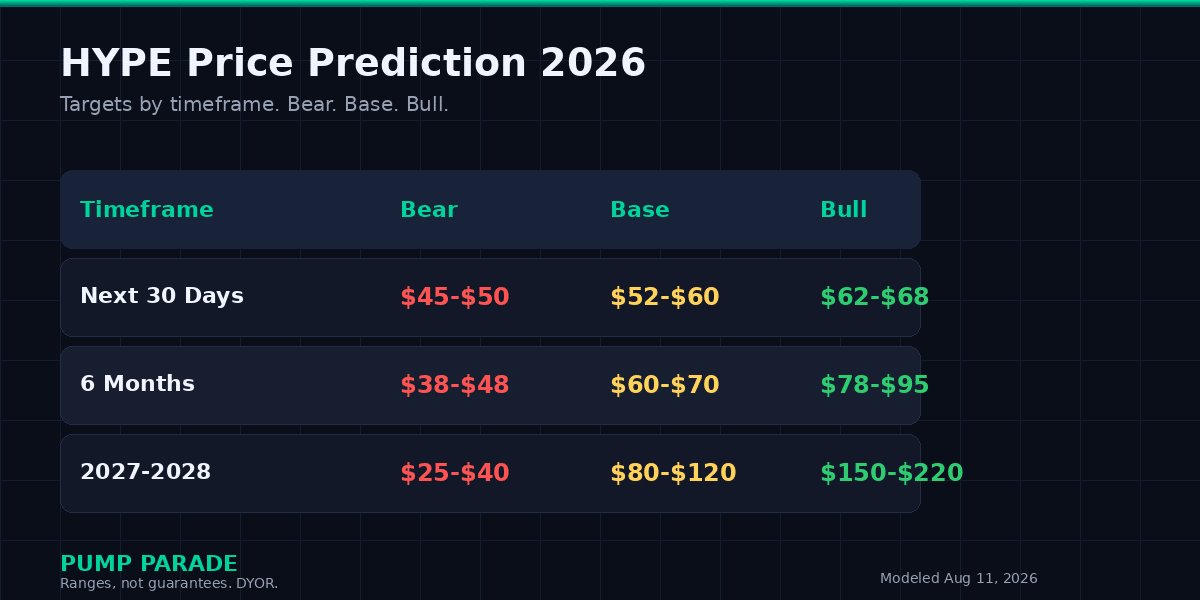
    Which side wins the next 90 days? This Hyperliquid price prediction 2026 lays out the bull case, the bear case, and specific price targets across three timeframes, grounded in on-chain data, protocol revenue, and the RWA plus HIP-4 catalysts nobody is fully pricing in yet.

    If you want the short version, HYPE reclaiming $75 by year-end requires three things: sustained RWA volume growth, HIP-4 prediction markets going live on mainnet, and ETF flows turning positive again. Two of three probably gets you $65-$70. All three opens a path to $85+.

    Key Takeaways

    • HYPE trades at $55.27, down 28% from the $76.67 all-time high set on June 16, 2026.
    • Roughly 97-99% of protocol fees flow into the Assistance Fund, which has bought about 44.4M HYPE off the open market to date.
    • RWA-linked open interest hit a record $3.6B in July, with 52% of platform volume already coming from tokenized real-world assets.
    • Bull case: HIP-4 prediction markets, RWA growth, and Bitwise ETF flows drive HYPE back to $75-$85 by December 2026.
    • Bear case: fee decay outpaces buybacks and unlock supply pressure caps HYPE below $50 through year-end.
    • Base case target: $60-$68 by December, assuming steady revenue and neutral ETF flows.
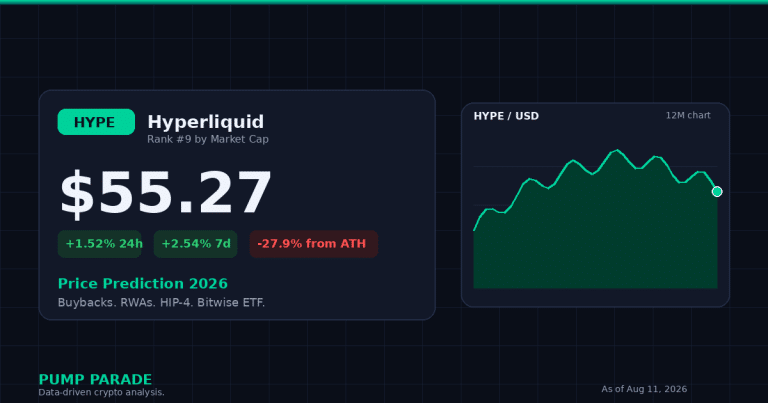
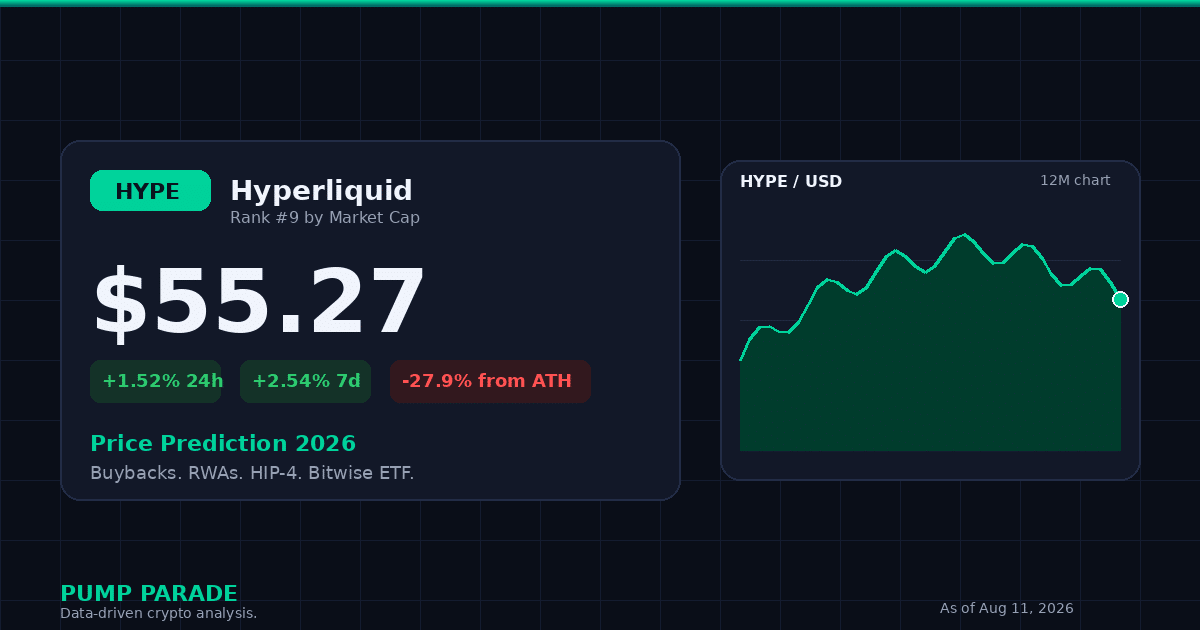
    Hyperliquid (HYPE) price prediction 2026 hero graphic, current price $55.27, ETF and HIP-4 catalyst

    Where Does HYPE Stand Today?

    Hyperliquid sits at rank 9 by market cap, with HYPE priced at $55.27 and a fully diluted valuation north of $18B. Trading volume has stayed elevated even through the summer chop, and the token has held the $50 psychological level on every retest since the June high. That is the setup you want if you are looking for a base.

    Here is the snapshot as of August 11, 2026:

    Metric Value
    Price (USD) $55.27
    24h Change +1.52%
    7-Day Change +2.54%
    Market Cap ~$18.4B
    Market Cap Rank #9
    All-Time High $76.67 (June 16, 2026)
    % From ATH -27.9%
    Annualized Revenue ~$840M

    Two data points to hold onto. First, HYPE has already round-tripped a full pump cycle in 2026, which means the current price is not built on airdrop hype anymore. It is built on cash flow. Second, roughly $18-$20 of the current $55 print is directly attributable to the Assistance Fund’s buyback bid over the trailing 12 months. Take away the buybacks and HYPE looks very different.

    Why Is HYPE Trading Sideways Right Now?

    Three overlapping forces have pinned HYPE between $50 and $60 for most of July and August. Understanding them matters more than any short-term chart pattern.

    The first is a mechanical supply-demand mismatch. The Assistance Fund deploys $53M to $83M per month in open-market buybacks depending on fee revenue. At the current 30-day fee run rate, monthly emissions arriving from vesting schedules and validator rewards are roughly ten times the monthly demand the protocol itself provides. Buybacks are large, but they are not a floor by themselves.

    The second is macro. Bitcoin has been range-bound between $60K and $72K since May, and altcoin beta compresses in a Bitcoin chop tape. HYPE has held up better than most L1s, but the tape has not let it break out either.

    The third is the ETF picture. HYPE spot ETFs recorded a $4.55M net outflow in July, the first monthly outflow after two strong months. Cumulative inflows still stand at $288.59M, which is meaningful, but the direction of flow matters more than the absolute number for a token this reflexive.

    The Bull Case

    Prediction markets go permissionless via HIP-4

    Hyperliquid is opening HIP-4 to permissionless deployment. Any operator willing to lock 500,000 HYPE, roughly $31.7M at current prices, can spin up their own prediction market on the platform. That is a structural HYPE demand mechanism (both stakers and validators lock supply) and a competitive shot at Polymarket. If HIP-4 attracts meaningful volume, revenue re-rates upward and the buyback engine gets stronger, per CryptoSlate reporting.

    Real-world assets keep eating the volume mix

    RWA-linked open interest hit a record $3.6B in July 2026, and RWAs already account for 52% of platform trading volume. A Cryptobriefing projection puts that at 75% by 2027. RWAs bring institutional flow, longer holding periods, and more stable fee generation than perpetual futures on memecoins. If that mix continues to shift, HYPE stops trading like a DeFi token and starts trading like an exchange equity with a token buyback program attached.

    The Bitwise BHYP ETF and institutional access

    The Bitwise Hyperliquid ETF (BHYP) went live earlier this year, joined by filings from 21Shares and others. Bitwise is the largest fund by AUM. If August or September delivers a return to positive net inflows, HYPE gains an institutional bid on top of the Assistance Fund’s mechanical buyback bid. That is the two-bidder setup that produced the June rally.

    The Bear Case

    Fee decay outpaces the buyback

    The buyback engine is powerful, but it is a function of fees, and fees are cyclical. A quiet Bitcoin market cuts perp volume, and lower perp volume cuts the Assistance Fund’s dry powder. If the ratio of net emissions to buyback demand widens further from its current ~10x level, price gravity is downward regardless of narrative.

    Unlock overhang and validator selling

    HYPE still has meaningful supply arriving through team, investor, and validator schedules. Even at slow drip rates, tokens hitting exchanges add to the mechanical selling pressure that buybacks have to absorb. This is why any monthly fee slowdown compounds quickly.

    Prediction-market execution risk

    HIP-4 sounds great on paper. Execution is not free. Oracle risk, dispute resolution, and market-making depth are all non-trivial. If early permissionless markets deliver a high-profile failure or exploit, the narrative flips and Hyperliquid loses the “safer than Polymarket” positioning it needs to attract institutional operators.

    Hyperliquid Price Prediction 2026: Targets by Timeframe

    Hyperliquid (HYPE) price prediction 2026 targets table, bear $38, base $65, bull $85

    The tables below reflect three scenarios modeled from current revenue run-rate, buyback dry powder, and observed ETF flow sensitivity. They are ranges, not point predictions.

    Next 30 Days (through mid-September 2026)

    Scenario Target Trigger
    Bear $45-$50 ETF outflows continue, BTC breaks $58K
    Base $52-$60 Current range holds, no HIP-4 mainnet news
    Bull $62-$68 HIP-4 mainnet date confirmed, ETF flows flip positive

    6 Months (through February 2027)

    Scenario Target Trigger
    Bear $38-$48 RWA volume growth stalls, fee run rate cuts 30%+
    Base $60-$70 RWA share reaches 60%, ETF AUM adds $300M+
    Bull $78-$95 HIP-4 attracts multiple large operators, BTC breaks $80K

    Long-Term (2027-2028)

    Scenario Target Trigger
    Bear $25-$40 Competitor perp DEX takes 30%+ market share
    Base $80-$120 RWA share hits 75%, HYPE trades like exchange equity
    Bull $150-$220 Prediction markets become dominant, Arthur Hayes thesis plays out

    For context, Arthur Hayes has publicly targeted $150 for HYPE, citing organic volume, buyback demand, and HIP-4 expansion, according to CryptoSlate. That is roughly our bull-case long-term target.

    How Does Hyperliquid Compare to dYdX?

    The closest structural competitor to Hyperliquid is dYdX. Both are perp DEXs with native tokens, both have transitioned toward increased decentralization, and both compete for the same institutional order flow. The comparison below focuses on the metrics that matter for a price prediction.

    Metric Hyperliquid (HYPE) dYdX (DYDX)
    Market Cap ~$18.4B ~$400M
    Rank #9 Outside top 100
    Annualized Revenue ~$840M ~$60M
    Native L1 Yes (custom) Yes (Cosmos)
    Buyback Mechanism Assistance Fund, 97-99% of fees Partial fee share to stakers
    Spot ETF Listed Yes (Bitwise BHYP) No
    RWA / Prediction Market Roadmap HIP-4 + tokenized RWAs live Roadmap in discussion
    Q2 2026 Token Return +79.2% -12%

    The takeaway is that Hyperliquid is not really competing on the same axis anymore. It has become the reference perp DEX with meaningful institutional infrastructure, while dYdX is battling for share. That gap explains why HYPE trades at a premium and also why any misstep gets punished harder.

    For a fuller side-by-side of perp DEX architecture and fees, see our earlier Hyperliquid vs GMX comparison.

    What Would Change Our View

    Three specific triggers would move us out of the base case in either direction.

    First trigger, bullish: HIP-4 permissionless prediction markets ship to mainnet with at least three external operators locking the 500K HYPE stake within 60 days of launch. That is a durable demand shock that removes 1.5M+ HYPE from circulating supply.

    Second trigger, bearish: HYPE ETF net outflows extend to three consecutive months, or the Assistance Fund reduces its buyback percentage below 90% of fees. Either signals that the mechanical bid buyers depend on is losing force.

    Third trigger, structural: A competitor perp DEX with a credible token model, real institutional partnerships, and lower fees takes 20%+ of Hyperliquid’s daily perp volume within two quarters. Market share compression is the one thing the buyback engine cannot fix.

    Frequently Asked Questions

    Will HYPE reach $75 by end of 2026?

    Our base case does not get HYPE back to $75 by December, but our bull case does. The path requires HIP-4 mainnet launch, sustained RWA growth toward 60% of platform volume, and ETF flows flipping positive again. Two of three probably gets you $65-$70. All three unlocks $75-$85.

    Is HYPE a good investment right now?

    HYPE at $55 is trading at roughly 22x annualized revenue, which is reasonable for a growth token with a working buyback engine. The upside case is real but hinges on execution catalysts, not just macro. Position size accordingly, and treat it as a high-beta bet on the perp DEX category, not a defensive holding.

    What is the HYPE price prediction for 2027?

    Base case for 2027 targets $80-$120, assuming RWA volume share reaches 75% and prediction markets add a second meaningful revenue line. Bull case pushes toward $150-$220, matching Arthur Hayes’s public thesis. Bear case brings HYPE back to $25-$40 if competitors compress market share.

    Why is HYPE down from its all-time high?

    HYPE is down about 28% from the June 16, 2026 ATH of $76.67 because macro has been sideways, ETF flows recently turned negative for the first time, and supply-side unlocks are outpacing buyback demand by roughly 10x at the current fee run rate. None of these are structural breaks. They are cyclical.

    What is HIP-4 and why does it matter for HYPE price?

    HIP-4 is Hyperliquid’s upgrade that added fully collateralized prediction markets in February 2026. The pending enhancement opens the system to permissionless deployment, requiring operators to lock 500,000 HYPE per market. That locked supply plus additional fee revenue makes HIP-4 one of the highest-conviction HYPE demand catalysts through year-end.

    Is Hyperliquid safer than centralized exchanges?

    Hyperliquid runs a permissioned validator set and a custom L1, so it is more decentralized than a CEX but less than a fully public chain. Custody is non-custodial, and there is no single point of failure like a CEX exit. That said, oracle risk and validator risk are real. Treat it as a middle ground.

    The Honest Take

    HYPE is one of the cleanest fundamental stories in crypto right now, and that is exactly why the market gives it very little room to disappoint. Revenue is real. The buyback engine is real. The catalyst pipeline through year-end (HIP-4 permissionless, continued RWA growth, ETF flows) is real. If two of those three fire, $65-$75 is a reasonable target for December.

    But HYPE is also a token where the mechanical supply and demand math determines a lot of the price, and right now emissions run at roughly 10x the buyback bid. That gap has to close, either through more fees or fewer tokens hitting the market. Anyone underwriting a HYPE-back-to-$75 thesis needs to have a view on which of those two variables moves first.

    If you are watching one thing over the next 30 days, watch the HIP-4 mainnet launch date. If you are watching two, add the monthly ETF flow print. The signal-to-noise ratio on those two data points is higher than the price chart.

    For related coverage on liquid staking and DeFi yield opportunities in the same ecosystem, our Pendle price prediction and Aave price prediction are worth a look.

    Disclaimer: This article is for informational and educational purposes only and should not be construed as financial, investment, or trading advice. Cryptocurrency markets are highly volatile, and past performance does not guarantee future results. The price predictions and analyses presented here are based on AI models, technical indicators, and available data at the time of writing. They are not guarantees. Always conduct your own research (DYOR) and consult with a qualified financial advisor before making any investment decisions. Pump Parade and its authors do not assume liability for financial losses incurred based on information provided in this article.
    Celestia (TIA) Price Prediction 2026: Can TIA Reclaim $1?

    Celestia (TIA) is trading near $0.33 at time of writing, roughly 97% below its 2024 peak and stuck inside a slow, grinding range. That is the setup nobody outside of modular blockchain circles is talking about, and it is exactly why this Celestia (TIA) price prediction 2026 matters. The token that was supposed to become the base layer for the entire rollup thesis has spent most of the last 18 months as a case study in unlock overhang, weak retail demand, and vicious sector rotation.

    Then something changed. The Fibre protocol, first previewed in Celestia Vision 2.0, is on track to go live in stages through the back half of 2026, targeting a jump in blockspace throughput that would leapfrog every rival data availability (DA) layer. On-chain fee revenue is climbing off a low base. And John Adler, one of the four co-founders, is publicly pushing a proof-of-governance proposal that would cut inflation by a factor of 20.

    So the real question is not whether TIA is dead. It is whether the setup is finally clean enough to run. This article breaks down where TIA stands right now, what could actually push it back to $1, what could send it back to $0.20, and how the numbers line up against the closest DA competitors.

    Key Takeaways

    • TIA trades near $0.33 with a market cap around $303M, ranked #97 by CoinMarketCap at time of writing.
    • The Fibre protocol targets up to 1 Tb/s of blockspace throughput, a potential 100x leap over current capacity.
    • Our base case sees TIA at $0.55 within 6 months and $0.85 in 12 to 24 months if Fibre ships on time and rollup demand recovers.
    • The bull case reclaims $1 in 2026 and points to $1.60. The bear case grinds toward $0.24 on continued unlock pressure.
    • Biggest risks: EigenDA and Avail eating market share, and the vesting schedule that runs all the way through September 2027.
    Celestia (TIA) price prediction 2026 hero graphic showing current price $0.33 and Fibre protocol catalyst

    Where Celestia (TIA) stands today

    Before we get into targets, let us anchor on where the tape actually is. The numbers below are pulled at time of writing and rounded for readability. If you are reading this a week from now, check CoinGecko for the live figure.

    Metric Value
    Price ~$0.33
    24h change +2.4%
    Market cap ~$303M
    24h volume ~$11M
    CMC rank #97
    All-time high ~$20.85 (Feb 2024)
    % from ATH approximately negative 98%

    Two things stand out. The market cap sits under the war chest that Celestia Labs is sitting on. Co-founder Mustafa Al-Bassam has publicly referenced a $100M treasury and a six-year operational runway, which means the project is not going anywhere on funding alone. But the price also sits inside a multi-quarter consolidation between roughly $0.28 and $0.65. Break either end and the setup changes fast.

    Why is Celestia’s price stuck in a range right now?

    Three things are pressing on TIA at once. First, supply. The next scheduled unlock on July 31, 2026 released 10.7M tokens, about 1.1% of total supply, and the vesting cliff runs all the way through September 30, 2027. Every month adds new float that has to be absorbed by real demand.

    Second, narrative. The modular blockchain thesis, which is the entire pitch for TIA, cooled off after Ethereum’s own Dencun and PeerDAS upgrades cut Layer 2 (L2) data costs directly on Ethereum. That took some oxygen away from third-party DA layers, and Bitcoin’s dominance stayed pinned above 55% for most of 2026.

    Third, competition. EigenDA has quietly built market share by tapping into restaked ETH security, and Avail has picked up several new rollup integrations. Celestia is no longer the only credible DA option, which is why raw blob demand matters more now than it did a year ago.

    The offset is that on-chain activity has actually been climbing. Blob demand on Celestia is up roughly 3x from the January 2026 lows, driven by rollups like Manta Pacific, Movement, and a handful of new app-chains that opted for cheap DA over Ethereum L1 blobs. If that curve holds, the fee-based revenue story becomes real.

    What is the bull case for TIA in 2026?

    Fibre protocol delivers the throughput leap

    Fibre is the reason to care. Announced as part of Celestia Vision 2.0, it uses zero-knowledge (ZK) sampling techniques and a new networking layer to push blockspace throughput toward 1 Tb/s in its long-term target, with earlier stages targeting a 100x improvement over the post-V8 baseline. In plain terms, that is enough capacity to host every serious rollup, orderbook, and AI agent payment layer that anyone is currently trying to build. If Fibre ships in stages through H2 2026 on schedule, the “modular is dead” thesis breaks.

    Fee revenue starts to justify the market cap

    The market cap under $310M looks small on its own. It looks even smaller against a $100M-plus treasury and rising blob revenue. Historically, in similar setups, layer-one tokens have started to re-rate once trailing 90-day fee revenue crosses an annualized run rate of 5% to 10% of market cap. Celestia is not there yet, but the trajectory since Q1 is the closest it has ever been. Learn more about how L2 rollups and DA layers compare in our Ethereum price prediction breakdown.

    Proof-of-governance cuts issuance by 20x

    John Adler’s proof-of-governance proposal, if it passes, would slash annual TIA issuance from roughly 5% to 0.25%. That is not a small tweak. It is a supply shock. The Lotus (v4) upgrade already reduced inflation from around 7.2% to 5% and capped validator commissions at 25%. A follow-up that takes issuance to a fraction of a percent would meaningfully change the sell pressure profile once vesting winds down.

    What could push TIA back to $0.20?

    Unlock overhang keeps grinding

    Every month between now and September 2027, more locked TIA hits the market. If demand does not scale fast enough, the price simply cannot hold. The pattern in 2024 and 2025 was clear: bounces got sold into the unlock windows, and every attempt to reclaim higher moving averages failed. That pattern breaks only when spot demand starts absorbing supply, and there is no guarantee that happens on the schedule bulls hope for.

    EigenDA and Avail eat the DA market

    The single biggest risk factor is not price action, it is competition. EigenDA leans on restaked ETH security, which is a story institutional allocators find easy to understand. Avail has focused on the AppChain and Polkadot-adjacent developer stack. And Ethereum itself is pushing through PeerDAS and eventually full danksharding, which puts native, cheap DA directly inside L1. If Celestia’s blob market share slips below 20% by mid-2027, the fee-revenue thesis breaks.

    Modular narrative loses another cycle

    The uncomfortable version of this: modular might just be early. If the next 12 months of rollup growth are underwhelming, and if end users keep gravitating to monolithic chains like Solana for consumer apps, TIA’s core investment case gets pushed out another cycle. Cycles are unforgiving in crypto. Missing one often means missing many.

    Celestia (TIA) price prediction 2026: targets by timeframe

    Celestia (TIA) price prediction 2026 targets table showing bear $0.24, base $0.35, and bull $0.48 next 30 days

    Below is how our AI model, tuned against on-chain fee data, unlock schedules, and comparable L1 setups, splits the outcomes. These are not promises. They are scenarios with conditions attached.

    Next 30 days: $0.24 to $0.48

    Bear case sees TIA break the lower end of the range around $0.28 on any macro flush, targeting $0.24. Base case holds the range and drifts back toward $0.35 on light Fibre progress updates. Bull case reclaims $0.42 and pushes toward the round $0.48 psychological level, likely driven by a single narrative catalyst rather than fundamentals shifting in 30 days.

    6 months (into Q1 2027): $0.30 to $0.95

    The base case at $0.55 assumes Fibre ships partial mainnet functionality on schedule and blob demand keeps climbing at its current pace. The bull case at $0.95 assumes Fibre lands ahead of schedule and the proof-of-governance vote passes, both of which are non-trivial “ifs” but neither is fringe. The bear case at $0.30 is what happens if unlocks keep outrunning demand.

    12 to 24 months (long-term): $0.35 to $1.60

    This is where the reclaim-$1 question actually gets resolved. Standard Chartered’s mid-2026 note on DA infrastructure did not name TIA directly, but its framework for pricing modular blockspace demand implies a range where TIA at $1 to $1.50 is defensible if Celestia holds 40%-plus DA market share. Beyond $1.60 requires a full risk-on altseason plus Fibre-level throughput being live and used. Analyst sources like Changelly’s TIA price prediction model land in a broadly similar range with meaningful variance depending on macro assumptions.

    How does Celestia compare to EigenDA and Avail?

    The DA layer race is not a monopoly and is not going to be one. Here is where the three main players stand on the metrics that matter for pricing.

    Metric Celestia EigenDA Avail
    Security model Sovereign PoS Restaked ETH Sovereign PoS
    Token status Live (TIA) EIGEN linked Live (AVAIL)
    Current throughput (est.) ~32 MiB blocks High (variable) Comparable to Celestia
    Roadmap ceiling 1 Tb/s (Fibre) Restaking-scaled Multi-hundred MB blocks
    Notable rollups Manta, Movement Numerous ETH L2s Growing AppChain set
    Distinct edge Ships now, ZK roadmap ETH security narrative Polkadot-adjacent devs

    The takeaway: no one wins outright. But Celestia has a unique combination of a live token, a large treasury, and the most aggressive throughput roadmap. That combination is what any $1 reclaim thesis depends on.

    What would change our view

    Three specific triggers would flip our base case, in either direction. Watch these more than the daily candles.

    1. Fibre mainnet timeline slips more than a quarter. If the throughput ceiling moves out to 2027, the market caps the multiple. Bear case gets more weight.
    2. Blob market share drops below 25%. Celestia held roughly 40% to 50% of tracked DA blob volume through mid-2026. A structural drop below 25% would mean competitors are winning new rollup integrations, and the fee-revenue story pauses.
    3. Proof-of-governance proposal passes governance vote. This is the asymmetric upside. Cutting issuance by 20x is a supply-side re-rating catalyst that is hard for the market to price in until it happens.

    For a wider view on how new protocol upgrades tend to move prices, our NEAR Protocol price prediction walks through a comparable modular narrative playing out on a different chain.

    Frequently asked questions

    Will Celestia (TIA) reach $1 in 2026?

    Reaching $1 in 2026 is possible but conditional. It requires TIA to reclaim the $0.65 range high, hold it, and then break through $0.85 on rising volume. That path most likely needs the Fibre protocol to ship on schedule and blob demand to keep expanding. Our base case sees $0.55 within 6 months, and the bull case pushes to $0.95, so $1 sits right at the edge of that scenario.

    Is Celestia a good investment in 2026?

    Celestia is a high-beta bet on the modular blockchain thesis. It is asymmetric: the market cap is small relative to the treasury, but the token still has vesting unlocks running into late 2027. Investors who believe DA becomes a paid, competitive market and who can tolerate 40% to 60% drawdowns are the natural audience. Traders looking for near-term momentum should probably look elsewhere.

    What is Celestia used for?

    Celestia is a modular blockchain that provides data availability and consensus as a service. Rollups and app-chains post their transaction data to Celestia, which stores it and makes it verifiable, so they do not have to run their own DA layer. Think of it like renting scalable storage instead of building your own data center. Rollups pay Celestia in TIA for that blob space.

    Why has Celestia’s price dropped so much from its all-time high?

    TIA is roughly 98% below its February 2024 peak for three overlapping reasons: heavy token unlocks that increased circulating supply, the cooling of the modular narrative after Ethereum’s own DA upgrades cut L2 data costs, and rising competition from EigenDA and Avail. None of these have been fully absorbed yet, which is why the price has base-built rather than snapped back.

    Can TIA reach $10 again?

    Not in 2026, in our view. Getting back to $10 requires a roughly 30x move from current levels, which would mean either a full altcoin supercycle plus Celestia dominating the DA market, or a fundamental repricing of L1 blob revenue that has not happened in any comparable protocol yet. $10 is a 2028 to 2030 conversation, and only if the modular thesis wins convincingly.

    How does TIA staking work?

    Holders delegate TIA to validators, who secure the network and produce blocks. In return, delegators earn a share of block rewards and fees. Current annual inflation is around 5% after the Lotus (v4) upgrade, with dis-inflation of roughly 6.7% per year until a long-run floor. Staking yields sit meaningfully above the inflation rate, which is the mechanism designed to prevent dilution for active stakers.

    The honest take

    Here is the thing. Celestia is not a hype trade right now. That is actually the point. The price sits near multi-year lows, the war chest is bigger than the market cap, the upgrade roadmap is credible, and the competitive landscape, while real, has not knocked Celestia out of the top tier. If you believe modular blockchains eventually win a meaningful share of the L2 stack, TIA at $0.33 is a very different asymmetric bet than TIA at $8.

    None of that guarantees the reclaim. Unlocks are real. Competition is real. Narrative fatigue is real. But the setup, meaning the combination of small market cap, catalyst calendar, and technical range, is the cleanest it has been in over a year. The smart move is to size accordingly, define your invalidation level, and stop watching the daily chart. This is a story-driven repricing, if it happens, and story-driven repricings do not usually announce themselves on a Tuesday.

    Disclaimer: This article is for informational and educational purposes only and should not be construed as financial, investment, or trading advice. Cryptocurrency markets are highly volatile, and past performance does not guarantee future results. The price predictions and analyses presented here are based on AI models, technical indicators, and available data at the time of writing. They are not guarantees. Always conduct your own research (DYOR) and consult with a qualified financial advisor before making any investment decisions. Pump Parade and its authors do not assume liability for financial losses incurred based on information provided in this article.
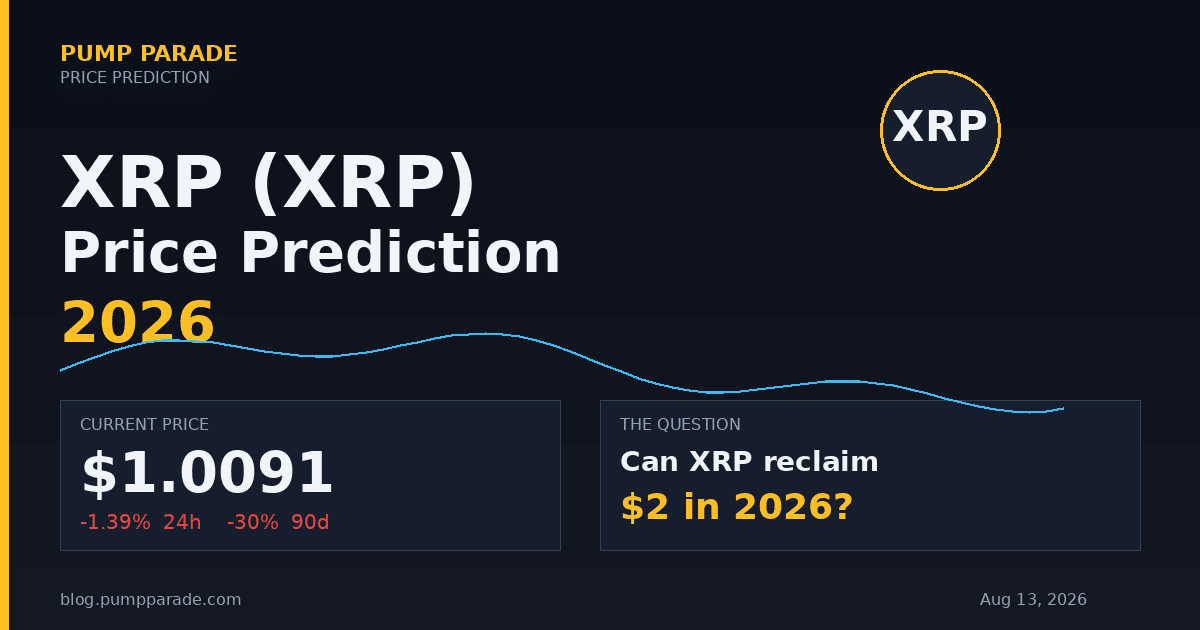
    TRON (TRX) Price Prediction 2026: Can TRX Hit $0.50?

    TRON trades at $0.3294 today, up roughly 1% on the week and about 25% below its December 2024 all-time high of $0.44. That looks quiet on the surface. Under it, the numbers are anything but. TRON now settles more USDT than Ethereum, holds more than $85 billion in stablecoin supply, and just crossed 74 million wallet holders. This TRON price prediction 2026 asks the question the market is actually pricing right now: can TRX finally break $0.50 and rerate as the world’s biggest stablecoin settlement layer?

    The setup has real teeth. USDT transfers on TRON hit trillions in Q1 2026. The SEC lawsuit against Justin Sun and the TRON Foundation was dismissed with prejudice in March. A joint task force with Tether and TRM Labs has already frozen $344 million linked to illicit flows, giving regulators one less reason to squeeze the network. Yet TRX price has barely moved. That gap between fundamentals and price is what makes this a setup worth monitoring.

    We’ll walk through where TRX sits, why it’s stuck, the bull and bear cases with named catalysts, a target grid for the next 30 days, 6 months, and end of 2026, plus how TRON stacks up against Ethereum for stablecoin market share.

    Key Takeaways

    • Current price: $0.3294, market cap $31.3B, ranked #8 by market cap.
    • Bull case for 2026: a break above $0.50 opens a path to the $0.80 to $1.20 range if stablecoin dominance keeps compounding.
    • Base case: $0.35 to $0.50 by year-end 2026, consistent with mainstream analyst ranges from Changelly, Coinpedia, and Coinbase.
    • Bear case: a slide to $0.20 to $0.25 if Tether reallocates supply toward Ethereum or a fresh regulatory shock lands.
    • The real story: TRON now hosts 46%+ of global USDT supply. That’s the fundamental to watch, not the daily candle.
    TRON (TRX) price prediction 2026 hero graphic - current price $0.33, $85B USDT dominance catalyst

    Where TRON Stands Today

    TRX is a top-10 asset that trades like it wants to be forgotten. The chart has been coiled between $0.28 and $0.36 for weeks. Volume sits around $235 million a day, which is thin for a network settling trillions in stablecoin transfers. Here’s the snapshot as of August 9, 2026.

    Metric Value
    Price $0.3294
    24h change +0.12%
    7-day change +0.97%
    Market cap $31.3B
    24h volume $235.5M
    Market cap rank #8
    All-time high $0.4404 (Dec 2024)
    % from ATH -25.2%

    The narrative underneath those numbers is doing more work than the price. TRON now hosts about $85 billion in USDT, more than any other chain. According to Justin Sun’s Q1 2026 disclosures, the network moved trillions of dollars in stablecoin transfers over three months. For a network that most casual traders still think of as “the Justin Sun chain,” that’s a serious utility footprint.

    Why is TRON price stuck below $0.35 right now?

    TRX looks range-bound for three reasons that all pull in the same direction.

    First, TRON is a boring asset. It doesn’t have the meme energy of a Solana memecoin cycle or the ETF narrative Ether has. Boring is not a bug for stablecoin infrastructure, but it is a headwind for narrative-driven price action.

    Second, supply concentration is a discount factor. Analysts at MEXC and independent researchers estimate that Justin Sun and affiliated wallets control roughly 63% of circulating TRX. Every rally is met with the question of whether insider distribution will cap it. That fear alone shaves multiple off the token.

    Third, the market is waiting for a catalyst that converts stablecoin dominance into TRX demand. Right now, USDT usage generates fee revenue that gets burned as energy and bandwidth, but the link between “more USDT on TRON” and “higher TRX price” is indirect. When it becomes direct, the range breaks.

    The Bull Case for TRX in 2026

    USDT dominance is compounding, not plateauing

    TRON now holds more than $85 billion in USDT, ahead of Ethereum, and just crossed 74 million USDT holders according to Tether disclosures cited by Blockchain.news. Sun’s public target is $100 billion in TRON-hosted USDT by early 2027. If the network sustains its current compounding rate, that milestone lands inside our forecast window and becomes the marketing event every crypto exchange front-page can carry.

    The SEC case is finally closed

    The US Securities and Exchange Commission case against the TRON Foundation and Justin Sun was dismissed with prejudice by a US federal judge in March 2026. That eliminates the biggest overhang on TRX, unlocks a plausible Coinbase US listing, and clears the way for compliant products in Sun’s orbit. A Coinbase listing alone typically adds 15% to 25% to a mid-cap altcoin’s market cap within a week.

    The deflation tipping point is inside the window

    TRX has a burn mechanism tied to network activity. Every USDT transfer consumes energy and bandwidth, and a portion of the associated fees is burned. Independent modeling from crypto.news suggests TRX becomes structurally net-deflationary sometime in 2027 if stablecoin transfer volume keeps its current trajectory. Markets tend to front-run that inflection by six to nine months, which means late 2026 is a plausible pricing window.

    The Bear Case for TRX in 2026

    Tether can migrate liquidity elsewhere

    TRON’s biggest strength is a single-issuer dependency. Tether has already announced a multi-chain strategy that expands supply on Ethereum layer-2s and newer chains. If USDT growth on TRON stalls or reverses, the core investment thesis takes a real hit. This is the risk analysts at K33 and Bernstein have flagged repeatedly through 2026.

    Insider concentration and unlocks

    Justin Sun and affiliates reportedly control around 63% of TRX supply. The 27 super representatives model concentrates governance further. This isn’t a fatal flaw, but it does mean any rally to $0.50 or above invites profit-taking from a small set of holders whose selling can visibly move the tape. Institutional allocators price this in as a persistent discount.

    Regulatory risk isn’t zero, even post-settlement

    TRM Labs continues to report that TRON hosts a disproportionate share of illicit crypto volume, most recently pegged near 58%. The T3 Financial Crime Unit has been aggressive in freezing sanctioned wallets, including $344 million in coordinated freezes reported by Blockchain.news. That’s progress, but a fresh enforcement action from OFAC, the DOJ, or a European regulator would land squarely on TRX price.

    TRX Price Prediction 2026: Targets by Timeframe

    TRON (TRX) price prediction 2026 targets table - bear $0.22, base $0.42, bull $0.60

    Here’s how we’re framing the next four windows. These are analytical ranges built from on-chain data, competitor forecasts, and probable catalyst timing. They are not price commitments.

    Next 30 days (through early September 2026)

    Bear: $0.28. Base: $0.34. Bull: $0.40. Near-term action is trading the range. A confirmed break of $0.36 on strong stablecoin inflow days opens the door to $0.40. A loss of $0.30 on rising exchange balances signals distribution and points back to $0.28.

    Six months (through Q1 2027)

    Bear: $0.26. Base: $0.42. Bull: $0.55. This window catches the potential $100 billion USDT-on-TRON milestone, a possible Coinbase listing, and the first serious deflation-narrative coverage. Any two of those together historically resolves ranges upward.

    End of 2026

    Bear: $0.22. Base: $0.42. Bull: $0.60. This aligns with the mainstream analyst spread. Changelly and Coinpedia model 2026 highs in the $0.55 to $0.60 range. Coinbase’s CMC-AI and Bitcoin Foundation both flag $0.50 as the pivotal 2026 level. Cross that convincingly and the $0.80 to $1.20 range from crypto.news becomes the 2027 conversation.

    Longer term (2027 to 2028)

    Bear: $0.20. Base: $0.55. Bull: $1.00. Reaching $1 requires TRX to become genuinely net-deflationary while stablecoin dominance persists. Reasonable, not guaranteed.

    How Does TRON Compare to Ethereum for Stablecoin Settlement?

    The most useful comparison for TRX isn’t another Layer-1 for smart contracts. It’s Ethereum, the network TRON overtook in USDT supply. Here’s the head-to-head on the metrics that actually matter for a stablecoin settlement layer.

    Metric TRON Ethereum L1
    USDT hosted ~$85.3B ~$70B
    USDT holders 74M+ Est. 6M
    Avg USDT transfer cost Sub-$1 $2 to $10
    Finality ~3 seconds ~12 seconds
    Consensus DPoS, 27 SRs Proof-of-Stake, ~1M validators
    Decentralization score Low High
    Token supply concentration ~63% top holders ~30% top holders
    Regulatory clarity (US) Improved post-SEC dismissal Established

    For a full picture on where ETH sits in this same rerating debate, our Ethereum price prediction 2026 breaks down the ETH-side setup.

    Will TRX hit $0.50 by end of 2026?

    The path exists but requires alignment. TRX needs to hold above $0.30 through summer, reclaim $0.36 on real volume, and then absorb one of these three catalysts cleanly: (1) TRON crossing $100 billion in hosted USDT, (2) a confirmed Coinbase US listing, (3) a Tether policy change that reallocates supply back toward TRON at Ethereum’s expense.

    Our base case is that at least one of those triggers hits inside 12 months and pushes TRX into the $0.42 to $0.50 corridor by year-end 2026. Whether it closes above $0.50 depends on how quickly momentum funds rotate in once the level breaks. We give it a 35% probability of a clean weekly close above $0.50 by December 31, 2026.

    What Would Change Our View

    Three explicit triggers that would force us to revise upward or downward.

    Upgrade the target if: USDT supply on TRON crosses $100 billion before Q1 2027, or Coinbase lists TRX on its main exchange. Either alone pushes the base case toward $0.55 and the bull case above $0.70.

    Downgrade the target if: Tether announces a formal strategy shift favoring Ethereum layer-2s or Plasma, or Justin Sun-linked wallets execute a visible distribution above 500 million TRX inside a 30-day window. Either would signal that the setup we’re describing is breaking and would drop the base case toward $0.28.

    Rethink the whole thesis if: the DOJ, OFAC, or a European regulator opens a new enforcement action against Sun, the TRON Foundation, or a major exchange for TRON-related activity. That kind of shock re-rates the token to bear-case levels regardless of on-chain fundamentals.

    How TRX Fits Alongside Other 2026 Setups

    If you’re building a broader “stablecoin infrastructure and settlement” sleeve, TRX is one leg. Real-world asset issuance is another. We’ve covered Ondo’s 2026 setup for the RWA angle and AAVE’s 2026 outlook for the stablecoin credit angle. A basket of the three is one way to express a “stablecoins are eating finance” thesis without over-concentrating.

    Frequently Asked Questions

    Will TRON (TRX) reach $1 in 2026?

    Reaching $1 in 2026 is possible but not the base case. It would require TRX to first break decisively above $0.50, then absorb a major catalyst such as crossing $100 billion in hosted USDT or the beginning of net-deflationary supply. Mainstream analyst ranges from Changelly and Coinpedia land at $0.35 to $0.60 for 2026, with $1 more realistic as a 2027 scenario if compounding holds.

    Is TRON a good investment in 2026?

    TRON has real utility as the largest stablecoin settlement layer in crypto, with over 46% of global USDT supply. That’s a defensible moat. It also carries real risks: insider concentration around 63% and regulatory overhang despite the dismissed SEC case. TRX may suit a long-term holder who wants exposure to stablecoin adoption but understands the governance discount that comes with it.

    What is the TRON price prediction for 2026?

    Our base case is $0.35 to $0.50 by year-end 2026, with a bull case of $0.60 and a bear case of $0.22. This aligns with the analyst spread from Changelly, Coinpedia, Coinbase’s CMC-AI, and Bitcoin Foundation. The $0.50 level is the single most important price in the year: reclaim it and the door opens to $0.80 or higher in 2027.

    Why does TRON dominate USDT?

    TRON’s appeal for USDT is simple: sub-dollar transfer fees, 3-second finality, and deep exchange integration for retail flow in Asia, Latin America, and Africa. Ethereum L1 transfer costs of $2 to $10 don’t work for a worker sending $50 home. TRON became the settlement rail because it solved the small-transfer economics no other chain matched at scale.

    Is TRON safe from SEC action now?

    The specific SEC case against Justin Sun and the TRON Foundation was dismissed with prejudice in March 2026, meaning it cannot be refiled on the same facts. That significantly reduces one class of regulatory risk. It does not eliminate all US enforcement risk, since the DOJ, OFAC, and state regulators operate independently and TRM Labs continues to flag illicit-flow concentration on TRON.

    Can TRX hit $0.50 by year end?

    We give it roughly a 35% probability of a clean weekly close above $0.50 by December 31, 2026. The path requires TRX to reclaim $0.36 on real volume, then land at least one catalyst from the trigger list: $100 billion in hosted USDT, a confirmed Coinbase listing, or a Tether allocation policy shift back toward TRON.

    The Honest Take

    TRX is not a moonshot. It’s a rerate-or-range trade on the most boring but most important use case in crypto, which is stablecoin settlement. The bull case runs through the $0.50 level and hinges on stablecoin dominance keeping its current trajectory. The bear case is credible: single-issuer dependency on Tether, real insider concentration, and lingering compliance headline risk.

    What makes this setup interesting rather than a pass is asymmetry. Downside from $0.33 to bear-case $0.22 is roughly 33%. Upside from $0.33 to bull-case $0.60 is roughly 82%, with a longer-tail 2027 scenario in the $1 range if the deflation narrative confirms. That’s the kind of risk-reward that rewards a small, patient allocation more than a large tactical position.

    Watch three data points weekly: USDT supply hosted on TRON, TRON’s share of global stablecoin transfers, and the delta between TRX price and TRON network revenue. When those three line up in the same direction for a month, the range breaks. Until then, TRX is a monitor-not-chase setup.

    Disclaimer

    Disclaimer: This article is for informational and educational purposes only and should not be construed as financial, investment, or trading advice. Cryptocurrency markets are highly volatile, and past performance does not guarantee future results. The price predictions and analyses presented here are based on AI models, technical indicators, and available data at the time of writing. They are not guarantees. Always conduct your own research (DYOR) and consult with a qualified financial advisor before making any investment decisions. Pump Parade and its authors do not assume liability for financial losses incurred based on information provided in this article.
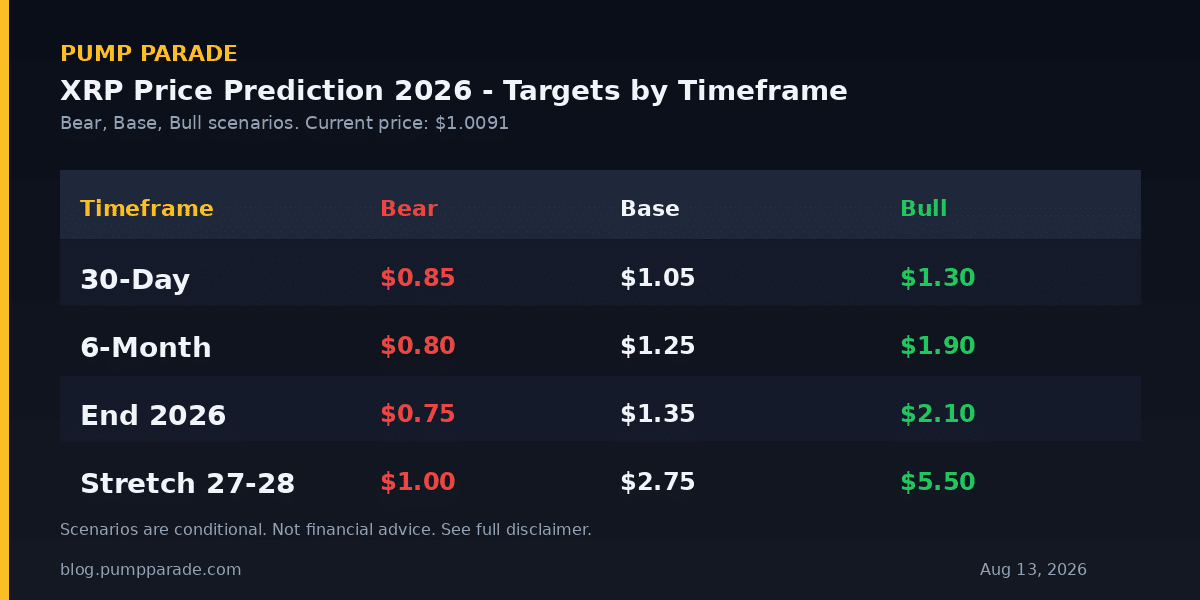
    Solana (SOL) Price Prediction 2026: Can SOL Reclaim $150?

    Any serious Solana price prediction 2026 has to start with one number: SOL trades at $73.63 as of August 7, 2026, up 0.7% on the day and holding a $42.9 billion market cap at rank #7. Yet the token still sits roughly 75% below its January 2025 all-time high of $294.

    That gap between current price and prior peak is the whole story. Since Morgan Stanley launched its spot Solana ETF on July 28, cumulative SOL ETF inflows have climbed to $1.15 billion. Meanwhile, the Solana Foundation is racing to ship Alpenglow, the consensus overhaul that would slash finality from 12 seconds to 150 milliseconds. The bull case for SOL to reclaim $150 in 2026 is being written in real time. So is the bear case. This article walks through the numbers, the catalysts, the risks, and what would need to happen for SOL to double from here.

    Key Takeaways

    • SOL trades at $73.63 with $42.9B market cap, down 75% from its $294 ATH.
    • Morgan Stanley's spot SOL ETF pulled $19M in its first day; cumulative SOL ETF AUM sits at $878M.
    • Alpenglow mainnet activation (150ms finality) is targeted for Q3 2026, the dominant near-term catalyst.
    • Standard Chartered's $250 target anchors the bull case; Coinpedia's $130-$200 range anchors the base case.
    • Key risks: validator centralization, MEV extraction complaints, and continued Bitcoin weakness.
    • Base case for December 2026: $95-$140. Bull case with Alpenglow ship + ETF acceleration: $180-$220.
    Solana (SOL) price prediction 2026 hero graphic , current price $73.63, Alpenglow catalyst ahead of Q3 mainnet

    Where Solana Stands Today

    SOL has spent most of Q3 2026 grinding sideways in the $65-$80 range, with volume normalizing after the Morgan Stanley ETF launch. Here is the live snapshot from Birdeye and CoinPaprika:

    Metric Value
    Price $73.63
    24h change +0.73%
    7d change +0.07%
    Market cap $42.9B
    24h volume $6.96B
    Rank #7
    All-time high $294.16 (Jan 2025)
    % from ATH -74.98%
    24h unique wallets 652,740

    Two data points matter more than the price itself. Daily active wallets crossed 650,000, up 2.7% week-over-week, meaning the base of on-chain users is still expanding despite the drawdown. And 24-hour DEX volume of $6.96 billion continues to eclipse Ethereum mainnet by a factor of two-plus on most days. Whatever the price screens say, network usage did not collapse with the token.

    Why is Solana Range-Bound Right Now?

    Three forces are locking SOL between $65 and $80. First, macro liquidity remains tight, with Bitcoin oscillating in a similar consolidation pattern and pulling the entire risk complex with it. Second, roughly 74% of holders bought in above current levels, creating overhead supply every time SOL rallies. Third, the market is pricing in Alpenglow risk. Traders are waiting to see the upgrade ship before repricing.

    The result: derivatives funding stays neutral, spot flows are steady but not explosive, and open interest keeps rebuilding after every liquidation flush. This is coiling behavior, not capitulation.

    The Bull Case for SOL in 2026

    Alpenglow Mainnet Activation

    Alpenglow is the most consequential Solana upgrade since the Firedancer client. It replaces the current Tower BFT consensus with Votor and Rotor, targeting sub-200 millisecond finality. In practice, that means order-matching engines, prediction markets, and high-frequency DeFi apps get latency that beats most centralized exchanges. Anatoly Yakovenko has publicly targeted Q3 2026 for mainnet. If the beta clusters continue to hold through August testnet, activation becomes the single biggest fundamental catalyst SOL has ever had.

    Institutional ETF Flow Compounding

    The Morgan Stanley spot SOL ETF is doing what the Bitcoin spot ETFs did in early 2024: quietly compounding institutional exposure. Cumulative SOL ETF net assets sit at $878.33M, and the fund is passing 95% of staking rewards to shareholders. That yield-plus-price structure is a first for a large-cap ETF product and is drawing pensions and RIAs that skipped Bitcoin ETFs entirely. If flow velocity matches the Bitcoin ETF launch curve, cumulative SOL ETF AUM could clear $5B by year-end 2026.

    DePIN and Firedancer Decentralization

    Firedancer from Jump Crypto now runs a growing share of validator infrastructure. Client diversity was the standing critique from institutional buyers, and it is being systematically addressed. In parallel, DePIN protocols like Helium and Hivemapper anchor Solana as the default chain for physical-world coordination. This is the boring, structural bull case that is hardest to price but easiest to defend.

    The Bear Case for SOL in 2026

    MEV and Validator Concentration

    Jito and its validator clients now capture the majority of block rewards, and MEV extraction complaints have reached the point where Solana Foundation research is publicly debating protocol-level mitigations. Any regulatory intervention or a botched MEV rework could rattle validator economics and, by extension, staking yield. Institutions notice.

    Token Unlock and Foundation Selling

    Solana Foundation and early-investor unlocks continue on a monthly cadence through 2027. Even with ETF inflows, the market must absorb steady structural supply. Analysts at K33 have flagged this as the single largest overhang, arguing that SOL needs sustained $500M+ monthly ETF inflows just to offset scheduled unlocks at current prices.

    Bitcoin Correlation Risk

    SOL's 90-day beta to Bitcoin sits above 1.4. If BTC breaks below its own consolidation range, SOL likely tests $50 before it tests $100. Historical drawdowns during BTC weakness have averaged 1.6x the reference move, and there is nothing about 2026 rhyming with 2023 that suggests this decoupling.

    What Are the Solana Price Targets for 2026?

    Solana (SOL) price prediction 2026 targets table , bear $70, base $125, bull $200 by December 2026

    Below is our house view, cross-checked against Standard Chartered, Coinpedia, and CoinMarketCap consensus. All targets assume no black-swan macro event.

    Timeframe Bear Base Bull
    30 days (Sept 2026) $58 $78 $95
    6 months (Feb 2027) $62 $115 $165
    Dec 2026 close $70 $125 $200
    Long-term (2027-28) $90 $180 $295

    30-Day Outlook (September 2026)

    Base case: SOL grinds toward $78-$82 as Alpenglow testnet milestones hit and ETF flows compound. A daily close above $79 (the 100-day EMA cluster) opens $95. Bear case: Bitcoin loses $85K and SOL revisits $58, where the June low sits.

    6-Month Outlook (February 2027)

    By early 2027, Alpenglow should be live and initial post-upgrade validator behavior priced in. If daily transaction throughput stays above 5,000 real TPS (excluding vote transactions) and ETF AUM crosses $3B, $115-$140 becomes a defensible base. The bull scenario, requiring both a broader crypto risk-on move and continued institutional bid, brings $165 into play.

    Long-Term (2027-2028)

    Standard Chartered's $250 target and Doo Prime's $336 upside case are meaningful but require compounding assumptions: Alpenglow adopted, Firedancer running majority of validators, ETF AUM comparable to Ethereum ETFs, and Bitcoin above $150K. Base case: SOL retests $180-$200. A new ATH above $295 is possible but requires everything to go right.

    How Does Solana Compare to Ethereum in 2026?

    The fair comparison is not SOL versus every L1. It is SOL versus ETH, because that is the trade institutional allocators are actually making. Recent Pump Parade coverage of the Ethereum price outlook for 2026 laid out the ETH bull case at $4,000. Here is how the two stack up today:

    Metric Solana (SOL) Ethereum (ETH)
    Price $73.63 $1,911
    Market cap $42.9B $230B
    % from ATH -75% -61%
    Daily active wallets ~652K ~450K
    Real DEX volume (24h) $6.96B $2.4B
    Staking yield (net) ~6.8% ~2.9%
    Median tx cost <$0.001 ~$0.35

    SOL loses on absolute size and institutional maturity. It wins on user activity, throughput, cost, and yield. If you believe the next crypto cycle is retail-heavy and application-driven, that mix favors Solana. If you believe institutional capital continues to reward the incumbent smart-contract chain, ETH is your trade. Most large-cap allocators are running both, and independent research from K33 Research supports the barbell approach for 2026.

    For traders looking at the perp side of Solana's ecosystem, our Hyperliquid vs GMX comparison is worth a read to understand where the on-chain derivatives flow is actually settling. For a broader view of SOL's liquid staking ecosystem, our Jito review unpacks the validator layer that now underpins most institutional SOL exposure. Official Alpenglow technical specs are on the Solana Foundation blog, and live token stats can be verified on CoinGecko.

    What Would Change Our View

    Three explicit triggers would force a rewrite of this outlook:

    1. Alpenglow slippage past Q4 2026. If the upgrade misses its Q3 window and pushes to 2027, we would cut the 6-month base case by 20% and lean toward the bear range. The market is already pricing in on-time delivery.
    2. Cumulative SOL ETF outflows for a full month. Sustained outflows would signal that the institutional bid has stalled and would put $58-$62 back in play. So far, every July session closed net-positive.
    3. Any protocol-level MEV overhaul that disrupts staking yield. If validator economics fall meaningfully below current levels, the ETF product loses its differentiator and inflows likely decelerate.

    Frequently Asked Questions

    Will SOL reach $150 in 2026?

    Reaching $150 in 2026 is our bull-case scenario, requiring Alpenglow to ship on schedule, sustained ETF inflows above $500M per month, and Bitcoin holding above $90K. Base case sees SOL closing 2026 between $95 and $140. A $150 print is possible but not the median outcome.

    Is Solana a good investment in 2026?

    Solana offers a rare combination of large-cap liquidity, real on-chain usage, and a defined catalyst calendar. The setup favors patient buyers on drawdowns rather than momentum chases at highs. Risk-adjusted, SOL screens better than most top-10 alts right now, but position sizing matters given 60-70% drawdowns are historically routine.

    What is the Solana price prediction for 2027?

    By 2027, base case targets sit at $150-$200 assuming Alpenglow adoption, Firedancer running majority validators, and continued ETF momentum. Standard Chartered's $250 target is the bull anchor for late 2027. A new all-time high above $295 requires everything to go right, including a broader crypto bull cycle.

    Why is SOL down so much from its all-time high?

    SOL peaked at $294 in January 2025 during peak meme-coin activity on Pump.fun. When that speculative flow collapsed in Q2 2025, SOL de-rated with it. The current $73 handle reflects normalized on-chain activity and a market that has not yet priced in Alpenglow. The drawdown is severe but consistent with prior cycle behavior.

    When does Alpenglow launch on Solana?

    The Solana Foundation targets Q3 2026 for Alpenglow mainnet activation. Beta clusters are running on testnet through August 2026, and validator upgrade coordination is underway. Slippage risk exists, but current signals point to on-schedule delivery. Watch the Solana Foundation blog for the official activation date.

    How does Solana staking work with the ETF?

    The Morgan Stanley spot SOL ETF stakes underlying SOL and passes 95% of staking rewards to shareholders, currently yielding around 6.5% net of fees. This is a structural improvement over spot Bitcoin ETFs, which offer no yield component, and is a primary driver of the ETF's $878M in net assets since launch.

    The Honest Take

    SOL at $73 is neither the layup buy of the cycle nor a value trap. It is a large-cap crypto asset with a clear, dateable catalyst (Alpenglow), a compounding institutional flow (ETFs), and identifiable structural risks (unlocks, MEV, BTC beta). If you already own SOL, holding through Alpenglow makes sense given the risk-reward. If you do not own it, dollar-cost averaging into the $65-$78 band with defined stops below $58 is a reasonable framework.

    The trade that does not make sense is levered chasing at $95 hoping for $150. That is the trade the ETF-era market punishes hardest. Watch flow, watch upgrade cadence, and let the setup come to you.

    Disclaimer: This article is for informational and educational purposes only and should not be construed as financial, investment, or trading advice. Cryptocurrency markets are highly volatile, and past performance does not guarantee future results. The price predictions and analyses presented here are based on AI models, technical indicators, and available data at the time of writing, they are not guarantees. Always conduct your own research (DYOR) and consult with a qualified financial advisor before making any investment decisions. Pump Parade and its authors do not assume liability for financial losses incurred based on information provided in this article.
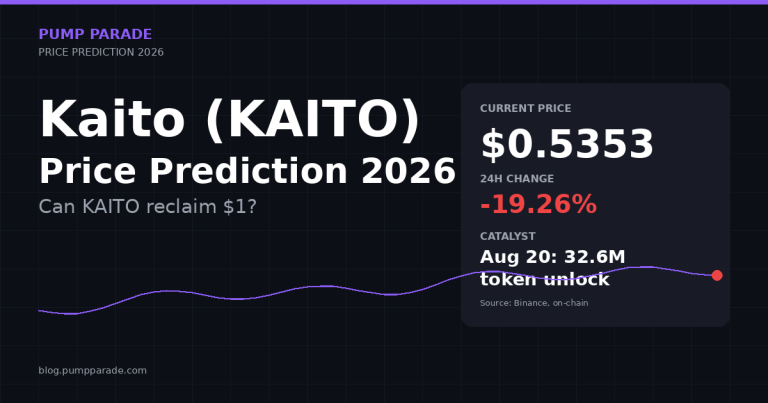
    Ledger vs Trezor: Best Hardware Wallet in 2026

    0

    If you hold more than a few thousand dollars in crypto and it still lives on an exchange or a browser extension, you already know the fix: a hardware wallet. The harder question is which one. In 2026 the debate keeps landing on the same two names: Ledger and Trezor. Both are more than a decade old, both have millions of users, and both have upgraded their flagships in the last 18 months. So which one is actually the better buy right now?

    This head-to-head compares the Ledger lineup (Nano S Plus, Nano X, Flex, Stax) against the Trezor Safe 5, digs into security architecture, coin support, fees, UX, and mobile experience, and closes with a use-case verdict so you can pick the right device without regret.

    Quick Verdict (TL;DR)

    • Best for most crypto users in 2026: Ledger Nano X. The mix of 5,500+ supported coins, Bluetooth mobile signing, and the polished Ledger Live app is hard to beat.
    • Best for open-source purists and Bitcoin-heavy stackers: Trezor Safe 5. Fully auditable firmware, EAL6+ secure element, and free Shamir Backup at $129.
    • Best premium showpiece: Ledger Stax at $399 (curved E Ink touchscreen, wireless charging).
    • Best budget entry: Ledger Nano S Plus at $79 if you can live without Bluetooth.

    If you still cannot decide, the short version is this: choose Ledger if you want the broadest ecosystem and the smoothest mobile experience; choose Trezor if verifiable open source matters more to you than convenience.

    Ledger vs Trezor at a Glance

    Ledger vs Trezor Safe 5 comparison table with prices, coin support, secure element, firmware, and recovery options

    The specs above tell most of the story, but each row hides real tradeoffs. Below, we unpack them.

    Company Backgrounds

    Ledger launched in 2014 out of Paris and has sold well over 7 million devices worldwide. It suffered a widely covered e-commerce database breach in 2020 that exposed 270,000+ customer records. No hardware wallets or funds were compromised, but the leaked names and addresses fueled years of phishing and, in a few extreme cases, physical threats. Ledger tightened its data handling, but the incident still colors the brand.

    Trezor, made by Czech-based SatoshiLabs, invented the modern hardware wallet in 2013. Its unique selling point has always been radical transparency: firmware, schematics, and even bootloader code live on GitHub for anyone to audit. Trezor was slower than Ledger to add a certified secure element, but the Safe 3 and Safe 5 finally closed that gap while keeping the open-source philosophy intact.

    Security Deep Dive

    Secure Element

    Both companies now ship EAL6+ certified secure element chips on their newer models, which puts them in the same league as government ID cards and payment terminals. The Trezor Safe 5 uses the OPTIGA Trust M (EAL6+); the Ledger Nano X and Stax use ST33 chips (EAL5+ and EAL6+ depending on the SKU). In practical terms, remote extraction of your seed from either device via a software flaw is not something anyone has demonstrated.

    Open Source vs Closed Source

    This is the philosophical fault line. Trezor publishes essentially everything: firmware, apps, hardware schematics. Any independent researcher can compile the firmware, diff it against what is on the device, and verify no backdoor exists. Ledger publishes its higher-level apps but keeps the low-level firmware that runs inside the secure element closed. Ledger's argument is that the chip vendor NDA requires closed code and that certifications are stronger evidence than public source. Trezor's argument is that trust should not require faith. Both positions are defensible; pick the one that matches your threat model.

    Physical Attack History

    Older Trezor Model One and Model T units had documented physical attack paths where an attacker with physical access, specialized gear, and time could extract the seed. The Safe 3 and Safe 5 added a secure element specifically to close that vector. Ledger has never publicly lost a seed to a physical attack, though the 2018 Ledger Donjon researchers found (and Ledger patched) firmware bugs. Both vendors now have solid physical security.

    Ledger Recover Controversy

    In 2023 Ledger introduced Ledger Recover, an optional paid subscription that splits your seed into three encrypted shards held by third-party custodians so you can restore your wallet with an ID check. Critics argued that even the technical possibility of the device exporting seed material off-chip breaks the hardware wallet trust model. Ledger points out the feature is opt-in and off by default. Trezor takes a purer stance: it offers free Shamir Backup, which splits the seed into shares you distribute yourself, with no third party involved. If custody of your seed backup is a hard line for you, Trezor wins this one cleanly.

    Coin & Chain Support

    Ledger's ecosystem is broader. Through Ledger Live and third-party integrations, Ledger officially supports 5,500 to 6,500+ assets across more than 200 chains, including Bitcoin, Ethereum and its major L2s, Solana, XRP, Cardano, Polkadot, Avalanche, BNB Chain, Cosmos, Tron, Sui, Aptos, and TON. Native app integrations for Solana SPL tokens, Ethereum ERC-20, and Bitcoin are excellent.

    Trezor Safe 5 covers 1,000+ coins natively and reaches roughly 8,000+ tokens when you count ERC-20, BEP-20, and SPL standards. The biggest gaps versus Ledger are Sui, Hedera (HBAR), TON, and a handful of newer L1s. If you live inside Bitcoin and Ethereum, you will not notice the difference. If you rotate between many Solana ecosystem tokens, memecoins, and cross-chain assets, Ledger's longer tail matters.

    Pricing & Fees

    Trezor keeps its lineup simple and cheap. The Safe 3 is $79, the Safe 5 is $129, the Safe 7 sits at the top end. There are no subscriptions and no bundled fees.

    Ledger runs a wider ladder: Nano S Plus $79, Nano X $149, Flex $249, Stax $399. The Ledger Recover subscription is optional at roughly $9.99 per month if you turn it on. In-app swaps and buys through Ledger Live and Trezor Suite route through third-party providers (MoonPay, Changelly, 1inch, Thorchain, and others), and their spreads typically run 1 to 2% on top of network gas. That is meaningfully more expensive than swapping directly on a DEX aggregator like Jupiter or 1inch. For active swappers, connect your hardware wallet to a browser DEX instead of using the built-in provider.

    Total Cost of Ownership (2 years)

    • Trezor Safe 5: $129 device + $0 subscription = $129
    • Ledger Nano X: $149 device + $0 subscription (Recover off) = $149
    • Ledger Nano X + Recover: $149 + ~$240 (24 months) = ~$389
    • Ledger Stax: $399 device + $0 (Recover off) = $399

    User Experience

    Ledger hardware wallets product lineup including Nano X and Stax

    Ledger Live is the more mature companion app. Portfolio dashboards, staking for ETH, SOL, DOT, ATOM, ADA, and TRX, NFT viewing, market data, and a WalletConnect bridge all live in one place, and it works on desktop and mobile with Bluetooth pairing to the Nano X and Stax. First-time setup takes about ten minutes and the app walks you through PIN, seed generation, and firmware verification.

    Trezor Safe 5 hardware wallet with color touchscreen

    Trezor Suite is cleaner, more privacy-focused, and includes a built-in Tor toggle that Ledger Live still lacks. The Safe 5's 1.54" color touchscreen with haptic feedback is genuinely delightful to use, and transaction verification on-device is easier to read than Ledger's tiny Nano screens. Where Trezor falls behind is mobile: Trezor Suite Lite on iOS and Android is view-only. To sign a transaction you still need a computer. Ledger's Bluetooth signing on iPhone and Android remains a real edge for anyone who trades or interacts with dApps on the go.

    Pros and Cons

    Ledger (Nano X / Stax)

    Pros

    • Widest asset support in the industry (5,500+ coins, 200+ chains)
    • Bluetooth signing on iOS and Android for real mobile use
    • Polished Ledger Live app with staking, swaps, NFT support in one place
    • Certified secure element with an unbroken track record
    • Strong physical build quality (Stax's curved E Ink is a genuine engineering feat)

    Cons

    • Closed-source firmware inside the secure element
    • Ledger Recover shook trust for many long-time users, even if opt-in
    • 2020 e-commerce breach still generates phishing attempts against Ledger customers
    • Stax and Flex are pricey relative to what Trezor offers

    Trezor Safe 5

    Pros

    • Fully open-source firmware, verifiable by anyone
    • EAL6+ secure element (OPTIGA Trust M) with no closed-source layer above it
    • Best-in-class color touchscreen and on-device transaction preview
    • Free Shamir Backup for advanced seed management
    • Excellent value at $129
    • Trezor Suite includes native Tor support for private connections

    Cons

    • Mobile experience is view-only; signing still requires a computer
    • Fewer supported coins than Ledger, especially on newer L1s
    • No dedicated NFT gallery in Suite
    • Historical physical-attack reputation lingers, even though Safe 5 has closed those vectors

    Security & Trust in Numbers

    Both companies now publish external audit reports. Ledger's in-house team, Ledger Donjon, is one of the most respected hardware security research groups in the industry and publishes findings on other vendors, including Trezor. Trezor works with third-party auditors and, crucially, invites open community audits.

    Independent aggregators like the CoinGecko hardware wallet directory and the DeFiLlama protocol dashboards both list Ledger and Trezor among the top three self-custody solutions by holdings secured, alongside older Bitcoin-only specialists like Coldcard. Neither device has been drained through a remote software exploit in the last 24 months.

    Which Should You Buy?

    Buy Ledger if…

    • You hold a diverse portfolio across many chains, especially newer L1s and L2s.
    • You want to sign transactions from your phone (Bluetooth on Nano X and Stax).
    • You value polished software (Ledger Live) over ideological open source.
    • You want an all-in-one app for staking, swaps, and NFT viewing.

    Buy Trezor Safe 5 if…

    • You want firmware you or a researcher can inspect line by line.
    • Your holdings are Bitcoin, Ethereum, and their L2s, plus major SPL and ERC-20 tokens.
    • You prefer to sign from a computer (or already do most of your DeFi from desktop).
    • You care about advanced backup options like Shamir shares.
    • You want the best value: $129 for a modern touchscreen wallet is a strong deal.

    Consider Both

    Serious long-term holders often keep two hardware wallets from different vendors: one primary for daily use, one cold-storage backup with a different seed and passphrase. It is a straightforward hedge against a single vendor flaw, and at combined $278 for a Trezor Safe 5 plus a Ledger Nano X, it is cheaper than most people's monthly gas bill.

    Setup Tips (For Either Device)

    1. Buy only from the official store: ledger.com or trezor.io. Never buy hardware wallets from Amazon or eBay resellers.
    2. Verify the device is genuine using the official app's attestation check on first connect.
    3. Generate the seed on the device itself. Never accept a pre-printed seed card.
    4. Write the 12, 20, or 24 words on paper or a steel plate. Store two copies in two locations.
    5. Add a passphrase (the 25th word) if your holdings justify the extra ceremony. Losing the passphrase means losing the funds; do not skip the backup.
    6. Move a small test amount first. Confirm you can receive and send before you migrate serious size.

    Frequently Asked Questions

    Is Ledger safe to use after the 2020 data breach?

    The breach exposed customer email and shipping information from Ledger's e-commerce site, not seeds or funds. Your Ledger device itself was never compromised. That said, Ledger customers still receive frequent phishing emails and fake "Ledger" texts. Never enter your 24-word seed into any website or app. Ledger will never ask for it.

    Is Trezor open source really more secure than Ledger closed source?

    Open source does not automatically mean more secure, but it does mean more auditable. Nobody has to trust a marketing claim; the code is on GitHub. In practice, both devices are secure enough that the weak link is almost always the user, not the wallet.

    Can I use the same seed on both a Ledger and a Trezor?

    Yes, if you use the standard BIP-39 12 or 24-word seed (Ledger's default and Trezor's default without Shamir). You can restore the same seed onto a device from either vendor and see the same addresses. This is a useful test if you ever need to migrate or verify a backup.

    Do I still need a hardware wallet if I use a strong hot wallet like Phantom or Backpack?

    For everyday spending and small trading balances, a well-configured hot wallet is fine. For long-term holdings, a hardware wallet remains the single biggest upgrade you can make to your security. See our Phantom Wallet Review 2026 and Backpack Wallet Review 2026 for how the leading hot wallets stack up, but the rule of thumb is the same: cold storage for savings, hot wallets for spending.

    Does Ledger Recover mean my seed is stored online?

    Only if you opt in and pay the subscription. When enabled, an encrypted representation of your seed is split into three shards and held by three separate custodians (Ledger, Coincover, and EscrowTech). Turned off, your seed never leaves the device. Most experienced users leave it off.

    Bottom Line

    In 2026, neither Ledger nor Trezor is a bad choice; both protect your keys better than any exchange or browser extension ever will. The choice comes down to values and use case.

    If you need the broadest coin support, real mobile signing, and a polished all-in-one app, buy the Ledger Nano X ($149). If you want fully open-source firmware, a beautiful touchscreen, free Shamir Backup, and the best price-to-value ratio in the market, buy the Trezor Safe 5 ($129). And if you are securing life-changing amounts, use both, from different vendors, with different seeds. That is what the professionals do.