More
    Home Blog Page 7

    Rabby Wallet Review 2026: Fees, Features & Verdict

    0

    If you interact with more than one EVM chain, you already know the pain. You switch networks manually, you sign transactions blind, and every so often a shady contract quietly drains a token you approved months ago. Rabby Wallet, built by the team behind DeBank, tries to fix all three problems in a single browser extension. In 2026, is it good enough to replace MetaMask as your daily EVM wallet? Here is the full breakdown.

    Quick Verdict: 4.6 / 5

    Rabby is the safest, most DeFi-friendly EVM wallet you can install today. Its pre-transaction simulation, one-click approval revocation, and auto chain switching solve real problems that MetaMask has ignored for years. The only reason not to use it: you need Solana, Bitcoin, or another non-EVM chain. Rabby is EVM-only, so most active users end up pairing it with a Solana wallet like Phantom.

    Best for: Active DeFi users, multi-chain EVM traders, anyone tired of signing blind.
    Skip if: You only touch Solana or Bitcoin, or you want a single wallet for every ecosystem.
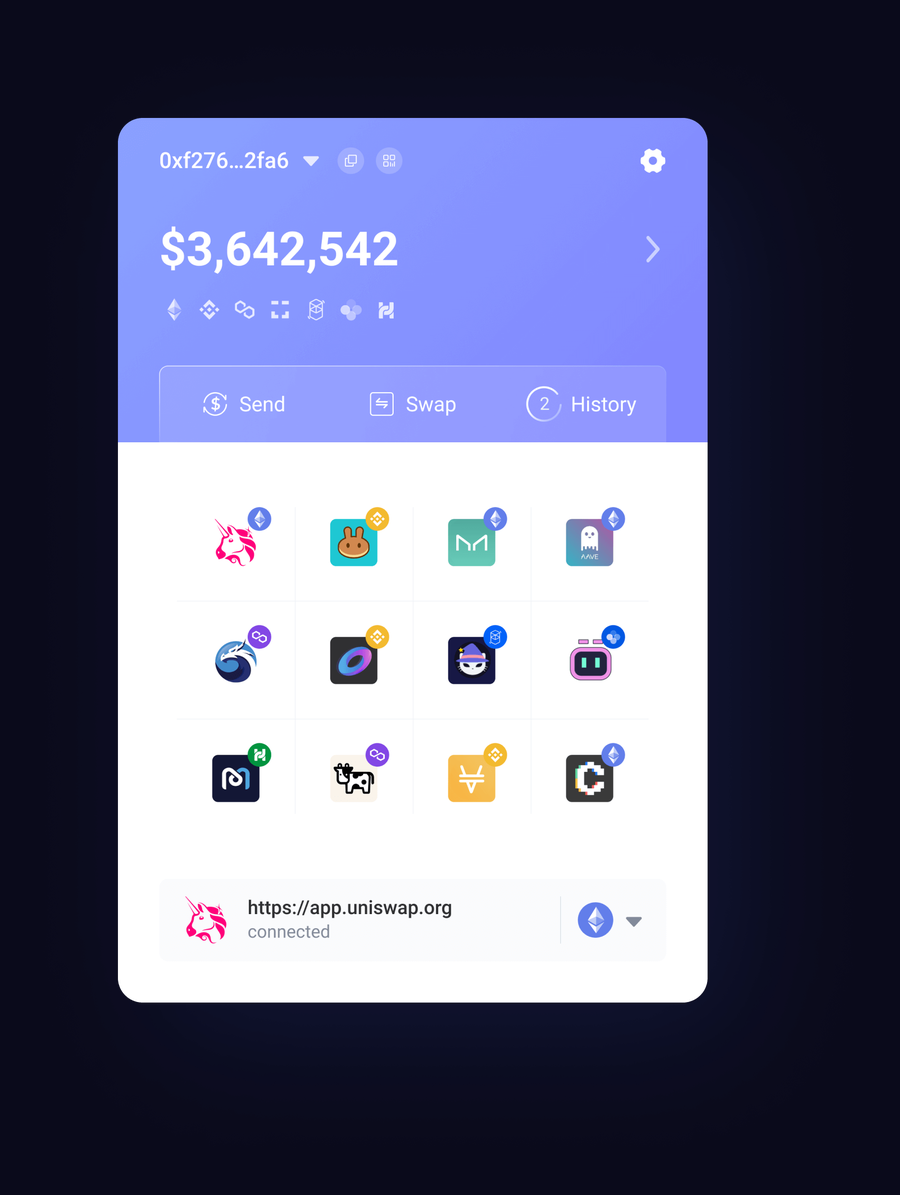
    Rabby Wallet browser extension
    Rabby Wallet: EVM-first browser wallet from the DeBank team. Source: rabby.io

    What Is Rabby Wallet?

    Rabby is a non-custodial browser extension and mobile wallet designed specifically for Ethereum and EVM-compatible chains. It launched in 2021 as a companion product to DeBank, the leading DeFi portfolio dashboard, and has grown into one of the most trusted alternatives to MetaMask for power users.

    The wallet is fully open source under the MIT license and audited by two independent firms: Least Authority (2024, re-reviewed 2025) and SlowMist (2025). That is a stricter license than MetaMask, whose code is source-available but proprietary.

    Rabby supports over 100 EVM chains out of the box, including Ethereum, Arbitrum, Optimism, Base, Polygon, BNB Chain, Avalanche, Blast, Scroll, Linea, and dozens more. There is no manual RPC setup. You visit a dApp on any supported chain and Rabby switches automatically.

    Rabby Wallet Key Stats (2026)

    • Type: Non-custodial browser extension, iOS and Android mobile apps
    • Chains supported: 100+ EVM networks
    • Built by: DeBank team
    • License: MIT open source
    • Audits: Least Authority (2024, 2025), SlowMist (2025)
    • Native token: None
    • Cost: Free to download and use
    • Hardware wallet support: Ledger, Trezor, Keystone, GridPlus, imKey, OneKey

    Feature Deep Dive

    1. Pre-Transaction Simulation

    This is the headline feature and the main reason people switch. Before you sign anything, Rabby runs the transaction on its own simulation nodes and shows you exactly what will happen. Which tokens leave your wallet, which arrive, which contracts get called, and whether the transaction is likely to revert.

    MetaMask has been catching up in this area but Rabby has done it longer and does it more clearly. If you approve a token, Rabby tells you the exact spender address and how much you are approving. If a contract looks malicious, you see a red warning before your signature ever hits the network. In a year where phishing kits have gotten scarily good at mimicking real dApp UIs, this alone is worth switching for.

    2. Automatic Chain Switching

    Open a Base dApp and Rabby switches to Base. Move to an Arbitrum protocol and it switches to Arbitrum. You never see the “wrong network” popup that has annoyed MetaMask users since 2020. For anyone who touches more than two chains per session, this saves a stunning amount of time.

    3. Approval Management

    Rabby ships with a built-in Approvals page that lists every active token allowance across every EVM chain you have used. You can sort by risk, filter by contract, and revoke permissions in a single click without paying a separate service like Revoke.cash. In an era when a lot of DeFi exploits trace back to stale approvals from long-dead protocols, this feature is a real safety win.

    4. Built-In Swap Aggregator

    Rabby integrates a swap aggregator that routes across major EVM DEXs and aggregators (0x, 1inch, ParaSwap, Uniswap, KyberSwap, and OpenOcean depending on chain). Quotes are transparent and you can compare all sources side by side before choosing.

    The swap adds a small routing fee that is baked into the quote you see, which is competitive with MetaMask’s swap and cheaper than Coinbase Wallet’s. For anyone who does a lot of small swaps, this saves the friction of hopping to a separate DEX aggregator.

    5. Multi-Chain Portfolio View

    Because Rabby is built by the DeBank team, its portfolio view is one of the strongest in any wallet. You get a unified balance across every EVM chain, DeFi position tracking for hundreds of protocols, and NFT display. If you have used DeBank as a standalone dashboard, this is essentially that experience baked into your wallet.

    6. Mobile App

    Rabby launched its mobile app for iOS and Android in late 2025, and by 2026 feature parity with the extension is close but not identical. Transaction simulation, chain switching, and approvals all work on mobile. The swap aggregator is available. Hardware wallet support on mobile is limited compared to the extension.

    Fees & Pricing

    Rabby is free to download and free to use. There is no subscription, no premium tier, and no paywall for advanced features. The only cost is the standard gas fee for every on-chain transaction, which goes to network validators, not to Rabby.

    The one place Rabby earns revenue is the built-in swap aggregator, which adds a routing fee (typically 0.25 percent) that is included in the quoted price. If you find a better rate elsewhere you can, of course, use a different DEX and pay only gas.

    Compared to Phantom, which now charges a small percentage on its swap product, and MetaMask, which takes a higher swap fee, Rabby’s economics are trader-friendly.

    Rabby transaction simulation
    Rabby simulates every transaction before you sign, showing exact token movements.

    Security & Trust

    This is where Rabby genuinely stands apart.

    • Fully open source under MIT license. Anyone can audit the code, and independent researchers regularly do.
    • Two rounds of professional audits from Least Authority and SlowMist. Reports are public.
    • Non-custodial by design. Your seed phrase never touches Rabby’s servers. Private keys are encrypted locally with a password of your choice.
    • Hardware wallet support for Ledger, Trezor, Keystone, GridPlus, imKey, and OneKey. Air-gapped signing is supported for Keystone and Ngrave.
    • Anti-phishing risk scanner that cross-checks contract addresses against known scam databases and flags suspicious approvals in real time.

    No wallet is a silver bullet against user error, but Rabby’s default settings assume you might sign something dangerous and try to stop you first. That is the right posture in 2026.

    User Experience

    The UI is clean, dense, and clearly built for people who know what a router contract is. If you are brand new to crypto, MetaMask’s more guided onboarding might feel gentler. If you have been through more than a handful of transactions, Rabby feels faster and more informative.

    The dashboard shows your total balance across all chains with a single glance at DeFi positions, tokens, and NFTs. Swap history, activity, and pending transactions all live in one panel. The signing flow itself is where Rabby shines: every popup shows the simulated result before you commit.

    Onboarding takes about two minutes. You install the extension, create a wallet or import a seed phrase, set a password, and you are done. No email, no KYC, no account creation.

    Pros

    • Best-in-class pre-transaction simulation, which prevents most common scam signatures
    • Automatic chain switching across 100+ EVM networks
    • One-click approval management, no third-party revoke tool needed
    • Fully open source (MIT) with public audits from Least Authority and SlowMist
    • Free to use with no premium tiers
    • Strong hardware wallet support including air-gapped options
    • Excellent multi-chain portfolio view courtesy of the DeBank team
    • Competitive built-in swap aggregator

    Cons

    • EVM-only, so no Solana, Bitcoin, XRP, TRON, Sui, or Cosmos support
    • Mobile app is newer and slightly less polished than the extension
    • UI can feel dense for absolute beginners
    • Swap aggregator routing fee, though small, is still a fee
    • No native fiat on-ramp inside the extension, so you need Coinbase, MoonPay, or a similar service to get in

    Rabby vs MetaMask: The Short Comparison

    The clearest way to think about Rabby is as MetaMask with the defaults set for 2026 instead of 2019. Both are free EVM wallets, both are non-custodial, both support hardware wallets. Where they differ:

    • Transaction safety: Rabby simulates every transaction by default. MetaMask’s simulator exists but is less thorough.
    • Chain switching: Rabby is automatic. MetaMask still asks you to approve every switch.
    • Approvals: Rabby ships an approval manager. MetaMask sends you to a third-party site.
    • License: Rabby is MIT open source. MetaMask is source-available but proprietary.
    • Portfolio view: Rabby uses DeBank data and shows DeFi positions natively. MetaMask’s portfolio view is more limited.
    • Ecosystem lock-in: MetaMask has broader dApp compatibility as the default, though Rabby has closed the gap significantly and now works with 99 percent of major EVM dApps.

    For pure EVM DeFi work in 2026, Rabby is the better daily driver. If you need MetaMask for a specific dApp integration you can run both at the same time without conflicts.

    Who Should Use Rabby?

    Active DeFi users on Ethereum L1 and L2s. The simulation alone justifies the switch.

    Multi-chain EVM traders. Auto chain switching removes real friction if you routinely bounce between Arbitrum, Base, Optimism, Polygon, and BNB Chain.

    Anyone tired of stale approvals. The built-in approval manager is worth the download by itself.

    Not for you if: You are Solana-first or Bitcoin-first. For Solana, see our Phantom Wallet review or Backpack Wallet review. For cold storage across many chains, look at Ledger vs Trezor.

    Final Verdict: 4.6 / 5

    Rabby is the safest, most DeFi-native EVM wallet you can install in 2026. The pre-transaction simulation, approval manager, and auto chain switching collectively solve the three biggest sources of user pain and user loss in the EVM ecosystem. It is free, open source, audited, and backed by a team with a strong track record.

    The only real limitation is that it is EVM-only. If your on-chain life spans Solana, Bitcoin, or Cosmos, you will still need a second wallet. But for the EVM half of your portfolio, Rabby is the wallet to beat, and MetaMask has yet to catch up.

    Visit Rabby Wallet to download the browser extension or mobile app.

    FAQ

    Is Rabby Wallet safe?

    Yes. Rabby is non-custodial, fully open source under MIT, and has been audited by Least Authority (2024, 2025) and SlowMist (2025). Private keys are stored locally and encrypted with a password you set. That said, no wallet can protect you from every mistake, so hardware wallet use is still recommended for large balances.

    Does Rabby support Solana?

    No. Rabby is an EVM-only wallet. For Solana, use Phantom or Backpack.

    Is Rabby free?

    Yes. The wallet is free to download and use with no subscription tier. Rabby earns revenue from a small routing fee (around 0.25 percent) baked into its built-in swap aggregator. You are free to use a different DEX and pay only gas.

    Can I use Rabby with a hardware wallet?

    Yes. Rabby supports Ledger, Trezor, Keystone, GridPlus, imKey, and OneKey. Keystone and Ngrave offer air-gapped signing for maximum security.

    Rabby vs MetaMask, which is better?

    For active DeFi users in 2026, Rabby is the stronger daily driver thanks to its simulation-first design, auto chain switching, and native approval manager. MetaMask still has broader ecosystem defaults. Many users install both.

    Can I import my MetaMask wallet into Rabby?

    Yes. Rabby accepts standard 12 or 24 word seed phrases and private keys, so you can import your existing MetaMask wallet in under a minute. Your assets stay on-chain either way, so both wallets can display the same balances.
    Ethena (ENA) Price Prediction 2026: Can ENA Hit $0.50?

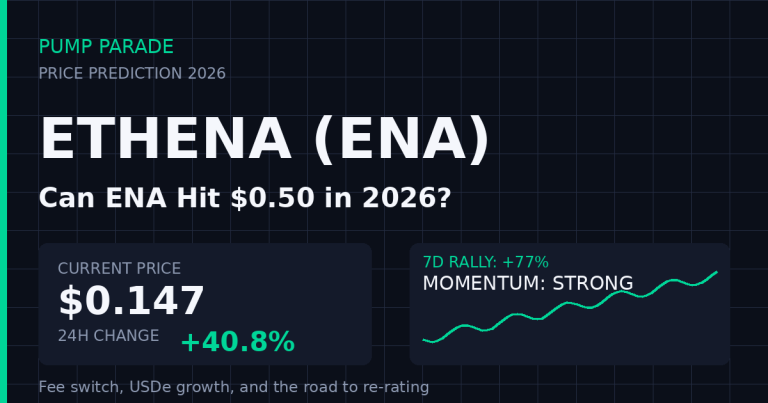
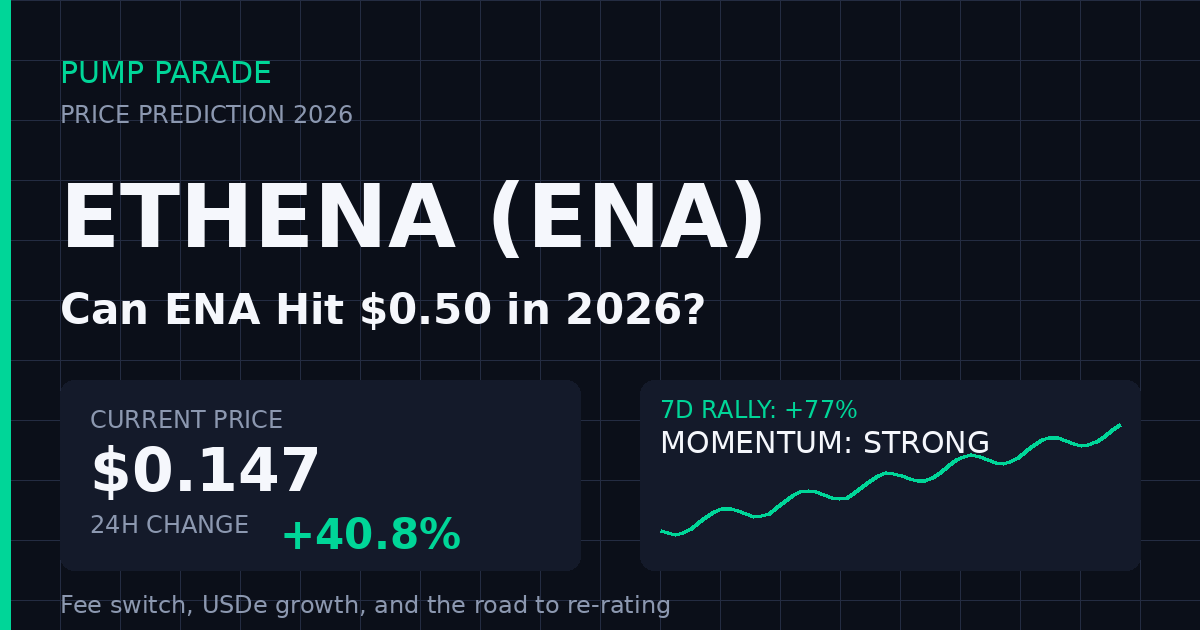
    Ethena (ENA) is trading at $0.147 at time of writing, up 40.8% in the last 24 hours and 77% over the past week after crypto influencer Arthur Hayes publicly called it a “5x bet” and the protocol’s synthetic dollar USDe pushed its total value locked back through the $10 billion mark. It is the single most-searched token on CoinGecko right now, and for good reason: the fee-switch vote that could redirect protocol revenue to ENA stakers is finally back on the calendar.

    This Ethena ENA price prediction 2026 breaks down what is actually driving the rally, where realistic 30-day, 6-month and long-term targets sit, and the three things that would flip the trade from bullish to broken. We use Birdeye and CoinGecko market data at time of writing, our AI model output, and analyst targets from Coinpedia, Standard Chartered peers, and DeFi researchers.

    Key Takeaways

    • ENA trades at $0.147, +40.8% in 24h and +77% in 7 days, on a fresh USDe TVL breakout above $10 billion.
    • The fee switch is the primary re-rating catalyst. If activated in Q4 2026, ENA moves from governance token to cash-flow-linked DeFi asset.
    • Base case: $0.28 by year-end 2026 if USDe holds above $10B and fee-switch discussions advance. Bear case $0.11. Bull case $0.45.
    • Biggest risks: the September 1 token unlock of 275M ENA (1.8% of supply), funding-rate collapse, and regulatory pressure on synthetic dollars.
    • ENA is 90% below its April 2024 all-time high of $1.52, giving it asymmetric upside but also proof that speculative rallies can unwind fast.
    Ethena (ENA) price prediction 2026 hero graphic - current price $0.147, 40.8% 24h rally, fee switch catalyst

    Where Ethena (ENA) Stands Today

    Before the story, the numbers. Here is the on-chain snapshot at time of writing, sourced from CoinGecko and Birdeye:

    Metric Value
    Price $0.147
    24h change +40.8%
    7d change +77.2%
    30d change +63.7%
    Market cap $1.46B
    Fully diluted valuation $2.24B
    24h volume $1.14B
    Market cap rank #58
    All-time high $1.52 (April 2024)
    % from ATH -90.2%
    Circulating supply 9.83B / 15B

    Two numbers matter more than the rest. First, volume of $1.14 billion on a $1.46B market cap tells you this is not a quiet drift higher, it is a real repricing with real capital rotating in. Second, the token is still 90% off its April 2024 peak. That gap is either an opportunity or a warning, and it depends entirely on whether the fundamentals below justify the rally.

    Why is Ethena rallying right now?

    Three things fired at once. USDe, Ethena’s synthetic dollar, reclaimed the $10 billion supply mark in mid-August 2026 after months of range-bound TVL. Cryptonews and Artemis analytics data both flagged the breakout, and it triggered a wave of coverage arguing the fee switch discussion is no longer academic. Arthur Hayes, co-founder of BitMEX and a long-time Ethena supporter, published a piece calling ENA a “5x bet” if the fee switch activates. Open interest on ENA perpetuals climbed above $550 million, per Coinpedia. When narrative, capital, and derivatives leverage all align, you get moves like the one we are seeing.

    In plain terms, traders are front-running one specific event: the community vote to turn on the fee switch, which would redirect a portion of protocol revenue to ENA stakers. Ethena currently generates roughly $57 million in monthly protocol revenue from USDe, per Tokenomics.com. Even a partial pass-through would materially change how the token is valued.

    What is the bull case for ENA in 2026?

    Fee switch activation

    This is the whole ballgame. Right now ENA is a governance token, meaning holders vote but do not receive protocol revenue. The Ethena docs and multiple analyst pieces confirm the fee switch would convert ENA into a revenue-linked asset. If Ethena continues generating $50M+ in monthly revenue and 30-50% flows to stakers, ENA starts trading on a multiple of earnings, not a multiple of hope. That is a structural re-rating, not a narrative pump.

    USDe growth and iUSDe institutional access

    USDe is now the third-largest synthetic dollar behind USDT and USDC, per Artemis data. The launch of iUSDe, a compliant wrapper aimed at regulated TradFi capital, opened a new demand pool that Ethena did not have in 2024. Franklin Templeton and F-Prime Capital have both backed the protocol, and Spark integrated Ethena into its liquidity layer. Each additional distribution channel means more USDe minted, more funding-rate yield captured, and more revenue for the token to eventually claim.

    Converge blockchain launch

    Ethena is building Converge, an EVM-compatible chain focused on institutional settlement of tokenized real-world assets. ENA is slated to serve as the staking asset for the Converge Validator Network. If Converge ships in late 2026 or early 2027 with meaningful early adoption, ENA gains a second utility layer beyond governance and fee sharing.

    What is the bear case for ENA?

    The token unlock overhang

    ENA has a brutal supply schedule. Approximately 5.5 billion tokens, or 36.7% of total supply, remain locked as of August 2026. The next scheduled unlock hits September 1, 2026: 275 million tokens, or 1.8% of total supply, per Tokenomist. Insider and early-investor unlocks continue monthly through April 2028. Every rally has to absorb persistent sell pressure from this schedule, and history says that rarely goes smoothly.

    Funding rate collapse

    USDe’s yield engine depends on positive perpetual funding rates. When traders are long, shorts (which Ethena runs) get paid. In bearish or sideways markets, funding compresses or flips negative, revenue drops, and the whole flywheel slows. A 3-4 week funding-rate slump could pull USDe TVL back below $7B and remove the primary bull-case pillar.

    Regulatory pressure on synthetic dollars

    US and EU regulators have flagged yield-bearing dollar-pegged assets as a category worth watching. If either jurisdiction reclassifies USDe as a security or restricts its distribution, Ethena’s addressable market shrinks fast. This is the tail risk that would not just cap ENA, it could rerate it lower permanently.

    What is the Ethena price prediction for 2026?

    Ethena (ENA) price prediction 2026 targets table - bear $0.11, base $0.28, bull $0.45 by 6 months

    Below are our AI-model outputs, cross-checked against Coinpedia (2026 range of $0.40 to $1.50), PricePrediction.net (min $0.23, max $0.33), and DigitalCoinPrice.

    Timeframe Bear Base Bull
    30 days (Sep 2026) $0.09 $0.18 $0.28
    6 months (Feb 2027) $0.11 $0.28 $0.45
    2027-2028 $0.15 $0.55 $1.20

    30-day outlook

    The immediate hurdle is the September 1 unlock. A base case sees ENA pulling back to $0.13-$0.15 to absorb the supply, then reclaiming $0.18 into month-end if BTC holds above $75K. The bull case requires the fee-switch proposal to formally enter a vote, which would justify a run at $0.28. The bear case is a broader market pullback plus heavy unlock selling dragging ENA back toward $0.09.

    6-month outlook

    By February 2027, the story is either confirmed or dead. If USDe supply is above $12B and fee-switch mechanics have been at least partially implemented, $0.28 is the base and $0.45 is achievable. If TVL slid back under $7B and the fee switch is still stuck in governance limbo, ENA likely retests $0.11 support.

    Long-term (2027-2028)

    The bull case requires USDe to become a top-3 dollar-pegged asset globally, sustained fee-switch revenue distribution, and Converge shipping with real usage. In that world, $0.55 base and $1.20 bull are plausible. The bear case, with continued unlock dilution and a fading synthetic-dollar narrative, keeps ENA capped near $0.15.

    How ENA Compares to Aave (AAVE)

    The closest fundamental peer for ENA is Aave (AAVE), another DeFi bluechip with real revenue and a token that has already been through the fee-switch debate. Here is how they stack up today:

    Metric ENA AAVE
    Price $0.147 $111.52
    Market cap $1.46B $1.68B
    Fully diluted valuation $2.24B $1.79B
    24h change +40.8% +15.0%
    Revenue capture to token Not active (pending) Active (safety module, buybacks)
    Core product USDe synthetic dollar Lending protocol
    Circulating / total 65.5% ~94%
    Regulatory risk Elevated Moderate

    The takeaway: AAVE already trades as a revenue-linked token, and its valuation reflects that. ENA does not, which is why it looks cheap on paper but carries the risk that the fee switch never actually turns on. That is the trade in one sentence.

    What Would Change Our View

    Three specific triggers would move us from the base case to either the bull or bear case:

    1. Fee-switch vote scheduled: A formal on-chain vote with an implementation date would push our 6-month base from $0.28 to $0.40. This is the single biggest re-rating catalyst.
    2. USDe TVL below $7B for two straight weeks: Would flip us to the bear case. It would signal the yield engine is failing or capital is rotating to competitor products like sDAI or BlackRock’s BUIDL.
    3. Enforcement action from a major regulator: Any US, EU, or UK action targeting USDe distribution would cap ENA near current levels and likely push it lower regardless of on-chain metrics.

    Frequently Asked Questions

    Will Ethena (ENA) reach $1 in 2026?

    Reaching $1 in 2026 would require ENA to rally roughly 580% from current levels. That is possible if the fee switch activates, USDe supply grows past $15B, and broader crypto markets stay bullish. Our base case sees $0.28 by end of 2026, with $1 more realistic on a 2027-2028 timeframe if catalysts stack up as bulls expect.

    Is Ethena (ENA) a good investment?

    ENA is a high-risk, catalyst-driven DeFi bet. The upside case rests on the fee switch and USDe growth. The downside case rests on token unlocks and regulatory pressure. It is not a passive hold, and it should not be a large allocation. Investors who can monitor governance, TVL, and funding rates weekly are in a better position to trade it.

    What is the Ethena fee switch?

    The fee switch is a proposed mechanism to redirect a portion of Ethena’s protocol revenue, currently around $57M per month, to ENA stakers. Once activated, ENA moves from a governance-only token to a cash-flow-linked asset. It is the single most important pending catalyst for ENA in 2026.

    How does USDe generate yield?

    USDe uses a delta-neutral strategy. Ethena holds spot crypto assets like ETH and shorts an equal amount in perpetual futures. When funding rates are positive, the short side collects funding payments. Those payments, plus staked ETH yield, are distributed to sUSDe holders. When funding rates flip negative, yields compress.

    When is the next ENA token unlock?

    The next scheduled ENA unlock is September 1, 2026, releasing 275 million tokens or about 1.8% of total supply. Unlocks continue monthly through April 2028, with 5.5 billion tokens still locked as of August 2026.

    Is USDe safe?

    USDe carries risks that traditional stablecoins do not: negative funding rates, exchange counterparty risk on the short positions, and reliance on smart-contract security. Ethena has passed audits and maintains proof-of-reserves with Kraken Custody, but users should size positions accordingly.

    The Honest Take

    ENA is one of the more interesting risk-reward setups in DeFi right now, and also one of the easier ones to lose money on. The fee-switch catalyst is real, USDe growth is real, and the institutional distribution story is real. So is the 5.5 billion tokens still unlocking, the 90% drawdown from ATH, and the dependence on funding rates that can collapse in a bad week.

    Our base case is $0.28 by year-end 2026, with the fee switch as the swing factor. If you are trading this, watch USDe TVL and the governance forum, not just the chart. If you are holding, size it like the venture bet it is, not the bluechip it is not. For a related deep dive on liquid staking and yield-bearing assets, see our comparison of Marinade vs Lido, and for macro context on where Ethereum goes next, since ENA is built on ETH and rides its coattails.

    Disclaimer: This article is for informational and educational purposes only and should not be construed as financial, investment, or trading advice. Cryptocurrency markets are highly volatile, and past performance does not guarantee future results. The price predictions and analyses presented here are based on AI models, technical indicators, and available data at the time of writing, they are not guarantees. Always conduct your own research (DYOR) and consult with a qualified financial advisor before making any investment decisions. Pump Parade and its authors do not assume liability for financial losses incurred based on information provided in this article.

    Marinade vs Lido: Best Liquid Staking Protocol 2026

    0

    Liquid staking is the biggest, quietest business in crypto. It turns idle proof-of-stake tokens into productive collateral, and the two undisputed leaders of that market sit on different chains. Lido rules Ethereum. Marinade rules Solana. If you hold ETH or SOL and want yield without giving up liquidity, you will almost certainly end up in one of these two products. So which one actually deserves your deposit in 2026?

    This review puts them side by side: how each protocol works, what the fees really cost, what yield you can expect to net out, how safe they are, and which one wins for which type of user. Data is from DeFiLlama, project docs, and public dashboards as of August 2026.

    Quick Verdict

    If you hold ETH: Lido is still the default. It has the deepest liquidity, the widest DeFi integrations, and stETH is basically ETH-with-a-yield across every major money market. The 10 percent fee is not the cheapest, but the ecosystem depth is worth it for most users.

    If you hold SOL: Marinade is the better pick. It pays substantially higher gross yield than any Solana LST alternative once you factor in MEV, its fee is 6 percent versus Lido's 10, and its Marinade Native option lets you stake directly to 130+ validators with zero protocol fee.

    Rating: Lido 4.4/5 for ETH users. Marinade 4.5/5 for SOL users. They are not really substitutes because they operate on different chains, but the frameworks for judging them are the same, and both earn their leadership.

    What Liquid Staking Actually Is

    Traditional staking locks your tokens. You get yield, but you cannot move, trade, or use them as collateral until you unstake, and unstaking has a delay (about two days on Solana, up to several days on Ethereum). Liquid staking removes that tradeoff. You deposit ETH or SOL, the protocol stakes it for you across a set of validators, and you receive a receipt token (stETH or mSOL) that represents your position. That receipt token accrues yield in the background and is fully liquid: you can sell it, use it as collateral in lending markets, or provide liquidity with it in DEXes.

    The catch: you are trusting the protocol's smart contracts, its validator set, and, in some designs, its governance. That is why the choice of protocol matters as much as the choice of asset.

    Marinade Finance Solana liquid staking dashboard
    Marinade Finance homepage. Source: marinade.finance

    Marinade Overview

    Marinade launched in August 2021 as the first liquid staking protocol on Solana. Today it offers two products: Marinade Liquid, the original mSOL token, and Marinade Native, a non-custodial native staking product introduced in 2023 that stakes directly to validators without wrapping the position in an LST token. Combined TVL is around $870 million as of August 2026, split roughly $620M in the liquid pool and $250M in native, according to DeFiLlama.

    Marinade's edge on Solana is its validator selection algorithm. It automatically stakes across 130+ vetted validators, prioritizing performance, decentralization, and MEV revenue capture. That routing is why Marinade's realized APY consistently beats simple staking with a single validator.

    Governance token: MNDE. It is used for validator delegation strategy votes and protocol parameter changes. It is not required to use the product.

    Lido Finance Ethereum stETH liquid staking
    Lido Finance homepage. Source: lido.fi

    Lido Overview

    Lido launched in December 2020 and has been the dominant Ethereum liquid staking protocol ever since. It currently holds around $21.9 billion in TVL, roughly 50 percent of all ETH liquid staking, and stETH is one of the most widely integrated assets in DeFi. You can supply it on Aave, use it on Curve, wrap it into wstETH for cross-chain deployment, or hold it in almost any Ethereum wallet.

    Lido uses a curated set of professional node operators, currently around 40, selected by the Lido DAO. That concentration is Lido's biggest ongoing criticism (see the Security section below), but it is also why the operational track record is strong: no slashing events large enough to materially dent stETH value.

    Governance token: LDO. It controls the node operator set, fee changes, and treasury spending. Like MNDE, it is optional for users.

    Fees and Real Yield

    Fees on liquid staking sound small until you compound them over years. Marinade takes 6 percent of staking rewards. Lido takes 10 percent, split evenly between node operators and the DAO treasury. Both fees are already deducted from the APY you see on their dashboards, but the raw number matters because it directly determines how much of the underlying chain's issuance flows to you.

    Here is what that looks like today:

    • Marinade Liquid (mSOL): ~7.0 percent net APY
    • Marinade Native: ~7.5 percent net APY (0 percent protocol fee, only validator commissions)
    • Lido stETH: ~2.5 percent net APY

    The APY gap is mostly a function of the underlying chain, not the protocol. Solana's inflation schedule and MEV yield are higher than Ethereum's. But even chain-adjusted, Marinade's lower fee gives it a meaningful edge over what Lido would earn on a per-dollar basis.

    Comparison Table

    Marinade vs Lido comparison table 2026
    Marinade vs Lido at a glance, August 2026.

    Pros and Cons

    Marinade

    Pros:

    • Highest realized APY of any major Solana LST, thanks to validator selection and MEV capture
    • Lower fee (6 percent) than every direct competitor
    • Marinade Native offers 0 percent protocol fee for users who do not need the mSOL receipt token
    • Broad DeFi integrations across Kamino, marginfi, Drift, Orca, and Raydium
    • Non-custodial by design; you keep control of your validator delegation in Native mode

    Cons:

    • mSOL trades at a small discount to SOL during volatile periods, sometimes 20 to 50 basis points
    • Solana LST market is more fragmented, so mSOL liquidity is thinner than stETH
    • Jito's JitoSOL has taken meaningful market share and is a real competitor for validator-level MEV

    Lido

    Pros:

    • Deepest liquidity of any staking derivative in crypto; stETH is a de-facto ETH equivalent in DeFi
    • Integrated in nearly every major Ethereum protocol: Aave, Compound, Curve, Balancer, Morpho
    • wstETH wrapper enables clean use on L2s (Arbitrum, Optimism, Base) and other rollups
    • Long operational track record with no material slashing losses
    • Institutional-grade infrastructure and audit history

    Cons:

    • 10 percent fee is the highest among major ETH LSTs (Rocket Pool is 14 percent but distributes differently, Frax and others are lower)
    • Node operator concentration; the DAO controls a small, curated set which raises centralization concerns
    • stETH depeg risk during severe market stress (see May 2022 for a historical example)

    Security and Trust

    Marinade has been live since August 2021 with no exploits. It is audited by Kudelski, Ackee, and Neodyme, three respected Solana-specialized firms. Marinade Native, launched in 2023, does not custody your SOL at all; the protocol just routes your stake to validators, which meaningfully reduces smart contract surface area. Governance is decentralized through the MNDE token.

    Lido is one of the most-audited protocols in DeFi, with reviews by Sigma Prime, MixBytes, StateMind, Certora, and Oxorio. It has been live since late 2020 with no material exploits on the core staking contract. The primary security concern is not smart contract risk but validator-set centralization: because the DAO chooses node operators, a governance capture attack could theoretically direct staking behavior. This has been the subject of intense community debate for years, and Lido has taken steps to add DVT (distributed validator technology) to reduce single-operator risk.

    User Experience

    Marinade's app is clean and simple. Connect a Phantom, Backpack, or Solflare wallet, deposit SOL, receive mSOL. Or choose Marinade Native for validator delegation without a wrapper token. Unstaking is either delayed (about two days to redeem SOL) or instant via a small fee that routes through the mSOL/SOL pool. Mobile support is fine through wallet browsers.

    Lido's app is minimal, arguably the most minimal in DeFi. Connect an EVM wallet (MetaMask, Rabby, Ledger), deposit ETH, receive stETH. The wstETH wrapping flow is one extra click. Unstaking has a queue that has been running under a week in normal conditions but can extend during high withdrawal periods. Mobile support is excellent via WalletConnect.

    Both are functionally boring in the best way. Deposits and withdrawals are the whole product.

    Which Chain, Which Protocol

    The framing you should use is not "Marinade or Lido" but "what am I optimizing for."

    Use Marinade if: you hold SOL and want yield that composes with Solana DeFi. If you do not need the receipt token and just want to stake, use Marinade Native for the zero-fee experience.

    Use Lido if: you hold ETH and want the LST with the deepest liquidity and broadest integration set. If the 10 percent fee bothers you and you can tolerate a smaller network of node operators, look at Rocket Pool or Frax as alternatives.

    Use both if: you diversify across ETH and SOL and want the market-leading LST on each chain. That is actually the most common answer among sophisticated on-chain users.

    Verdict

    Marinade wins on its home turf because Solana's economics favor it and because it has quietly kept fees below competitors while adding a genuinely differentiated Native product. Lido wins on Ethereum because ecosystem depth is the whole game at that scale, and no one is close on integrations or liquidity. Neither protocol is trying to eat the other's market, and that is why both are still the answer in their respective chains four to six years after launch.

    If you are picking one to start with today, follow the token you already hold. Do not bridge to chase yield. The extra one to two percent APY difference between chains does not compensate for bridge risk and slippage. Stake where your capital already lives.

    FAQ

    Is mSOL always worth the same as SOL?

    No. mSOL accrues yield, so 1 mSOL is worth slightly more than 1 SOL and that ratio grows over time. In stressed markets mSOL can briefly trade at a discount to its underlying value in secondary markets, but the redemption ratio through Marinade itself is always fair.

    Is stETH the same as ETH?

    Not exactly. stETH is a receipt token that represents staked ETH plus accrued rewards. Its price tracks ETH closely, and it is redeemable 1:1 for ETH through Lido's withdrawal queue, but in secondary markets it can trade at a small discount. Most DeFi protocols price stETH at its redemption value.

    Can I lose money staking with these protocols?

    Yes, in a few scenarios: smart contract exploit (low probability but nonzero), severe validator slashing (mitigated by curation and diversification), or secondary-market depeg during a crisis. For everyday holders the risk profile is comparable to holding the underlying asset.

    Why is Solana's staking APY so much higher than Ethereum's?

    Solana has higher inflation and captures more MEV revenue relative to its staked supply. That is a chain-level design choice, not a protocol advantage. Ethereum's lower yield reflects a much larger and more mature staked base.

    Do I need to hold MNDE or LDO to use these products?

    No. They are governance tokens, not required for staking. You only need them if you want to vote on protocol decisions.

    Jupiter (JUP) Price Prediction 2026: Can JUP Hit $0.50?

    Jupiter (JUP) trades at $0.1886 this morning, up 13.16% in the last 24 hours as Solana DeFi volume rotates back into ecosystem tokens. The jupiter price prediction 2026 question has stakes now that the token sits 88% below its early-2024 highs, yet the underlying business is stronger than it has ever been.

    Jupiter Lend, the protocol’s lending arm launched in 2025, is closing in on $800 million in total value locked. The team’s Net-Zero Emissions proposal passed earlier this year, meaning no more scheduled unlocks from team, investors, or Mercurial vesting. Half of protocol fees now go straight into open-market JUP buybacks. The setup is bullish on paper. The market has not agreed yet.

    This piece walks through where JUP stands today, the case for a run at $0.50, the case against it, timeframe targets, how Jupiter compares to Raydium, and the questions traders actually ask on Google.

    Key Takeaways

    • JUP trades at $0.1886 (Aug 20, 2026), up 13.16% in 24 hours and roughly 88% below its 2024 peak.
    • Jupiter Lend TVL is approaching $800 million, and 24-hour unique wallets on Solana DEX venues jumped 24% as capital rotates back.
    • The Net-Zero Emissions vote ended new team and investor unlocks, tightening the free float.
    • Protocol fees fund an ongoing 50% buyback; a governance proposal would raise the share and add a burn.
    • Base case 2026 targets cluster around $0.22 to $0.35. Bull cases stretch to $0.55 to $1.20 if Jupiter Lend crosses $2 billion TVL and Solana volume holds.
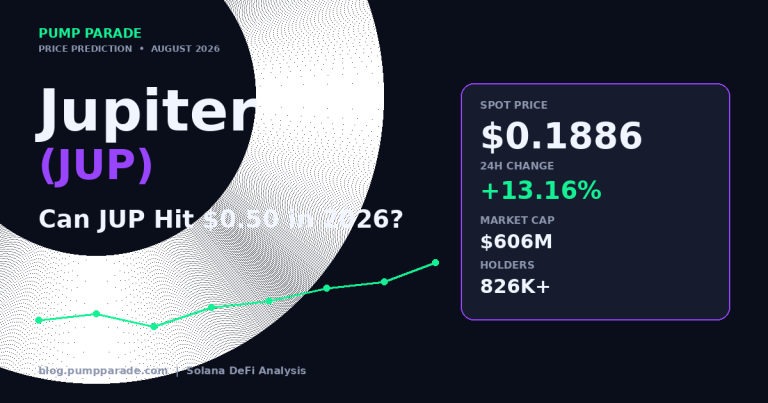
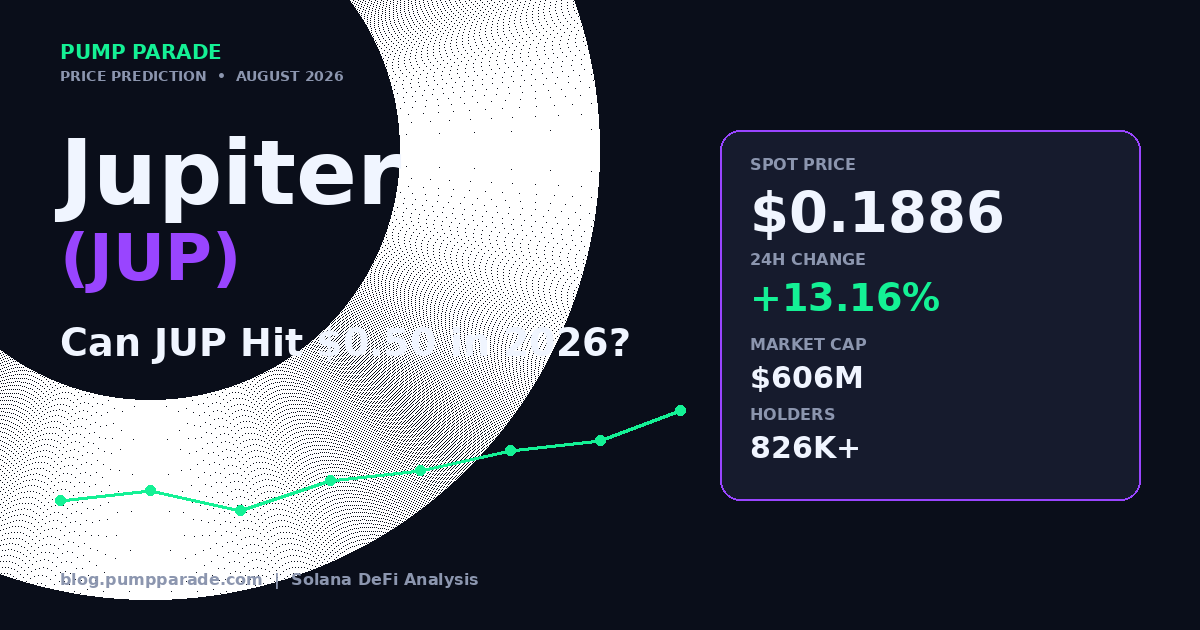
    Jupiter (JUP) price prediction 2026 hero graphic, current price $0.1886, Solana DeFi buyback catalyst

    Where Jupiter (JUP) Stands Today

    Jupiter is the largest decentralized exchange aggregator on Solana and, by some measures, the largest DeFi application on the network by daily active users. The JUP token launched in January 2024 and peaked near $2 that same year before spending most of 2025 grinding lower under a combination of unlock pressure, a soft Solana market, and skepticism about whether the protocol’s buybacks could offset selling.

    Here is the current snapshot.

    Metric Value
    Price $0.1886
    24h change +13.16%
    Market cap $606M
    Fully diluted valuation $1.29B
    Circulating supply 3.21B JUP
    Max supply 6.86B JUP
    Holders 826,000+
    All-time high $2.00 (Jan 2024)
    % from ATH -90.6%

    The gap between market cap and FDV is smaller than it was six months ago, which reflects the point of the Net-Zero Emissions decision. Roughly 47% of max supply is already in circulation, and future dilution is now capped by governance rather than by the original vesting calendar.

    Why is Jupiter (JUP) Rising Right Now?

    Three things are lining up at the same time.

    First, Solana DeFi is seeing renewed volume after a summer lull. Solana clocked over $6.9 billion in 24-hour wrapped SOL volume across Birdeye-tracked venues, and Jupiter is where a large share of that flow gets routed. When aggregator volume rises, the buyback machine works harder.

    Second, the community narrative around Jupiter Lend crossing $800 million in TVL has traders comparing it to Aave’s early growth curve, when protocol usage translated into token repricing. For readers tracking DeFi lending broadly, our Aave (AAVE) price prediction lays out how a similar rerating played out on Ethereum.

    Third, sentiment on Solana itself has stabilized after weeks of chop. Our take on where the base layer heads next lives in the Solana (SOL) price prediction, and JUP tends to trade with a beta of roughly 1.5 to SOL when the ecosystem is in a bid.

    The Bull Case for JUP

    Jupiter Lend keeps compounding

    The lending product is the single biggest reason to be constructive on JUP right now. TVL near $800 million puts it in the same conversation as mid-size Ethereum lending protocols despite being roughly a year old. Every dollar of lending activity generates protocol revenue, and half of that revenue currently flows into JUP buybacks. A move from $800 million to $2 billion in TVL, which is plausible if Solana perps volume holds, would meaningfully shift the buyback per token math.

    Net-Zero Emissions removes the biggest overhang

    The Jupiter Goes Green DAO vote in early 2026 concluded team, Mercurial stakeholder, and Jupuary allocation emissions early. Circulating supply is not growing on a scheduled basis anymore. In a market where most L1 tokens still deal with structural sell pressure, that alone is a differentiator. Analysts at tokenomist.ai flagged that roughly 30% of circulating JUP is now staked, further tightening float.

    Buyback expansion and burn on the ballot

    A live governance proposal would raise the fee share dedicated to buybacks above 50% and pair it with a permanent burn. If it passes and volume holds, JUP moves from a soft-capped supply story to an actively deflationary one. That is the setup that has historically preceded aggressive rerating in DeFi tokens.

    The Bear Case for JUP

    The 2025 buyback did not save the price

    Jupiter spent roughly $70 million buying back JUP through 2025 and the token still lost value. Anatoly Yakovenko, Solana’s co-founder, publicly questioned the strategy after the 89% drawdown, arguing that the capital may have been better deployed elsewhere. Buybacks are not a magic backstop when broader market conditions are hostile.

    Competition inside Solana is heating up

    Meteora, Orca, and Raydium all want the same volume Jupiter aggregates. Our Orca vs Meteora comparison lays out how differentiated each is on the pool side, and both have their own token flywheels. Jupiter’s edge is routing, not liquidity, and if native DEX UX improves it could erode the aggregator premium.

    Macro reversal could stall the rotation

    The rotation into Solana DeFi that is helping JUP today depends on a benign risk-on tape. A hawkish Fed pivot, a sudden BTC drawdown, or a spike in equity volatility would drain flow out of long-tail DeFi tokens first. JUP historically shows a beta above 2.0 to broader crypto risk in stress conditions.

    Jupiter Price Prediction 2026: Targets by Timeframe

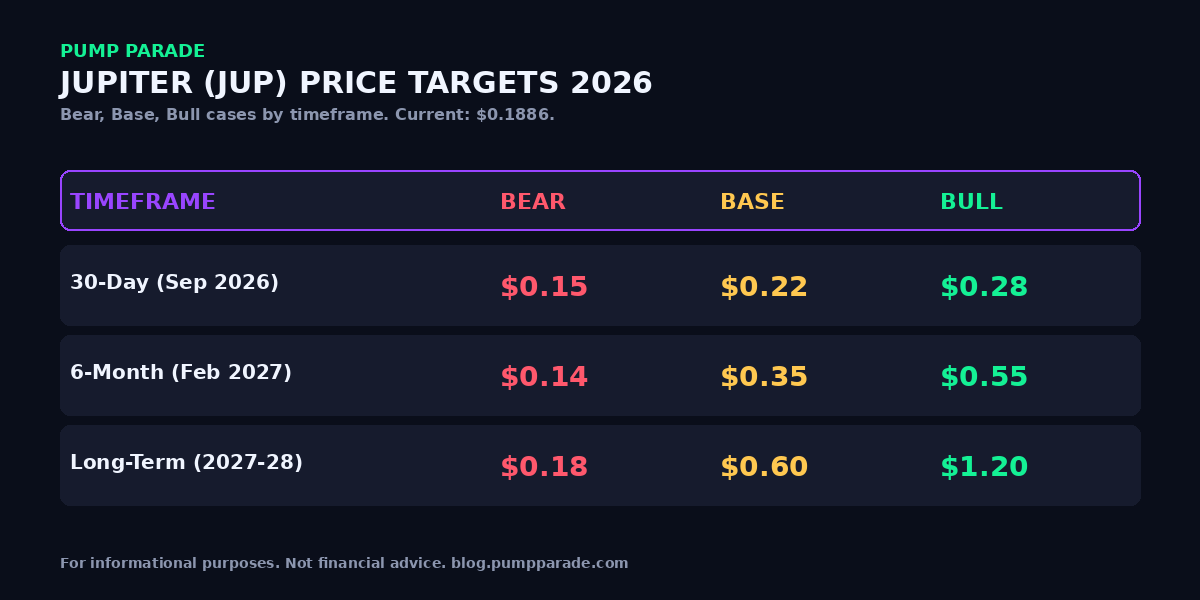
    Jupiter (JUP) price prediction 2026 targets table, bear $0.14, base $0.35, bull $1.20

    Here is how we frame the setup by timeframe. These are conditional ranges, not guarantees.

    Timeframe Bear Base Bull
    30 days (through Sep 2026) $0.15 $0.22 $0.28
    6 months (through Feb 2027) $0.14 $0.35 $0.55
    Long-term (2027 to 2028) $0.18 $0.60 $1.20

    30-day outlook

    The 13% single-day pop happened on rising unique wallet counts and outsized DEX volume. Follow-through into the $0.22 to $0.28 zone is realistic if Solana keeps a bid. Failure to hold $0.17 would open $0.15 quickly given how thin liquidity is beyond the top book.

    6-month outlook

    The Feb 2027 window is where the Jupiter Lend TVL trajectory and the buyback expansion vote start showing up in the tape. Our base case of $0.35 assumes lending TVL grows to $1.2 to $1.5 billion and BTC holds current ranges. Bull to $0.55 needs the buyback vote to pass and Solana DeFi to keep leading the rotation. Analysts at Changelly model roughly $0.60 to $4.00 for full-year 2026, so our range sits within the middle of external forecasts.

    Long-term outlook (2027 to 2028)

    The long-term picture depends on whether Jupiter successfully expands beyond aggregation into a full DeFi superapp. A base case of $0.60 puts JUP at roughly 3x current, which is unremarkable given the sector’s history. The $1.20 bull case requires Jupiter Lend to become a top-five DeFi lender by TVL and requires the burn proposal to pass. Coinpedia’s 2027 range of $1.70 to $5.00 sits above ours because they assume a broader alt cycle we are not underwriting.

    How Does Jupiter Compare to Raydium?

    The two are the most-mentioned Solana DEX tokens in trader chat and they serve different roles. Jupiter aggregates. Raydium provides native liquidity, especially for launches. Here is the side-by-side.

    Metric Jupiter (JUP) Raydium (RAY)
    Primary role DEX aggregator + Lend + Perps AMM + launchpad liquidity
    Market cap ~$606M ~$450M
    Buyback mechanism 50% of fees Fee capture varies by pool
    Unlock overhang None (Net-Zero passed) Fully unlocked
    Product expansion Lend, Perps, Trigger orders LaunchLab, CLMM pools
    User traction 826k+ holders Meme-cycle dependent

    For Solana bulls, both belong in a basket. JUP has the better token structure right now. RAY has cleaner exposure to memecoin launch cycles when they return.

    What Would Change Our View?

    Three concrete triggers would move us off the base case.

    Bullish trigger: Jupiter Lend TVL crosses $2 billion and the buyback expansion proposal passes with a burn attached. That combination pulls our 6-month base toward the current bull, roughly $0.55.

    Bearish trigger: Solana 24-hour DEX volume falls below $3 billion for two consecutive weeks. That signals the rotation is over and would pull our 30-day range toward $0.14.

    Structural trigger: A credible aggregator competitor gains meaningful market share, or Solana’s native DEXes internalize routing. Either scenario compresses the aggregator premium and forces us to rebuild the model from lower base assumptions.

    Frequently Asked Questions

    Will Jupiter (JUP) reach $1 in 2026?

    Not in our base case. Getting JUP back to $1 from $0.19 requires roughly a 5x move, which needs both Solana leading the market and Jupiter Lend crossing $2 billion in TVL. Our long-term (2027 to 2028) bull case reaches $1.20, but a 2026 print at $1 would require exceptional conditions.

    Is Jupiter (JUP) a good investment in 2026?

    The fundamentals are the strongest they have been. Zero unlocks, growing buybacks, and a lending product with real traction argue for a rerating over 12 to 18 months. The setup fits a patient buyer who can size for volatility. It does not fit a trader looking for a quick move without a clear catalyst window.

    What is the Jupiter price prediction for 2027?

    Our base case for 2027 sits at roughly $0.60, driven by continued Jupiter Lend growth and the buyback compounding. The bull case runs to $1.20 if the burn proposal passes and Solana DeFi holds share against competing L1s. Other analysts, notably Coinpedia, model $1.70 to $5.00 for 2027, but that assumes a full alt cycle.

    Why is Jupiter (JUP) price rising today?

    The 13.16% move is a combination of Solana DeFi rotation, rising Jupiter Lend TVL headlines, and a 24% jump in unique wallet activity on Solana DEXes over 24 hours. When aggregator volume rises, fee-based buybacks intensify, which reflexively supports the token.

    How does the JUP buyback program work?

    Roughly 50% of Jupiter’s protocol fees are routed to open-market JUP purchases. The bought tokens are held or reallocated per DAO vote. The mechanism converts platform usage into direct spot demand, but its impact is a function of volume: quiet weeks generate less buyback pressure and rarely offset broader market weakness.

    What are the biggest risks to holding JUP?

    The largest risks are a macro reversal that drains Solana DeFi, aggregator competition eating into routing volume, and the buyback program continuing to disappoint if fee revenue slows. A regulatory action targeting Solana DeFi at large would also hit JUP disproportionately given its concentration in the ecosystem.

    The Honest Take

    Jupiter looks like a token whose story finally matches its price setup. Zero unlocks, an ongoing buyback, a live governance push to add a burn, and a lending product growing quickly are all bullish structural inputs. What is missing is a market that rewards fundamentals in real time. Right now that market is Solana DeFi, but only when SOL itself is in a bid.

    A base case run at $0.22 to $0.35 into early 2027 is defensible on current data. The $0.50 print in our headline is not a promise. It is the level where the base and bull cases converge if the buyback vote passes and Jupiter Lend keeps compounding. Traders should size accordingly and watch the two triggers above: Jupiter Lend TVL and Solana DEX volume. Both are visible on-chain in near real time.

    For readers who prefer a broader Solana DEX view before making a call, our Orca vs Meteora comparison walks through the native venues Jupiter aggregates. External data points worth bookmarking include the Tokenomist buyback tracker for real-time buy pressure and CoinMarketCap for volume across CEX venues.

    Disclaimer: This article is for informational and educational purposes only and should not be construed as financial, investment, or trading advice. Cryptocurrency markets are highly volatile, and past performance does not guarantee future results. The price predictions and analyses presented here are based on AI models, technical indicators, and available data at the time of writing, they are not guarantees. Always conduct your own research (DYOR) and consult with a qualified financial advisor before making any investment decisions. Pump Parade and its authors do not assume liability for financial losses incurred based on information provided in this article.

    Hedera (HBAR) Price Prediction 2026: Can HBAR Hit $0.20?

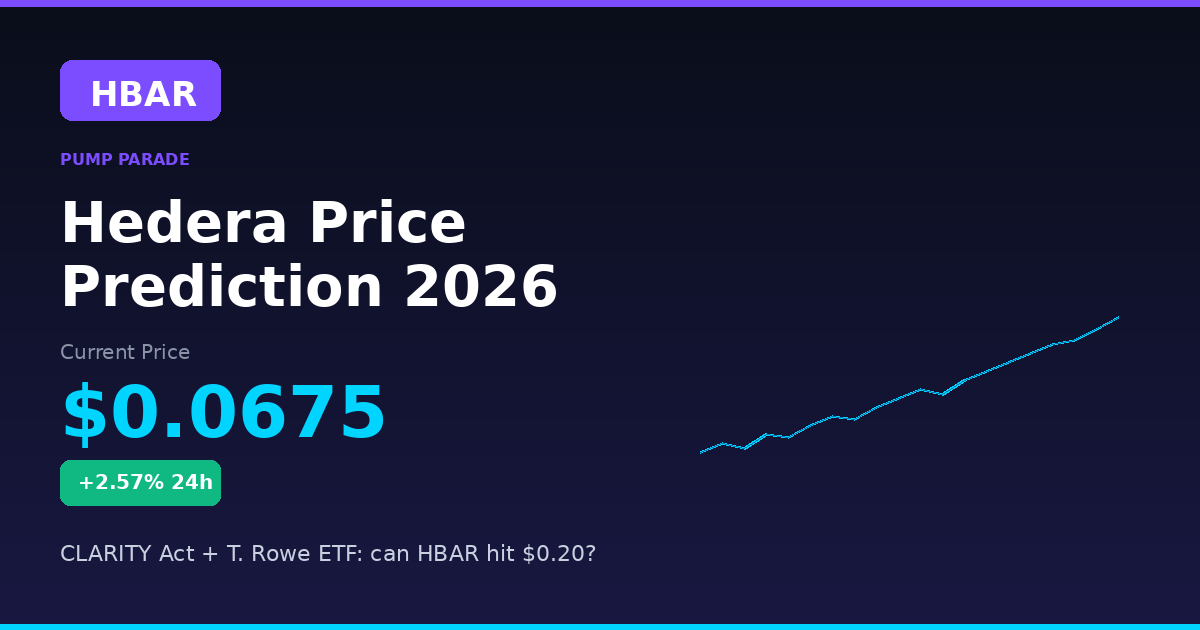
    Hedera (HBAR) is trading at $0.0675, up 2.57% over the last 24 hours and still sitting roughly 88% below its 2021 all-time high. The network just posted a record 346,943 daily transactions on August 12, T. Rowe Price added HBAR to an actively managed crypto ETF, and the CLARITY Act is inching toward a Senate floor vote. If you searched for a Hedera price prediction 2026, you are trying to answer one question: does any of that add up to a real move, or is this another quarter of the same enterprise story we have heard for years?

    This article works the numbers. We pull current market data from Binance, compare analyst targets from Cryptopolitan, Changelly and Coinpedia, stress test the bull case against the bear case, and give you 30-day, 6-month, and long-term price ranges you can actually track. No hopium, no shilling, and a clear list of what would change our view.

    Key Takeaways

    • HBAR trades at $0.0675, up 2.57% in 24 hours, still 88% below its September 2021 all-time high of $0.5701.
    • The base case for a Hedera price prediction 2026 clusters around $0.10 to $0.20, with analyst targets ranging from $0.18 (Cryptopolitan) to $0.35 (Coinpedia bull case).
    • Three catalysts matter: the CLARITY Act, spot HBAR ETF flows via T. Rowe Price and Grayscale filings, and enterprise transaction growth (Aug 12 record: 346,943 daily txs).
    • The bear case: HBAR was excluded from Mastercard’s list of eight approved settlement blockchains, and enterprise pilots convert to production slowly.
    • Our AI model favors a base target near $0.10 by mid-2026, with a bull scenario at $0.20 if regulatory and ETF catalysts stack in Q1.
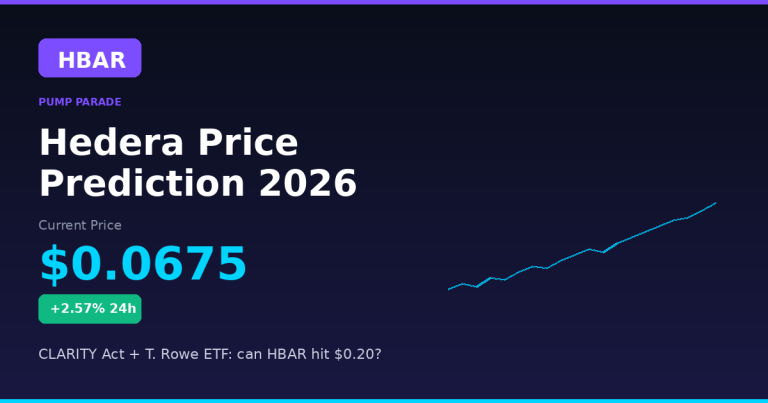
    Hedera (HBAR) price prediction 2026 hero graphic, current price $0.0675, CLARITY Act catalyst

    Where HBAR Stands Today

    Hedera has been the definition of range-bound in 2026. After failing to reclaim $0.10 in March, HBAR has spent most of the summer chopping between $0.055 and $0.085. The 2.57% bounce over the last 24 hours pushed price back above the $0.0665 pivot that has acted as short-term resistance since July.

    Here is the snapshot at time of writing, sourced from Binance and CoinGecko:

    Metric Value
    Price $0.0675
    24h change +2.57%
    24h high / low $0.0680 / $0.0658
    Market cap rank ~#30
    24h volume (HBAR) 56.9M HBAR
    All-time high $0.5701 (Sep 2021)
    % from ATH -88.2%
    Daily tx record 346,943 (Aug 12, 2026)

    The mix matters. A token 88% off its high with rising on-chain activity and stalled price is either a coiled spring or a value trap. Our job is to tell you which one the data supports.

    Why is HBAR range-bound right now?

    Three things are pinning HBAR in the $0.06 to $0.08 zone.

    First, the market has already priced in a lot of the “enterprise blockchain” story. Google, IBM, Boeing and Deutsche Telekom have been on Hedera’s governing council for years. Traders want the next catalyst, not the existing one.

    Second, spot HBAR ETF flows are real but small. The July 23 print showed roughly $540,000 in daily inflows. That is enough to move a low-cap altcoin, but not enough to overpower profit-taking from wallets that bought under $0.05 in Q1.

    Third, altcoin correlation to Bitcoin has been high, and Bitcoin has been sideways. Until BTC breaks its range or altseason narrative flows return, individual altcoin catalysts get muted.

    The Bull Case for HBAR in 2026

    1. The CLARITY Act finally passes

    The CLARITY Act creates a clear regulatory framework separating securities from commodities in US crypto markets. HBAR, alongside XRP and XLM, is one of the tokens that benefits most from this classification clarity because it has faced years of ambiguity about whether it is a security under US law. If the bill clears the Senate this quarter, expect a re-rating in payment and enterprise tokens. Similar clarity events (XRP’s 2023 court win, spot BTC ETF approval) drove 40% to 70% moves in the following 90 days.

    2. Institutional ETF wrapper expands

    T. Rowe Price, which manages roughly $1.5 trillion in assets, has added HBAR to an actively managed crypto ETF. Grayscale and 21Shares have separate filings that reference HBAR. Institutional wrappers do not need to attract billions to move HBAR: with a circulating market cap under $3 billion, even $50M to $100M in monthly ETF flows can shift the marginal price meaningfully.

    3. Real network usage is climbing

    The August 12 record of 346,943 daily transactions is not synthetic. Hedera’s fee model (fractions of a cent per transaction) has attracted supply chain, carbon credit and RWA (real-world asset) tokenization projects that generate steady on-chain volume rather than speculative spikes. If enterprise pilots convert into production revenue by year end, the fundamental case tightens.

    The Bear Case for HBAR in 2026

    1. Mastercard’s exclusion signals institutional preference

    Mastercard’s Crypto Partner Program lists eight approved blockchains for institutional settlement. XRP’s ledger is on that list. Hedera is not. That is a specific, checkable data point that undermines the “HBAR is the enterprise winner” narrative. In a world where corporates pick one or two chains for real money movement, exclusion compounds.

    2. The enterprise story is a slow burn

    Enterprise pilots do not move like DeFi TVL. A supply chain client that signs a Hedera pilot in Q1 might generate $50k of on-chain fees in Q4. That is great for the network, but it is not the kind of catalyst that moves a token 3x. Traders wanting a 2026 breakout need retail flows, and retail follows narratives, not procurement cycles.

    3. Broader altcoin macro is unproven

    Bitcoin dominance has held above 55% for most of 2026. Historically, HBAR outperformance requires BTC dominance to roll over and capital to rotate down the risk curve. If that rotation does not happen, HBAR grinds sideways regardless of ETF flows or CLARITY. This is the risk that most bull-case models under-weight.

    Hedera Price Prediction 2026: Targets by Timeframe

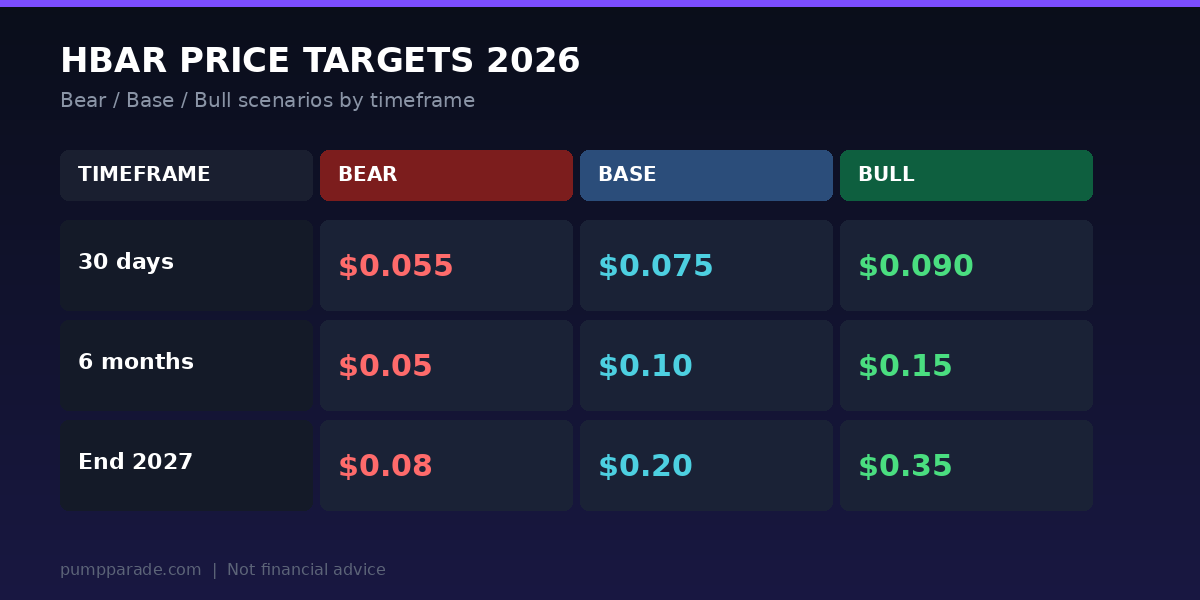
    Hedera (HBAR) price prediction 2026 targets table, bear $0.055, base $0.10, bull $0.20

    Here is our framework, cross-checked against analyst estimates from Cryptopolitan, Changelly and Coinpedia. All numbers assume you are willing to re-check them as macro shifts.

    30-day (through mid-September 2026)

    Bear: $0.055. Base: $0.075. Bull: $0.090. The immediate resistance is $0.075 (July high). A daily close above that opens $0.085, then $0.095. On the downside, losing $0.062 exposes the summer low near $0.055.

    6-month (through Q1 2027)

    Bear: $0.05. Base: $0.10. Bull: $0.15. This range brackets the two paths: either the CLARITY Act plus continued ETF inflows re-rate the token into the $0.10 to $0.15 zone, or macro chops the altcoin bid and HBAR retests $0.05. Base case: $0.10 is the round number that historically acts as both magnet and lid.

    Long-term (end of 2027 and beyond)

    Bear: $0.08. Base: $0.20. Bull: $0.35. A Hedera price prediction 2026 that extends to end of 2027 needs to price in either enterprise revenue that actually shows up in on-chain fees, or a full crypto bull cycle. Cryptopolitan places HBAR near $0.24. Coinpedia’s bull scenario reaches $0.35 to $1.05, but the higher end assumes a repeat of 2021 mania. Our base at $0.20 is what the current setup supports without heroic assumptions.

    For a broader read on how ETF flows are affecting altcoin pricing, our Ethereum price prediction 2026 walks through the same catalyst framework for ETH.

    How does Hedera compare to XRP?

    The most useful comparison for HBAR is XRP: both are payment and enterprise plays, both use non-standard consensus, both spent years fighting regulatory uncertainty. Here is how they stack up as of today.

    Metric HBAR XRP
    Price $0.0675 $1.004
    24h change +2.57% +0.86%
    Consensus Hashgraph (aBFT) Ripple Protocol Consensus
    Founders Leemon Baird, Mance Harmon Chris Larsen, Jed McCaleb
    Governing body Hedera Council (39 orgs) Ripple Labs
    On Mastercard settlement list No Yes
    Spot ETF exposure T. Rowe active ETF, Grayscale filing Multiple spot ETF filings
    Circulating supply ~42.4B HBAR ~59.6B XRP

    XRP has the retail brand, the Mastercard nod, and a Ripple sales team that runs point on enterprise integrations. HBAR has better tech on paper (aBFT hashgraph is genuinely different from a chain) and a broader governing council. If you want to go deeper on the direct competitor, read our XRP price prediction 2026.

    What would change our HBAR view?

    Three specific triggers would push us to update the base case.

    Upside trigger: HBAR closes two consecutive weeks above $0.10 on rising volume, with spot ETF net inflows above $5M per day. That combination has historically preceded 40% to 80% moves in mid-cap payment tokens. If it happens, we shift the base case to $0.15 and open a bull case at $0.30.

    Downside trigger: The CLARITY Act stalls in the Senate and BTC dominance climbs above 60%. In that scenario, altcoin flows dry up and HBAR retests $0.05. We would move the base to $0.075 and the bull ceiling to $0.12.

    Regime change trigger: Mastercard adds Hedera to its approved settlement list, or a top three ETF issuer files a spot HBAR ETF. Either would signal that institutional preference is broadening beyond XRP, and would justify targets in the $0.20 to $0.35 zone.

    Frequently Asked Questions

    Will HBAR reach $1 in 2026?

    Almost certainly not. A move to $1 from current levels is roughly a 15x from $0.0675 and would require HBAR to reclaim its 2021 all-time high and then double it, in a single year. No analyst we tracked (Cryptopolitan, Changelly, Coinpedia base cases, LeveX) forecasts $1 by end of 2026. The realistic 2026 ceiling is $0.20 to $0.35 in a strong bull scenario.

    Is HBAR a good investment in 2026?

    HBAR is a leveraged bet on two specific outcomes: US regulatory clarity via the CLARITY Act, and spot HBAR ETF flows continuing to build. If both hit, the risk-reward from $0.0675 looks favorable. If neither does, HBAR grinds sideways. It is not a passive hold: you need to track catalysts. As always, size positions to your risk tolerance and never allocate money you cannot lose.

    What is the Hedera price prediction 2026?

    Our base case is $0.10 by mid-2026, with a bear scenario at $0.05 and a bull scenario at $0.20 if the CLARITY Act passes and ETF flows accelerate. Third-party analyst estimates cluster in a similar zone: Cryptopolitan at $0.18 to $0.24, Coinpedia base at $0.20, LeveX at $0.10 to $0.30.

    Why is Hedera going up today?

    HBAR is up 2.57% in the last 24 hours on a mix of factors: reclaiming the $0.0665 short-term resistance, follow-through from the August 12 daily transaction record, and continued spot ETF inflows via the T. Rowe Price active crypto ETF. It is a technical bounce inside a larger range, not a confirmed trend reversal.

    Is Hedera better than XRP?

    Technically, hashgraph consensus offers faster finality and lower fees than XRP’s ledger. Commercially, XRP has the bigger enterprise integration footprint and inclusion in Mastercard’s settlement list. If you weight tech, HBAR wins. If you weight distribution and institutional adoption, XRP wins. The market currently rewards distribution.

    Will the CLARITY Act affect HBAR price?

    Yes, likely positively. HBAR is one of the tokens most exposed to US regulatory ambiguity because Hedera has US-based governance and enterprise sales motion. If the CLARITY Act creates a clean commodity classification path, we would expect a 30% to 60% re-rating within 90 days of passage, based on comparable events (spot BTC ETF approval, XRP court win).

    The Honest Take

    Hedera is a coin with real technology, a legitimate enterprise footprint, and a slow-moving narrative. That combination has been true for four years, and HBAR is still 88% off its high. The 2026 setup is different in two ways that matter: US regulatory clarity is closer than at any point since 2021, and institutional wrappers (ETFs) exist for the first time. That is enough to justify a base case of $0.10 to $0.15, but not enough to justify buying the “HBAR to $1” narrative.

    The trade is: catalyst-driven, sized modestly, with clear invalidation. If HBAR loses $0.055 on a weekly close, the setup is broken. If it closes above $0.10 on volume, the story has legs. Anything in between is noise, and noise is where most traders lose money.

    For readers who want the RWA angle on why enterprise blockchains matter in 2026, our Ondo price prediction 2026 covers the tokenization thesis in depth.

    Disclaimer: This article is for informational and educational purposes only and should not be construed as financial, investment, or trading advice. Cryptocurrency markets are highly volatile, and past performance does not guarantee future results. The price predictions and analyses presented here are based on AI models, technical indicators, and available data at the time of writing, they are not guarantees. Always conduct your own research (DYOR) and consult with a qualified financial advisor before making any investment decisions. Pump Parade and its authors do not assume liability for financial losses incurred based on information provided in this article.

    Coinbase Review 2026: Fees, Features & Verdict

    0

    Coinbase Review 2026 hero image

    If you are new to crypto in the United States, odds are Coinbase is the first exchange anyone will recommend. It is publicly listed, tightly regulated, insured up to nine figures, and now sits at a record 10.3% share of global crypto spot trading. But Coinbase is also famous for one thing traders love to hate: fees. So is the biggest US exchange actually worth using in 2026, or is it just the safest place to overpay?

    This Coinbase review breaks down the platform’s fees, features, security, staking yields, and the split personality between the simple Coinbase app and Coinbase Advanced Trade. If you want the fast answer, jump to the verdict. Otherwise, keep reading for the full picture, including where Coinbase quietly became one of the most feature-rich exchanges on the market.

    TL;DR: Quick Verdict

    Rating: 4.3 / 5

    Coinbase in 2026 is the best regulated on-ramp in the US, with a genuinely strong pro trading product (Advanced Trade) hidden behind an expensive beginner app. Use the simple interface only for onboarding and one-off buys. Move to Advanced Trade, or subscribe to Coinbase One, and the fees drop by 75 to 95%. Security, liquidity, and product depth are best in class. If you value regulation and insurance over the absolute lowest fee, Coinbase is the safe default.

    What Is Coinbase in 2026?

    Coinbase (NASDAQ: COIN) is a US-headquartered cryptocurrency exchange founded in 2012. In 2026 it serves roughly 120 million users worldwide, with about 8.7 million monthly transacting users and more than 1 million paid Coinbase One subscribers. The company processes around $516 billion in quarterly trading volume across spot, futures, and perpetual-style contracts, and holds an estimated 65% of the US crypto trading market.

    The platform now supports 275+ digital assets and has expanded well beyond a simple buy-and-sell app. In 2026 alone, Coinbase added CFTC-regulated perpetual-style futures with up to 10x leverage on major coins, launched 24/7 stock index perpetuals with USDC settlement at up to 20x, and rolled out copper and platinum commodity futures. It also runs a self-custody wallet, an on-chain L2 (Base), and Coinbase Prime for institutions.

    If you are comparing centralized exchanges more broadly, our Binance vs Coinbase breakdown looks at how it stacks up against the largest global venue, while Kraken vs Bitget covers two strong alternatives.

    Product Overview: Two Interfaces, One Exchange

    The single most important thing to understand about Coinbase is that it is really two products stitched together.

    • Coinbase (simple): the beginner-friendly app and site. Instant buys, recurring purchases, staking with one tap, and a card-swipe simple UX. Fees are high because they hide inside a spread.
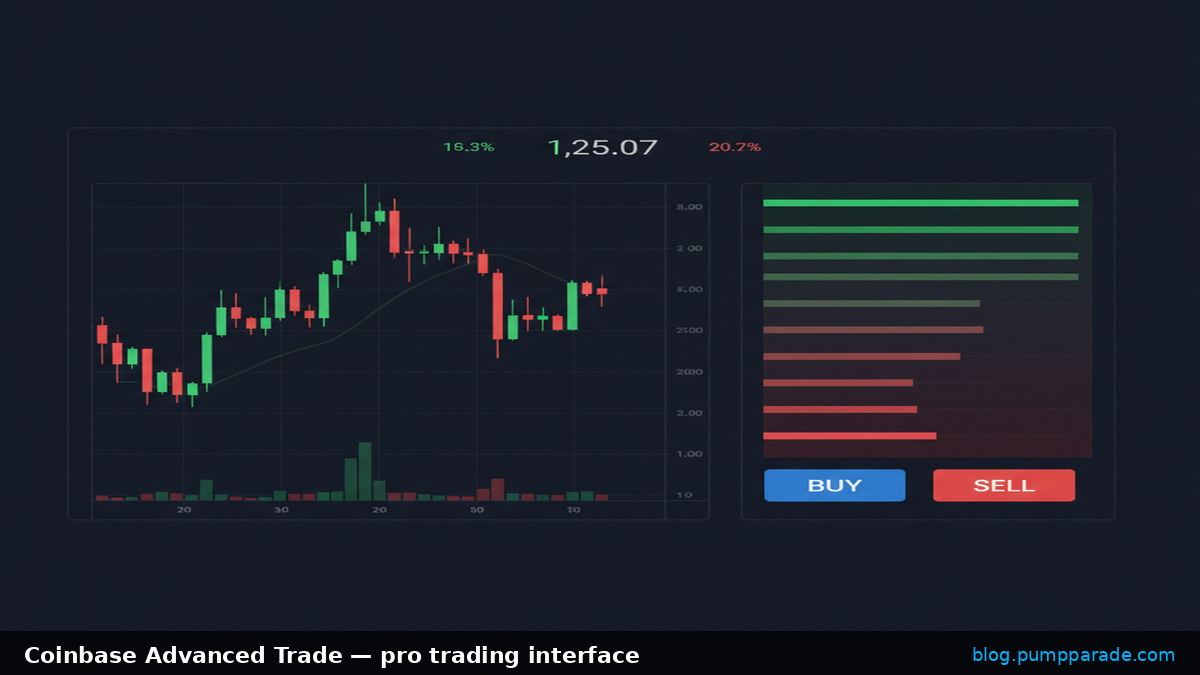
    • Coinbase Advanced Trade: the pro interface, formerly Coinbase Pro. Real order books, maker-taker fees, TradingView charts, limit and stop orders, and full API access. Same accounts, same balances, same custody, dramatically lower fees.

    Both share the same login, KYC, wallet, and asset universe. You can toggle between them freely inside the app.

    Coinbase Advanced Trade interface visualization

    Coinbase Fees in 2026: The Full Breakdown

    Fees are where Coinbase reviews live or die. Here is the honest picture.

    Coinbase Simple (the app)

    The consumer interface charges between 1.49% and 3.99% per trade, plus an embedded spread of roughly 0.50%. Card purchases can hit closer to 3.99% total. This is the default experience for a new user, and it is where the “Coinbase is expensive” reputation comes from. For a $5,000 Bitcoin purchase on Simple, expect to pay $125 to $175 all-in.

    Coinbase Advanced Trade

    Advanced Trade uses a real maker-taker schedule from 0.00% to 0.40% on the maker side and 0.05% to 0.60% on the taker side, with no hidden spread. The base taker fee is 0.60% and drops as your 30-day volume increases. That same $5,000 Bitcoin purchase, executed as a market order on Advanced, costs roughly $30. As a limit order that provides liquidity, it can cost zero.

    Switching from Simple to Advanced typically saves 75 to 95% on trading costs. If you take one thing from this Coinbase review, let it be this.

    Coinbase One

    Coinbase One is the exchange’s subscription tier. It eliminates trade-related fees on eligible pairs, includes account protection guarantees for eligible US users up to $1 million, and unlocks boosted staking rewards. Pricing runs from $4.99 per month (Basic) up to premium tiers reaching $299.99 per month for high-volume traders. For anyone trading more than a few thousand dollars a month on the simple interface, One pays for itself quickly.

    Other Coinbase Fees to Know

    • ACH deposits/withdrawals: free in the US
    • Wire transfers: $10 in, $25 out
    • Debit card buys: up to 3.99%
    • USDC deposits/withdrawals: free on Base and Ethereum L2s
    • Staking commission: 15% to 35% depending on the asset

    Features Deep Dive

    Spot Trading

    Coinbase supports 275+ tokens across BTC, ETH, SOL, USDC, and long-tail alts. Order book depth on majors is deep enough for six- and seven-figure trades without meaningful slippage. Advanced Trade offers market, limit, stop-limit, and bracket orders, with TradingView charts baked in.

    Futures and Perpetual-Style Contracts

    Coinbase Financial Markets runs CFTC-regulated perpetual-style futures on major coins with up to 10x leverage. In June 2026, Coinbase launched 24/7 stock index perpetuals settled in USDC at up to 20x. It also added copper and platinum commodity futures in January. This is a serious derivatives product that quietly competes with offshore venues while staying US-regulated.

    Staking

    Coinbase Staking supports Ethereum, Solana, Cardano, Polkadot, Cosmos, Tezos, and several others, with typical yields of 2% to 7% APY after commission. Ethereum stakers receive cbETH, a liquid staking token they can move or use as collateral elsewhere. There is no minimum, no node to run, and rewards accrue automatically. Coinbase’s commission is on the higher side (15 to 35% of rewards), which is the tradeoff for the plug-and-play experience.

    Coinbase Wallet (Self-Custody)

    Separate from the exchange, Coinbase Wallet is a non-custodial mobile and browser wallet supporting hundreds of chains including Ethereum, Base, Solana, and every major EVM L2. It integrates cleanly with DeFi, NFTs, and Base dapps. If you also want a pure Solana wallet, our Phantom Wallet review is a good next read.

    Base L2

    Base is Coinbase’s Ethereum layer 2 built on the OP Stack. In 2026 it is one of the top three L2s by TVL and daily active users, with sub-cent fees and instant Coinbase on-ramps. Any USDC on Coinbase can be moved to Base in one click at zero cost, which makes Coinbase a genuinely attractive DeFi entry point.

    Coinbase Prime and Institutional

    Coinbase Prime handles custody, trading, and financing for hedge funds, ETFs, and corporates. It is the custodian for the majority of the US spot Bitcoin ETFs. This institutional plumbing is what underpins the exchange’s global 10.3% share number.

    Pros and Cons

    Pros

    • Best-regulated large exchange in the US, publicly listed, quarterly audited
    • Deep liquidity on majors, tight spreads on Advanced Trade
    • 275+ assets including full altcoin coverage
    • Advanced Trade fees genuinely competitive with any global venue
    • Base L2 gives cheap, native access to on-chain DeFi
    • CFTC-regulated futures and 24/7 stock perpetuals under one login
    • Strong staking product with liquid cbETH option
    • Zero successful hacks since 2012, $320M insurance, 98% cold storage

    Cons

    • Simple app fees are punishingly high (1.49 to 3.99% plus spread)
    • Staking commissions (15 to 35%) are higher than direct liquid-staking protocols
    • Not available in every US state for every product (futures, staking coverage varies)
    • Customer support has historically been slow, though Coinbase One improves this
    • Simple and Advanced split can confuse new users who never discover Advanced

    Security and Regulation

    Coinbase is arguably the most regulated large crypto exchange on earth. It holds money transmitter licenses across all US states where it operates, a NY BitLicense, MiCA authorization in the EU, and a growing list of international licenses. Coinbase Financial Markets is CFTC-registered for derivatives.

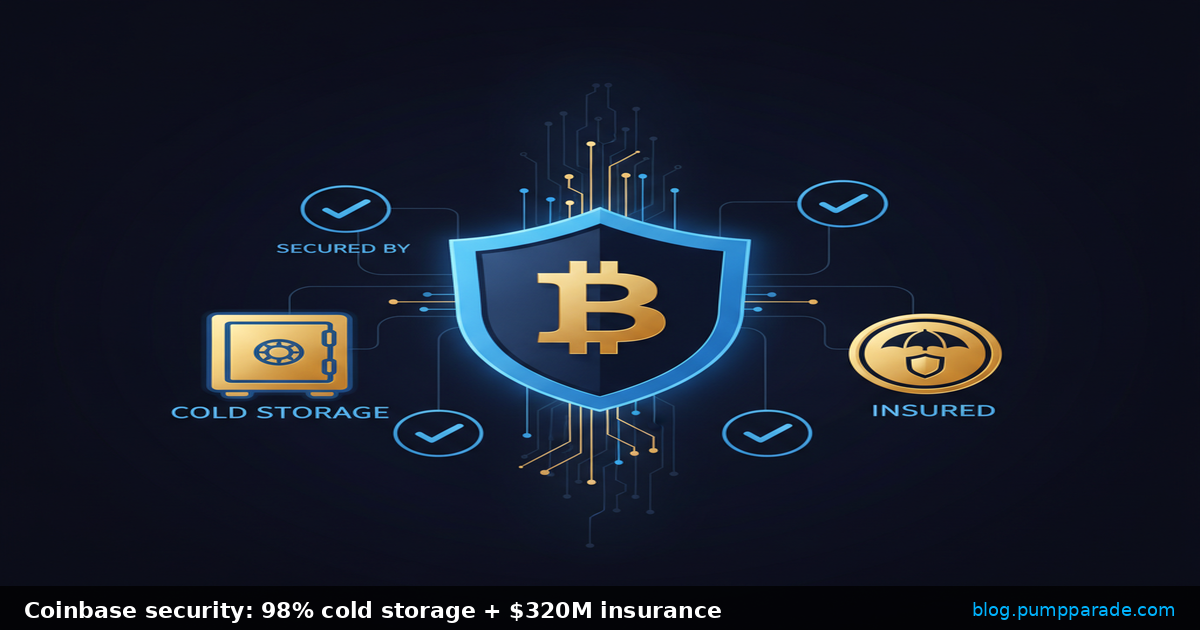
    On the security side, Coinbase keeps 98% of customer funds in cold storage, maintains $320 million in insurance coverage against theft, and has recorded zero successful exchange-level hacks since launching in 2012. The platform enforces 2FA, biometric login, address allow-lists, and passkey support. For paranoid users, Coinbase Vault adds time-delayed withdrawals with multi-approver flows.

    Coinbase security features illustration

    User Experience

    The consumer app is polished. Onboarding takes minutes, KYC is fast for US users with a driver’s license, and buying your first crypto genuinely does feel like a fintech app. The Advanced Trade interface is a full pro terminal with TradingView charts, a proper order book, and every order type you would expect. Both are available on iOS, Android, and web.

    Mobile users get near-parity with the web platform. The one common complaint remains customer support: expect chat and email replies measured in days rather than minutes unless you are a Coinbase One or Prime customer.

    How Coinbase Compares

    Against Binance, Coinbase loses on fees and altcoin breadth but wins on regulation, US access, and derivatives that a US person can actually legally use. Against Kraken, Coinbase wins on product depth (Base, cbETH, stock perpetuals) but Kraken is often cheaper on smaller trades. Against Bybit and OKX, Coinbase loses on advanced perp features but wins for anyone who wants a US-regulated, publicly audited counterparty. If you need help picking between exchanges, our Bybit vs OKX comparison is a good follow-up read.

    Who Should Use Coinbase?

    • US beginners: yes, but subscribe to Coinbase One or move to Advanced Trade immediately.
    • Active US traders: yes for spot, yes for regulated futures, especially with the 24/7 stock perps.
    • DeFi users: yes as a fiat on-ramp to Base, cbETH, and USDC.
    • International low-fee traders: probably no, cheaper venues exist outside the US.
    • Ultra low-fee memecoin traders: no, on-chain aggregators are cheaper for long-tail alts.

    Final Verdict

    Coinbase in 2026 is a much better exchange than its reputation suggests, provided you know where to click. The simple app is overpriced. Advanced Trade, Coinbase One, and Base are genuinely competitive with anything on the market and are wrapped in the strongest regulatory and insurance package in the industry.

    Rating: 4.3 / 5. The best regulated home base for US crypto users, and a legitimately good pro exchange once you leave the beginner interface. Visit Coinbase to open an account, and switch to Advanced Trade as soon as you deposit.

    FAQ

    Is Coinbase safe in 2026?

    Yes. Coinbase holds 98% of customer funds in cold storage, carries $320 million in theft insurance, is publicly audited as a NASDAQ-listed company, and has never suffered a successful exchange-level hack since launching in 2012.

    Why are Coinbase fees so high?

    They are high only on the simple consumer interface, which charges 1.49 to 3.99% plus a spread. Switching to Coinbase Advanced Trade drops fees to a 0.00 to 0.60% maker-taker schedule, saving most users 75 to 95%.

    Is Coinbase One worth it?

    If you trade more than roughly $1,000 to $2,000 per month on the simple app, yes. Coinbase One eliminates trade fees on eligible pairs, adds up to $1 million in account protection for eligible US users, and boosts staking rewards. Basic tier is $4.99 per month.

    Does Coinbase support staking?

    Yes. You can stake ETH, SOL, ADA, DOT, ATOM, XTZ, and others directly in the app with no minimum. Yields typically range from 2% to 7% APY after Coinbase’s commission of 15 to 35%.

    Can I use Coinbase for DeFi?

    Yes. Coinbase Wallet is a self-custody wallet supporting Ethereum, Solana, and every major EVM L2. Base, Coinbase’s own L2, plugs directly into the exchange with instant USDC transfers and sub-cent fees.

    Ethereum (ETH) Price Prediction 2026: Can ETH Hit $2,500?

    Ethereum (ETH) trades at $1,894 at time of writing, still down roughly 53% from the August 2025 peak near $4,000. The number stings, but the context is more interesting than the price tag. Ethereum is entering the final week before its Glamsterdam upgrade targets mainnet activation, staking ETFs have crossed $250M in assets in weeks, and analyst 2026 targets range from FxPro’s cautious $2,000 to Standard Chartered’s $7,500. Rarely have serious analysts been this far apart on the same asset.

    This is the setup that makes an ethereum price prediction 2026 worth writing. The catalysts are real, the downside is real, and the number that matters most in the next 90 days sits just above current price: $2,500. Reclaim it and ETH is back in a technical uptrend. Fail it and $1,600 support is the next test.

    Below: where ETH stands today, why it moved, the bull and bear cases with named catalysts, our bear/base/bull targets across three timeframes, a head-to-head against Solana, the FAQ you’re actually searching, and a balanced take.

    Key Takeaways

    • Current price: ETH is at $1,894, roughly 53% below its August 2025 all-time high near $4,000.
    • Bull case: Glamsterdam mainnet activation, $11.18B cumulative ETF inflows, staking ETFs live from BlackRock and Grayscale, staking ratio at 34.23% of supply.
    • Bear case: Persistent underperformance vs. BTC and SOL, gas-fee compression on L2s, macro liquidity risk into Q4.
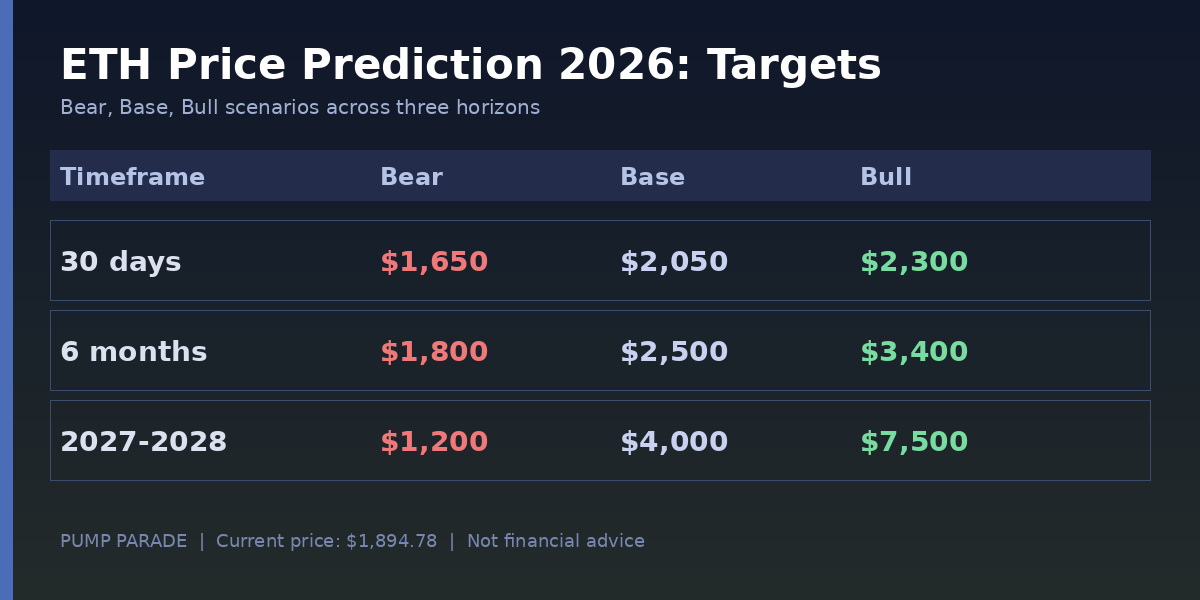
    • 2026 targets: Bear $1,600, Base $2,500, Bull $3,400.
    • Longer term: Analyst 2026 range spans $2,000 (FxPro) to $7,500 (Standard Chartered), with Citi at $3,175.
    Ethereum (ETH) price prediction 2026 hero graphic, current price $1,894, Glamsterdam upgrade catalyst ahead

    Where Ethereum Stands Today

    Live spot data from Birdeye puts ETH at $1,894.78 with a modest +0.28% move over the last 24 hours. The bigger picture is more important than the tick. Ethereum’s market cap sits near $228B, retaining its number-two ranking behind Bitcoin but with the ETH/BTC ratio at levels not seen since early 2024.

    Metric Value
    Price (USD) $1,894.78
    24h change +0.28%
    Market cap ~$228B
    Rank #2
    All-time high $4,878 (Nov 2021)
    % from ATH -61%
    Staked ETH ~41M coins (34.23% of supply)

    Two structural changes are worth flagging. First, the staking ratio has climbed to 34.23% of total supply, roughly $77B in staking market cap. That’s supply locked out of active circulation. Second, spot ETH ETFs have absorbed $11.18B in cumulative net inflows since launching in July 2024, per Datawallet’s ETF tracker. BlackRock’s ETHA alone accounts for roughly $11.4B of that flow.

    Why Is Ethereum Range-Bound Right Now?

    Three forces are pinning ETH near current levels.

    ETH/BTC underperformance: Ethereum has trailed Bitcoin for most of the last 18 months. BTC ETF flows have dwarfed ETH ETF flows on an absolute basis, and the “sound money” narrative concentrated capital in Bitcoin. That created a self-fulfilling rotation where every ETH rally faded into BTC strength.

    L2 gas-fee compression: The Dencun upgrade in 2024 and Fusaka’s expanded blob capacity in December 2025 lowered L2 costs dramatically. Good for users, harder for ETH burn. Base-layer gas revenue has thinned, weakening the “ultrasound money” flywheel that boosted ETH through 2023.

    Wait-and-see positioning: Institutional allocators are watching the Glamsterdam upgrade, expected within days. Big moves before a catalyst are unusual. Most desks are sitting on their hands until they see how the market prices in EIP-7732 and the 200M-gas-limit floor.

    The Bull Case for ETH in 2026

    Catalyst 1: Glamsterdam Mainnet Activation

    The Ethereum Foundation is targeting late August 2026 for Glamsterdam mainnet activation, though the date remains aspirational and subject to devnet readiness. The upgrade ships two heavyweight EIPs: EIP-7732 (Enshrined Proposer-Builder Separation, or ePBS) and EIP-7928 (Block-Level Access Lists). ePBS shifts MEV extraction from off-protocol relays into consensus, reducing centralization risk. Block-Level Access Lists enable faster block validation and set the stage for parallel execution.

    The kicker: a proposed gas-limit floor of 200 million, a jump from the current ~60M. That’s more than 3x base-layer throughput, which pressures fees down further but also unlocks new categories of on-chain activity that were previously priced out. Reference: CoinMarketCap Academy on Glamsterdam.

    Catalyst 2: Staking ETFs Now Live

    January 5, 2026 was the day Grayscale’s ETHE became the first US crypto ETP to distribute staking rewards to shareholders. BlackRock’s ETHB followed on March 12, 2026 and grew from $107M in seed capital to over $250M in its first week. Five more issuers are in the queue.

    Why this matters: for the first time, ETH-in-a-wrapper offers 1.9% to 2.6% net yield on top of price exposure. That flips the institutional pitch. BTC has no cash flow, ETH now does. Advisory allocators who couldn’t touch native staking can now access it inside a familiar ETF wrapper. If flows scale the way BTC ETF flows scaled in year two, this is a multi-quarter tailwind, not a headline.

    Catalyst 3: Supply Sink Is Real

    34.23% of ETH supply is now staked, roughly 41M coins. Add in ETF holdings and long-term wallets, and free-float ETH available for spot markets is at multi-year lows. Historically, tight float plus a demand catalyst equals sharp moves. The setup isn’t a guarantee, but the reflexive math is on the bulls’ side heading into Q4 2026.

    The Bear Case for ETH in 2026

    Risk 1: Solana and Modular L1s Keep Winning Users

    Solana processed record fee revenue in the first half of 2026 and continues to capture the memecoin and consumer-app narrative. Every quarter Ethereum spends explaining L2 UX friction is a quarter Solana spends onboarding retail. For a deeper look at the competitive landscape, see our Solana price prediction.

    Risk 2: L2 Fee Compression Weakens the Burn

    Post-Fusaka, blob fees are cheap enough that L2s pay pennies to settle to mainnet. That’s great UX, but it means ETH’s deflationary story now depends more heavily on L1 demand for blockspace. If Glamsterdam expands throughput without a matching demand surge, ETH could tip back to net inflationary for extended stretches.

    Risk 3: Macro and Regulatory Wildcards

    A hawkish Fed pivot, a delay in the next SEC ETF approval window, or renewed enforcement action against a major staking provider could all reprice ETH lower quickly. Crypto beta to macro liquidity has been rising in 2026, not falling. Any risk-off tape and ETH tends to lead the drawdown, not lag it.

    Ethereum Price Prediction 2026: Targets by Timeframe

    Ethereum (ETH) price prediction 2026 targets table, bear $1,800, base $2,500, bull $3,400

    30-Day View (through mid-September 2026)

    Bear: $1,650. Base: $2,050. Bull: $2,300. The Glamsterdam activation window is the dominant variable. A clean mainnet launch with fast finality metrics could catalyze a run at the $2,300 supply cliff. A delay or bug could send price back toward the $1,600-$1,700 accumulation zone that has held since April.

    6-Month View (through Q1 2027)

    Bear: $1,800. Base: $2,500. Bull: $3,400. This is the window where staking ETF flows compound. If BlackRock’s ETHB clears $2B in AUM and additional issuers launch, ETH could challenge the $2,500 psychological level and then $3,000. The bull scenario requires a broader risk-on tape plus a resolution of the ETH/BTC ratio downtrend.

    Long-Term View (2027-2028)

    Bear: $1,200. Base: $4,000. Bull: $7,500. The bear case is a sustained ETH/BTC decline where Ethereum becomes “the DeFi settlement layer” but loses the sound-money narrative entirely. The base case tracks Citigroup’s revised $3,175 target and adds a modest multiple for staking yield capitalization. The bull case aligns with Standard Chartered’s $7,500 revision and requires two things: successful modular-scaling execution and continued institutional inflows via staking ETFs. Bitget Research analyst Ryan Lee also sits in the $7,000 zone for 2026, per CryptoNews’ analyst roundup.

    How Does Ethereum Compare to Solana in 2026?

    The natural comparison in 2026 is ETH vs SOL. Both are L1 smart-contract platforms with real users and revenue. They occupy different corners of the market.

    Metric Ethereum (ETH) Solana (SOL)
    Price $1,894 $75.82
    Market cap ~$228B ~$44B
    Staking yield (gross) 3.1% to 3.3% ~6.5% to 7%
    Spot ETF live? Yes (with staking) Yes (2025 launch)
    Base-layer TPS ~15 (L1); L2s hit 500+ ~2,000-3,000 practical
    Median fee ~$0.50 (L1) ~$0.001
    Primary narrative Institutional settlement, staking yield Consumer apps, memecoins, high-throughput DeFi

    ETH is the institutional pick. SOL is the retail-and-degen pick. Both can outperform in 2026 for different reasons, and portfolio construction rarely requires choosing one to the exclusion of the other.

    What Would Change Our View on ETH?

    Three explicit scenario triggers we’re watching.

    Bullish flip: ETH holds a weekly close above $2,500 on rising ETF inflows and rising ETH/BTC ratio. That combination would signal a genuine trend change, not a relief rally.

    Bearish flip: ETH breaks weekly close below $1,600 while spot ETF flows turn net negative for three consecutive weeks. That would put $1,200 to $1,400 in play and invalidate most 2026 bull cases.

    Neutral consolidation: ETH chops between $1,700 and $2,200 into year-end. This is the most probable path if Glamsterdam ships cleanly but macro stays uncertain, and it’s what most option markets are pricing in.

    Frequently Asked Questions

    Will Ethereum reach $3,000 in 2026?

    Possible but not the base case. Reaching $3,000 would require ETH to clear and hold $2,500 first, then absorb another leg of ETF inflows or a clean Glamsterdam catalyst. Citigroup’s 2026 target of $3,175 sits in this zone. FxPro’s target of $2,000 does not. Odds favor the range trade between now and Q1 2027.

    Is Ethereum a good investment in 2026?

    ETH remains a core infrastructure asset in DeFi, stablecoins, and tokenization, and staking now generates 3.1% to 3.3% gross yield. The counterpoint: ETH has underperformed BTC and SOL for most of 18 months, and past performance does not guarantee future results. Position sizing and time horizon matter more than the buy/sell binary.

    What is the Ethereum Glamsterdam upgrade?

    Glamsterdam is Ethereum’s next major hard fork, targeted for late August 2026. Its two headline features are EIP-7732 (Enshrined Proposer-Builder Separation) and EIP-7928 (Block-Level Access Lists), which together improve MEV decentralization and enable faster block validation. It also raises the network’s gas-limit floor to 200M.

    How high can ETH go by end of 2026?

    Analyst 2026 targets span from FxPro’s $2,000 to Standard Chartered’s revised $7,500. Our base case is $2,500 with bull scenarios extending to $3,400 by early 2027 if staking ETF flows compound and macro conditions cooperate.

    Why is Ethereum down from its 2025 highs?

    ETH is off roughly 53% from its August 2025 peak due to three factors: sustained ETH/BTC underperformance, gas-fee compression from L2 scaling that weakened the burn narrative, and institutional wait-and-see positioning ahead of Glamsterdam. None of these are structural breaks, but they explain the range.

    Should I stake my ETH or buy the ETF?

    Native staking yields more (3.1% to 3.3% gross) but requires 32 ETH for a solo validator or trust in a pooled provider like Lido or Coinbase. Staking ETFs from BlackRock (ETHB) and Grayscale (ETHE) yield less after fees (1.9% to 2.6% net) but sit inside a brokerage account with tax and custody simplicity. The right answer depends on account type, tax situation, and comfort with self-custody.

    The Honest Take

    Ethereum in mid-August 2026 is a coiled spring with a real bear case attached. The catalysts stack up: Glamsterdam is days away, staking ETFs are pulling in real money, and the staking ratio keeps compressing free float. The risks are also real: L2 fee compression, sustained BTC and SOL dominance, and any macro shock could reprice ETH lower fast.

    The number to watch is $2,500. Reclaim it on a weekly close and the setup shifts from “range trade” to “trend continuation.” Fail it and $1,600 remains the last real support before the 2024 lows come back into view. For a research setup that could move quickly in either direction, that’s a reasonable place to sit and wait for the tape to confirm.

    For related reading, see our Bitcoin price prediction and our take on Lido and the ETH staking economy.

    Disclaimer: This article is for informational and educational purposes only and should not be construed as financial, investment, or trading advice. Cryptocurrency markets are highly volatile, and past performance does not guarantee future results. The price predictions and analyses presented here are based on AI models, technical indicators, and available data at the time of writing. They are not guarantees. Always conduct your own research (DYOR) and consult with a qualified financial advisor before making any investment decisions. Pump Parade and its authors do not assume liability for financial losses incurred based on information provided in this article.

    Sei (SEI) Price Prediction 2026: Can SEI Hit $0.10?

    Sei just tapped a fresh all-time low. On August 16, 2026, SEI printed $0.03948, the deepest price the token has ever traded, capping a year in which it has bled roughly 88% and slipped 96.5% below its March 2024 peak of $1.14. At time of writing, SEI trades at $0.03986 with a market cap of $268 million, ranking #132 on CoinGecko.

    That is not the setup most price prediction articles want to open with. But it is the setup that actually matters. Because sitting underneath that price chart is a network that just shipped the first mainnet components of its 200,000 TPS Giga upgrade, integrated Chainlink Equities Streams for 24/7 tokenized stock trading, and lined up Dinari to bring real U.S. equities onchain. The narrative and the price are pointing in opposite directions. That gap is the whole story.

    This is our data-driven Sei (SEI) price prediction 2026. We walk through the current setup, the real catalysts, the equally real risks, and where analyst targets cluster for the short, medium, and long term.

    Key Takeaways

    • SEI trades at $0.03986 (August 17, 2026), fresh off an all-time low of $0.03948 hit yesterday.
    • The Giga upgrade started mainnet rollout with the v6.6 Ares and Eidos deployments in early August 2026.
    • Analyst 2026 targets cluster wide: bearish sub-$0.05, base $0.08 to $0.14, bullish $0.20 to $0.26.
    • Real catalysts include Chainlink Equities Streams, Dinari tokenized stocks, and native USDC via CCTP V2.
    • Biggest risks: supply overhang from a 10B max supply, competition from Monad and Solana, weak TVL versus 2025 peak.
    • Our take: the setup is a high-risk, high-upside speculative bet on execution, not a defensive hold.
    Sei (SEI) price prediction 2026 hero graphic, current price $0.040, Giga upgrade catalyst

    Where Sei Stands Today

    Before we look at where SEI could go, here is where it actually is. All figures pulled from CoinGecko on August 17, 2026.

    Metric Value
    Price $0.03986
    24h change -0.60%
    7d change -3.80%
    30d change -15.0%
    1y change -87.6%
    Market cap $268.16M
    24h volume $10.49M
    Rank #132
    Circulating supply 6.73B (67% of max)
    All-time high $1.14 (Mar 15, 2024), -96.5% from ATH
    All-time low $0.03948 (Aug 16, 2026)

    Volume is thin. Depth is thinner. The token is trading like the market has already priced in another leg down, and any positive surprise from the Giga rollout is not yet reflected. That does not automatically mean SEI is a buy. It does mean the risk-reward has shifted from what it looked like at $0.15.

    Why is SEI at an all-time low right now?

    The plain answer: heavy scheduled unlocks combined with a rotation of capital toward faster-narrative L1s and AI-adjacent names have kept selling pressure on. Sei has been included in several “3 token unlocks to watch” pieces this month. With circulating supply now at 67% of the 10 billion cap and vesting still active for team, investors, and ecosystem buckets, dilution is a structural drag.

    On top of that, the broader smart contract platform category is down about 2.5% on the week. Sei is down 3.8% in the same window. In plain terms, it is underperforming its own sector, which usually happens when supply-side pressure meets weak sentiment. The Giga narrative has not been enough to force short-covering because the market wants to see mainnet performance before it re-rates the token.

    What is the bull case for SEI in 2026?

    1. The Giga upgrade is actually shipping

    Sei’s Giga upgrade is not a slide-deck promise anymore. In early August 2026, governance passed v6.6, which deployed two foundational Giga components to mainnet: the Ares execution engine and the Eidos storage engine. Eidos completed live migration four days ago, replacing the network’s storage database while the chain kept running. The Giga Whitepaper V2, published July 1, 2026, targets sub-250ms finality, over 200,000 TPS, and stronger MEV resistance. If the full stack lands cleanly through the rest of 2026, Sei becomes one of the fastest EVM environments in production, and that is a fundamentals re-rate trigger.

    2. Real RWA rails are being built

    Sei integrated Chainlink Equities Streams for 24/7 tokenized stock trading on August 6, and confirmed a Dinari integration to offer tokenized U.S. stocks natively. Chainlink’s expanding role in tokenized markets is a broader theme we cover in our Aave price prediction, which touches how oracle-driven liquidity feeds are reshaping DeFi. Circle is bringing native USDC and CCTP V2. Institutional partnerships with BlackRock, Apollo, and Hamilton Lane have been referenced for RWA rails. This is the same playbook Solana ran two years earlier, and it worked. For context on how RWA narratives translate into token price, see our Ondo price prediction, which covers the ONDO RWA thesis in detail.

    3. Distribution channels no other L1 has

    Sei announced stablecoin payments across more than 20,000 Xiaomi retail stores starting Q2 2026, initially in Hong Kong and the EU, with Sei Wallet and app discovery pre-installed on Xiaomi phones outside China and the U.S. That is a hardware-level distribution channel most competitor L1s cannot replicate. Even at low conversion rates, this is a materially different user-acquisition funnel than the standard “web3 dApp” flow.

    What is the bear case for SEI in 2026?

    1. Supply overhang is relentless

    SEI is being unlocked on a fixed schedule against a 10 billion max supply, with about 3.27 billion tokens still to enter circulation. Every month the sell-side pressure resets. Until unlocks slow materially, price rallies face a natural ceiling from vesting cohorts marking gains. This is the single most consistent bear-case bullet in every serious 2026 SEI writeup.

    2. The parallel EVM race is now crowded

    Sei was briefly the first parallelized EVM chain. It is no longer alone. Monad is live. Neon, Reactive Network, and other high-throughput chains are chasing the same narrative. Sei’s differentiation now depends on Giga delivering on its performance claims and the ecosystem staying sticky. If Monad captures the “fast EVM” narrative in the market, SEI’s premium disappears.

    3. TVL is a fraction of its 2025 peak

    Total value locked sat near $105 million in February 2026, well below the mid-2025 peak above $600 million. Daily active users are respectable, but TVL is what capital allocators watch, and low TVL means low fee generation, which means the token has weaker fundamentals to price off. Fees on Sei were $5.33 in the last 24 hours per CoinGecko’s Token Terminal integration. That is not a typo. Real fee revenue is currently a rounding error, and that has to change for a durable re-rate.

    Sei Price Prediction 2026: Targets by Timeframe

    Sei (SEI) price prediction 2026 targets table, bear $0.03, base $0.08, bull $0.20

    Below are our target ranges, synthesized from analyst forecasts at Changelly, CoinCodex, Cryptopolitan, and 99Bitcoins alongside our own read of the Giga rollout timeline.

    Timeframe Bear Base Bull
    30 days (mid-September 2026) $0.032 $0.045 $0.060
    6 months (Q1 2027) $0.030 $0.080 $0.140
    End of 2027 $0.050 $0.150 $0.260

    Short-term (30 days)

    Sei just printed a new ATL. Technically, momentum favors continuation. If the $0.0395 level breaks and holds as resistance, the next real support is thin and $0.032 becomes achievable. The base case assumes Giga headlines and short-covering produce a bounce back into the $0.045 zone. A bull surprise (Xiaomi rollout headline, tokenized stocks going live at scale) could squeeze back to $0.06, but that requires an actual catalyst to hit the tape.

    Medium-term (6 months)

    By Q1 2027, the full Giga upgrade should be closer to production. This is where the biggest divergence in analyst outlooks lives. Bearish 99Bitcoins-style models put SEI near $0.03, base cases cluster at $0.08 to $0.09 (aligned with Coincheckup’s $0.09 average), and bullish scenarios that assume Giga ships plus RWA volume translates into fees push toward $0.14.

    End of 2027

    Longer horizons give the fundamentals more room to matter. If Sei captures a credible share of the parallelized-EVM RWA and payments market, an average price around $0.15 is defensible. Bull-case analyst targets from 99Bitcoins and Changelly reach $0.26 on the assumption of a broader alt-cycle plus successful Giga execution. Sub-$0.05 in that timeframe would essentially mean the ecosystem lost the narrative war, which is a real possibility, just not the base case.

    For comparison, Standard Chartered and other institutional desks continue to prefer larger-cap L1s like Solana for RWA exposure. Our Solana price prediction lays out that parallel setup and is a useful sanity check on how much of the RWA opportunity a smaller L1 like Sei can realistically capture.

    How does Sei compare to Solana?

    The most useful comparison for SEI is not another Cosmos-lineage chain. It is Solana. Both are high-throughput L1s, both are targeting payments and RWA, and both trade off high-performance execution against decentralization tradeoffs.

    Metric Sei (SEI) Solana (SOL)
    Price $0.04 ~$75
    Market cap $268M ~$40B
    Rank #132 Top 10
    Target TPS 200,000 (Giga) ~65,000 (theoretical)
    Target finality Sub-250ms ~400ms
    EVM support Native (post-Giga) No (SVM)
    Spot ETF (US) None None (filed)
    Notable partnerships Chainlink, Circle, Dinari, Xiaomi Visa, Shopify, Franklin Templeton
    Stage of adoption Early, high risk Established, mid-cycle

    The blunt read: SOL is a defensible mid-cap bet on continued adoption. SEI is a high-beta bet on Giga execution. SEI has more upside if things go right and materially more downside if they do not.

    What Would Change Our View

    Three specific triggers would move us from the current cautious base case to a more constructive stance:

    1. Giga full mainnet with real throughput. If Sei hits sustained 100k+ TPS on mainnet with sub-second finality, and third-party monitors verify it, that is a re-rate.
    2. Dinari and Chainlink Equities Streams doing measurable volume. Not headlines, actual daily tokenized-stock volume on Sei crossing $10M+ per day.
    3. Fee revenue turning into a real number. Current daily fees of about $5 need to become $500k+ for the token to have a defendable value accrual story.

    If none of the three lands by Q1 2027, the base case likely resolves lower, not higher.

    Frequently Asked Questions

    Will SEI reach $1 in 2026?

    No. Getting from $0.04 to $1 would require a 25x move against a heavy unlock schedule and a weakening chart. Even the most bullish analyst 2026 targets top out around $0.26. A push toward $1 is a multi-cycle scenario, not a 2026 one.

    Is SEI a good investment in 2026?

    SEI is a high-risk, high-upside speculative L1 bet. It is defensible as a small position for investors who accept volatility and believe the Giga upgrade will land. It is not a defensive or mature crypto holding, and it should be sized accordingly.

    What is the Sei Giga upgrade?

    Giga is Sei’s 2026 architectural overhaul that transitions the network to an EVM-only chain built on the Autobahn consensus. It targets over 200,000 TPS and sub-250ms finality. Mainnet rollout began with v6.6 in August 2026 via the Ares and Eidos components.

    Can SEI hit $0.10 in 2026?

    Possible, not probable. Base-case analyst forecasts cluster around $0.08 to $0.09 for late 2026. A $0.10 print would require Giga headlines to line up with a broader altcoin bid. If both happen, $0.10 is on the table. If either misses, it is not.

    Why did SEI drop to an all-time low?

    A combination of scheduled unlocks, weak sector-wide sentiment, and low TVL versus its 2025 peak has kept persistent supply on the market. The Giga rollout has not been enough to force a bid, because traders want to see verified mainnet performance before re-rating the token.

    Where can you buy SEI?

    SEI trades on major centralized exchanges including Binance, Coinbase, KuCoin, and Upbit. The most active pair is SEI/USDT on KuCoin. It is also available on decentralized venues via bridges, though liquidity is deeper on CEXs at current market cap.

    The Honest Take

    SEI is not the trade for anyone who wants clean, low-drama exposure to smart contract platforms. It is a levered bet on one specific thesis: that the Giga upgrade actually ships, the RWA rails actually attract volume, and the Xiaomi distribution actually converts. If that thesis plays out, a move from the current $0.04 back to $0.15 is a plausible 2027 scenario, and the upside case at $0.26 is defensible in the numbers. If the thesis breaks, sub-$0.05 is where the chart wants to go.

    For most investors, the smart move is not a full-conviction position. It is a scaled entry with clear invalidation rules: buy some now, add on verified Giga milestones, exit if fee revenue and TVL fail to materially improve by Q1 2027. That is how a data realist treats a token trading at all-time lows with real catalysts and real risks stapled together. Not a moonshot. A framework.

    Disclaimer: This article is for informational and educational purposes only and should not be construed as financial, investment, or trading advice. Cryptocurrency markets are highly volatile, and past performance does not guarantee future results. The price predictions and analyses presented here are based on AI models, technical indicators, and available data at the time of writing, they are not guarantees. Always conduct your own research (DYOR) and consult with a qualified financial advisor before making any investment decisions. Pump Parade and its authors do not assume liability for financial losses incurred based on information provided in this article.

    Bittensor (TAO) Price Prediction 2026: Can TAO Hit $300?

    Bittensor price prediction 2026 debates keep landing in the same awkward zone: TAO trades near $196 after touching $210 earlier this month, still 74% below its January 2024 all-time high of $758. The token has spent the last 30 days grinding sideways between $183 and $211, and the question every crypto trader is asking is whether the December halving plus the dTAO overhaul is enough to force a real leg higher.

    Here is the setup. Around 70% of TAO’s circulating supply is staked at roughly 10% average yield, per Stakao staking data. Subnet slots doubled from 128 to 256 in the July v4.3.1 upgrade. Grayscale and Bitwise have both filed for spot TAO ETFs. That is a lot of coiled tension on a chart that has done nothing for a month.

    This article breaks down what the data actually says. Current price context, the real bull and bear cases, target ranges by timeframe, how TAO stacks up against its closest AI-infrastructure peer, and the specific triggers that would change our view.

    Key Takeaways

    • TAO trades at $196.20 at time of writing, flat over 30 days and down 74% from its $758 all-time high.
    • Bull case ($300 by Q1 2027): dTAO subnet economy plus subnet slot doubling plus spot ETF approval could compress float against rising demand.
    • Bear case ($130 range): if subnets fail to prove real utility beyond AI narrative, the halving is already priced in and momentum fades.
    • Base case: $210 to $260 range through year-end 2026, with breakout probability rising into the December supply cut.
    • What to watch: SEC ETF decision timing, subnet emission concentration data, and whether TAO holds the $183 support that has defined the 30-day floor.
    Bittensor (TAO) price prediction 2026 hero graphic, current price $196 with dTAO catalyst

    Where Bittensor Stands Today

    Let’s start with the numbers. TAO is a low-float, high-conviction asset, which is why its charts often behave more like a tech stock than a typical L1 token. Binance and Coinbase order books tell you where the market currently prices supply and demand.

    Metric Value
    Price (TAO/USDT) $196.20
    24-hour change -0.61%
    30-day change +0.1% (range-bound)
    30-day high / low $210.80 / $183.50
    All-time high (Jan 2024) $757.79
    Distance from ATH -74.1%
    Approx. supply staked ~70%
    Staking APY range ~8-11%

    Two things jump out. First, TAO has been coiled in a tight 15% range for a month, which is unusual for a token that historically moves 30% in a week. That kind of compression tends to end with a decisive move, not more chop. Second, with the majority of supply locked in staking, the effective float that can pressure spot price is significantly smaller than the circulating supply headline suggests. That matters a lot for the bull thesis.

    Why is Bittensor Range-Bound Right Now?

    Range-bound is a polite way of saying “waiting for a catalyst.” TAO’s 30-day chart looks the way it does because two large forces are cancelling each other out.

    On one side, the network is shipping meaningful upgrades. The v4.3.1 Tooling Overhaul on July 18 doubled subnet capacity and introduced “Conviction” stake-locking for subnet ownership, forcing validators to commit TAO for extended periods. That is structurally bullish because it removes sell pressure and creates real economic skin in the game.

    On the other side, macro AI-narrative rotation has been brutal. Retail flows moved to Solana memecoins and RWA plays through July and early August, and TAO’s holder base is disciplined enough to not panic sell but not motivated enough to accumulate aggressively without a clearer catalyst. The result: a market waiting for either the ETF decision, a fresh subnet breakout, or a broader AI-token revival to break the tie.

    The Bull Case for TAO

    Three specific, verifiable catalysts underpin the bull thesis. This is not narrative arithmetic. Each of these has a real trigger and a real timeline.

    1. Dynamic TAO (dTAO) is Now Live and Working

    The dTAO framework replaced Bittensor’s static reward mechanism with a market-driven system where each subnet gets its own token that trades against TAO. In plain terms: instead of a central committee deciding which subnets earn TAO emissions, the market itself allocates capital to the subnets that produce useful work. Subnet alpha tokens rise and fall based on demand for their AI services, and the underlying TAO backing them compounds.

    The full explanation lives in the TAO.media dTAO guide, but the price-relevant point is this: dTAO turned Bittensor from a niche AI experiment into a real capital-allocation venue. That is the kind of structural change that historically re-rates tokens over 6 to 12 months, not overnight.

    2. Subnet Slot Doubling Expands the Addressable Market

    The July upgrade doubled subnet slots from 128 to 256. Each new subnet is another team competing to earn TAO emissions by producing something valuable: language models, prediction markets, data indexing, voice APIs. More subnets means more use cases, more developer mindshare, and more TAO locked as stake to secure those subnets.

    Not every new subnet will succeed. That is fine. The historical pattern in decentralized ecosystems is that a small number of winners create most of the value, and having 256 slots instead of 128 doubles the surface area for a breakout subnet to emerge.

    3. Spot TAO ETF Filings Are on the SEC Docket

    Grayscale and Bitwise have both filed for spot TAO ETFs. Even a conservative reading of recent ETF approval history suggests the SEC has become more receptive to non-BTC/ETH spot products, and TAO’s market cap is now comfortably above the threshold that historically gates institutional consideration.

    An approval would open passive institutional flows that have historically re-rated ETF tokens by 40-80% in the six months following launch. A denial would not kill the thesis but would push the re-rating catalyst into 2027.

    The Bear Case for TAO

    A serious analyst does not just line up the bull points. Here is what could actually go wrong.

    1. The Halving is Already Priced In

    Bittensor’s December halving cuts emissions by 50%, which is a real supply shock on paper. The problem is that halvings are the most telegraphed events in crypto. Every trader with a calendar has known about this since 2024. The market frequently prices halving supply cuts months in advance, then sells the news when the actual event arrives.

    If TAO does not break out before December, a “sell the halving” playbook becomes more likely, especially if broader crypto conditions weaken.

    2. Subnets Need to Prove Real Utility

    The dTAO market is only as valuable as the subnet outputs it prices. If a critical mass of subnets remains research demos rather than revenue-generating products, the market will eventually reprice TAO to reflect that. As TAO Media noted in coverage of Mark Creaser’s analysis, some subnet operators find the frequent rule changes make dTAO harder to underwrite, which is a real developer-experience risk.

    3. AI Narrative Rotation Risk

    TAO’s price has historically correlated tightly with the broader “AI crypto” trade. If capital rotates to a different narrative, say tokenized RWAs, DeFi restaking, or a fresh L1 cycle, TAO can bleed even if its own fundamentals improve. This is the risk of being the biggest name in a thematic category: your beta cuts both ways.

    What is the Bittensor Price Prediction for 2026?

    Bittensor (TAO) price prediction 2026 targets table, bear $130, base $235, bull $300

    Here is how we break out the ranges. These are scenario estimates, not guarantees. Every one comes with explicit conditions.

    Timeframe Bear Base Bull
    30 days $165 $210 $245
    6 months (into halving) $130 $235 $300
    Long-term (2027-2028) $110 $350 $500-$650

    30-Day View

    Short-term, TAO looks like a coiled spring inside a $183 to $211 range. Our base case is a modest breakout to $210 as either the ETF calendar clarifies or a subnet story catches attention. A break below $183 opens $165. A decisive close above $220 on volume unlocks a fast move to $245.

    6-Month View (Into the December Halving)

    This is where the meat of the trade sits. The bull case ($300) requires TAO to hold the $183 support, get either ETF approval or a credible imminent-approval signal, and see broader AI-crypto strength through Q4. For context, Coinpedia’s 2026 range spans $160 to $500 and Changelly’s model averages closer to $256 for the year, which aligns with our base case.

    The bear case ($130) triggers if the ETF is denied, subnets show weakening usage metrics, and broader crypto rolls over into year-end. That is not our modal outcome but it is not a tail scenario either.

    Long-Term View (2027-2028)

    Two-year targets depend almost entirely on whether Bittensor’s subnet economy captures real AI revenue. If it does, $500 is conservative and $650+ is credible. If it does not, $110 is closer to fair value than $300. This is the binary that defines TAO as an asset.

    How Does TAO Compare to Fetch.ai (FET / ASI)?

    The natural comparison here is the ASI Alliance token (Fetch.ai / SingularityNET / Ocean merger), because both projects sit at the intersection of AI infrastructure and crypto tokenomics. Here is how they stack up on the metrics that actually matter.

    Metric Bittensor (TAO) Fetch.ai (FET/ASI)
    Core model Subnet marketplace for AI compute and services Autonomous agent framework plus alliance-owned models
    Token utility Stake to secure subnets, back alpha tokens Pay for agent services and stake for network security
    Approximate float locked ~70% staked Significantly lower
    ETF filings Grayscale, Bitwise filed None filed to date
    Halving mechanism Yes, next in December 2026 No BTC-style halving
    Institutional custody BitGo, FalconX subnet staking Available on major exchanges
    Distinguishing edge Market-driven capital allocation to AI subnets Agent-first UX, larger consumer surface

    The takeaway: TAO’s edge is the subnet economy and staked-float dynamics. ASI’s edge is a more direct agent-consumer story. They are complements more than substitutes, but if you had to pick one for a pure “AI infra scarcity” trade, TAO’s tokenomics do more of the work. If you want a broader look at the AI-crypto category, our Fetch.ai price prediction and Render price prediction break down the other side of the trade.

    What Would Change Our View

    Three specific triggers would force a reassessment of the base case in either direction.

    Upgrade the base case if: Grayscale or Bitwise spot TAO ETF receives approval or a clear approval signal (public SEC engagement, exchange listing agreement) before the December halving. That combination of institutional access plus a supply cut would materially raise the probability of the $300+ bull path.

    Downgrade the base case if: Aggregate subnet on-chain revenue and usage metrics show sustained decline for two consecutive months. That would confirm the “narrative without utility” bear thesis and pull our target range down to $130 to $180.

    Reassess entirely if: A competing decentralized AI protocol ships a materially better subnet economy or captures a landmark enterprise customer that Bittensor loses. TAO’s category leadership is durable but not guaranteed.

    Frequently Asked Questions

    Is Bittensor a good investment in 2026?

    Bittensor is a higher-risk, higher-conviction bet on decentralized AI. It offers a real supply shock (December halving), an institutional catalyst (ETF filings), and a working market mechanism (dTAO). The bear case is that subnets fail to prove utility. It fits a growth-oriented crypto allocation, not a defensive one.

    Will TAO reach $300 in 2026?

    Our base case sees TAO trading in the $210 to $260 range through year-end, with a bull scenario reaching $300 if the spot ETF is approved and the December halving triggers a supply-shock rally. Reaching $300 in 2026 is realistic but not the modal outcome.

    What is Dynamic TAO (dTAO)?

    Dynamic TAO is Bittensor’s upgraded reward mechanism where each subnet has its own alpha token that trades against TAO. Instead of a central committee allocating emissions, the market decides which subnets are valuable. It turns Bittensor into a capital-allocation venue for AI compute and services.

    How does TAO staking work?

    You delegate TAO to a validator or subnet, which uses your stake to secure the network and earn emissions. Yields currently sit around 8% to 11% APY, though rates vary with total staked supply, subnet performance, and alpha token price movement. Roughly 70% of TAO supply is currently staked.

    When is the next Bittensor halving?

    The next Bittensor halving is scheduled for December 2026 and will cut TAO emissions by 50%. Historically, halvings have been priced in ahead of the event, so watch for accumulation patterns in October and November rather than a spike on the day itself.

    Are there spot TAO ETFs?

    Not yet. Grayscale and Bitwise have both filed spot TAO ETF applications with the SEC. Approval decisions are expected in the coming months. An approved ETF would open passive institutional flows and historically re-rates tokens by 40% to 80% in the first six months.

    The Honest Take

    Bittensor is one of the few crypto assets in 2026 where the tokenomics, the catalyst calendar, and the narrative all line up. That does not make it a guaranteed winner. It makes it a setup worth watching.

    Our reading of the data: TAO is more likely to be higher than $196 six months from now than lower, but the range of outcomes is wide. A $300 print in the bull scenario is credible. A $130 print in the bear scenario is also credible. What is not credible is the flat, do-nothing outcome for another six months, given the volume of catalysts on deck. Position sizing matters more than direction here.

    For traders, the actionable framework is straightforward: watch the $183 support, watch the ETF newsflow, watch the subnet emission concentration data. The setup either resolves higher into the halving or it does not, and the market will tell you which by mid-Q4. If you want to see how another AI-adjacent infrastructure token is positioned into the same cycle, our Kaito price prediction walks through a very different setup on the same AI theme.

    Disclaimer: This article is for informational and educational purposes only and should not be construed as financial, investment, or trading advice. Cryptocurrency markets are highly volatile, and past performance does not guarantee future results. The price predictions and analyses presented here are based on AI models, technical indicators, and available data at the time of writing, they are not guarantees. Always conduct your own research (DYOR) and consult with a qualified financial advisor before making any investment decisions. Pump Parade and its authors do not assume liability for financial losses incurred based on information provided in this article.

    Pump.fun (PUMP) Price Prediction 2026: Can PUMP Hit $0.01?

    Pump.fun’s PUMP token is trading at $0.00277 as of August 15, 2026, down 2.3% on the day and still sitting roughly 65% below its post-listing highs. The PUMP price prediction 2026 conversation has shifted from “will it recover?” to a sharper question: does a $1 billion market cap platform token with a $370 million burn behind it and 50% of revenue locked into open-market buybacks deserve to trade like a dying memecoin, or like the equity-adjacent security holders keep insisting it is?

    Here is what makes this cycle different. Pump.fun crossed $1 billion in lifetime revenue earlier this year. The team has retired 36% of circulating supply via the April buyback-and-burn program. And 131,300 holders are staring at the same chart, wondering whether the August 12 unlock has finally cleared enough overhead supply for a real markup.

    We looked at the on-chain data, the tokenomics math, the SERP consensus, and the analyst targets. This article walks through where PUMP realistically ends 2026, what has to go right for the $0.01 target, and what would push it back under $0.002.

    Key Takeaways

    • Current price: PUMP is at $0.00277, market cap $1.08B, FDV $2.32B, on $29M in daily volume.
    • Bull case: A sustained buyback pace of ~$45M/month, plus Project Ascend adoption, could push PUMP back toward $0.007-$0.010 by year-end 2026.
    • Bear case: The August 12 unlock (6.875B tokens) landed on top of a much larger July tranche. Continued supply pressure keeps PUMP capped at $0.002-$0.0035.
    • Focus keyphrase target: Realistic 2026 range is $0.0018 (bear) to $0.010 (bull), with a base case near $0.0055.
    • Watch these levels: $0.0032 as first resistance, $0.0021 as the line that separates “consolidation” from “capitulation”.
    Pump.fun (PUMP) price prediction 2026 hero graphic, current price $0.00277, $0.01 target

    Where PUMP Stands Today

    Before we get to the targets, the snapshot. Every prediction below is anchored to these numbers, pulled from Birdeye and cross-checked against CoinPaprika at the time of writing.

    Metric Value
    Price $0.00277
    24h change -2.34%
    Market cap ~$1.08B
    Fully diluted valuation $2.33B
    24h volume $29.3M
    Circulating supply 392.05B PUMP
    Total supply 1,000,000,000,000 PUMP
    Holders 131,300
    All-time high (July 2025 launch peak) ~$0.0068
    % from ATH -59%

    Two things jump out. First, the FDV-to-market-cap ratio is over 2x, which is the polite way of saying a lot of supply is still locked. Second, volume relative to market cap sits at roughly 2.7% daily, which is healthy for a top-100 token but not the kind of turnover you get in a runaway bull market. This is a token in accumulation, not distribution.

    Why is PUMP trading range-bound right now?

    The short answer: unlocks. The longer answer requires a look at the vesting schedule.

    In July 2026, roughly 82.5 billion PUMP tokens were unlocked to team members and early investors, per DeFiLlama’s unlock tracker. That is a hair over 8% of total supply landing on the market inside a single month. The 6.875 billion PUMP tranche on August 12 was smaller (roughly 0.69% of total supply, worth $10-16 million at spot), but it landed on a market that had already spent three weeks absorbing the July tsunami.

    The price action reflects it. PUMP has been pinned between $0.0021 support and $0.0032 resistance for most of the summer, printing lower highs on any bounce and finding buyers only when circulating supply gets absorbed by the buyback program. That is textbook post-unlock digestion, and it usually resolves in one of two ways: a breakout once supply overhang clears, or a slow bleed as insiders keep distributing.

    Which one we get depends on the bull case and the bear case below.

    How high could PUMP realistically go? The bull case

    1. The buyback program is real, and it compounds

    In April 2026, Pump.fun burned $370 million in PUMP tokens, retiring 36% of circulating supply in a single event. The team then locked 50% of net platform revenue into an irreversible buyback-and-burn smart contract, per reporting from Bitcoin.com News. The other 50% goes to operations, hiring, and product investment.

    At current revenue run-rates, that is roughly $45 million per month in ongoing buybacks, or over $500 million annualized. In plain terms: the protocol is systematically shrinking its own float. Every month the buyback runs, the tokens available to sell get smaller and the tokens tied to protocol economics get more concentrated. That is a slow-motion supply shock if usage holds.

    2. Project Ascend gives the token a use case beyond speculation

    Project Ascend, Pump.fun’s creator revenue-share program, lets token creators earn up to 0.9% of their coin’s trading volume. That has pulled a wave of creators back to the platform after the 2025 slump, and volumes on Pumpswap have started climbing again. The livestreaming feature, revived in Q2, is bringing back the reflexivity that made Pump.fun a $1 billion revenue business in the first place.

    The bull thesis here is not complicated. More creators means more coins launched, which means more trading, which means more fees, which means more buybacks. Reflexivity works in both directions.

    3. Solana ecosystem tailwinds

    PUMP is a Solana-native token, and Solana itself is trading around $75 with a base case for the year sitting closer to $150 (see our SOL price prediction 2026 for the full breakdown). If SOL breaks out, launchpad activity historically follows within weeks. And PUMP still commands the majority of Solana launchpad volume despite competition from Believe and newer entrants, as we detailed in our Pump.fun vs Believe comparison.

    What could keep PUMP under $0.003? The bear case

    1. The unlock schedule stretches to 2028

    The vesting schedule is a 12-month cliff (ended July 2026) followed by a three-year linear release. That means monthly supply pressure from insider distributions is going to be a fact of life through 2028. Even at a modest 1% per month, that is another 100 billion tokens flowing into the market over the next 24 months. The buyback program has to run hot just to keep pace with net dilution.

    2. Memecoin demand is cyclical, and the cycle is aging

    Pump.fun’s revenue is a direct function of memecoin speculation. When retail leaves, volumes collapse, fees drop, and the buyback thins. We saw this happen in Q4 2025, when PUMP touched $0.0012 and skeptics called it dead. If memecoin fatigue returns and volumes drop 40-50%, the buyback pace roughly halves, and the supply-shock thesis stops working.

    3. Regulatory overhang is real

    Launchpad tokens sit in an uncomfortable regulatory bucket. The platform generates fees on speculative asset issuance, and the token accrues value from those fees. In some jurisdictions that reads a lot like an unregistered securities operation. Nothing has been filed to date, but the risk premium is not zero and it does not go away.

    PUMP Price Prediction 2026: Targets by Timeframe

    Pump.fun (PUMP) price prediction 2026 targets table, bear $0.0020, base $0.0055, bull $0.0100

    Our framework blends three inputs: the buyback burn rate, the unlock schedule, and comparable launchpad token multiples. Here are the ranges we think matter, with bear, base, and bull scenarios for each horizon.

    Timeframe Bear Base Bull
    30 days $0.0018 $0.0028 $0.0042
    6 months $0.0022 $0.0045 $0.0075
    End of 2026 $0.0020 $0.0055 $0.0100
    2027-2028 $0.0015 $0.0080 $0.0150

    30-day outlook

    Near-term, PUMP is a range trade. Bear scenario: the August unlock keeps selling into rallies and PUMP retests $0.0018-$0.0020. Base case: the range holds and PUMP consolidates around $0.0028. Bull scenario: buybacks absorb the unlock, PUMP reclaims $0.0032 resistance and squeezes to $0.0042, its first meaningful markup since the burn event.

    6-month outlook

    By early 2027, the buyback program will have retired another $270 million in supply if revenue holds. That is real fuel. Coindcx projections cluster around $0.0034-$0.0037 for early 2026, but we think that undershoots the burn effect. Our base case of $0.0045 lines up with a modest 60% recovery from current levels. The bull case at $0.0075 requires SOL trading above $120 and Pumpswap volumes at 2025 highs.

    End of 2026 and beyond

    The $0.01 target is the headline number, and it is achievable but not the base case. To hit $0.01, PUMP needs a market cap around $3.9 billion on current circulating supply, which is roughly where Hyperliquid’s HYPE token trades on comparable revenue. It is directionally possible. It requires no major regulatory shock, sustained buyback pace, and a broader crypto tailwind. The base case of $0.0055 assumes one of those three cracks. The bear case at $0.0020 assumes at least two do.

    For reference, cryptonews.com published a base case of $0.005 for end-2026 with a bull of $0.011, and 99bitcoins put the upper bound at $0.012 in a similar reflexive-growth scenario. Our targets are anchored slightly below theirs because we discount the buyback impact for realized rather than announced burns.

    How does PUMP compare to Believe and other launchpad tokens?

    PUMP is not the only game in town anymore. Believe launched a competing product in late 2025, and a handful of Ethereum-side launchpads are trying to replicate the model. Here is how PUMP stacks up on the metrics that matter.

    Metric PUMP (Pump.fun) BELIEVE
    Market cap $1.08B ~$180M
    FDV $2.33B ~$450M
    Lifetime revenue $1B+ ~$85M
    Buyback mechanism 50% of net revenue, irreversible smart contract 25% revenue share, discretionary
    Daily launches (30d avg) ~14,000 ~2,200
    Solana volume share ~62% ~11%
    Holder count 131,300 ~28,000
    Supply unlock risk High through 2028 Moderate through 2027

    The comparison flatters PUMP on scale and mechanism, but it also highlights why PUMP is not trading at $0.01 today: FDV is more than double market cap. That gap is what the buyback program is designed to close over time.

    What Would Change Our View

    Three scenario triggers would force us to reweight the bear-base-bull distribution.

    1. If Pumpswap volume drops below $50M/day for a full month: that would signal creator flight or memecoin fatigue, and the buyback thesis stops compounding. Base case moves down toward the bear.

    2. If a regulatory action names Pump.fun specifically: the platform’s structure makes it a plausible target for the SEC or comparable EU bodies. A formal action would compress the FDV-to-market-cap gap the wrong way. Not a probability we can weight precisely, but the tail risk is real.

    3. If cumulative buybacks cross $500M and PUMP is still under $0.003: that is the point at which the market is telling us the burn does not matter. If we get there, we cut base and bull targets by 30%.

    Frequently Asked Questions

    Will PUMP reach $0.01 in 2026?

    Reaching $0.01 in 2026 is possible but not our base case. It would require a market cap near $3.9 billion, sustained buyback pressure, and no major regulatory setbacks. Our base case for end-2026 is $0.0055, with $0.010 as the bull scenario. A move to $0.01 becomes more likely in 2027 if the burn program continues at its current pace.

    Is PUMP a good investment right now?

    PUMP is a high-risk, high-conviction bet on continued memecoin activity and the buyback mechanism. It suits investors comfortable with speculative platform tokens who can tolerate 40-60% drawdowns. It is not appropriate for risk-averse investors or anyone who cannot hold through the multi-year unlock schedule.

    What is the PUMP price prediction for 2027?

    Our 2027-2028 range is $0.0015 on the bear end to $0.0150 on the bull end, with a base case of $0.008. The wide range reflects the compounding uncertainty of unlock supply, buyback effectiveness, and where the broader crypto cycle sits by then.

    How does the PUMP buyback program work?

    Pump.fun routes 50% of net revenue from the Bonding Curve, Pumpswap, and Terminal into a smart contract that automatically buys PUMP on the open market and burns the tokens. The contract is described as irreversible. Cumulative buybacks have exceeded $350 million as of mid-2026.

    Will the PUMP unlock crash the price?

    The August 12, 2026 unlock added roughly 6.875 billion PUMP (about 0.69% of total supply, worth $10-16 million). That is small enough for the buyback program to absorb over a few weeks. The larger July 2026 tranche (82.5 billion tokens) was the harder digest. Barring further large unlocks, the immediate crash risk from vesting is modest.

    What is the highest PUMP could realistically go?

    In a genuinely bullish 2027-2028 environment with sustained buybacks and SOL trading above $250, we see a plausible ceiling near $0.015. Analyst forecasts from Coinbase and 99bitcoins have hit as high as $0.02 in extreme scenarios, but those require assumptions we are not willing to underwrite as a base case.

    The Honest Take

    PUMP is not a bad token. It is not a great token either. It is a fair value bet on a real business that is systematically shrinking its own supply, weighed against an unlock schedule that will drip sellers into the market for two more years.

    The framework we would use: if you believe memecoin culture is a persistent feature of crypto and not a passing phase, PUMP is a rational way to express that view. The buyback program is one of the most aggressive in the sector, and the platform’s revenue is real. If you believe launchpad tokens are just another cycle that will fade with the next narrative, PUMP is a value trap and the unlock schedule will finish what fatigue starts.

    Our base case has PUMP ending 2026 around $0.0055, roughly double current spot. That is a rational return for a token with this risk profile, but it is not a moonshot. If you came here looking for a “PUMP to $0.10” thesis, this is not that article. The math does not support it inside 24 months.

    Watch $0.0032 as the level that flips this from range to trend. Watch $0.0021 as the line that separates consolidation from capitulation. Everything else is noise.

    Data sources: Birdeye for real-time price, DeFiLlama Unlocks for vesting schedule, on-chain buyback tracker for burn totals. Analyst comparisons via cryptonews.com, 99bitcoins, and Coindcx. See our Solana DEX landscape breakdown for related coverage.

    Disclaimer: This article is for informational and educational purposes only and should not be construed as financial, investment, or trading advice. Cryptocurrency markets are highly volatile, and past performance does not guarantee future results. The price predictions and analyses presented here are based on AI models, technical indicators, and available data at the time of writing, they are not guarantees. Always conduct your own research (DYOR) and consult with a qualified financial advisor before making any investment decisions. Pump Parade and its authors do not assume liability for financial losses incurred based on information provided in this article.