More
    Home Blog Page 9

    NEAR Protocol Price Prediction 2026: Can NEAR Hit $3?

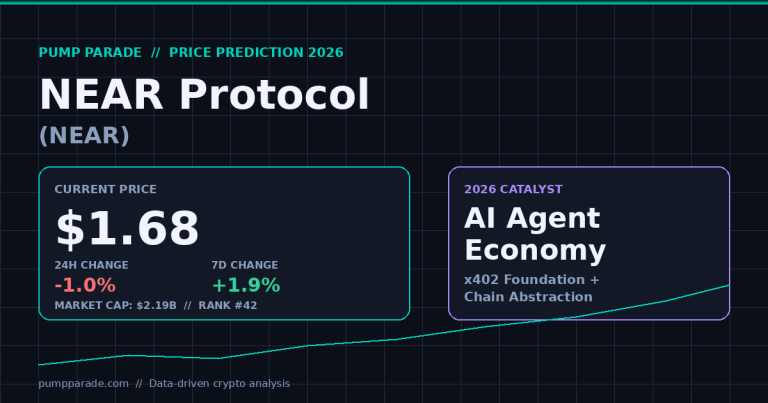
    NEAR Protocol trades at $1.68 at time of writing, up 1.9% over the past week and holding above the $1.60 support that has caught every wick since late June. On paper, the chart looks like nothing much is happening. Under the hood, one of the busiest chain abstraction rollouts of 2026 is quietly turning NEAR into the AI agent economy’s plumbing.

    That is the tension driving this NEAR price prediction 2026. The token still sits 91.8% below its 2022 all-time high of $20.40, so headline sentiment is muted. But the on-chain story tells a different one. NEAR Intents has processed more than $24 billion in cumulative swap volume and is running at an annualised gross fee rate near $40 million. Ledger just wired NEAR-powered swaps into 7.5 million wallets. And the NEAR Foundation joined the x402 Foundation in July to help build the payments layer for autonomous agents.

    Here is what this article covers: current price context, why the tape looks calm while fundamentals ramp, the bull case, the bear case, our 30-day and 6-month and long-term targets, how NEAR compares with Solana on the same metrics, and the scenarios that would flip our view.

    Key Takeaways

    • Current price: $1.68, market cap $2.19B, rank #42, down 91.8% from the 2022 ATH.
    • Base case for year-end 2026: $2.60, driven by continued NEAR Intents fee growth and the AI agent narrative.
    • Bull case: $3.30 if Layer 1 AI infra flows accelerate and one large consumer app adopts Chain Signatures.
    • Bear case: $0.80 to $1.00 if the broader L1 narrative unwinds and NEAR’s storage staking model fails to absorb supply.
    • Primary catalysts: x402 Foundation integration, Confidential Intents general availability, Ledger native swap support, and the NEAR AI research pipeline.
    • Primary risks: a 1.3 billion token uncapped supply, a 91% drawdown that has capped every rally since 2022, and Solana’s dominance in the same L1 AI conversation.
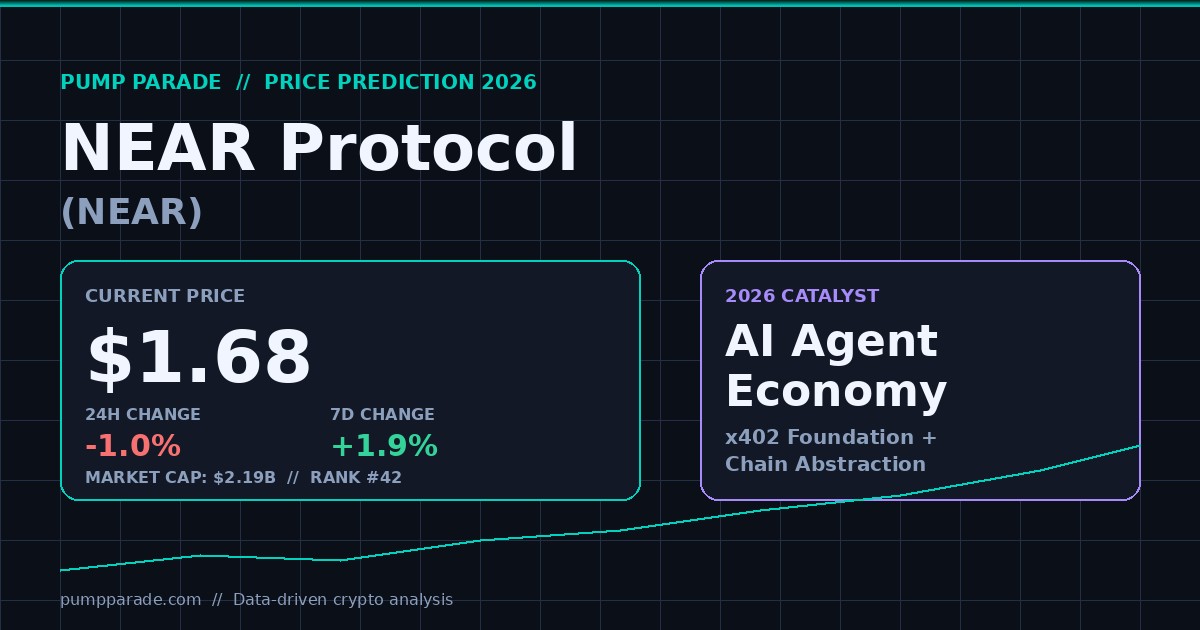
    NEAR Protocol (NEAR) price prediction 2026 hero graphic showing current price $1.68 and AI agent economy catalyst

    Where NEAR Stands Today

    Here is the snapshot at time of writing. All numbers pulled from live market data on August 6, 2026.

    Metric Value
    Price $1.6817
    24-hour change -1.03%
    7-day change +1.86%
    Market cap $2.19B
    24-hour volume $106M
    Market cap rank #42
    All-time high $20.40 (Jan 2022)
    % from ATH -91.8%
    Total supply 1.30B (uncapped)

    Two things stand out. First, the 24-hour move is a rounding error. NEAR is compressing inside a tight $1.60 to $1.80 range that has held for most of July. Second, the ranking. NEAR sits at #42 by market cap. In the same L1 AI conversation, Solana is at rank #7 with a $42 billion cap. That gap defines both the risk and the opportunity here.

    Why Is NEAR Range-Bound Right Now?

    The short answer: the market has not decided whether NEAR is an AI infrastructure play or a stale 2021 L1 that missed its window. Both narratives have evidence, and neither has fully won.

    The bull evidence keeps stacking up. Confidential Intents went generally available on July 7. That is the layer that lets agents execute cross-chain trades without exposing strategy, wallet balances, or counterparty. Ledger integrated NEAR Intents natively into its wallet update, which puts a chain-abstracted swap flow in front of 7.5 million hardware wallet users. And on July 14 the NEAR Foundation joined the x402 Foundation, a group focused on payment rails for autonomous agents.

    The bear evidence is simpler. The token still trades at a 91.8% drawdown. The AI narrative has been running for two years, and NEAR has not broken $10 in that window. Every rally since Q1 2024 has been sold. That is not a story about fundamentals. It is a story about supply.

    The Bull Case

    Three catalysts underpin the constructive view.

    1. NEAR Intents is turning into real revenue

    The number that matters is $40 million. That is the annualised gross fee run-rate NEAR Intents is producing as of August 2026, based on cumulative swap volume of $24 billion. Fee revenue is the closest thing crypto has to a P&L. When protocol fees are real and growing, the token has a claim on something. NEAR’s staking model does not distribute fees directly, but sustained volume tightens the case for storage staking demand as more agents deploy on the network.

    2. Chain Signatures is a genuine differentiator

    Chain Signatures lets a NEAR-hosted agent sign transactions on Bitcoin, Ethereum, Solana, and other chains without a bridge. That is not incremental. It changes what an autonomous agent can do without asking a user to sign twenty times. If one of the big consumer wallets or exchanges builds on this before Solana or another competitor ships a comparable primitive, NEAR captures the developer mindshare that a decade of L1 wars have not produced.

    3. The 91% drawdown means positioning is light

    This one is technical. NEAR ran to $20 in early 2022 and has spent the past four years bleeding. Anyone who bought that top and has not capitulated is long gone. The wallets holding NEAR today are either recent buyers with a low cost basis or long-term believers. That structure sets up asymmetrically for upside if the narrative catches. There is very little overhead supply from bag-holders until roughly the $5 to $7 zone.

    The Bear Case

    1. The uncapped supply is a real weight

    NEAR has 1.30 billion tokens in total supply against a market cap under $2.2 billion. The token model has no hard cap, and issuance funds validators and the ecosystem. As long as new supply enters the market faster than storage staking absorbs it, price faces a mechanical headwind. This is not a fatal flaw. Ethereum has the same shape. But at NEAR’s current fee base, the burn does not offset issuance.

    2. Solana is winning the same fight

    Every argument for NEAR as AI infrastructure is an argument Solana partisans can make with more revenue, more developers, and better retail distribution. Solana’s fee revenue and daily active addresses dwarf NEAR’s by an order of magnitude. If AI agents converge on one chain, the base case is that it is Solana or Ethereum, not NEAR. Chain abstraction is a smart response to that reality, but response is not the same as win.

    3. The chart has taught traders to fade rallies

    Every meaningful NEAR bounce since 2022 has failed at a lower high. Traders who have watched that pattern will sell strength until it stops working. Base-case forecasts of $1.70 to $2.20 for late 2026 from third-party analysts reflect this. If the range breaks down before it breaks up, momentum sellers will pile on and $1.20 becomes the next magnet.

    NEAR Price Prediction 2026: Targets by Timeframe
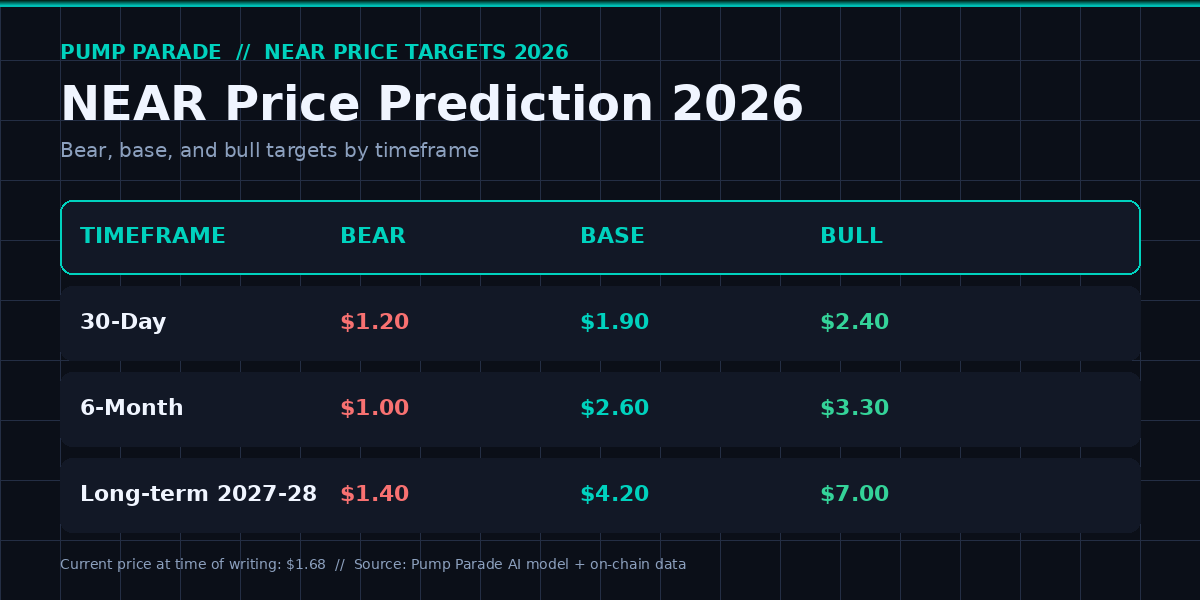
    NEAR Protocol (NEAR) price prediction 2026 targets table with bear $1.20, base $2.60, and bull $3.30

    Here is how the Pump Parade hybrid model reads the setup across three horizons. The model blends technical structure, on-chain activity, tokenomics, and sector sentiment. Third-party targets from CoinGecko and independent research aggregators like Messari cluster in a similar zone, with base cases near $2.00 to $2.60 for year-end and stretch projections landing between $3.30 and $4.20 for the bull scenario.

    30-Day Outlook: $1.20 bear / $1.90 base / $2.40 bull

    The token is compressed. A 30-day base case of $1.90 assumes the range holds and one of the pending Intents or NEAR AI announcements gives buyers a reason to push. The bull case at $2.40 needs a broader crypto-wide risk-on move plus a specific NEAR catalyst. The bear case at $1.20 opens up if BTC dominance rips higher and altcoin liquidity dries out.

    6-Month Outlook: $1.00 bear / $2.60 base / $3.30 bull

    Six months out, the AI agent narrative should have a verdict. Either the x402 integration and Confidential Intents are producing measurable app adoption, or they are not. The base case assumes gradual growth. The bull case assumes a headline consumer partnership. The bear case assumes AI infrastructure narratives rotate into different tickers entirely.

    Long-Term Outlook (2027 to 2028): $1.40 bear / $4.20 base / $7.00 bull

    The long-term picture is the most interesting. If NEAR captures even 5% of the AI agent chain market by 2028, the base case of $4.20 is conservative. The bull case at $7.00 assumes a genuine ETF conversation opens for L1 AI tokens, similar to what happened with Solana. The bear case of $1.40 is what happens if the technology ships and the market simply does not care.

    How Does NEAR Compare to Solana on AI Metrics?

    Solana is the closest peer on narrative. Here is the side-by-side on the metrics that matter for the AI agent thesis.

    Metric NEAR Solana
    Current price $1.68 $73.17
    Market cap $2.19B $42.53B
    Rank #42 #7
    % from ATH -91.8% -75%
    Signature primitive Chain Signatures Sub-second finality
    Consensus Nightshade sharding Proof of History + Tower BFT
    Retail wallet reach Ledger, MyNearWallet Phantom, Backpack, Solflare
    Fee revenue (annualised) ~$40M Intents fees Billions in network fees

    Solana wins on distribution and current revenue. NEAR wins on the specific chain abstraction primitive. That is the trade a NEAR position expresses: you are paying much less market cap for a differentiated primitive that may or may not become the standard. If you want a broader view on the L1 competition, the Ethereum price prediction makes a useful anchor for how these narratives get priced when scale is proven versus promised.

    Will NEAR Reach $5 in 2026?

    Short answer: probably not in 2026, more plausibly in the 2027 to 2028 window.

    For NEAR to sustain $5, market cap needs to run to roughly $6.5 billion at current supply. That is a triple from here. It has happened before in this cycle. It has not happened in a range this tight without a real catalyst break. The most realistic path is: base case $2.60 by year-end 2026, then a re-rating in the following cycle if agent economy adoption becomes obvious rather than theoretical. Standard Chartered has published bank-analyst targets for peers like Ethereum and Solana. They have not published one for NEAR, which itself tells you where NEAR sits on the institutional radar.

    What Would Change Our View

    Three specific signals would move us bullish or bearish beyond the ranges above.

    1. Bullish trigger: a top-10 exchange or a major consumer wallet integrates Chain Signatures as a default primitive. That would push AI agent developers to build on NEAR rather than route around it. Target revision: base case to $3.50, bull case to $6.00 for year-end 2026.
    2. Bearish trigger: NEAR Intents monthly volume declines for two consecutive months. Fee revenue is the load-bearing wall of the current thesis. If it cracks, targets compress. Target revision: base case to $1.40, bear case to $0.60.
    3. Regime change: a spot L1 AI ETF filing is accepted by the SEC for review. This is a low-probability, high-impact event. It would re-rate the entire AI token basket and NEAR would trade like a proxy. Bull case would extend to $10 in a 12-month window.

    Frequently Asked Questions

    Will NEAR reach $10 in 2026?

    Reaching $10 in 2026 would require a market cap above $13 billion at current supply, roughly 6x from here. That is possible only in a full-cycle altcoin blow-off top combined with a NEAR-specific catalyst. The base case does not include it. A more plausible timeline for $10 is 2027 to 2028 if the AI agent thesis compounds.

    Is NEAR Protocol a good investment in 2026?

    NEAR is a high-variance bet on the AI agent economy adopting chain abstraction as the default. If that thesis plays out, the risk-reward from a $2.19 billion market cap is attractive. If it does not, NEAR looks like every other L1 that missed its shot. Position sizing should reflect that binary shape.

    What is the NEAR Protocol used for?

    NEAR is a Layer 1 blockchain built on the Nightshade sharding design, focused on account abstraction, low fees, and chain abstraction. Its flagship products in 2026 are NEAR Intents, a cross-chain execution API, and Chain Signatures, which lets NEAR-hosted logic sign transactions on other blockchains without bridges.

    Why is NEAR price surging on some days but flat overall?

    Individual green days come from partnership announcements or AI narrative rotations. The flat overall tape reflects heavy supply pressure from an uncapped issuance schedule plus persistent selling from traders who have watched every rally fail since 2022. The setup needs a durable narrative shift to break out.

    How does NEAR compare to Solana for AI agents?

    Solana has more developers, more revenue, and better distribution today. NEAR has a specific primitive, Chain Signatures, that Solana does not yet ship natively. The trade-off is scale-now versus differentiated-later. Diversifying across both is a common institutional stance if you want L1 AI exposure without picking one winner.

    What is chain abstraction and why does it matter for NEAR?

    Chain abstraction removes the requirement that users choose or understand which blockchain they are on. NEAR Intents and Chain Signatures deliver this: a user asks for an outcome, NEAR handles routing and signing across chains. For autonomous agents that need to trade or pay across ecosystems without user prompts, this is core infrastructure. If it becomes the standard pattern, NEAR captures a slice of that flow.

    The Honest Take

    NEAR at $1.68 is neither obvious upside nor an easy short. The fundamentals are moving in the right direction, and the token has been in penalty box for so long that positioning is clean. But the ranking says the market is not paying for it yet, and the uncapped supply is a real headwind.

    The base case at $2.60 by year-end is a reasonable expectation, not a stretch. The bull case at $3.30 needs one specific catalyst to land. The long-term case above $4 depends on whether chain abstraction becomes a standard pattern or a footnote. NEAR is the highest-quality asymmetric bet in the L1 AI category right now, but asymmetric means the downside is real too. Position accordingly. For traders looking at how the AI narrative is playing out across smaller caps, our Fetch.ai price prediction covers a different corner of the same theme.

    Disclaimer: This article is for informational and educational purposes only and should not be construed as financial, investment, or trading advice. Cryptocurrency markets are highly volatile, and past performance does not guarantee future results. The price predictions and analyses presented here are based on AI models, technical indicators, and available data at the time of writing, and are not guarantees. Always conduct your own research (DYOR) and consult with a qualified financial advisor before making any investment decisions. Pump Parade and its authors do not assume liability for financial losses incurred based on information provided in this article.
    Zcash (ZEC) Price Prediction 2026: Can ZEC Hit $800?

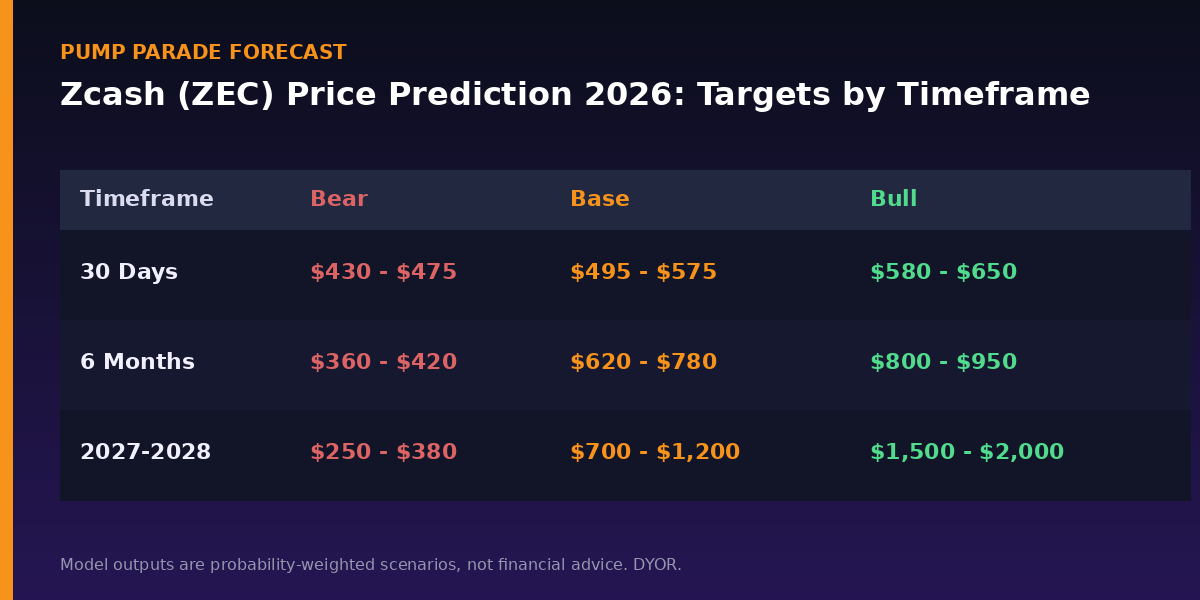
    Zcash (ZEC) is trading at $517.13, up 6.7% in the last 24 hours, up 12% this week, and up more than 1,300% over the past year. Very few large-cap assets have printed that kind of chart in 2026. Which is exactly why the Zcash price prediction 2026 conversation just got a lot more interesting.

    The privacy coin has now spent months consolidating above the $480 level that acted as a brick wall through the spring. Whales are quietly accumulating. Grayscale filed for a spot ZEC ETF. The Ironwood upgrade shipped without a hitch. And the next big one, Network Upgrade 7 (NU7), is already live on testnet.

    Below, we break down where ZEC stands today, the real catalysts driving it, the honest bear case, and a bracketed price forecast for the next 30 days, 6 months, and long term.

    Key Takeaways

    • ZEC trades at $517, up 16% in 30 days and up 41% in 60 days, holding above the key $480 resistance-turned-support zone.
    • Grayscale’s ZCSH spot ETF filing on May 12, 2026 is the first US spot privacy-coin ETF filing in history. Projected inflows: $500M to $2B against a $8.7B market cap.
    • The Ironwood (NU6.3) upgrade migrated more than 500,000 ZEC into a new shielded pool in July. NU7 testnet is live and targets a 300% shielded-transaction speed boost.
    • Our base case for year-end 2026 sits in the $620 to $780 range. Bull case: $800 to $950. Bear case: retest of $360 to $420.
    • The single biggest risk: ZEC is now 5x its October 2025 base. A macro deleveraging event could compress the move faster than the ETF narrative can catch up.
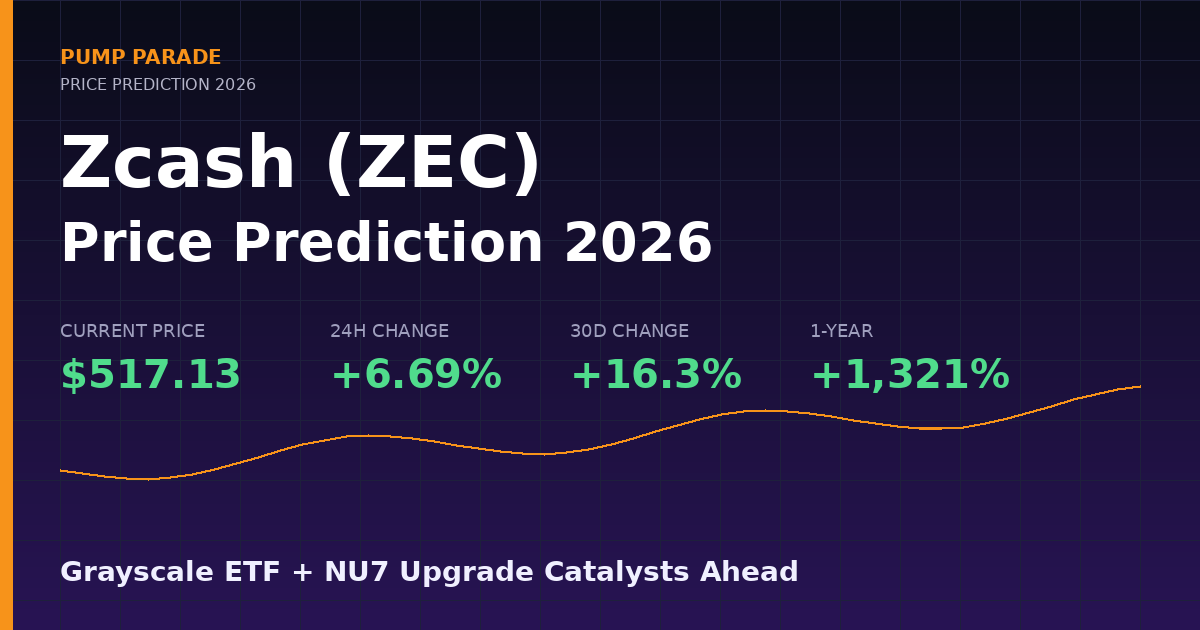
    Zcash (ZEC) price prediction 2026 hero graphic, current price $517 with Grayscale ETF and NU7 upgrade catalysts ahead

    Where Does Zcash Stand Today?

    ZEC has quietly become one of the most talked-about names in the top 20. The coin is now the #14 largest cryptocurrency by market cap, sitting between Zcash and other mid-cap names that most traders were ignoring six months ago.

    Here is the snapshot as of publication.

    Metric Value
    Price $517.13
    24h change +6.69%
    7d change +11.95%
    30d change +16.34%
    1-year return +1,321.8%
    Market cap $8.68B
    24h volume $229.6M
    Market cap rank #14
    All-time high $3,191.93 (Oct 2016)
    % from ATH -83.8%
    Circulating supply 16.86M ZEC
    Max supply 21M ZEC

    Data source: CoinGecko, at time of writing.

    Two things jump out. First, the 1-year return is a full 13x, which puts ZEC in the same neighborhood as some of 2025’s best memecoins, except this is a fixed-supply, PoW-secured, 10-year-old asset. Second, despite the move, ZEC is still 83.8% below its 2016 all-time high. In percentage terms, this is one of the deepest recoveries in the top 20.

    Why is Zcash rallying so hard right now?

    The rally is not random. Four distinct catalysts stacked into the same window between late 2025 and mid-2026, and the market is still pricing in what they mean together.

    The first is regulatory. The US SEC quietly closed a roughly two-year investigation touching the Zcash ecosystem in late 2025. That single decision removed the largest structural overhang on the asset. The second is the November 2024 halving, which cut daily ZEC issuance from around 3,600 to 1,800 coins. Supply-side math finally started catching up in early 2026.

    The third is on-chain adoption. Zcash’s shielded pool went from 11% to 30% of total supply in a single year, more growth than the previous eight years combined, according to Delphi Digital. Shielded ZEC tends to stay shielded, which turns it into a functional supply sink. The fourth is Grayscale’s May 12, 2026 spot-ETF filing, which we cover below.

    The Bull Case for ZEC

    Grayscale ZCSH ETF could unlock institutional flows

    Grayscale’s Form S-3 filing to convert its Zcash Trust into a spot ETF on NYSE Arca (proposed ticker: ZCSH) is the first US spot privacy-coin ETF filing in history. Analyst estimates for potential inflows range from $500 million to $2 billion against ZEC’s roughly $8.7B market cap. Even the low end of that range is meaningful. For comparison, Litecoin ETF filings drove a similar re-rating in the mid-cap PoW cohort, and you can read our take on that setup in the Litecoin ETF Test analysis.

    NU7 upgrade brings a 300% speed boost and shielded assets

    Network Upgrade 7 is the biggest technical release on the roadmap. Testnet is already live as of May 2026, doubling shielded transactions-per-second and cutting block times from 75 seconds to 25 seconds. The upgrade also introduces Zcash Shielded Assets and a network sustainability mechanism that has more than 90% community support. This is a real product improvement, not a rebrand.

    Shielded supply is acting like a supply sink

    The move from 11% to 30% of supply into the shielded pool is a structural change to ZEC’s liquid float. When coins enter shielded pools, they tend to stay there for months. If the trend continues at even half the current pace, roughly 5 to 6 million ZEC could be functionally locked by late 2026, which meaningfully tightens the sellable supply against fresh demand from an ETF wrapper.

    The Bear Case for ZEC

    The rally is already extended

    Up 41% in 60 days and up 1,300% in a year is exactly the kind of setup where mean reversion happens fast. If ZEC closes below the $480 level on high volume, the next major support cluster sits at $420, then $360. A retest of those levels would still leave ZEC up roughly 4x on the year, but it would sting for anyone entering above $500.

    ETF approval is not a guarantee

    Grayscale’s Litecoin ETF took years. The privacy-coin narrative is meaningfully more sensitive from a regulatory standpoint, and the SEC could delay ZCSH indefinitely without formally rejecting it. If the market re-prices the ETF probability from “likely 2026” to “maybe 2027,” a 20% to 30% drawdown is easy to model.

    Privacy narrative could turn into privacy target

    Monero (XMR) was quietly delisted from most regulated exchanges over the past two years. Zcash’s optional-shielded design has protected it so far, but regulatory posture can shift. Any move that pressures major US exchanges to delist ZEC would be an existential shock, even if the probability is low.

    Zcash Price Prediction 2026: Targets by Timeframe

    Zcash (ZEC) price prediction 2026 targets table, bear $360 base $700 bull $950 across 30-day, 6-month, and long-term horizons

    Our hybrid AI model outputs the following ranges. These are probability-weighted scenarios, not guarantees.

    30-day outlook (through early September 2026)

    Base case: $495 to $575. Bull case: $580 to $650 if ETF filing progress is announced or NU7 lands a mainnet activation date. Bear case: $430 to $475 on a broader risk-off macro move. The chart is compressed above $480, which usually resolves in a directional move within 3 to 5 weeks.

    6-month outlook (through Q1 2027)

    Base case: $620 to $780. This range assumes NU7 mainnet activation lands on schedule and the ETF process makes visible progress. Bull case: $800 to $950 if the ETF gets approved by the SEC and inflows track anywhere near the $500M lower estimate. Bear case: $360 to $420 if ETF is delayed and macro liquidity contracts.

    Long-term outlook (2027-2028)

    Base case: $700 to $1,200. Bull case: $1,500 to $2,000 if Zcash captures the privacy-coin ETF category the way Bitcoin captured the digital-gold ETF category. That would still leave ZEC roughly 40% below its 2016 all-time high, which is not an aggressive assumption. Bear case: $250 to $380 if the privacy narrative fades and rebases the multi-year uptrend.

    For comparison, Changelly models a 2026 range of $363 to $2,235. PricePrediction.net’s average sits at $560. Coinbase’s methodology outputs a midpoint around $600. Our base case is more conservative than the most bullish analysts and more bullish than the most cautious ones, which is where we usually try to land.

    How Does Zcash Compare to Monero?

    Zcash and Monero are the two names people compare when they say “privacy coin,” and the two projects have taken structurally different paths. Here is a head-to-head on the metrics that matter for a 2026 investment case.

    Metric Zcash (ZEC) Monero (XMR)
    Price $517 $352
    Market cap $8.68B $6.4B
    Privacy model Optional (shielded or transparent) Mandatory by default
    Regulated exchange listings Coinbase, Robinhood, Phemex Delisted from most major US venues
    ETF pathway Grayscale ZCSH filing active None credible
    Max supply 21M (fixed) 18.4M cap plus 0.6 XMR tail emission
    30d return +16.3% +10.5%
    Institutional endorsements Multicoin Capital public thesis Grassroots privacy community

    In plain terms: Monero has the stronger technical privacy profile, but Zcash has the cleaner mainstream on-ramp. For a 2026 investment thesis built around ETF flows and regulated liquidity, ZEC is the more actionable trade. For a pure privacy thesis, XMR still wins on architecture. Our full breakdown of the other side of the trade is in the Monero (XMR) Price Prediction 2026 article.

    What Would Change Our View

    Three explicit triggers would force us to revise this outlook.

    Bullish trigger: The SEC formally acknowledges the ZCSH filing on the accelerated review track, or a competing spot ZEC ETF gets filed by a top-3 issuer. Either event would push our base case toward the $800 to $950 range within weeks.

    Bearish trigger: A sustained close below $460 on rising volume, combined with any regulatory statement casting doubt on privacy-coin ETF approval. That combination would open the door to a full retest of the $360 zone.

    Regime-change trigger: Announcement that NU7 mainnet activation is delayed past Q1 2027, or that the sustainability mechanism vote fails coinholder approval. That would neutralize the biggest fundamental catalyst and put the burden back on macro liquidity to hold price.

    Frequently Asked Questions

    Is Zcash a good investment in 2026?

    On the current data, ZEC screens as a high-conviction, small-allocation, multi-year bet rather than a core holding. The ETF pathway, the shielded-pool supply sink, and the NU7 roadmap all support the bull case. But the asset is already up 13x on the year, which limits margin of safety. Position sizing matters more than direction here.

    Will Zcash reach $1,000 in 2026?

    Reaching $1,000 by year-end 2026 requires ETF approval plus at least $300M of net inflows in the first quarter of trading. Our model puts the probability at roughly 25%. It is a realistic bull-case scenario, not a base case. A more probable range for year-end 2026 sits between $620 and $780.

    What is the Zcash NU7 upgrade?

    NU7 is the next Zcash network upgrade. It introduces Zcash Shielded Assets, a network sustainability mechanism with 90%+ community support, and a roughly 300% speed boost for shielded transactions. Testnet went live in May 2026. Mainnet activation is expected later in 2026 or early 2027.

    When will the Grayscale Zcash ETF launch?

    Grayscale filed the Form S-3 to convert its Zcash Trust into a spot ETF on May 12, 2026. Typical SEC review windows for spot crypto ETFs run 240 days, which points to a decision window in early 2027. The SEC can extend or delay without rejecting outright, so the timeline is not fixed.

    How does Zcash compare to Monero for privacy?

    Monero encrypts every transaction by default and hides sender, receiver, and amount. Zcash offers optional privacy through shielded pools, which trades some anonymity strength for regulatory flexibility. For pure privacy, Monero is stronger. For regulated exposure and ETF eligibility, Zcash is the only credible option.

    What is the Zcash price prediction for 2027?

    Base case for 2027 sits in the $700 to $1,200 range, assuming the ETF launches and NU7 lands on schedule. Bull case extends to $1,500 to $2,000 if ETF inflows track above $1B. Bear case pulls back to $250 to $380 if the privacy narrative fades and macro conditions turn defensive.

    The Honest Take

    Zcash is the closest thing crypto has to a “privacy ETF trade” in 2026. The setup is genuinely compelling: fixed 21M supply, a functioning halving cycle, a growing shielded-pool sink, a live testnet for the biggest upgrade in years, and the first spot privacy-coin ETF filing on the tape. That is not a hype list. Every one of those inputs is verifiable on-chain or in SEC filings.

    The pushback is equally honest. A 13x move in a year leaves little margin for surprise. ETF approval is not a done deal. Privacy coins remain politically sensitive even when the SEC posture has softened. And in a macro-driven deleveraging event, ZEC’s beta to broad crypto sentiment can compress the move quickly.

    The setup that would make us most bullish, and the one we are watching, is a sustained hold above $520 combined with ETF acknowledgment on the accelerated track. If both land in the same window, the $800 target looks reachable within 6 months. If either fails, patience is the trade.

    Either way, ZEC is one of the few names in the top 20 with a genuinely differentiated 2026 thesis. That alone puts it on the shortlist worth watching.


    Disclaimer: This article is for informational and educational purposes only and should not be construed as financial, investment, or trading advice. Cryptocurrency markets are highly volatile, and past performance does not guarantee future results. The price predictions and analyses presented here are based on AI models, technical indicators, and available data at the time of writing, they are not guarantees. Always conduct your own research (DYOR) and consult with a qualified financial advisor before making any investment decisions. Pump Parade and its authors do not assume liability for financial losses incurred based on information provided in this article.
    Optimism (OP) Price Prediction 2026: Can OP Hit $0.20?

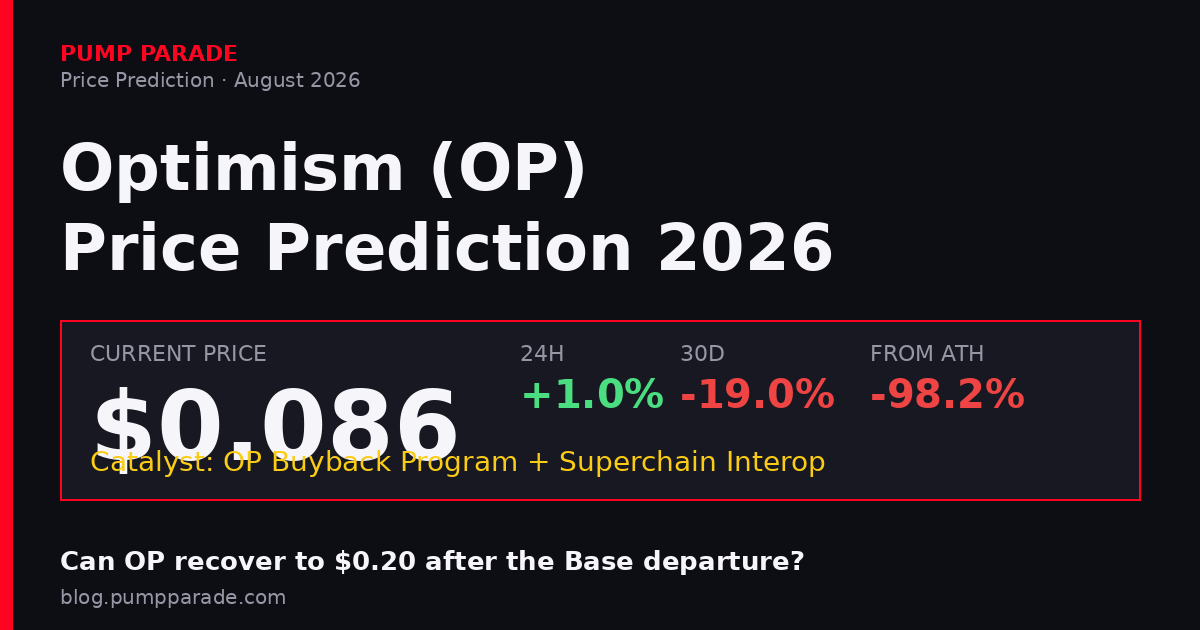
    Optimism (OP) trades at roughly $0.086 as of August 2026, down 98% from its March 2024 all-time high of $4.84 and down 19% in the last 30 days. The Optimism price prediction picture in 2026 got messier in February, when Coinbase’s Base chain announced its migration off the OP Stack, wiping out roughly 96.5% of the Optimism Collective’s gas fee base overnight. The token dropped 28% in 48 hours and printed an all-time low of $0.12 shortly after, according to Coindesk reporting.

    The bull case did not disappear. It just got harder. This article breaks down where OP stands right now, the two catalysts that could still take it back to $0.20 by year end, the risks that could send it lower, and what price triggers would change our view.

    Key Takeaways

    • OP trades near $0.086, roughly 98% below its all-time high, with a $200M market cap and rank 162.
    • The OP token buyback program, live since February 2026, directs 50% of net Superchain sequencer revenue into monthly OP purchases.
    • Base’s migration off the OP Stack removed the largest single source of sequencer fees, creating a real revenue hole.
    • Our base case sees OP between $0.10 and $0.14 by year end 2026, with a $0.20 bull target only if interop ships on time and TVL grows.
    • A close below $0.075 would invalidate the bullish setup and open the door to fresh lows.
    Optimism (OP) price prediction 2026 hero graphic, current price $0.086, buyback and Superchain interop catalysts

    Where Optimism (OP) Stands Today

    The Optimism price prediction conversation has to start with the current setup. OP is a governance token for the Optimism Collective, the entity behind the OP Stack and the broader Superchain. It launched in June 2022 and has spent most of the last two years in a downtrend against both Bitcoin and Ethereum.

    Here is the snapshot at time of writing, sourced from CoinGecko:

    Metric Value
    Price $0.086
    24h change +1.0%
    7d change -8.8%
    30d change -19.0%
    Market cap $200M
    24h volume $26M
    Rank 162
    All-time high $4.84 (Mar 2024)
    From ATH -98.2%

    Volume to market cap sits around 13%, which is healthy for a token in a downtrend. It means real traders are still positioning, not just holders sitting on bags.

    Why is Optimism trading this low right now?

    Two forces are pressing on OP at the same time.

    The first is the Base departure. In its February 2026 engineering post, Base announced it would consolidate its infrastructure under a unified, Base-operated stack to speed up its own development cycle. Base was not just any OP Stack chain. On-chain data cited by The Defiant and CCN pegged Base at roughly 96.5% of the Optimism Collective’s total gas fee revenue. That is a single point of failure most token holders had not priced in.

    The second is the broader Layer 2 fee compression story. Since the Dencun and Pectra upgrades on Ethereum, blob fees have collapsed and every rollup is competing for a smaller pie. Even without the Base news, sequencer revenue across the Superchain would be under pressure. Combine the two and you get the current chart: a long slide, punctuated by that February air pocket, followed by low-volume grinding sideways.

    The bright spot is that whales have been quietly accumulating. On-chain data cited by CCN showed large wallets adding OP in the days immediately after the Base news, betting that the sell-off was overdone. That does not guarantee a bottom, but it does mean informed money is not treating this as a zero.

    The Bull Case for OP in 2026

    Catalyst 1: The OP token buyback program

    In January 2026, Optimism governance passed a proposal (84.4% in favor) to direct 50% of net Superchain sequencer revenue into monthly OP token buybacks over a 12-month pilot, per Coindesk’s coverage. The program went live in February 2026.

    Before the Base news, the ecosystem was generating around 5,868 ETH annually in sequencer revenue, which mapped to roughly $8M of buy-side pressure per year. That is not enormous for a $200M market cap token, but it is real, recurring, and gives OP something Ethereum-first governance tokens have historically lacked: a value accrual mechanism tied to actual network usage. Post-Base, the run rate is materially lower, but the mechanism is still active. Every dollar of Superchain revenue converts to structural OP demand.

    Catalyst 2: Superchain interop rollout

    The Interop Layer is scheduled to ship across the Superchain in late 2026. Native cross-chain messaging, ERC-7802-compliant asset bridging, shared fault proofs, and eventually a shared sequencer fee pool are the four building blocks. If interop lands and works, the Superchain stops being a loose federation of Layer 2s and starts behaving like one unified network. That could pull new chains in, retain remaining OP Stack chains like Unichain and World Chain, and give the buyback program more revenue to feed on.

    Catalyst 3: Ethereum L2 narrative rotation

    Layer 2 tokens have been out of favor for most of 2026, which historically is when they set up their best entries. If Ethereum recovers toward its 2026 targets, the L2 basket typically follows with a beta of 1.5 to 2.0. OP, being one of the most beaten-down names in the group, has room to snap back harder if the rotation materializes.

    The Bear Case for OP in 2026

    Risk 1: The Superchain revenue hole

    Base was 96.5% of the collective’s gas fees. Unichain, World Chain, Mode, Zora, and the other 12 or so Superchain members will not fill that gap quickly. If Superchain revenue stays depressed through the end of 2026, the buyback program becomes a footnote instead of a floor. This is the single biggest risk on the board.

    Risk 2: More OP Stack defections

    Base leaving lowers the switching cost for other chains to follow. If Unichain or World Chain announces a similar move in the second half of 2026, OP could revisit the $0.075 support and break it. Watch OP Labs communications closely for any hints of retention issues.

    Risk 3: Governance token discount

    Even with the buyback, OP is still primarily a governance token. In a market that increasingly wants revenue-accruing tokens with clear cash flow (compare with Aave’s fee switch narrative), pure governance tokens tend to trade at a persistent discount. That structural headwind does not go away just because the price is low.

    Optimism Price Prediction 2026: Targets by Timeframe

    Optimism (OP) price prediction 2026 targets table, bear $0.05, base $0.12, bull $0.20

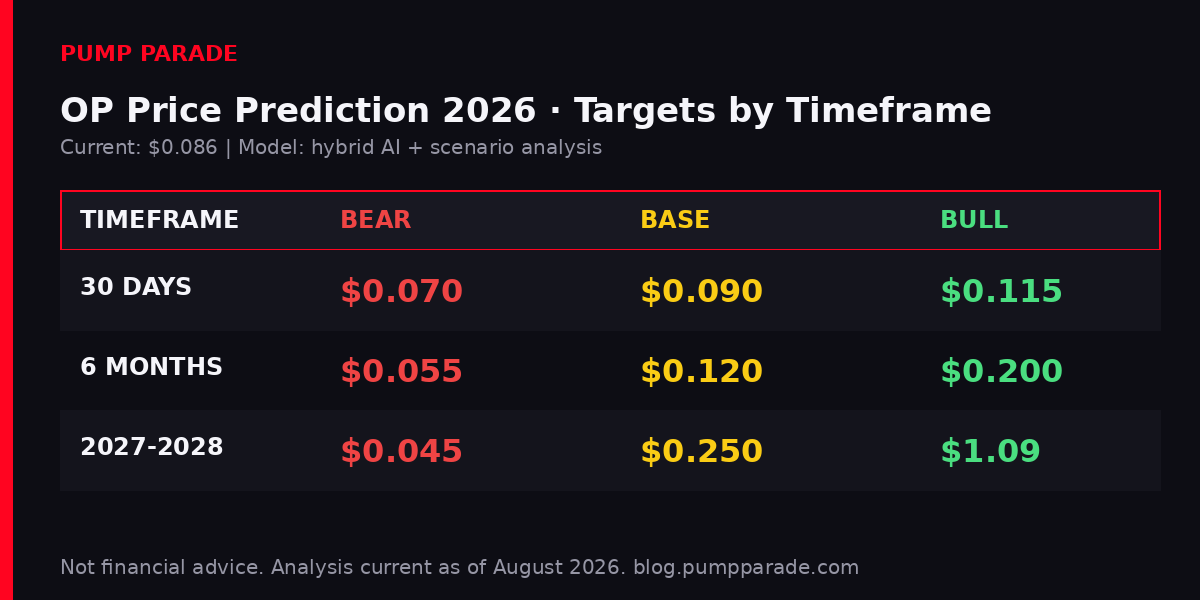
    Our AI model and manual scenario work converge on a fairly tight range for the rest of 2026, with a wider band for 2027 as interop either lands or stalls.

    Timeframe Bear Base Bull
    30 days $0.070 $0.090 $0.115
    6 months $0.055 $0.120 $0.200
    2027 to 2028 $0.045 $0.250 $1.09

    Short term (30 days)

    Our AI model assigns roughly a 60% probability that OP stays within a $0.075 to $0.115 range over the next 30 days. Volume is thin, no major catalyst is dated inside the window, and the buyback flow provides a soft floor. The bull scenario requires either a broader crypto rally or a positive announcement from OP Labs about a new Superchain member.

    Medium term (6 months)

    This is where the interop timeline matters. If the Interop Layer ships in Q4 2026 as planned and OP Labs can point to a chain or two joining the Superchain, our base case is a re-rating toward $0.12 to $0.14. The $0.20 bull target, roughly 2.3x from spot, requires both interop shipping AND Superchain TVL growing 40 to 60% over the next 6 months. That is the growth range referenced in Coinbureau and KuCoin analyst forecasts.

    Long term (2027 to 2028)

    Consensus 2027 targets from Coindataflow, Cryptopolitan, and Kraken cluster in the $0.10 to $1.09 range, with Coinpedia calling for a 2026 high near $1.09. Our own model is more conservative because of the Base overhang: base case $0.25 by end 2027, bull case $1.09 only if the Superchain regains meaningful market share against Arbitrum Orbit and zkSync’s Elastic Chain.

    How does Optimism (OP) compare to Arbitrum (ARB)?

    Arbitrum is the natural comparison. Both are optimistic rollups, both have governance tokens with limited direct fee accrual, and both are fighting the same L2 fee compression story.

    Metric Optimism (OP) Arbitrum (ARB)
    Price $0.086 $0.28
    Market cap $200M $1.4B
    Ecosystem model Superchain (interop) Orbit chains (sovereign)
    Direct fee accrual Yes (50% buyback since Feb 2026) Timeboost proceeds only
    Largest chain OP Mainnet (post-Base) Arbitrum One
    From ATH -98.2% -95%

    OP is smaller, more beaten down, and has a cleaner value accrual mechanism thanks to the buyback. Arbitrum is larger, more diversified across chains, and has more resilient revenue. If you are picking one for pure asymmetry, OP wins on setup. If you are picking one for downside protection, ARB wins on scale. Neither is a slam dunk.

    What would change our view on OP price?

    Three specific triggers would move us off the current base case:

    Bullish trigger: A new top-15 chain announces it will launch on the OP Stack and join the Superchain. That would signal the ecosystem is still winning developer mindshare despite Base and would justify moving the 6-month base case toward $0.15 and the bull case toward $0.25.

    Bearish trigger: A weekly close below $0.075. That is the multi-month support that has held every dip since April 2026. A close below opens the door to $0.055 and possibly a full retest of the $0.045 psychological floor.

    Neutral-to-bearish trigger: The Interop Layer slips past Q1 2027. If the timeline drifts, the buyback becomes the only meaningful catalyst, and $0.10 to $0.12 becomes the ceiling for the next 12 months.

    Frequently Asked Questions

    Will OP recover in 2026?

    A partial recovery is realistic if the buyback flow holds and the Interop Layer ships on schedule. Our base case sees OP between $0.10 and $0.14 by year end 2026, roughly 15% to 60% above the current $0.086. A full recovery to prior highs is not in the cards this year, given the Base revenue loss and broader L2 fee compression.

    Is Optimism a good investment in 2026?

    OP offers asymmetric setup at these levels but comes with real risk. The buyback program creates structural demand, and the token trades 98% below its all-time high. That said, the largest revenue source departed in February, and Layer 2 governance tokens face persistent headwinds. Size the position for the downside, not the upside.

    Will OP hit $1?

    Not in 2026. A $1 target would require an 11.6x move from current levels, which would need both a full crypto bull cycle and a decisive win on Superchain interop and TVL. Consensus analyst targets from Coinpedia and Kraken put $1.09 in the 2027 to 2030 window, not 2026.

    What happened when Base left the OP Stack?

    Base announced its migration to a unified, Base-operated stack in February 2026. OP dropped 28% in 48 hours and later printed an all-time low of $0.12. Base had contributed roughly 96.5% of Superchain gas fees, so the departure materially reduced the buyback program’s expected impact. Whales bought the initial dip.

    Is Optimism dead?

    No, but the growth thesis has narrowed. Optimism is not shutting down, the OP Stack is still active, and Unichain, World Chain, and other Superchain members continue to operate. The token can still recover from here. What is dead is the pre-Base thesis of Optimism as the dominant Layer 2 with unstoppable revenue growth. The new thesis is smaller, slower, and rests on interop delivery.

    How does the OP token buyback work?

    The Optimism Foundation directs 50% of net Superchain sequencer revenue into monthly OP buybacks. The program launched in February 2026 as a 12-month pilot after 84.4% governance approval. It creates a structural, recurring source of buy-side demand tied directly to how much the Superchain is used.

    The Honest Take

    Optimism is a broken chart with a real product. That combination attracts contrarian buyers and repels momentum traders in equal measure, which is roughly why the price grinds sideways in low volume. The buyback program is genuinely differentiating. The Base loss is genuinely damaging. Interop is genuinely important. All three are true at the same time, and none of them is priced in with certainty.

    The tradable setup is a range: $0.075 on the downside, $0.115 on the upside, with a break in either direction meaningful. Above $0.115 on volume, the path to $0.15 and then $0.20 opens up. Below $0.075 on a weekly close, the bear thesis takes over. In between, this is a patience trade, not a conviction trade. For readers watching the broader Ethereum ecosystem, keep an eye on how Uniswap’s Unichain performs on OP Stack, since Unichain volume is now one of the most visible tests of whether the Superchain can grow without Base.

    Disclaimer: This article is for informational and educational purposes only and should not be construed as financial, investment, or trading advice. Cryptocurrency markets are highly volatile, and past performance does not guarantee future results. The price predictions and analyses presented here are based on AI models, technical indicators, and available data at the time of writing, they are not guarantees. Always conduct your own research (DYOR) and consult with a qualified financial advisor before making any investment decisions. Pump Parade and its authors do not assume liability for financial losses incurred based on information provided in this article.
    Aave (AAVE) Price Prediction 2026: Can AAVE Hit $200?

    Aave (AAVE) is trading at $92.23, up 1.9% in the last 24 hours and up 6.6% over the past 30 days. That is still 86% below its 2021 all-time high of $661, yet the fundamentals underneath the token look nothing like the last cycle. The Aave protocol just crossed $14.49 billion in total value locked, controls roughly 60% of DeFi lending, and switched on a permanent $50 million per year buyback in late June. That is the setup this Aave price prediction 2026 has to explain.

    The question every trader is asking is simple. If Aave is generating $227 million in cumulative protocol revenue and burning through its own supply, why is AAVE trading like a memecoin from 2022? And more importantly, can that gap close before the end of 2026?

    Below, we walk through where AAVE sits today, why it is stuck in a range, the bull case built on Aavenomics 3.0 and Aave V4, the bear case that keeps the token capped, and our timeframe-by-timeframe price targets for the rest of 2026 and beyond.

    Key Takeaways

    • Current price: $92.23, +1.9% 24h, +6.6% 30d. Market cap $1.42B, rank 51.
    • Bull catalyst: Aavenomics 3.0 buybacks (100% of protocol revenue), Aave V4, and Horizon RWA collateral.
    • Bear catalyst: Morpho and Compound competition, DeFi rate compression, and lingering 2021 supply overhang.
    • Bear target: $65 by year-end 2026. Base: $135. Bull: $210.
    • What to watch: Weekly buyback size, GHO market cap, and V4 launch date.
    • Verdict: AAVE looks undervalued on cash-flow terms, but needs a DeFi rotation to close the gap.
    Aave (AAVE) price prediction 2026 hero graphic, current price $92.23 with Aavenomics 3.0 buyback catalyst

    Where AAVE Stands Today

    The numbers tell a story of a protocol firing on all cylinders while its token drags. Aave V3 holds 96.6% of total protocol liquidity across 21 chains, has produced $1.70 billion in all-time fees, and books $227 million in protocol revenue that now flows entirely to the DAO treasury. GHO, the native stablecoin, sits at roughly $583 million in circulation and holds its peg inside a tight band.

    AAVE the token has not kept pace. Here is the snapshot.

    Metric Value
    Current price $92.23
    24h change +1.91%
    30d change +6.58%
    Market cap $1.42B
    24h volume $224.8M
    CoinGecko rank 51
    Circulating supply 15.42M / 16M max
    All-time high $661.69 (May 2021)
    % from ATH -86.1%
    Protocol TVL $14.49B

    The distance between the fundamentals and the price is what makes this setup interesting. In plain terms, Aave the business is doing better than ever. Aave the token still trades like it is 2022. Something eventually gives.

    Why Is AAVE Range-Bound Right Now?

    Three forces are keeping the price pinned between $80 and $105. The first is a rotation problem. Capital in 2026 has flowed toward Bitcoin ETFs, real-world asset issuers, and Solana-native DeFi. Ethereum-anchored blue-chip DeFi tokens, the category AAVE lives in, have not been the trade. Uniswap, Lido, and MakerDAO show similar patterns. If you want the same setup expressed through a different token, our Morpho price prediction 2026 covers the same DeFi lending story from the challenger side.

    The second is the buyback ramp itself. Aavenomics 3.0 authorizes weekly buyback budgets between $250,000 and $1.75 million based on treasury and market conditions. At the low end, that removes about $13 million in AAVE per year. At the top end, $91 million. Neither number, on its own, is enough to move a token with $225 million in daily volume. The buyback is a tailwind, not a rocket booster, until the DAO ramps to full budget.

    The third is the market itself. Bitcoin sits at $63,000, well below the highs it printed earlier in the cycle. Ethereum is at $1,869. When the two largest assets are consolidating, mid-cap DeFi tokens do not lead. They follow.

    What Could Send AAVE Back Above $200?

    1. Aavenomics 3.0 is now a real cash-flow story

    The Aave DAO activated Aavenomics 3.0 on June 27, 2026, routing 100% of protocol and GHO revenue into an automated buyback system. The initial authorization is a permanent $50 million per year program. At current revenue, that alone represents roughly 22% of protocol take being recycled into AAVE.

    Compare that to a traditional equity. A company generating $227 million in revenue with a $1.42 billion market cap trades at 6.3 times sales, and Aave is now returning that cash to token holders. The Defiant reported that the DAO also cut discretionary spending as part of the rollout, which improves the net take. On a fundamentals-only basis, AAVE looks mispriced.

    2. Aave V4 and the Avalanche expansion

    Aave V4 rolled out to Avalanche in July 2026 with $15 million in incentives to seed liquidity and RWA borrowing. V4 is the first major architectural rewrite since 2022, and it targets the two things that have held the protocol back: cross-chain liquidity fragmentation and integration friction for institutions.

    If V4 draws capital from smaller lending markets and consolidates the long tail of chains, Aave’s TVL could push past $20 billion by mid-2027. Every dollar of new TVL feeds directly into the buyback. This is the flywheel bulls are pricing in. Aave Labs’ own 2025 recap outlines the same roadmap in more detail.

    3. Aave Horizon and institutional collateral

    Aave Horizon is a framework that lets regulated institutions use tokenized real-world assets as collateral inside Aave markets. This is where the DeFi-meets-RWA thesis meets a working product. The tokenization market is expanding fast, as our Ondo price prediction 2026 covers, and Aave is the natural credit layer for it.

    If Horizon captures even 5% of the tokenized Treasury market, it adds billions to lending demand, which pushes GHO borrow rates up and revenue with them.

    What Could Keep AAVE Stuck Below $100?

    1. Morpho is eating the same lunch

    Morpho has grown faster than Aave over the last twelve months by offering better rates through peer-to-peer matching on top of Aave and Compound liquidity. If Morpho continues to route the most profitable flow, Aave becomes a wholesale liquidity backstop rather than the retail-facing brand. That compresses fees per dollar of TVL, and it caps AAVE upside even if TVL rises.

    2. Rate compression and the return of Compound

    Aave V3 currently offers roughly 3-6% on USDC. Compound III is at 3-5%. Both are competing with Ondo and BlackRock’s tokenized Treasury products offering 4-5% risk-free. When the crypto-native yield premium collapses to zero, DeFi lending becomes a commodity business. Commodity businesses trade at low multiples, not the high multiples bulls need to justify $200.

    3. The 2021 supply overhang

    AAVE has been in circulation since 2020 and holds a fully diluted valuation only 3.7% above its market cap. There are no unlock cliffs left, which is a bull point, but there are also years of underwater long-term holders sitting between $95 and $200. Every rally into that zone historically brings sell pressure from wallets that finally see green.

    Aave Price Prediction 2026: Targets by Timeframe

    Aave (AAVE) price prediction 2026 targets table, bear $70, base $135, bull $210 by early 2027

    Our targets are grounded in three drivers: the pace of Aavenomics buybacks, V4 TVL growth, and the direction of Bitcoin. Here is how it stacks up.

    Timeframe Bear Base Bull
    30 days $78 $98 $120
    6 months (Feb 2027) $70 $135 $210
    Long term (2028) $80 $225 $400

    30-day outlook: chop, with a bias to bounce

    The immediate technical picture shows AAVE trying to reclaim the $95 range that acted as support through May and June. RSI on the daily is near 52, neutral. A close above $105 opens $120. Failure to hold $88 puts the $78 low from April back in play. Base case is a grind between $85 and $105.

    6-month outlook: buybacks meet a broader rotation

    By February 2027, the DAO should have three full quarters of buyback data. If weekly execution has ramped to the top end of the authorized band, roughly $91 million in annualized flow, the supply side compresses meaningfully against a fixed 16 million cap. Combined with a Q4 crypto rotation into DeFi blue chips, the base case is $135 with a $210 bull scenario if BTC reclaims $100K. Changelly’s model puts average 2026 fair value near $286, while Cryptopolitan’s is closer to $112, so our $135 base sits in the middle of the credible range.

    Long-term outlook: the trillion-dollar question

    Aave has now processed over $1 trillion in cumulative lending volume. If the protocol captures the tokenized-asset lending flywheel through Horizon and V4, a $400 AAVE by 2028 assumes roughly 15x current revenue and a 4x price-to-sales rerate. That is aggressive but not unprecedented. Standard Chartered has published $8,000 targets on other DeFi majors under similar rerate math. Our long-term base case of $225 is more conservative and only requires steady TVL growth.

    How Does Aave Compare to Compound Finance?

    Compound is the closest apples-to-apples comparison, and the numbers explain why Aave dominates.

    Metric Aave Compound
    TVL $14.49B $2.7B
    Market share (DeFi lending) ~60% ~11%
    Chains supported 21 6
    Native stablecoin GHO None
    Buyback program $50M/yr live Governance only
    Flash loans Yes No
    Long-tail asset support Broad Narrow

    Aave leads on every axis that matters for scale. Compound wins on simplicity for treasury-style capital that wants a small, tightly parameterized set of assets. Data from DefiLlama confirms the market share gap has widened, not narrowed, over the past year.

    What Would Change Our View

    Three specific scenarios would force a rewrite of these targets.

    Scenario 1: Buybacks stall. If the DAO fails to execute above $500K per week average through Q4 2026, the buyback narrative loses its edge and the bear case at $65-$70 becomes the base case. Track weekly buyback size on-chain.

    Scenario 2: A major exploit or oracle failure. DeFi lending is one bad oracle away from a permanent trust hit. Aave has been battle-tested, but the Chainlink dependency remains a systemic point of failure, as our Chainlink price prediction 2026 discusses in more depth.

    Scenario 3: Bitcoin breaks above $100K on ETF inflows. A clean BTC breakout typically drags DeFi majors up 2-3x their beta. In that scenario, our $210 bull target for early 2027 becomes a base case, and $300 comes into view.

    Frequently Asked Questions

    Will AAVE reach $200 in 2026?

    Reaching $200 in 2026 is possible but requires the buyback program hitting its top authorized weekly budget alongside a Bitcoin move above $85,000. Under our base case, AAVE ends 2026 near $135. Under the bull case, $210 is on the table by early 2027, which brackets the $200 level.

    Is Aave a good investment in 2026?

    On a cash-flow and market-share basis, Aave screens cheap. The protocol generates $227 million in cumulative revenue and returns it to token holders through buybacks. The risk is DeFi as a category remaining out of favor, which caps upside regardless of fundamentals. It is a fundamentals bet, not a momentum bet.

    What is Aavenomics 3.0?

    Aavenomics 3.0 is the tokenomics upgrade activated by the Aave DAO on June 27, 2026. It routes 100% of protocol and GHO revenue into an automated AAVE buyback program with a permanent $50 million annual authorization. Weekly buyback size flexes between $250,000 and $1.75 million based on treasury and market conditions.

    How does Aave make money?

    Aave earns from three sources: interest rate spreads between depositors and borrowers, flash loan fees, and GHO stablecoin borrowing rates. In V3 alone, the protocol has generated $1.70 billion in cumulative fees and $227 million in net revenue that now flows to the DAO treasury and buybacks.

    What is the highest AAVE price prediction for 2026?

    The most aggressive published 2026 forecast comes from Changelly at an average near $286 with a high of $330. More conservative models from Cryptopolitan and Coinbase cluster between $95 and $141. Our bull case of $210 for early 2027 sits in between, requiring both buybacks and a Bitcoin rally.

    Can Aave beat Morpho and Compound?

    Aave already leads both on TVL and revenue by a wide margin. The competitive risk is not being displaced. It is that fee compression from peer-to-peer matching on Morpho reduces Aave’s take rate per dollar of TVL. Aave V4 is a direct response, targeting the same capital efficiency Morpho users chase.

    The Honest Take

    AAVE is one of the cleanest fundamentals stories in crypto right now, and the market is not paying for it. A protocol with $14.49 billion in TVL, 60% market share, $227 million in revenue, and a live buyback should not trade at 6x sales. It does because DeFi is out of favor and because the buyback ramp is slow by design.

    The setup rewards patience. If you believe DeFi rotates back into favor sometime in 2026 or 2027, AAVE is one of the few tokens where the fundamentals will catch up if you wait. If you need momentum today, this is not it. If you want a portfolio position in the credit layer of on-chain finance, the risk-reward is one of the better ones on the board.

    Watch three things: weekly buyback size, GHO market cap, and Aave V4 TVL on Avalanche. When two of the three are trending up together, the rerate story starts.

    Disclaimer: This article is for informational and educational purposes only and should not be construed as financial, investment, or trading advice. Cryptocurrency markets are highly volatile, and past performance does not guarantee future results. The price predictions and analyses presented here are based on AI models, technical indicators, and available data at the time of writing, they are not guarantees. Always conduct your own research (DYOR) and consult with a qualified financial advisor before making any investment decisions. Pump Parade and its authors do not assume liability for financial losses incurred based on information provided in this article.
    BNB Price Prediction 2026: Can BNB Hit $700 by Year End?

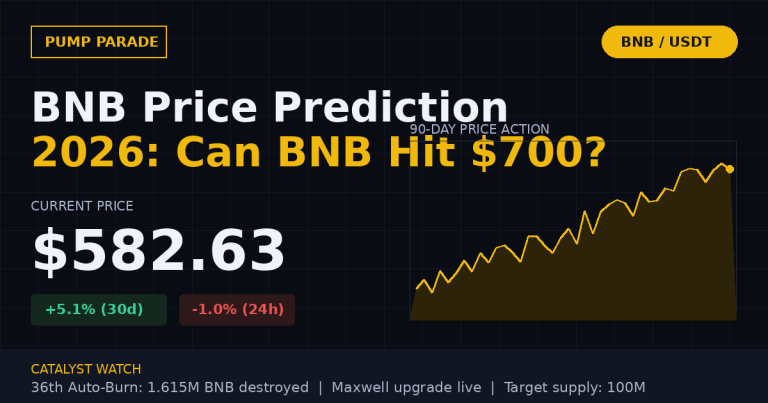
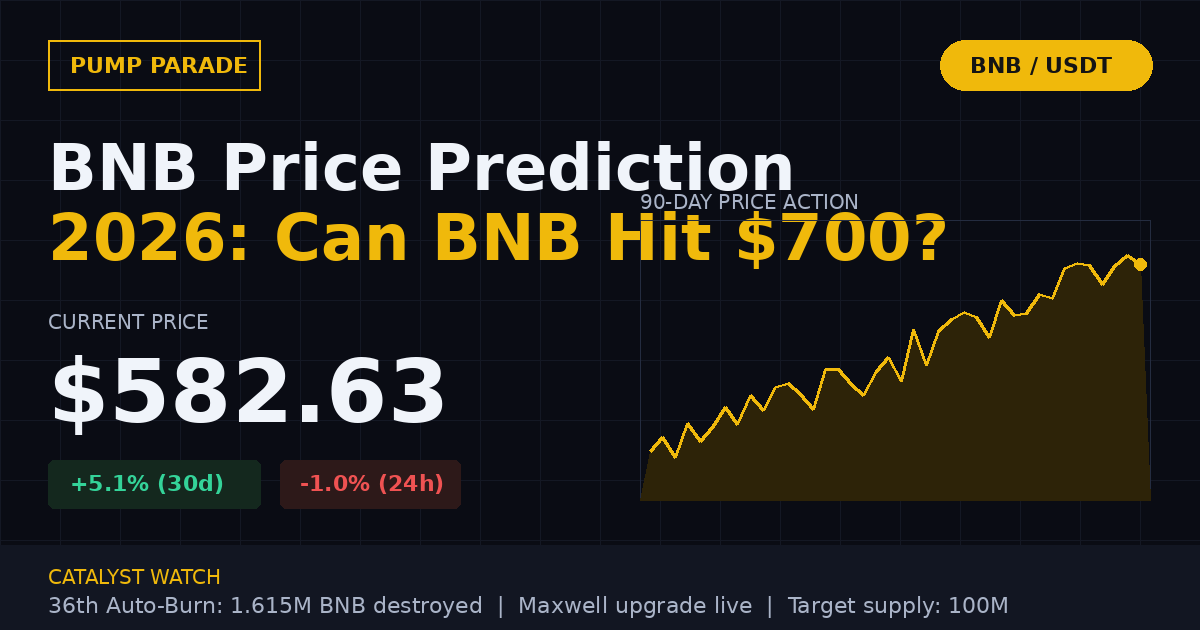
    BNB is trading at $582.63 at time of writing, up 5.1% over the past 30 days and holding above the $580 support that traders have been watching all summer. The number that matters more, though, is 1,615,827. That is how many BNB tokens Binance permanently destroyed on July 15 in the 36th quarterly Auto-Burn, worth roughly $932 million at the burn price. Circulating supply now sits at 133.17 million, marching toward the 100 million target that Binance has committed to.

    Yet BNB still sits 57% below its October 2025 all-time high of $1,369.99. So the real BNB price prediction 2026 question is not “will burns matter.” Burns clearly matter. The question is whether the Maxwell hardfork rollout, sustained BNB Smart Chain activity, and a friendlier macro backdrop are enough to push BNB back to $700, or higher, before the year ends. Here is what the data actually says, both directions.

    Key Takeaways

    • Current setup: BNB at $582.63, +5.1% over 30 days, holding above the $580 support zone but 57% below its October 2025 ATH.
    • Bull case: $700 to $850 by year-end 2026 if Auto-Burn cadence continues, BNB Chain DEX volume holds, and BTC reclaims $100K.
    • Base case: $600 to $680 range through Q4 2026 as supply tightens but macro stays cautious.
    • Bear case: $450 to $520 if $580 breaks, regulatory pressure on Binance intensifies, or the BSC DEX flow rotates back to Solana.
    • Key catalyst: The next quarterly burn in October 2026 and the Fermi upgrade rollout are the two datable events worth marking on your chart.
    • What would invalidate the bull case: A weekly close below $560 with volume expansion, or a Binance-specific regulatory event out of the US or EU.
    BNB (BNB) price prediction 2026 hero graphic - current price $582.63, 36th Auto-Burn destroyed 1.615M tokens

    Where BNB Stands Today

    BNB is the fourth-largest cryptocurrency by market cap, sitting between XRP and TRON on most exchanges. It powers the Binance ecosystem, pays trading fees at a discount, and serves as the native gas token for BNB Smart Chain. That triple utility, exchange token plus gas token plus reward token, is the reason BNB has historically outperformed pure L1 competitors during Binance-heavy trading periods.

    Here is the snapshot the market cares about right now:

    Metric Value
    Price $582.63
    24h change -1.04%
    7d change +3.09%
    30d change +5.13%
    Market cap $77.61 billion
    24h volume $601.1 million
    Rank (by market cap) #4
    All-time high $1,369.99 (Oct 13, 2025)
    % from ATH -57.5%
    Circulating supply 133.17M BNB
    Target end-state supply 100M BNB

    Two numbers on that table matter more than any indicator. First, the 57% drawdown from ATH tells you BNB has been in a slow-grind correction for nine months. Second, the 24-point gap between current supply and the 100M target tells you that supply-side pressure is one-directional. Every quarter, more BNB gets removed. Nothing puts new BNB into circulation.

    Why is BNB drifting sideways right now?

    Three things explain the range-bound action. Bitcoin is still trapped below $65,000 and has failed twice to reclaim $70,000 in the past 60 days. When BTC ranges, exchange tokens tend to range harder, because trading volume dries up and the fee-discount narrative loses urgency. Second, the September to July rotation into Solana ecosystem tokens pulled speculative capital away from BSC, temporarily. Third, and most quietly, some large holders have been booking profits from the $1,000+ zone throughout the first half of 2026, adding steady overhead supply.

    The counterweight is real, though. BNB Chain’s 2026 tech roadmap put block times at 0.45 seconds and finality at 1.1 seconds after the Maxwell hardfork. That is genuinely competitive with Solana on a technical basis, and it changes what kinds of applications can ship on BSC. The question is whether developers rotate back. The July burn number, $932 million, suggests real usage is still there. It is a lagging indicator, but it is not zero.

    The Bull Case for BNB in 2026

    1. The Auto-Burn is doing exactly what it was designed to do

    The 36th quarterly burn removed 1,615,827 BNB from circulation, valued at $932 million. That is the third burn of 2026 alone, and the mechanism does not stop until total supply hits 100 million. At the current rate, roughly 6.5 million BNB per year, BSC is on track to reach the 100M target within the decade, not the century. Meanwhile, BEP-95 continues to burn a fixed fraction of every gas fee in real time. Roughly 291,000 BNB have been destroyed under BEP-95 since its introduction.

    Deflationary supply is not a price catalyst by itself, but paired with steady demand it is a slow, mechanical tailwind. It is why BNB has historically held its floor better than pure L1s during risk-off periods.

    2. BNB Chain is quietly winning on speed and cost

    Post-Maxwell, BSC produces blocks every 0.45 seconds with 1.1-second finality. Fees remain fractions of a cent for most swaps. That combination has driven a steady rise in stablecoin volume on the chain and a growing share of real-world asset tokenisation projects choosing BSC over Ethereum. If DeFi and RWA volume continues to migrate toward chains with sub-second finality, BSC is one of two credible destinations, the other being Solana.

    3. Analyst targets are clustering above $700

    Aggregated forecasts from Changelly ($630 December 2026 average), Binance’s own consensus prediction ($803 for 2026), and InvestingHaven ($1,100 peak) all imply significant upside from the current $583 level. Even the more conservative Coinbase model puts BNB near $566 in 2026, meaning the downside baseline sits close to current price. Skew is asymmetric to the upside, at least on paper.

    The Bear Case for BNB in 2026

    1. Regulatory overhang has never fully lifted

    Binance’s 2023 settlement with US authorities closed a chapter but not the book. Regulatory scrutiny of centralized exchanges continues in the EU under MiCA, and enforcement actions against Binance-branded products in specific jurisdictions can materially move BNB. Any new investigation, restriction, or delisting announcement is a fast tail-risk that discounts pretty severely, and it is not something a chart can predict.

    2. Competition from Solana and Ethereum L2s is real

    Solana continues to dominate memecoin flow and retail speculation, and Ethereum’s L2 ecosystem is aggregating serious DeFi TVL. BSC’s response has been faster blocks and lower fees, which is the right technical answer, but developer mindshare does not move on specs alone. If BSC’s DEX volume share slips further, the demand side of the BNB value equation weakens even as supply tightens.

    3. The $580 level is the whole ballgame

    Technically, BNB has bounced off the $560 to $580 zone three times in the past four months. That level is now the market’s line in the sand. A weekly close below $560 on expanding volume would signal that buyers who defended the range are exhausted. Historically, that pattern precedes moves back to the next major support, which sits closer to $450 to $480.

    BNB Price Prediction 2026: Targets by Timeframe

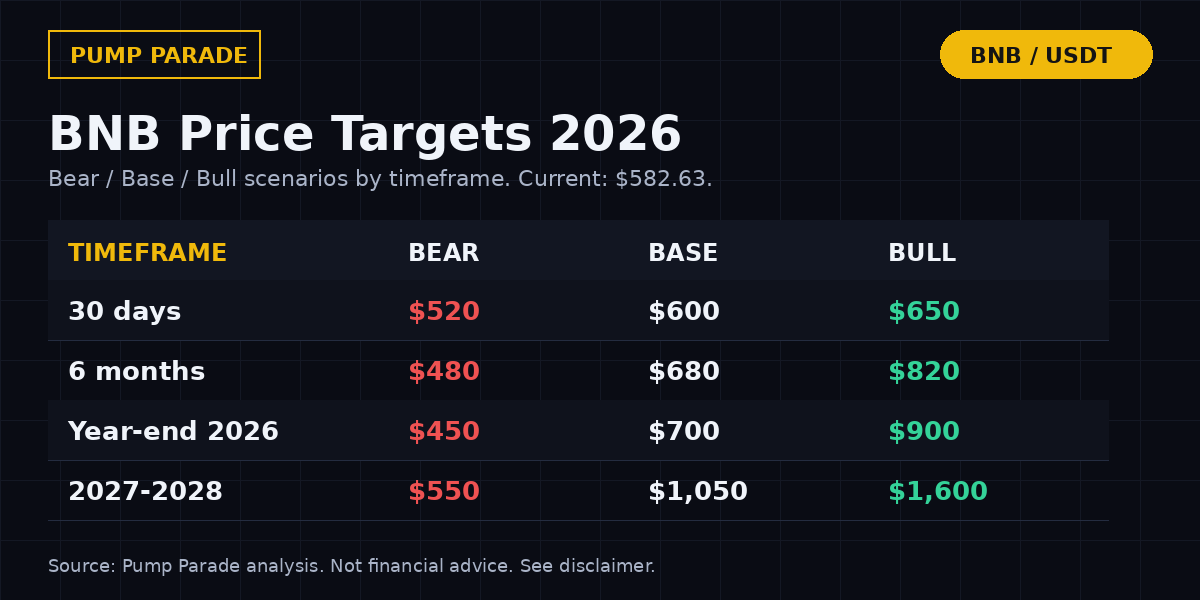
    BNB (BNB) price prediction 2026 targets table - bear $450, base $700, bull $900 by year end

    Here is how we break the BNB price prediction 2026 outlook by horizon. Each row assumes the catalysts and risks discussed above, weighted against current market structure.

    Timeframe Bear Base Bull
    30 days $520 $600 $650
    6 months $480 $680 $820
    Year-end 2026 $450 $700 $900
    Long-term (2027-2028) $550 $1,050 $1,600

    Short-term (30 days)

    Base case: BNB grinds between $580 and $640, resolving neither direction until BTC picks a side. Bull case: a fast BTC move above $70,000 pulls BNB toward $650 with the September burn expectations building. Bear case: a BTC breakdown below $60,000 drags BNB to a $520 retest.

    6-month outlook

    By Q1 2027, we would expect two more quarterly burns to have happened and Fermi-related network activity to be visible on-chain. Base case puts BNB at $680, a touch below the $700 psychological level. The bull scenario, $820, requires BSC DEX volume share to grow and macro conditions to lean risk-on.

    Long-term (2027 to 2028)

    If the 100M supply target compresses meaningfully by late 2027 and Binance retains its exchange dominance, the $1,050 base case is plausible. The bull case, $1,600, is essentially a new all-time high scenario, which historically requires either a Bitcoin blow-off top or a Binance-specific structural catalyst. Both are possible, neither is guaranteed. For context, InvestingHaven’s 2026 peak call sits at $1,100.

    How does BNB compare to Ethereum in 2026?

    The two are often positioned as rivals, but the honest comparison is more nuanced. Ethereum is the developer-standard L1 with the largest DeFi ecosystem. BNB is the exchange-token-plus-fast-L1 hybrid with tighter tokenomics. Here is how the two stack up on the metrics that matter for price direction.

    Metric BNB Ethereum (ETH)
    Current price $582.63 $1,862.44
    Market cap $77.6B $224.8B
    Rank #4 #2
    Block time 0.45s (post-Maxwell) ~12s
    Finality 1.1s ~13 minutes
    Supply model Deflationary (target 100M) Deflationary (EIP-1559 burn)
    Circulating supply 133.17M ~120.3M
    Ecosystem lead Exchange integration, RWA DeFi, L2 stack, ETF flow
    30d change +5.1% +15.0%

    The takeaway is not that one wins. It is that BNB and ETH serve different portfolio roles. ETH is the beta play on the entire Ethereum stack including L2s. BNB is a more concentrated bet on Binance’s franchise value plus the deflationary math. If you already hold ETH, BNB adds ecosystem diversification. If you already hold BNB, ETH adds developer-ecosystem exposure. For a broader macro view, see our Bitcoin price prediction 2026, since BTC direction still drives most of the alt-L1 basket.

    What Would Change Our View on BNB?

    Three specific triggers would push us to revise the base case in either direction.

    Trigger 1 (bullish): A weekly close above $650 with sustained BSC DEX volume above $2B daily. That combination would confirm that both the technical and fundamental drivers are aligned, and it would open a path to $750 to $820 relatively quickly.

    Trigger 2 (bearish): Any new US or EU regulatory action against Binance or a Binance-branded product. This includes fines above $500 million, spot-market restrictions in a major jurisdiction, or forced delistings from Binance.US. The market has repriced these events aggressively in the past.

    Trigger 3 (bearish): A weekly close below $560 with volume above the 30-day average. That combination invalidates the $580 support thesis and typically opens a move toward $480 within four to six weeks. Similar patterns have played out three times in BNB’s history since 2021.

    If you want to see how other ecosystem tokens are pricing in similar risk-reward setups, our Cardano ADA price prediction 2026 covers a comparable L1 in a different market position.

    Frequently Asked Questions

    Will BNB reach $1,000 in 2026?

    It is plausible but not the base case. Reaching $1,000 requires roughly 72% upside from the current $583 level. Forecasts that call for it, including InvestingHaven’s $1,100 peak, assume a bullish macro backdrop, sustained BSC activity, and continued burn cadence. Our base case sits at $700 by year-end. $1,000 becomes a realistic target if BTC breaks decisively above $80,000 in Q4.

    Is BNB a good investment in 2026?

    BNB has three structural tailwinds: deflationary tokenomics, direct exchange utility, and post-Maxwell technical competitiveness. It also has real risks, mostly regulatory. For long-term holders comfortable with centralized-exchange exposure, BNB offers a more defensive risk-reward than most altcoins. For traders, the $560 to $650 range is the near-term structure to work with. Never allocate more than you can afford to lose.

    What is the BNB Auto-Burn and how does it work?

    Auto-Burn is BNB’s quarterly supply-reduction mechanism. Every quarter, Binance destroys a calculated amount of BNB based on the average price and block production during that quarter. The July 15, 2026 burn removed 1.615 million BNB, worth $932 million. Burns continue until total supply reaches 100 million, roughly 24% below current circulation. A separate mechanism, BEP-95, burns a portion of every gas fee in real time.

    What is the Maxwell upgrade on BNB Chain?

    The Maxwell hardfork was completed in 2025 and reduced BNB Smart Chain block times from three seconds to 0.45 seconds, with finality dropping from 7.5 seconds to 1.1 seconds. The result is a chain that feels closer to Solana on user-facing latency while retaining full EVM compatibility. Follow-up upgrades, Lorentz and Fermi, extended the performance work in 2026.

    How does BNB compare to Ethereum?

    BNB is faster, cheaper, and more centralized than Ethereum. Ethereum has the deeper developer ecosystem, larger DeFi TVL, and an ETF product driving spot flow. BNB has tighter supply mechanics and direct exchange utility. They serve different portfolio functions rather than competing for the same slot.

    What is the biggest risk to the BNB price in 2026?

    Regulatory action against Binance is the largest tail risk. Because BNB’s value is tied to exchange utility, any restriction on Binance’s operations in a major jurisdiction can trigger sharp downside. The technical risk is a weekly close below $560, which would invalidate the multi-month support base and open a move toward $480. Similar risk-reward setups are playing out in other high-utility tokens, our UNI price prediction 2026 walks through a comparable exchange-token structure on the DEX side.

    The Honest Take

    BNB in 2026 is not a moonshot. It is not a broken chart either. It is a top-five asset with a mechanical supply-reduction schedule, a real technical roadmap that is executing, and a large concentrated risk in the form of ongoing regulatory scrutiny. The base case, $700 by year-end, is a modest 20% move from here. The bull case, $900+, requires macro cooperation and a clean regulatory backdrop. The bear case, sub-$500, requires either a BTC breakdown or a Binance-specific event.

    For traders, the range is $560 to $650. For long-term holders, the burn schedule keeps working whether or not you check the chart. For everyone, the honest answer is that BNB’s next major move is more likely to come from a Binance headline than from a chart pattern. Watch the news feed as closely as the price feed.

    Data current as of publication. Prices sourced from CoinGecko. Burn figures sourced from BNB Chain official announcements.


    Disclaimer: This article is for informational and educational purposes only and should not be construed as financial, investment, or trading advice. Cryptocurrency markets are highly volatile, and past performance does not guarantee future results. The price predictions and analyses presented here are based on AI models, technical indicators, and available data at the time of writing, they are not guarantees. Always conduct your own research (DYOR) and consult with a qualified financial advisor before making any investment decisions. Pump Parade and its authors do not assume liability for financial losses incurred based on information provided in this article.
    Fetch.ai (FET) Price Prediction 2026: Can FET Hit $0.50?

    FET price prediction 2026 is one of the messier calls in AI crypto right now. The Artificial Superintelligence Alliance token trades at $0.14 as of July 31, 2026, down roughly 79% over the past year and about 96% off its 2024 peak of $3.45. That is not a chart that inspires morning coffee.

    But the story is not just the chart. The ASI Alliance, the merged network that folded Fetch.ai, SingularityNET, and CUDOS under a single token, shipped the ASI:One agentic platform in early 2026, launched the ASI:Create closed alpha in February, and continues to point at a late-2026 mainnet for ASI:Chain, its purpose-built layer one. Capital rotates back into AI crypto every time OpenAI or Anthropic ships a milestone, and FET is one of the few sub-$0.50 tickers still tied to a real product roadmap.

    This article breaks down where FET stands, why it is where it is, what would push it toward $0.50 or higher, and what would break the thesis. Bear, base, and bull targets are inside, along with a head-to-head with Bittensor (TAO).

    Key Takeaways

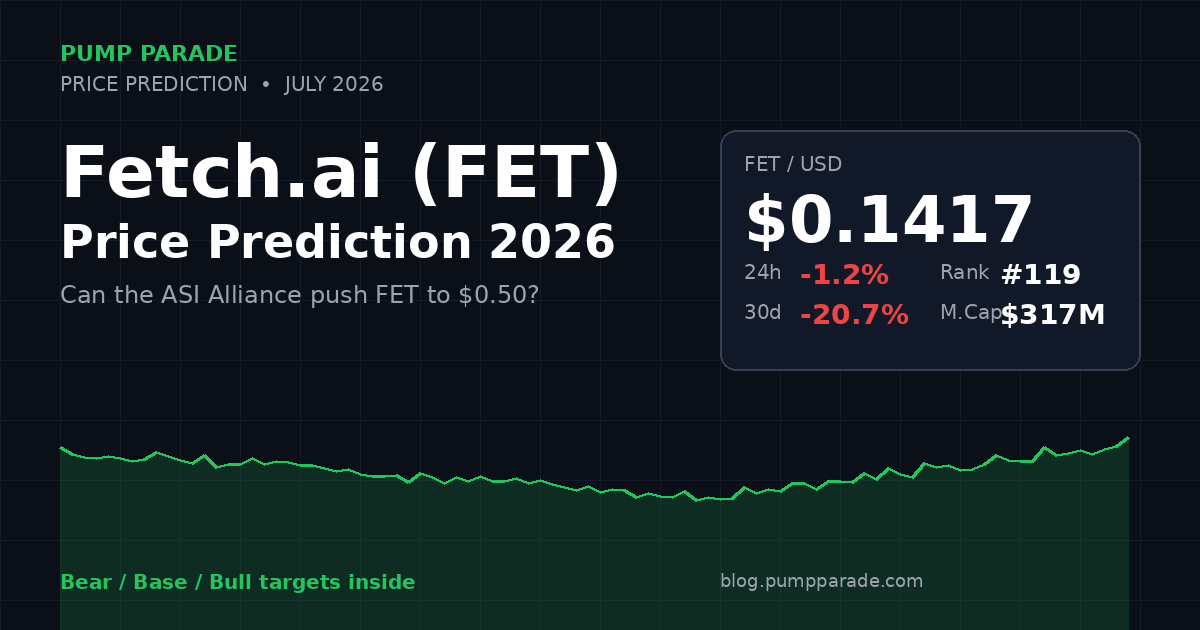
    • FET trades at $0.14, down 79% year over year, with a market cap near $317M and a rank of 119 by market cap.
    • The ASI Alliance product stack (ASI:One, ASI-1 models, ASI:Cloud, ASI:Chain) is the entire bull case. If any of these attract paying users, FET reprices fast.
    • Ocean Protocol withdrew from the alliance in October 2025, and the FET-to-ASI ticker rebrand is over a year late. Both are real execution flags.
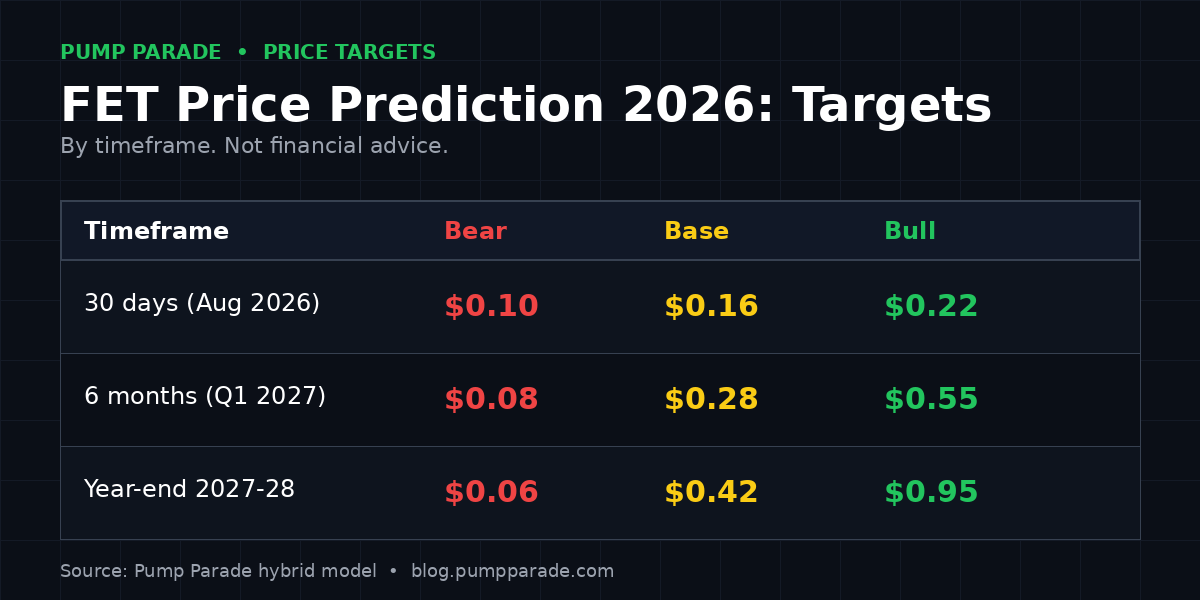
    • Our base case for year-end 2026 is $0.28 to $0.42. Bull case: $0.50 to $0.75. Bear case: $0.08 to $0.11.
    • Compared to Bittensor (TAO) at $194, FET is a much smaller-cap, higher-beta bet on the AI crypto category continuing to attract flows.
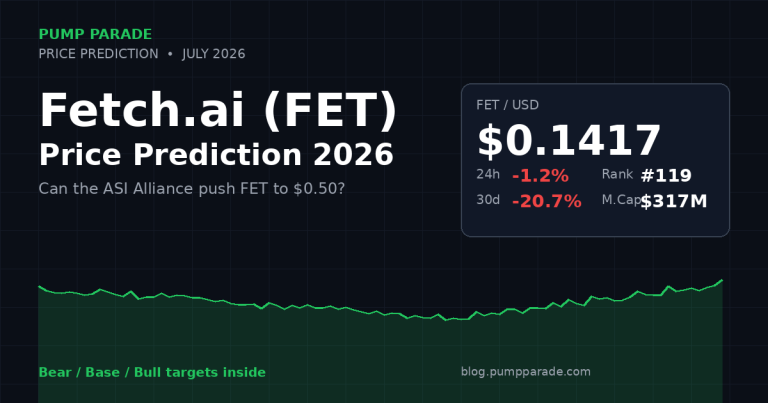
    Fetch.ai (FET) price prediction 2026 hero graphic, current price $0.14, ASI Alliance catalyst

    Where FET Stands Today

    Before we get to targets, here is the current snapshot. All numbers pulled from CoinGecko at time of writing.

    Metric Value
    Price $0.1417
    24h change -1.2%
    7d change -6.2%
    30d change -20.7%
    1y change -79.4%
    Market cap $317.6M
    24h volume $52.6M
    Market cap rank #119
    All-time high $3.45 (March 2024)
    Percent from ATH -95.9%

    The bulk of that damage came in the second half of 2025 and the first quarter of 2026, when the entire AI crypto basket, RENDER, FET, TAO, WLD, AKT, deflated in unison as ETF flows concentrated in Bitcoin and Ether. FET has underperformed its category. Render, for comparison, held its 2024 range better and rebounded harder in the July mini-rotation.

    Why is FET losing steam right now?

    Three overlapping reasons, in order of importance.

    1. The ASI Alliance narrative got harder to sell. The original 2024 pitch was clean: four AI-crypto teams merge, one token, one roadmap, one story. Ocean Protocol formally withdrew in October 2025 over governance and tokenomics disputes, which broke the “one story” part. The remaining alliance (Fetch.ai, SingularityNET, CUDOS) still ships product, but the marketing surface got messier.

    2. The FET-to-ASI ticker rebrand is over a year late. Announced in 2024, the ticker migration has slipped repeatedly. Data aggregators list the project under “Artificial Superintelligence Alliance,” but exchanges still trade FET. That kind of drift signals coordination friction between the alliance members and creates a low-grade overhang. Traders hate ambiguity.

    3. AI crypto rotated to megacaps. Since Q4 2025, capital that used to spread across the mid-cap AI basket has concentrated in Bittensor (TAO) and, to a lesser extent, Near (NEAR). NEAR benefited from its AI resharding narrative, covered in our NEAR 2026 outlook. FET was left holding the bag as generalist crypto funds decided one AI winner per portfolio was enough.

    The setup now is a token trading near the low end of a 12-month range, with real product shipping but no clear catalyst yet strong enough to force a re-rating.

    What is the bull case for FET in 2026?

    The bull case is not “AI crypto season two.” It is more specific than that.

    Catalyst 1: ASI:Chain mainnet

    The alliance has publicly targeted a late-2026 or early-2027 mainnet for ASI:Chain, a layer-one purpose-built for AI agent settlement and payments. Every prior L1 launch in the AI category (Near’s AI resharding, Bittensor’s subnet expansion) has produced a 30-to-60 percent rally into the event and a sell-the-news dip afterward. If ASI:Chain ships to schedule and any measurable agent volume routes through it, FET has an obvious re-rating catalyst. If it slips again, the credibility damage is worse than the slip.

    Catalyst 2: ASI:One and ASI-1 finding paying users

    ASI:One is the alliance’s agentic platform, and ASI-1 is a family of Web3-native language models. Both launched in 2026. The bull case is not that they beat GPT or Claude on benchmarks. It is that they carve out a niche in verifiable, agent-to-agent commerce where centralized models are not welcome (think: DeFi bots, on-chain identity, autonomous trading agents). If usage metrics on those products can be independently verified, and if the alliance publishes them, the AI-crypto discount closes.

    Catalyst 3: The rebrand finally happens

    The FET-to-ASI ticker migration is expected to be one-to-one with no dilution, based on alliance guidance. A completed rebrand removes the coordination overhang, forces a fresh listing cycle at major exchanges, and typically produces a 10-to-25 percent short-term bid from index rebalancing and search-driven inflows. It is a lower-conviction catalyst than ASI:Chain, but it is cheaper on the calendar.

    The Bear Case for FET in 2026

    Risk 1: Execution slippage kills the story

    ASI:Chain has already been floated as a “late 2026” target for over a year. Another slip pushes mainnet into 2027 and forces the market to price the alliance as a research group rather than a product company. In that scenario, FET drifts to the $0.08 to $0.11 zone, roughly the 2022 base, and stays there until something ships.

    Risk 2: Another alliance member exits

    Ocean’s departure was framed as amicable but read as anything but. If CUDOS or SingularityNET disengages the same way, the alliance is effectively Fetch.ai again with extra branding, and the merger premium collapses. A single unfavorable governance vote could trigger this.

    Risk 3: The AI meta stops paying

    The last two years have taught a hard lesson: “AI + crypto” as a category theme is a fast rotation trade, not a durable holding. If capital rotates back to DePIN or RWA or an unnamed 2027 narrative, no execution win at ASI is going to save the price. This is the risk that is genuinely out of the alliance’s control.

    Fetch.ai (FET) Price Prediction 2026: Targets by Timeframe

    Fetch.ai (FET) price prediction 2026 targets table, bear $0.06, base $0.42, bull $0.95

    Our hybrid model blends technical structure, on-chain activity, and category flows. Numbers are targets, not forecasts. Read the conditions.

    Timeframe Bear Base Bull
    30 days $0.10 $0.16 $0.22
    6 months (Q1 2027) $0.08 $0.28 $0.55
    Year-end 2027-28 $0.06 $0.42 $0.95

    30-day outlook (August 2026)

    The near-term picture is a range trade between $0.11 support (July low) and $0.17 resistance (the 30-day moving average). Volumes are thin at $52M per day, well below the 90-day average of $78M, which means the token moves easily in both directions on modest flow changes. Base case is a reclaim of $0.16 if BTC holds above $95K. Bear case is a $0.10 flush if AI-basket beta hands back another leg.

    6-month outlook (Q1 2027)

    The pivot is ASI:Chain. If the alliance publishes a firm mainnet date in Q4 2026 and hits it, FET has a lane to $0.55 as speculators front-run the launch. Base case assumes the rebrand completes and ASI:One shows measurable weekly active agent counts. Bear case assumes another delay and the token returns to its 2022 lows.

    Year-end 2027-28 outlook

    The long tail depends on whether the AI-crypto category is a durable narrative or a rotation. Analysts at Changelly and Coincub cluster their 2026-27 FET targets between $0.30 and $0.95, roughly matching our base-to-bull band. For comparison, CoinGecko’s community sentiment currently sits at 68% bullish, high but not extreme.

    How does FET compare to Bittensor (TAO)?

    FET and TAO are the two AI-native tokens most traders benchmark against each other. Here is the head-to-head.

    Metric FET (ASI) TAO (Bittensor)
    Price $0.14 $194
    Market cap $317M $1.9B
    Rank #119 #42
    Architecture Agentic platform + coming L1 Subnet incentive network
    Primary use case AI agent commerce, ML models Decentralized AI compute + subnets
    30d performance -20.7% -2.5%
    1y performance -79.4% flat
    Risk profile Higher beta, more upside if it works Lower beta, established category leader

    Read the table as a beta trade. TAO is the safer AI-crypto exposure. FET is the higher-torque bet on a specific catalyst calendar. Neither is obviously wrong.

    What Would Change Our View

    Three explicit triggers that would move us off the base case.

    Upgrade to bull if: the alliance publishes verified weekly-active-agent counts on ASI:One above 25,000 for two consecutive months, or a Tier-1 exchange lists ASI:Chain testnet ahead of mainnet. Either signals that the product stack is finding real usage.

    Downgrade to bear if: another alliance member (CUDOS or SingularityNET) publicly explores exit, or the ASI:Chain mainnet is pushed to H2 2027 with no firm date. Both indicate the merger thesis is unwinding.

    Stay base if: ASI:One and ASI-1 continue to ship features on a monthly cadence, but usage metrics remain private. That is the current condition, and it justifies a range trade rather than a directional call.

    Frequently Asked Questions

    What is FET used for?

    FET is the native token of the Artificial Superintelligence Alliance. It is used to pay for services on the Fetch.ai agent network, stake on validator nodes, and access AI models and compute through ASI:One and ASI:Cloud. In short, it is the fee and settlement token for decentralized AI agent commerce.

    Can FET reach $1 in 2026?

    Reaching $1 in 2026 would require roughly a 7x from current levels. That would put the market cap near $2.2B. Possible in a strong AI-crypto rotation combined with an on-time ASI:Chain mainnet, but not our base case. Our bull target for 2027-28 is $0.95, which brushes the $1 mark but stops short.

    Is FET a good long-term investment?

    FET is a high-conviction, high-risk bet on the AI crypto category and on the ASI Alliance shipping to its roadmap. The upside is real if the alliance executes. The downside is a slow bleed to $0.06 to $0.08 if it does not. Long-term investors should size the position accordingly and treat it as venture, not blue chip.

    Is FET the same as ASI Alliance?

    Practically, yes. FET is the ticker still in use across exchanges, while “Artificial Superintelligence Alliance” or “ASI” is the project name used by data aggregators. A rebrand of the ticker from FET to ASI has been proposed on a one-to-one basis with no dilution, but as of July 2026 the migration is still pending.

    Why is FET price falling?

    Three factors. Ocean Protocol’s exit from the alliance in October 2025 weakened the merger narrative. The FET-to-ASI ticker rebrand has slipped repeatedly, creating a coordination overhang. And capital in the AI crypto basket has concentrated in larger tokens like TAO, leaving mid-caps like FET underperforming.

    What is the difference between FET and TAO?

    TAO is the token of Bittensor, a decentralized network of AI subnets that compete on producing useful ML outputs. FET is the token of the ASI Alliance, an agentic platform focused on AI agent commerce and, eventually, its own layer-one chain. TAO is more established and higher-cap. FET is smaller, more speculative, with a specific catalyst calendar tied to ASI:Chain.

    The Honest Take

    FET at $0.14 is a bet, not a trade. The category theme (AI + crypto) is real, the product roadmap is real, and the price has already absorbed most of the disappointment of the past 18 months. But the thesis rests on execution: ASI:Chain has to ship, the rebrand has to close, and usage metrics have to leave the private slide decks and show up on-chain.

    If any two of those happen, $0.28 to $0.42 by year-end 2026 is a reasonable base case, and $0.55-plus becomes live. If none happen, the token drifts. It is that binary.

    Traders who want AI-crypto exposure with less execution risk should look at TAO or hold both. Others tracking the AI + identity corner might also compare against Worldcoin’s 2026 setup, which has faced a similar rotation dynamic. Traders who want the higher-torque version of the same bet are the natural buyers of FET here. Just do not buy on the story alone. Set an invalidation level (we would use a weekly close below $0.09) and respect it.

    Disclaimer: This article is for informational and educational purposes only and should not be construed as financial, investment, or trading advice. Cryptocurrency markets are highly volatile, and past performance does not guarantee future results. The price predictions and analyses presented here are based on AI models, technical indicators, and available data at the time of writing, they are not guarantees. Always conduct your own research (DYOR) and consult with a qualified financial advisor before making any investment decisions. Pump Parade and its authors do not assume liability for financial losses incurred based on information provided in this article.
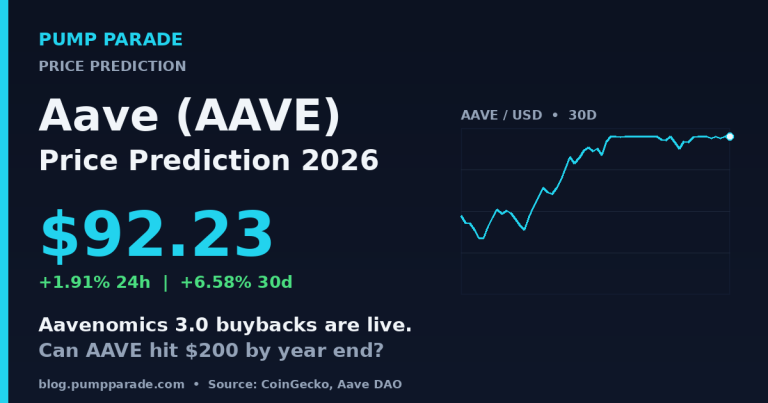
    Ondo (ONDO) Price Prediction 2026: Can ONDO Hit $1?

    Any serious Ondo price prediction 2026 has to start with the tape. ONDO trades at $0.42 as of July 30, 2026, up 35% over the past 30 days and 12.9% over two weeks. That’s the strongest one-month move the token has posted since Q4 2024, and it lands on top of the busiest news window Ondo has ever had.

    On July 28, the team quietly killed off its planned Layer-1 blockchain, replacing it with a private execution network called Ondo Network. Three days earlier, the DAO closed a governance vote on burning 100 million tokens (10% of total supply). Two weeks before that, Ondo Global Markets rebranded to Ondo Stocks and crossed $1 billion in tokenized-equity TVL.

    That’s a lot for a token most retail traders still think of as “the RWA one that never quite ran.” The question that matches how people actually search: is this the setup that finally pushes ONDO back toward $1, or another RWA rally that fades before institutional flows show up? This breakdown walks through the chart, the real catalysts, the bull and bear cases, and specific price targets by timeframe. We also compare Ondo directly to Chainlink for RWA exposure and answer the five questions readers ask most about ONDO right now.

    Key Takeaways

    • ONDO price today: $0.42, +35% over 30 days, still 80% below the December 2024 all-time high of $2.14.
    • Fresh catalyst: Ondo Network went live July 28, 2026, replacing the planned Ondo Chain L1 with a Trusted Execution Environment (TEE) based private network for tokenized equities.
    • Supply catalyst: The 100 million ONDO burn vote concluded on July 25, potentially removing 10% of total supply.
    • Product growth: Ondo Stocks (formerly Ondo Global Markets) crossed $1 billion TVL in May and now holds over 70% of the tokenized-equity issuer market.
    • Base case 2026 target: $0.55 to $0.75; bull case $1.00 to $1.20 requires sustained RWA flows and a token unlock schedule that behaves.
    Ondo (ONDO) price prediction 2026 hero graphic showing ONDO at $0.42 with Ondo Network catalyst

    Where Does ONDO Stand Today?

    Before the forecast, the numbers. All figures pulled from CoinGecko and on-chain data at time of writing.

    Metric Value
    Price $0.42
    24-hour change +3.0%
    7-day change +4.0%
    30-day change +35.1%
    Market cap $2.04 billion
    24-hour volume $115.6 million
    Market cap rank #41
    Circulating supply 4.87 billion (48.7% of max)
    Fully diluted valuation $4.20 billion
    All-time high $2.14 (Dec 15, 2024)
    % from all-time high -80.4%

    Two numbers matter most here. First, that 35% one-month move is the strongest 30-day performance ONDO has posted since Q4 2024. Second, the gap between market cap ($2.04B) and fully diluted valuation ($4.20B) tells you unlock overhang is still real: only 48.7% of max supply is circulating. Any credible bull thesis needs to reconcile with that.

    Why Is ONDO Rebounding Right Now?

    The chart lift is not one thing. It is three, stacked.

    The first is product traction. Ondo Stocks (rebranded from Ondo Global Markets in mid-July) crossed $1 billion in TVL less than eight months after launch, and now holds an estimated 70% share of the tokenized-equity issuer market. Cumulative trading volume passed $18 billion by May. An Ondo executive quoted in TheStreet expects the tokenized equity market to hit $2.5-3 billion by year-end, and Ondo’s early lead makes it the default beneficiary.

    The second is the July 25 burn vote. The DAO closed a governance proposal to permanently burn 100 million ONDO from the treasury, equal to 10% of the fixed 1 billion total supply. Vote reporting is thin, but the market has priced in a passing outcome. If executed, that’s a hard supply reduction that changes the FDV math meaningfully.

    The third is the Ondo Network pivot, announced July 28. Rather than launching a public Layer-1 chain, Ondo shipped an offchain execution network that runs trading software inside Trusted Execution Environments (TEEs), keeping order flow and positions private while settling on public blockchains. CEO Ian De Bode framed it as the evolution of Ondo Chain, not a fresh product. Traders read it as a faster path to institutional order flow than waiting on a live L1.

    Stack those three catalysts together and the 35% move looks less like a memecoin pump and more like re-rating on real product news. The question is how much of that is already priced in.

    The Bull Case for ONDO in 2026

    1. RWA Is the Trade That Actually Has Institutions

    Tokenized real-world assets on public chains hit $31 billion by July 2026, up more than 400% since early 2025, per industry trackers. Standard Chartered projects the market reaches $30 trillion by 2030. Even the more conservative McKinsey estimate lands at $2-4 trillion. Ondo sits at the retail-facing end of that build-out, issuing tokenized US Treasuries (OUSG), a dollar yield product (USDY), and now 260+ tokenized US stocks and ETFs including SPY, QQQ, NVDA, and TSLA.

    The bull thesis is simple: if RWA is the on-chain product that finally onboards non-crypto capital, Ondo has the highest-quality distribution surface in the sector. Ondo Stocks alone crossed $1B TVL in under eight months, faster than any tokenized-equity platform before it.

    2. The BlackRock and Broadridge Relationship

    On July 2, Ondo announced a Broadridge Financial Solutions partnership to tokenize BlackRock’s iShares Core S&P 500 ETF (IVV) and Micron Technology shares on Ethereum. This is the kind of pipe that matters. Broadridge handles back-office plumbing for a huge share of Wall Street. BlackRock is BlackRock. If IVV can be tokenized cleanly, most of the ETF universe can follow, and Ondo becomes the default rails for that flow.

    3. Supply Reduction Actually Bites Here

    ONDO’s fixed 1 billion supply cap makes the 100 million burn proposal unusually meaningful. If enacted, circulating supply moves from 4.87 billion (yes, ONDO uses a 10 billion max split into a 1B “protocol” allocation plus other buckets in some tracker views) to 4.77 billion, and long-term dilution shrinks. Combined with any fee-switch governance move in H2 2026, ONDO could start capturing protocol revenue directly, which is the missing piece for most infrastructure tokens.

    The Bear Case for ONDO in 2026

    1. The Unlock Overhang Is Real

    Circulating supply is 48.7% of max. The remaining tokens are scheduled to unlock across the next several years. Every rally faces the same headwind: sellers with cost basis at seed valuations. Analysts at InvestingHaven flag this as the single biggest reason ONDO has failed to reclaim $1, and the burn vote (if it passes) trims but does not eliminate the overhang.

    2. Regulatory Timing Risk on Tokenized Stocks

    Ondo Stocks currently serves non-US users. The upside case assumes the SEC and the CLARITY Act framework crystallize into a workable US regime for tokenized equities. If that timeline slips into 2027 (plausible), US retail flow, the largest available pool, stays offshore for another year. Regulatory rumors have historically produced 10%+ moves in ONDO in either direction.

    3. Competition Is Getting Sharper

    Chainlink is building the settlement-and-oracle layer under the entire institutional RWA stack. Securitize, Backed, and Centrifuge are all issuing tokenized product. BlackRock and Franklin Templeton have their own in-house tokenized funds. Ondo has to keep out-executing on distribution and integrations to hold its 70% share of tokenized equities. It is not guaranteed.

    ONDO Price Prediction 2026: Targets by Timeframe

    Ondo (ONDO) price prediction 2026 targets table showing bear $0.30, base $0.65, bull $1.05 targets

    Here is how we frame the ONDO price forecast for 2026 across three time horizons. These are ranges, not calls, and each is tied to explicit conditions.

    Timeframe Bear Base Bull
    30 days (Aug 2026) $0.36 $0.45 $0.58
    6 months (Jan 2027) $0.30 $0.65 $1.05
    Long-term (2027-2028) $0.45 $1.20 $2.15 (retest ATH)

    30-Day Outlook (August 2026)

    The near-term chart shows ONDO consolidating just under $0.43 resistance after a 35% run. Base case is a range-bound month between $0.38 and $0.48 as the market digests the Ondo Network launch and awaits confirmed burn execution. A clean break above $0.48 opens a path toward the $0.58-$0.62 zone, which lines up with the last major rejection level from Q4 2024. A failure to hold $0.38 puts the 200-day moving average around $0.32-$0.34 back in play.

    6-Month Outlook (January 2027)

    The base case ($0.65) assumes the burn is executed, Ondo Stocks TVL reaches the company’s own $2.5-3 billion year-end guidance, and one of the tokenized-ETF pipes (IVV, or a comparable BlackRock or State Street product) is publicly live. The bull case ($1.05) additionally requires a fee-switch vote to pass and give ONDO holders direct claim on protocol revenue. Analysts at CCN and Coinpedia both project ranges that overlap our base case, with some outlier bull calls running to $1.80.

    Long-Term Outlook (2027-2028)

    Standard Chartered’s $30 trillion RWA forecast is the ceiling. If Ondo maintains anything like a 70% share of tokenized equities and expands into tokenized private credit, the market cap math supports a retest of the $2.14 all-time high in a genuine RWA cycle. Changelly’s model projects an average of $0.64-$0.74 across 2026-2027, while CoinCodex sees $2.56 as achievable in a full cycle. Our base case sits between the two.

    How Does Ondo Compare to Chainlink for RWA Exposure?

    ONDO and LINK are the two tokens most often paired in RWA-tokenization discussions, so it helps to be specific about what each actually does.

    Factor Ondo (ONDO) Chainlink (LINK)
    Role in RWA stack Issuer of tokenized products Oracle and settlement layer
    Main products OUSG, USDY, Ondo Stocks Data Feeds, CCIP, Proof of Reserve, NAVLink
    Market cap (Jul 2026) $2.04B $6.26B
    30-day price change +35.1% +15.1%
    Institutional partners BlackRock (via Broadridge), Franklin Templeton advisor, WisdomTree JP Morgan, DTCC, SWIFT pilot participants
    Circulating supply / max 48.7% (unlock overhang) ~68% (lower dilution risk)
    Best-case ceiling story Direct upside from tokenized product TVL and fees Toll booth on every RWA transaction

    Our read: they are complements, not substitutes. If you want direct beta to the tokenized product surface, ONDO is the closer bet. If you want lower-volatility exposure to the entire RWA build-out including inter-chain settlement, LINK is the pick. For a deeper LINK breakdown, see our recent Chainlink price prediction 2026: DTCC tokenization catalyst analysis.

    What Would Change Our View on ONDO?

    Three explicit triggers would move our base case:

    1. Burn does not execute. If the July 25 vote fails to translate into an on-chain treasury burn within 60 days, one leg of the bull thesis is gone. That drops our base case for January 2027 from $0.65 to $0.45.
    2. CLARITY Act or SEC tokenized-stock rules land in 2026. A workable US framework for tokenized equities opens the largest retail pool and would push our bull case toward the $1.20-$1.40 range.
    3. Ondo Stocks share drops below 50%. If a competitor (Securitize, Backed, or an in-house BlackRock issuance) takes material market share by end of 2026, Ondo’s premium multiple compresses. Base case would move from $0.65 to $0.50.

    Frequently Asked Questions

    Will ONDO reach $1 in 2026?

    Under our base case ($0.65 for January 2027), no. Reaching $1 requires the bull case: burn executed on-chain, Ondo Stocks TVL near $3 billion, and either a fee-switch vote passing or a clear US regulatory framework for tokenized equities. Probability we currently assign to that path: roughly 25-30%.

    Is Ondo a good investment in 2026?

    Ondo has the strongest institutional distribution story in the RWA sector and the freshest catalyst stack of any large-cap RWA token. The risk sits in token unlocks and regulatory timing. It is a higher-conviction bet than most sub-$5B market cap tokens, but it is not without downside. Position sizing matters. This is analysis, not advice.

    What is the ONDO price prediction for 2026 end of year?

    Our year-end 2026 range is $0.55 (bear), $0.72 (base), and $1.10 (bull), assuming the burn executes and Ondo Stocks hits year-end TVL guidance. Analyst targets from CCN, Coinpedia, and Changelly cluster in the $0.60 to $1.20 zone, aligning with our base and bull cases.

    What is Ondo Network and why does it matter?

    Ondo Network is an offchain execution layer launched on July 28, 2026, that runs trading logic inside Trusted Execution Environments (TEEs) and settles on public chains. It replaced Ondo Chain, the planned Layer-1. For traders, it means faster time-to-market and better privacy for institutional order flow, though it also concentrates trust in the Ondo-run infrastructure.

    How does the ONDO token capture value?

    Today, ONDO is primarily a governance token with claims on treasury actions like the recent 100 million burn vote. There is no live fee switch yet, meaning revenue from OUSG and Ondo Stocks does not flow to holders directly. A fee-switch proposal is expected in H2 2026, and passage would be the single largest structural upgrade to how ONDO captures value.

    The Honest Take

    ONDO is one of the few tokens where the fundamentals are actually running ahead of the price. Ondo Stocks did $1 billion in TVL faster than any tokenized-equity platform in history. The BlackRock and Broadridge relationship is real. The Ondo Network launch removes a two-year execution risk that used to hang over the story. Standard Chartered’s $30 trillion RWA forecast, even if we discount it by 80%, still leaves an addressable market that dwarfs today’s $31 billion.

    The problem is the same problem it has always been: dilution, and a token model that has not yet captured protocol revenue. Until the fee switch flips and the unlock cliff materially eases, ONDO trades at a discount to what the product line implies. Our base case for 2026 has ONDO between $0.55 and $0.75, which is respectable but not the ten-bagger the RWA maxis are pitching on Crypto Twitter.

    If you are RWA-bullish and want the highest-beta exposure to on-chain tokenized product, ONDO is the trade. Just do not confuse the sector being right with the token being cheap. For readers looking at adjacent themes, our XRP price prediction 2026 covers the payments and cross-border settlement angle, and the Stellar (XLM) 2026 outlook looks at the DTCC-linked tokenization pipe from a different angle.

    External references worth reading directly: the Ondo Global Markets $1B TVL announcement and the CoinDesk write-up on the Ondo Network pivot.

    Disclaimer: This article is for informational and educational purposes only and should not be construed as financial, investment, or trading advice. Cryptocurrency markets are highly volatile, and past performance does not guarantee future results. The price predictions and analyses presented here are based on AI models, technical indicators, and available data at the time of writing, they are not guarantees. Always conduct your own research (DYOR) and consult with a qualified financial advisor before making any investment decisions. Pump Parade and its authors do not assume liability for financial losses incurred based on information provided in this article.
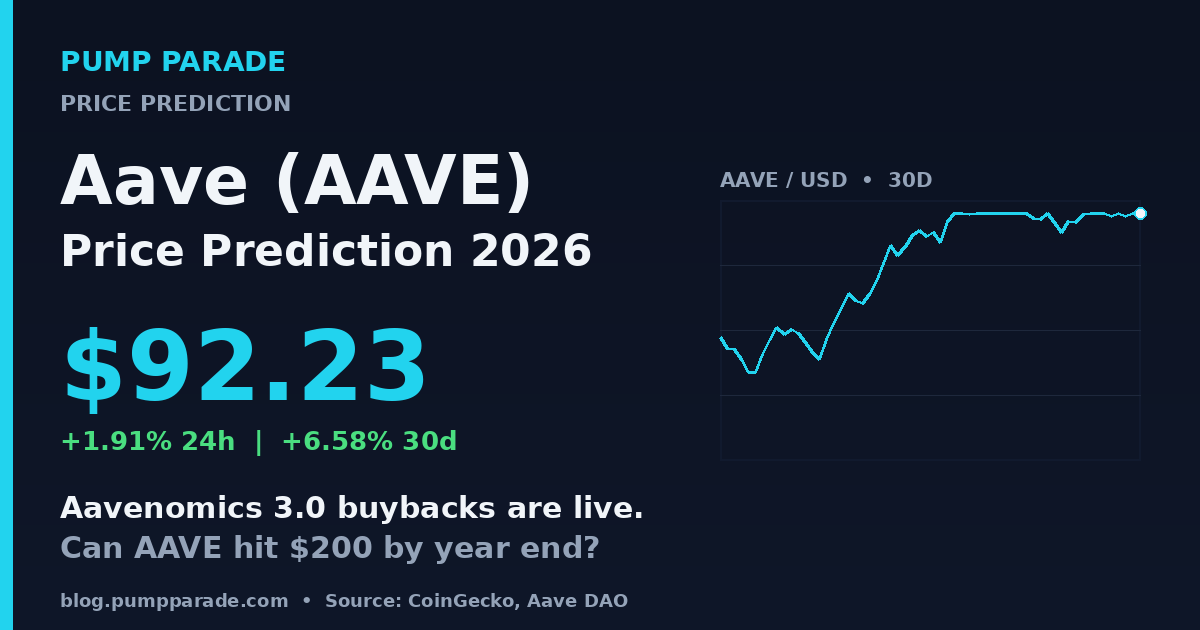
    Maestro Bot Review 2026: Fees, Features & Verdict

    0

    Maestro Bot is one of the few Telegram trading bots that has actually survived the last two market cycles. While the top of the sniper-bot leaderboard has churned through Unibot, Banana Gun, Sigma, GMGN, and a wave of pump.fun-era Solana copies, Maestro has quietly compounded users on Ethereum, BNB Chain, Base, Solana, and nine other networks. In 2026 the team publishes 573,000+ total users and $12.8B+ in lifetime volume across 14 chains, verified on-chain via Dune dashboards.

    The question this review answers: is Maestro still the right pick if you trade EVM chains and want a single bot for sniping, copy trading, and portfolio tracking, or has the market moved on? We opened a Maestro account, funded it, ran real trades on Ethereum and Base, and compared the fee math against alternatives. Here is what we found.

    Quick Verdict

    Rating: 4.2 / 5. Strong Buy for Active EVM Traders.

    Maestro is the most mature multi-chain Telegram trading bot on the market. The 1% per-trade fee is average for the category (not the cheapest, not the most expensive), but the coverage across 14 chains, the anti-rug engine, and the copy-trading module justify it for anyone who trades across multiple networks. The main knock is that Maestro is custodial (the bot holds your keys), so it should be treated strictly as a hot wallet, never as long-term storage.

    If you trade primarily Solana memecoins, dedicated Solana bots like Photon or BullX have a slight edge on execution speed and interface polish. If you trade EVM, Maestro is the default answer.

    Maestro Bot supports 14 blockchains via Telegram interface
    Maestro operates across 14 blockchains via a Telegram-native interface.

    What Is Maestro Bot?

    Maestro is a suite of Telegram bots (Sniper, Wallet, Whale, and Buy) that let you snipe token launches, execute swaps, copy other wallets, and manage positions across 14 blockchains, all from inside a Telegram chat. You send commands as messages, the bot signs and broadcasts transactions in the background, and results come back as chat replies.

    The product was launched in mid-2022 during the peak of the Telegram bot bull run, and unlike most of its competitors from that era, it has continued shipping updates through the 2024 bear market and into the 2025 to 2026 memecoin cycle. In terms of active user counts and cumulative volume, it now sits in the top three multi-chain trading bots alongside Banana Gun and BonkBot.

    Chain coverage in 2026 includes Ethereum, Solana, BNB Chain, Base, Arbitrum, Avalanche, TON, Tron, Hyperliquid, Blast, Polygon, Optimism, Linea, and Scroll. Auto Sniper (the pre-signed launch buyer) currently runs on Ethereum, BSC, Base, Arbitrum, and Solana.

    Features Deep Dive

    Maestro Bots official promotional image
    The Maestro suite: Sniper, Wallet, Whale, and Buy bots. Source: maestrobots.com.

    Sniper and Auto Sniper

    Sniper is the flagship module. You paste a contract address or a token ticker, set your buy size and slippage, and the bot fills the trade in the next block. Community benchmarks put Maestro’s execution at roughly 0.25 seconds on EVM chains and 0.15 seconds on Solana, which is in the same tier as Banana Gun and slightly behind the fastest Solana-only bots like Photon.

    Auto Sniper is a different beast. You point it at a token address before launch, set your max buy and slippage rules, and Maestro monitors the mempool for the liquidity-add transaction. The moment it appears, the bot fires a pre-signed buy in block zero. On EVM chains that means competing for the same block as the deployer, and Maestro’s private-mempool routing gives it a fair shot at inclusion without being sandwiched.

    Copy Trading

    Copy Trading lets you mirror any public wallet’s buys and sells. You paste the wallet address, set a copy ratio (for example, buy 10% of whatever the target buys), and configure per-token exclusion filters. The bot then watches that wallet on-chain and replicates trades automatically.

    The 2026 version added multi-wallet copy trading (up to 20 wallets per subscription) and a leaderboard of publicly-followed traders sorted by 30-day PnL. The leaderboard is useful for finding candidates but you should treat it with skepticism. Wallets on it tend to be aggressive traders whose returns are highly path-dependent.

    Call Channels

    Call Channels is a feature that connects Maestro to alpha Telegram groups. When a group posts a contract address in a formatted “call,” Maestro can automatically buy it based on your rules. This is the most controversial feature in the product because it makes it trivial to get rugged by malicious channels. Maestro’s Anti-Rug engine mitigates but does not eliminate this. Use with caution and small size only.

    Limit Orders 2.0

    Limit Orders 2.0 rolled out in Q1 2026 and is genuinely useful. You can now set multiple take-profit levels (for example, sell 33% at 2x, 33% at 5x, 34% at 10x) plus a trailing stop-loss, all in one order. Previously you had to chain manual sell commands. The new order system runs entirely on Maestro’s off-chain execution engine and fires on-chain when price triggers hit.

    Anti-Rug and Anti-MEV

    Anti-Rug is a static-analysis system that inspects a token contract before buy execution and flags common rug patterns: honeypots, hidden mint functions, blacklist calls, and sudden tax hikes. It is not perfect (nothing catches every rug), but it catches the obvious ones and will hard-block a buy on tokens flagged as honeypots.

    Anti-MEV routes your EVM transactions through private mempools (Flashbots Protect on Ethereum, and equivalent relays on BSC and Base) to keep them out of public sight until inclusion, blocking sandwich attacks. This is on by default and costs no extra fee. On Solana, MEV protection is handled via Jito bundles.

    Positions Ledger

    Positions Ledger is a unified view of everything you hold across all 14 chains in a single Telegram message. It shows cost basis, current value, unrealized PnL, and 24-hour change per position. It is the closest thing Maestro has to a proper portfolio dashboard, and it is one of the reasons multi-chain traders keep coming back. You do not need to bounce between block explorers to see what you own.

    Fees and Pricing

    Maestro Bot key statistics 2026
    Maestro Bot lifetime stats: 573K+ users, $12.8B+ volume, 14 chains supported.

    Maestro’s fee structure is simple: 1% per successful trade, no subscription tier required to start, no gated features behind higher tiers. Failed trades are not charged. Additional network gas fees apply as normal (Solana priority fees, EVM gas, etc.), and Maestro passes those through at cost.

    Two things worth knowing:

    • Cashback: Traders can claim up to 30% of their fees back via the /cashback command. The exact percentage scales with 30-day trading volume, and cashback is credited to your bot wallet weekly.
    • Referrals: The referral program pays 35% of referred users’ fees for the first month, then 25% for life. This is one of the more generous programs in the category and is a major reason Maestro’s user base has kept growing.

    How does 1% compare?

    • Photon: 1.00%
    • BullX: 1.00%
    • GMGN: 1.00%
    • Banana Gun: 0.5% base (0.75% for snipes, 1% for manual buys)
    • Trojan: 0.9%
    • Maestro: 1.00% (net ~0.7% after cashback for high-volume users)

    For a $10,000 monthly trading volume, Maestro’s fee is $100 gross, or roughly $70 after cashback. That is competitive but not the cheapest option in the market.

    Pros and Cons

    Pros:

    • Widest chain coverage of any Telegram trading bot (14 networks, 5 with Auto Sniper)
    • Mature product with 4+ years of live trading and no major security incidents on the core bot
    • Anti-Rug engine catches most obvious honeypots and blacklist scams
    • Anti-MEV is on by default with no extra fee
    • Cashback and referral programs meaningfully reduce effective fee
    • Limit Orders 2.0 is best-in-class for multi-level exits
    • Positions Ledger is a rare unified multi-chain portfolio view inside a Telegram bot

    Cons:

    • Custodial by default (the bot holds your keys); should not be used for long-term storage
    • 1% fee is higher than Banana Gun’s base 0.5% for spot trading
    • Execution speed on Solana slightly trails dedicated Solana bots like Photon and BullX
    • UI is Telegram-native, which means no charts, no advanced order book views, and a steeper learning curve than web terminals like Photon
    • Call Channels feature makes it easier to get rugged if you follow the wrong groups

    Security and Trust

    Maestro is custodial. When you create an account, the bot generates a wallet on your behalf and stores the private key server-side, encrypted with your Telegram-linked session. This is the standard model for Telegram trading bots and it is what enables the sub-second execution. It also means you are trusting the Maestro team not to be compromised, not to be malicious, and not to lose your keys.

    Track record so far is clean. Maestro has run since mid-2022 without a public compromise of user funds. The team is pseudonymous but publicly active, publishes regular updates on their official X account, and has integrations with major infrastructure providers (Flashbots, Jito, BloXroute). There is no public third-party security audit of the wallet code, which is a real gap compared to non-custodial wallets like Solflare or Phantom.

    Practical security guidance: Treat your Maestro wallet as a hot wallet. Keep only the capital you actively trade in it. Use the /withdraw command to move profits to a hardware wallet regularly. Never store more than a week’s trading float in the bot.

    User Experience

    Maestro lives entirely inside Telegram, and that is both the strength and the limitation. The strength: you already have Telegram open, the bot is one tap away, and every command is text-based (easy to script, easy to muscle-memorize). The limitation: there are no charts, no depth-of-market views, and no way to see your positions visually. Every action is a message.

    Onboarding takes about two minutes. You open Telegram, search for @MaestroSniperBot, tap Start, and the bot walks you through creating a wallet and funding it. The default settings work for most first trades. Advanced settings (per-chain slippage, priority fee tiers, MEV routing preferences) are available through the /settings menu.

    Mobile experience is excellent (Telegram is a mobile-first app). Desktop works but feels less native. There is no browser extension or standalone web app, which is a real gap if you want candlestick charts alongside your buys. Most active traders pair Maestro with a chart tool like Birdeye or DexScreener open in another tab.

    Verdict and Use-Case Recommendations

    Best for: Multi-chain EVM traders who want one bot for Ethereum, Base, BSC, and Arbitrum. Copy traders who want to mirror multiple wallets across chains. Any trader who values Anti-MEV routing being on by default.

    Skip if: You trade only Solana memecoins (Photon or BullX are faster and have real charts). You want a non-custodial setup (use Phantom + Jupiter instead). You need advanced order types beyond limits (use a real DEX aggregator or a perp DEX).

    Overall: Maestro is the safe, boring, competent choice. In a category full of bots that spin up during a memecoin wave and vanish six months later, Maestro has kept shipping for four years. The fee is not the cheapest, and the UX is not the prettiest, but the combination of chain coverage, feature depth, and operational track record makes it the strongest all-around Telegram trading bot in 2026.

    Try Maestro Bot on Telegram

    Frequently Asked Questions

    Is Maestro Bot safe to use?

    Maestro is safe in the sense that it has a four-year clean track record with no public compromise of user funds. It is custodial, meaning the bot holds your private keys, so you are trusting the team’s operational security. Treat it as a hot wallet: keep only your active trading capital in it and withdraw profits regularly.

    What chains does Maestro Bot support?

    As of 2026, Maestro supports 14 chains: Ethereum, Solana, BNB Chain, Base, Arbitrum, Avalanche, TON, Tron, Hyperliquid, Blast, Polygon, Optimism, Linea, and Scroll. Auto Sniper (the pre-launch buyer) runs on Ethereum, BSC, Base, Arbitrum, and Solana.

    How much does Maestro Bot cost?

    Maestro charges 1% per successful trade, with no subscription tier required to access core features. Failed trades are not charged. High-volume traders can claim up to 30% of their fees back through the /cashback command, bringing the effective fee down to roughly 0.7% for active users.

    Maestro vs Banana Gun: which is better?

    Banana Gun has a lower base fee (0.5% for spot trades vs Maestro’s 1%) and slightly faster execution on Ethereum. Maestro has wider chain coverage (14 chains vs Banana Gun’s 5) and better copy-trading and limit-order features. If you trade only Ethereum, Banana Gun is cheaper. If you trade across multiple chains, Maestro wins on coverage.

    Can I use Maestro without connecting my main wallet?

    Yes, and you should. Maestro generates a fresh custodial wallet when you sign up. You never connect your main hardware or software wallet. You fund the Maestro wallet by transferring in from your main wallet, trade with it, then withdraw profits back out. This isolation is one of the reasons the bot’s security model works despite being custodial.


    Related reading on PumpParade: Banana Gun Review 2026: Fees, Features and Verdict, GMGN vs Trojan: Best Solana Trading Bot 2026, and Photon vs BullX: Best Solana Trading Bot 2026.

    Sources: maestrobots.com, on-chain data via Dune Analytics, CoinGecko Learn, community benchmarks from live pump.fun and Raydium launches. Not financial advice.

    Filecoin (FIL) Price Prediction 2026: Can FIL Hit $2?

    Filecoin price prediction 2026 is a search that keeps getting louder for a reason. FIL trades at $0.70 at time of writing, down 5.9% on the day, 7.8% on the week, and roughly 99.7% from its April 2021 all-time high of $236. On paper, this is one of the deepest drawdowns in the top 100. In practice, that gap between price and network progress is exactly what is bringing traders back.

    Filecoin is quietly shipping the biggest architectural upgrade in its history. The Filecoin Onchain Cloud (FOC), the F3 Fast Finality rollout, and a wave of AI storage partnerships are lining up in the second half of 2026. October also marks the completion of a major vesting cliff that has weighed on FIL supply for years.

    Below, we break down where FIL stands today, why it is priced the way it is, the specific catalysts that could push it toward $2 in 2026, the risks that could keep it pinned under $1, and what would change our view.

    Key Takeaways

    • FIL trades near $0.70 with a $562M market cap, rank 92 by market cap and roughly 99.7% below its 2021 ATH.
    • The 2026 catalyst stack is real: Filecoin Onchain Cloud, F3 sub-60-second finality, and paid AI storage deals.
    • Our base case sees FIL between $1.10 and $1.60 by year-end 2026 if paid storage revenue accelerates.
    • The bull case targets $2.00 to $2.75, aligned with Token Metrics’ $2.67 forecast and lower-end Coinpedia projections.
    • Bear case: $0.45 to $0.55 if AI storage demand stalls and vesting overhang keeps pressure on supply.
    • Watch the October 2026 vesting completion, quarterly paid-storage revenue, and Filecoin Plus verified deals.
    Filecoin (FIL) price prediction 2026 hero graphic, current price $0.70, Onchain Cloud and AI storage catalyst

    Where Filecoin Stands Today

    Filecoin is the largest decentralized storage network by capacity, built by Protocol Labs and Juan Benet, the same team behind IPFS. The token pays for storage deals, incentivizes storage providers, and secures the network through Proof-of-Spacetime consensus. Backers include Sequoia Capital, Andreessen Horowitz (a16z), Union Square Ventures, and Coinbase Ventures.

    The market has been unforgiving. FIL has traded in a tight $0.69 to $0.81 range over the past 30 days and continues to fade on light volume.

    Metric Value
    Price (July 28, 2026) $0.6956
    24h change -5.88%
    7d change -7.77%
    30d change -5.66%
    Market cap $562M
    Market cap rank #92
    24h volume $69M
    Circulating supply 808M FIL
    All-time high $236.84 (April 2021)
    % from ATH -99.71%

    Data sources: CoinGecko and network stats from the Filecoin Foundation.

    Why is Filecoin range-bound right now?

    Three forces explain the flat price action. First, macro. Bitcoin dropped 2.7% in the same 24-hour window, and mid-cap altcoins have been getting hit harder than the majors. FIL is not immune. Second, vesting. The Filecoin protocol still has structural token unlocks scheduled through October 2026, which puts a persistent bid-ask imbalance on the token. Third, narrative rotation. Traders spent the first half of 2026 chasing modular blockchains and perp DEX plays. Decentralized storage did not make the cut.

    That last point is where the setup gets interesting. When narratives rotate back to AI infrastructure, and they always do, the storage layer becomes an obvious rebound trade. FIL is one of the few tokens with a live product, real revenue, and blue-chip venture backing that is still trading like it is forgotten.

    What could push FIL higher in 2026?

    Catalyst 1: Filecoin Onchain Cloud goes live

    The Filecoin Onchain Cloud (FOC) is the network’s biggest developer-experience overhaul. It hides the heavy cryptography (Proofs-of-Replication, sector sealing, deal-making) behind clean APIs. Translation: developers can plug decentralized storage into apps the same way they use AWS S3, without needing a PhD in zero-knowledge proofs. If FOC ships on schedule and developer signups grow through Q3 and Q4 2026, that flips the network from a “protocol for storage providers” into a “cloud service anyone can use.” That is a meaningful re-rating catalyst.

    Catalyst 2: F3 Fast Finality

    F3, the Fast Finality upgrade, cuts Filecoin’s transaction finality from roughly 7.5 hours to under 60 seconds. This is not a marginal change. Sub-minute finality opens the door to interactive apps, real-time payments, and cross-chain messaging. For context, competing storage networks like Arweave settle in blocks measured in seconds. F3 closes the gap and removes one of the loudest bearish arguments against FIL as a serious L1 storage layer.

    Catalyst 3: AI storage demand

    AI training and inference workloads generate mountains of data that need to be stored, verified, and retrieved cheaply. Filecoin has quietly signed on partners including Aethir for verifiable dataset storage, plus Titan Network and Swan Chain for AI compute integrations. If even one of these partnerships translates into recurring paid storage deals at meaningful scale, FIL revenue accelerates and the token gets a fundamental floor. Standard Chartered’s analyst desk has not published a formal FIL target, but similar infrastructure tokens like Chainlink have been re-rated on much thinner enterprise adoption stories. If you want a deeper dive on how oracle infrastructure gets re-priced on partnership news, our Chainlink DTCC tokenization piece walks through the same dynamic.

    What could keep FIL pinned under $1?

    Risk 1: Vesting overhang through October 2026

    Filecoin’s total supply is 1.96B tokens against a circulating supply of 808M. That means more than half of the total supply is still locked or vesting. October 2026 is the completion of a major vesting cliff, and the run-up to that date typically sees front-running by miners and early investors who are legally required to sell. Until this overhang clears, every rally has to absorb sell pressure that other tokens do not face.

    Risk 2: Storage competition intensifies

    Filecoin is not the only decentralized storage game in town. Arweave targets permanent storage with a one-time payment model. Storj targets enterprise cloud storage with an S3-compatible API. Both have shipped faster on developer experience in the past 12 months. Meanwhile, centralized cloud providers keep cutting prices. If AWS, Google Cloud, and Cloudflare’s R2 keep undercutting the market, decentralized storage risks getting boxed into a niche verifiability use case rather than mass-market adoption.

    Risk 3: Weak paid storage adoption

    Filecoin Plus (the network’s incentive program for verified deals) has been the primary demand driver. If verified deals stall or the incentive structure changes, storage utilization could drop and the “AI storage narrative” becomes a story without financials. This is the most cited bearish argument from analyst desks including Token Metrics and it is not unreasonable.

    Filecoin Price Prediction 2026: Targets by Timeframe

    Filecoin (FIL) price prediction 2026 targets table, bear $0.50, base $1.30, bull $2.00

    Our analysis combines on-chain data, comparable-token multiples, and analyst desk consensus. Here is how we see the paths playing out.

    Short term (30 days)

    The most likely scenario is continued range trading between $0.65 and $0.85. FIL has strong technical support near the $0.69 zone (multi-week base) and stiff resistance at $0.81 (30-day high). A break above $0.85 on volume opens the door to a $1.00 psychological retest. A breakdown below $0.65 puts $0.55 in play quickly.

    Medium term (6 months, through year-end 2026)

    Scenario Target Trigger
    Bear $0.45 to $0.55 Vesting sell pressure, weak paid-storage growth, AI narrative fizzles
    Base $1.10 to $1.60 FOC ships on schedule, F3 lives up to spec, one major AI storage deal
    Bull $2.00 to $2.75 Vesting completes, paid-storage revenue doubles YoY, multiple AI partnerships convert

    Our base case sits in the middle at roughly $1.30. This aligns with the moderate end of analyst targets: Changelly’s average projection near $1.26, Token Metrics’ $2.67 upper bound, and Coinpedia’s $2.76 median 2026 target. On the bull end, if AI storage demand accelerates the way it has for compute tokens (see our Render price prediction for a comparable playbook), $2 becomes the reasonable floor rather than the ceiling.

    Long term (2027 and beyond)

    If the Onchain Cloud actually works and Filecoin becomes the default verifiable storage layer for AI, targets in the $4 to $10 range from analysts like Coinpedia and MEXC start looking less speculative. But that requires everything to go right: enterprise adoption, sustained developer growth, and no regulatory shocks. Realistic long-term thinking assigns a wide distribution here rather than a single number.

    How does Filecoin compare to Arweave?

    Arweave (AR) is the closest architectural competitor to Filecoin. Both target decentralized storage, both have real usage, and both trade well below their 2021 highs. Here is how they stack up.

    Metric Filecoin (FIL) Arweave (AR)
    Storage model Time-based paid deals One-time payment, permanent
    Consensus Proof-of-Spacetime SPoRA (blockweave)
    Finality 7.5h today, sub-60s with F3 Roughly 2 minutes
    Developer APIs FOC in progress Arweave.js, Bundlr live
    Enterprise partnerships Aethir, Titan, Swan Meta, Solana projects
    Market cap (approx) $562M ~$310M
    Circulating vs total supply 41% circulating ~99% circulating

    The key takeaway: Filecoin is larger and has bigger enterprise ambitions, but carries more supply overhang. Arweave has cleaner tokenomics but a narrower product story. For an AI storage narrative trade, FIL is the higher-beta bet. Traders playing the broader AI infrastructure rotation should also watch tokens like Bittensor (TAO), which trade on similar AI-adjacent flows.

    What Would Change Our View

    Three explicit scenarios would force us to rewrite this analysis.

    Bullish trigger: Filecoin paid-storage revenue prints a quarter above $10M in on-chain deal volume, or a Fortune 500 AI lab publicly signs a multi-year Filecoin storage contract. Either would signal that the AI storage thesis is monetizing, and FIL should trade at a materially higher multiple.

    Bearish trigger: The Onchain Cloud launch slips past Q4 2026 with no clear timeline, and Filecoin Plus verified deals decline for two consecutive quarters. That combination would suggest the roadmap is stalling and the AI narrative is not converting to revenue.

    Neutral pivot: The token completes the October vesting cliff cleanly, sell pressure eases, but no fundamental catalyst materializes. FIL would likely consolidate in a $0.80 to $1.20 range and become a “wait for the next narrative” trade rather than an active thesis.

    Frequently Asked Questions

    Will Filecoin reach $10 in 2026?

    Very unlikely. Reaching $10 would require FIL to trade at roughly 14x current price, implying a market cap near $8B. That level of re-rating has happened for tokens with much stronger catalyst stacks. The most bullish credible 2026 target is closer to $2.75, from analysts including Token Metrics and Coinpedia. Save the $10 target for a 2027-2028 scenario if adoption accelerates.

    Is Filecoin a good investment in 2026?

    Filecoin is a high-risk, high-conviction bet on decentralized storage becoming a real cloud infrastructure category. It has real usage, top-tier VC backing, and a shipping roadmap. But it also has a heavy supply overhang and fierce competition from both decentralized and centralized cloud players. Treat it as a long-term infrastructure position, not a short-term trade.

    What is the Filecoin price prediction for 2026?

    Analyst targets for 2026 range from $0.45 (bear case) to $10 (aggressive bull). Our base case is $1.10 to $1.60 by year-end 2026, aligned with Changelly’s $1.26 average and the moderate end of Coinpedia’s projections. The bull case of $2 to $2.75 requires visible AI storage revenue traction.

    Can FIL hit $2 in 2026?

    Yes, but not without help. FIL would need the Filecoin Onchain Cloud to launch on schedule, at least one major AI storage partnership to convert to paid deals, and the October vesting cliff to complete without a supply shock. That is a plausible but not base-case combination. Probability rank: bull case, roughly 25 to 30%.

    Why is Filecoin price falling?

    Three reasons. Macro weakness across altcoins pulls FIL down with the tape. Structural vesting through October 2026 puts persistent sell pressure on the token. And narrative rotation has favored modular chains, perp DEXs, and memecoins over decentralized storage. None of these are permanent, but all three need to reverse for FIL to break out.

    Is Filecoin dead?

    No. Filecoin is one of the most active infrastructure networks in crypto by storage capacity and continues to ship major protocol upgrades. Price action does not equal project health. That said, “not dead” is different from “will pump.” The next 6 to 12 months are about execution, not survival.

    The Honest Take

    Filecoin is a classic “infrastructure token trading like it is forgotten” setup. The fundamentals are quietly getting stronger while the price sits near multi-year support. If the Onchain Cloud lands and AI storage revenue starts printing, FIL has a plausible path to $2 by end of 2026. If it does not, this stays a sub-$1 trade for another year.

    The bull case is credible but not consensus. The bear case is well-priced in but not resolved. For traders, the setup favors patient accumulation in the $0.65 to $0.80 zone with clear invalidation below $0.60. For long-term believers in decentralized infrastructure, FIL at current prices is one of the cheapest ways to own AI storage exposure with real venture backing behind it.

    Just remember: the price does not care about your thesis until the numbers show up on-chain. Watch the paid-storage revenue prints. That is the tell.

    Disclaimer: This article is for informational and educational purposes only and should not be construed as financial, investment, or trading advice. Cryptocurrency markets are highly volatile, and past performance does not guarantee future results. The price predictions and analyses presented here are based on AI models, technical indicators, and available data at the time of writing. They are not guarantees. Always conduct your own research (DYOR) and consult with a qualified financial advisor before making any investment decisions. Pump Parade and its authors do not assume liability for financial losses incurred based on information provided in this article.
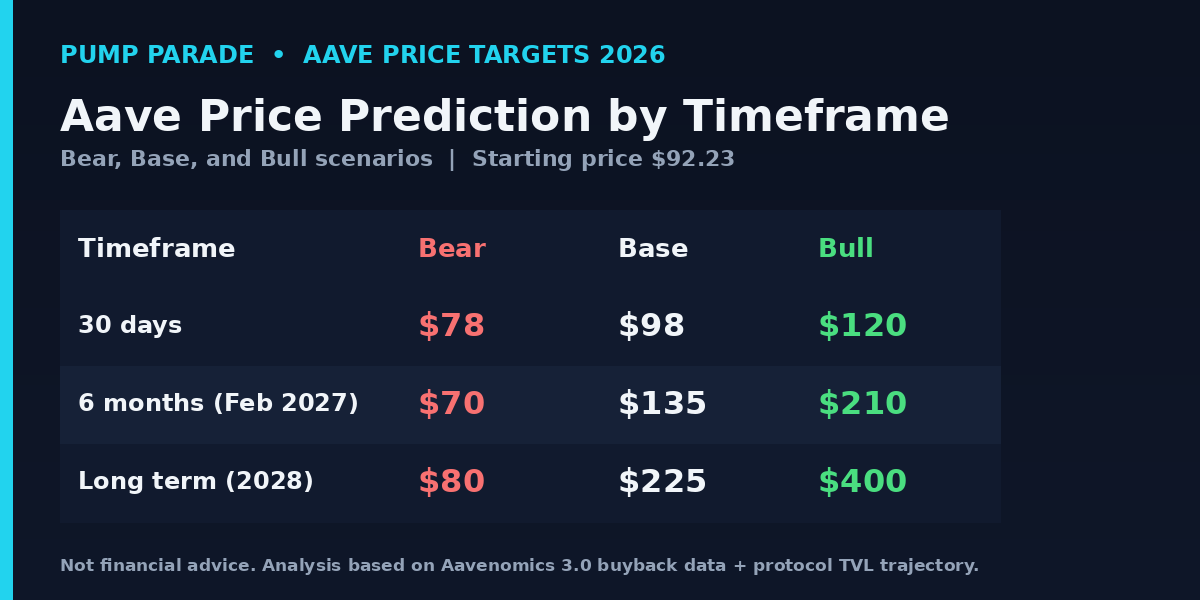
    Cardano (ADA) Price Prediction 2026: Can ADA Hit $0.30?

    Any serious Cardano ADA price prediction 2026 has to start with a strange fact: ADA trades at $0.165 as of July 27, 2026, up 12.2% over the last 30 days but still sitting roughly 95% below its September 2021 all-time high of $3.09. For a project ranked #20 by market capitalization with a $6.16B market cap and 60% of its float staked, that is a strange place to be. The chart looks tired. The narrative looks anything but.

    Behind the sleepy price action, three catalysts are quietly stacking up for the second half of 2026. CME Cardano futures went live in February, starting the six-month regulated-futures clock the SEC now requires for spot ETF approval. That clock runs out on August 9. Grayscale’s spot ADA ETF sits on a maximum 75-day review window with a final decision deadline of October 23, 2026. And Cardano’s Midnight privacy sidechain and continued Hydra scaling work sit alongside the ETF timeline as fundamental catalysts.

    This Cardano ADA price prediction 2026 breaks down where ADA stands today, why the market has stopped caring, the specific catalysts that could push it toward $0.30, and the bear-case scenarios that could send it back below $0.12. We walk through 30-day, 6-month, and 2027-28 targets, compare ADA to Solana on the metrics that matter, and answer the questions traders are actually searching. Here is the honest, data-first read.

    Key Takeaways

    • ADA trades at $0.165 as of July 27, 2026, up 12.2% in 30 days but down 79.8% year over year.
    • The single biggest near-term catalyst is the Grayscale spot ADA ETF decision, with a final SEC deadline of October 23, 2026.
    • Base case: ADA reaches $0.24 by year-end 2026 if the ETF is approved and Hydra activity keeps building.
    • Bull case: $0.32 to $0.50 if ETF approval coincides with a broader altcoin rotation and Midnight adoption picks up.
    • Bear case: A rejection or delay could send ADA back to the $0.12 to $0.13 support zone.
    • Cardano remains behind Solana on DeFi TVL and daily active users, and that gap is the core bear argument.
    Cardano ADA price prediction 2026 hero graphic, current price $0.165 with Oct 23 ETF catalyst callout

    Where Cardano (ADA) Stands Today

    Cardano is the seventh-most-searched altcoin on Google in 2026 and the 20th-largest crypto by market cap. Below is a snapshot of the numbers we are working with at time of writing, pulled from CoinGecko.

    Metric Value
    Price $0.165
    24h change +0.11%
    7d change +1.4%
    30d change +12.2%
    Market cap $6.16B
    24h volume $158M
    Market cap rank #20
    All-time high $3.09 (Sep 2021)
    % from ATH -94.7%

    Two numbers matter more than the rest. First, the 30-day gain of 12.2% is happening on modest volume, which means the move is being driven by patient accumulation rather than a leverage-fuelled short squeeze. Second, roughly 60% of the circulating supply is staked, which structurally reduces sell pressure and puts a floor under drawdowns. ADA rarely has a violent flush lower on staking-heavy weeks. It usually just grinds.

    Why Is Cardano Trading Like the Market Forgot It Exists?

    The short answer: capital rotation. Since the March 2026 Hyperliquid HYPE flippening, when a revenue-generating perp DEX passed ADA in market cap, altcoin traders have pivoted toward chains that produce fees and buybacks. Cardano does not have that story. Its DeFi TVL sits in the $380M-$550M range depending on the source, which is a rounding error next to Ethereum’s $60B+ or Solana’s $8B+.

    The longer answer is that Cardano’s academic, peer-reviewed development pace has been a strength for security and a liability for narrative velocity. The Voltaire era transition to community governance is arguably the most significant governance experiment in crypto, but “governance milestone” does not pump a chart the way “meme launchpad revenue” does. That is the honest gap.

    What has kept a bid under ADA through the quiet stretch is the ETF pipeline. Filings from Grayscale, VanEck, 21Shares, Bitwise and Canary Capital have removed the tail risk of “no institutional path” and replaced it with a concrete, dated question: does spot ADA get approved this fall? For a good read on how enterprise-focused L1s are being repriced by the same investor cohort, our Hedera (HBAR) 2026 breakdown covers a similar setup.

    What Could Push ADA to $0.30 by Year-End 2026?

    1. Grayscale spot ETF decision on October 23

    This is the catalyst. CME ADA futures went live February 9, 2026, which starts the six-month regulated-futures clock the SEC now requires under its generic listing standards. ADA becomes formally eligible on August 9. If Grayscale, NYSE Arca or any co-issuer files immediately, the maximum 75-day review window lands the final decision on October 23. Multiple applicants including Bitwise, Canary Capital and 21Shares have parallel filings, so approval likely triggers a wave of simultaneous launches rather than a single-issuer product.

    Historical analog: XRP’s futures-first pathway saw a 35% run-up in the six weeks before the review deadline, then a “sell the news” retrace before the actual approval week bid returned.

    2. Hydra scaling finally leaves the demo phase

    Hydra is Cardano’s Layer-2 payment channel network, and it has demonstrated close to 1 million transactions per second in gaming environments. The relevant question is not the benchmark. It is whether real applications, not test harnesses, actually route volume through Hydra heads at scale. If two or three consumer apps ship on Hydra in Q4 2026, the “Cardano is technically capable but nobody uses it” argument loses its most-cited example.

    3. Midnight sidechain unlocks institutional privacy demand

    Midnight is Cardano’s zero-knowledge privacy partner chain, with a federated validator set that reportedly includes Google Cloud, MoneyGram and Vodafone. Enterprise interest in on-chain settlement has been bottlenecked by data confidentiality requirements that public blockchains cannot solve natively. A working privacy sidechain with real institutional validators is the exact product that unlocks the treasury and settlement use cases that RWA teams like Ondo and Chainlink have been publicly asking for.

    What Could Send ADA Back Below $0.13?

    1. ETF rejection or delay past 2026

    The base case above assumes approval by October 23. A delay into 2027 or an outright rejection removes the primary catalyst driving accumulation. In that scenario, ADA likely retests $0.13 support quickly and could probe $0.11-$0.12 if broader altcoin sentiment sours. The SEC’s stance on ADA’s commodity classification is not fully settled, and a Chair Atkins comment can move the odds materially in either direction.

    2. Continued market-share erosion to revenue-generating L1s

    Ethereum, Solana, and now Hyperliquid all produce measurable protocol revenue that gets returned to token holders through buybacks, burns or yield. Cardano has no such mechanism. In a market that has clearly repriced “productive” tokens above “narrative” tokens, ADA structurally underperforms peers on flow. If DeFi TVL on Cardano does not cross $1B by year-end, this argument gets louder.

    3. Voltaire treasury governance stumbles

    The Cardano treasury holds roughly $71M in ADA earmarked for core protocol funding. Community governance is new, and one bad allocation vote, one contentious controversy about founder influence, or one high-profile developer departure can meaningfully damage institutional confidence right before an ETF decision window. Execution risk is elevated during the transition year.

    Cardano (ADA) Price Prediction 2026: Targets by Timeframe

    Cardano ADA price prediction 2026 targets table, bear $0.13, base $0.24, bull $0.32 by six months

    30-day outlook (August 2026)

    Base case: $0.18. The August 9 futures-eligibility date is a positive event with limited immediate price impact but sets up positioning into September. Bear case: $0.14 if BTC breaks $60K support and drags altcoins lower. Bull case: $0.22 if an unexpected Grayscale filing goes public before month-end.

    6-month outlook (through year-end 2026)

    Base case: $0.24, driven by ETF approval on or near October 23 and a modest Q4 altcoin rotation. Bear case: $0.13 on rejection or delay, retesting the June 2026 lows. Bull case: $0.32 to $0.50 if approval coincides with a broader risk-on move and Hydra ships a real consumer app.

    2027-2028 long-term outlook

    Base case: $0.42, assuming ADA participates in the post-cycle recovery but continues to lag Solana and Ethereum on relative flow. Bull case: $0.85 or higher if Midnight scales into an actual institutional settlement rail. Bear case: $0.12, the level analysts at Benzinga and CoinCodex flag as the structural floor if TVL keeps eroding.

    Where our targets sit versus consensus

    For context on the range, Coinfomania’s ML model projects an average of $1.15 for 2026 with a high of $1.60. Cryptopolitan’s hybrid model splits the middle at $1.20 average. Benzinga’s aggregated forecast is much more conservative at $0.48-$0.57. Our base case of $0.24 sits closer to the CoinCodex algorithmic model, which projects $0.26-$0.47 for the year. The wide spread across analysts is itself a signal: no one is sure, and that is the correct posture.

    How Does Cardano Compare to Solana in 2026?

    Solana is the closest L1 comparison for ADA in 2026: both are proof-of-stake, both target smart contract throughput, both had a spot-ETF pathway pending. The gap on activity is the key story.

    Metric Cardano (ADA) Solana (SOL)
    Price (July 27, 2026) $0.165 $76.38
    Market cap $6.16B $44.55B
    Rank #20 #7
    30d change +12.2% +6.6%
    DeFi TVL (approx.) ~$500M ~$8B
    Staking ratio ~60% ~65%
    ETF status Grayscale filing, Oct 23 deadline Multiple spot ETFs live since 2025
    Slot time / block time ~20 seconds ~400 ms

    The read from the table is straightforward. Solana is where the activity lives. Cardano is where the discount lives. For a longer read on the L1 competitive set, our Avalanche 2026 breakdown covers a similar recovery setup, and our earlier ETF-window analysis is the best backdrop for how the futures timeline evolved.

    What Would Change Our View

    Three specific triggers would move us off the base case:

    1. A closed ETF decision before October 23. If the SEC uses its accelerated approval pathway or a Grayscale filing lands earlier than expected, both the base and bull targets move up by roughly 20%.

    2. Cardano DeFi TVL breaking above $1B. That would signal Hydra and Midnight are actually attracting sticky capital, not just headlines. It would justify pulling long-term targets toward the Coinfomania range near $1.15.

    3. A public governance failure. If a Voltaire treasury vote goes badly and ADA holders reject a core-development budget, or if there is a high-profile founder controversy, bear-case targets get pulled down and the ETF narrative loses some support.

    Frequently Asked Questions

    What is the Cardano ADA price prediction for 2026?

    Our base case has ADA reaching $0.24 by year-end 2026, assuming Grayscale’s spot ETF is approved on or near the October 23 SEC deadline. Bear case is $0.13 on rejection or delay, and bull case reaches $0.32 to $0.50 if approval coincides with an altcoin rotation and Hydra ships a consumer app that actually gets used.

    Will ADA reach $1 in 2026?

    Reaching $1 in 2026 would require roughly a 6x move from the current $0.165 price, and no realistic base case supports that. Even the most bullish analyst models, like Coinfomania’s ML projection at $1.60, assume conditions well beyond current setup. A $1 ADA looks more like a 2027 to 2028 scenario if Cardano regains meaningful DeFi market share.

    Is Cardano a good investment in 2026?

    ADA is a reasonable asymmetric bet if you believe the ETF gets approved and Cardano can reverse its DeFi TVL decline. The downside is defined at $0.12 to $0.13 support, and the upside is defined by the October 23 catalyst plus long-term Midnight and Hydra execution. It is not a good investment for anyone looking for quick returns, and it is not a good investment if you cannot stomach a further 20% drawdown.

    When is the Cardano spot ETF decision?

    Grayscale’s spot ADA ETF has a maximum SEC review window of 75 days after its August 9, 2026 eligibility date under the streamlined ETF approval framework. That puts the final decision deadline on October 23, 2026. Bitwise, 21Shares and Canary Capital have parallel filings with similar timelines, so multiple products could launch simultaneously if approved.

    Why has ADA underperformed in 2026?

    ADA has underperformed newer L1s like Solana and Hyperliquid because it does not generate meaningful protocol revenue that gets returned to token holders. Cardano’s DeFi TVL sits near $500M compared to Solana’s $8B and Ethereum’s $60B+, and the market has clearly repriced revenue-generating chains above research-first ones in 2026. That gap is the core bear argument.

    What is the Cardano Midnight sidechain?

    Midnight is Cardano’s zero-knowledge privacy partner chain, built to support institutional and enterprise use cases where public transaction data is a blocker. The federated validator set reportedly includes Google Cloud, MoneyGram and Vodafone, giving it real-world credibility. If Midnight attracts genuine institutional volume in 2026, it becomes the strongest fundamental case for ADA outside of the ETF catalyst.

    The Honest Take

    Cardano in mid-2026 is a bet on two things: that the ETF gets approved by October 23, and that at least one of Hydra, Midnight or Voltaire produces a fundamental result that changes the “no activity” narrative before year-end. Neither is guaranteed. Both are plausible.

    The setup rewards patient positioning, not chasing. Downside is defined at $0.12 to $0.13. Upside is defined at $0.30 in the base case and $0.50 in the bull case over the next six months. That is a risk-reward profile that some traders will find compelling and others will correctly ignore as too catalyst-dependent. What ADA is not, for anyone paying attention, is a passive hold. This is a token where the next three months matter more than the last three years, and you need to have a view on the catalysts, not just the ticker.

    Disclaimer: This article is for informational and educational purposes only and should not be construed as financial, investment, or trading advice. Cryptocurrency markets are highly volatile, and past performance does not guarantee future results. The price predictions and analyses presented here are based on AI models, technical indicators, and available data at the time of writing, and they are not guarantees. Always conduct your own research (DYOR) and consult with a qualified financial advisor before making any investment decisions. Pump Parade and its authors do not assume liability for financial losses incurred based on information provided in this article.