More
    Home Blog Page 15

    Phantom Wallet Review 2026: Best Solana Wallet?

    0

    Phantom Wallet Review 2026 hero

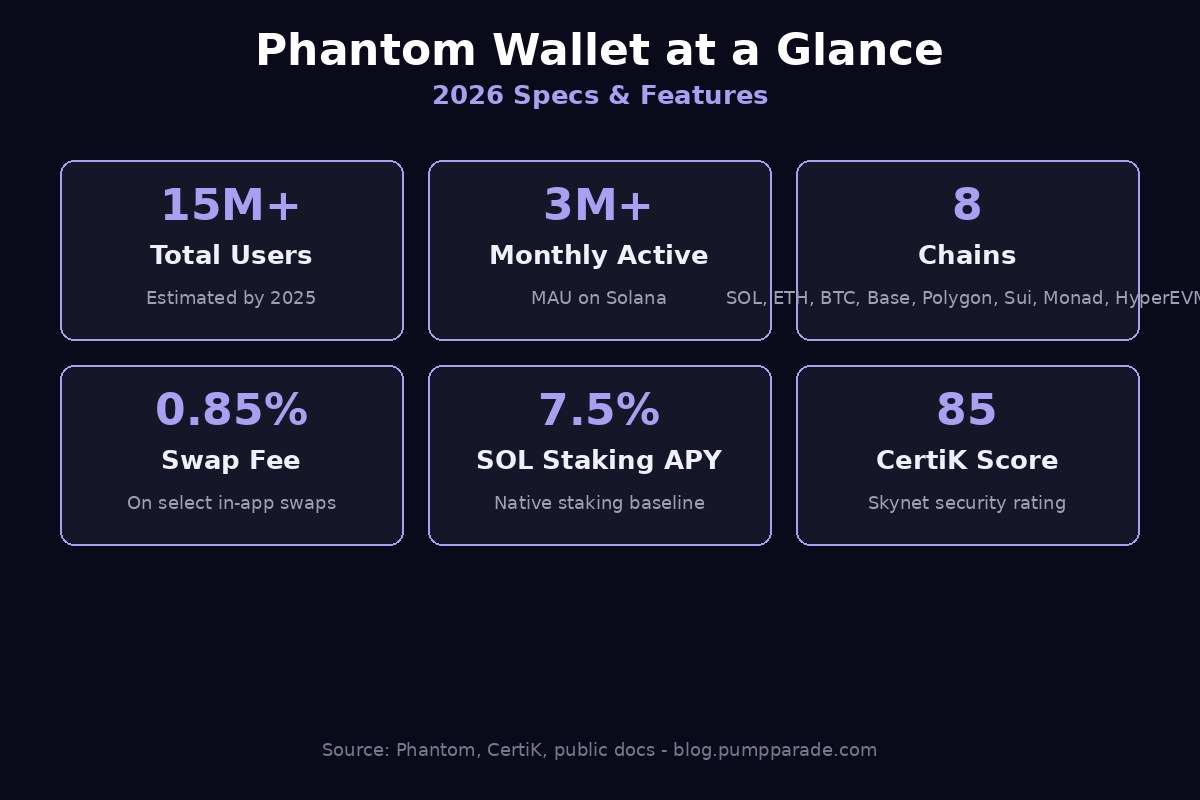
    If you have ever held a Solana token, swapped a memecoin, or minted an NFT in the last few years, the odds are very high that you did it through Phantom. What started in 2021 as a clean Solana-only browser extension has, by 2026, turned into one of the most widely used self-custody wallets in crypto, with multi-chain support across Solana, Ethereum, Bitcoin, Base, Polygon, Sui, Monad, and HyperEVM. It now serves an estimated 15 million users and more than 3 million monthly actives.

    But popularity is not the same as the right wallet for you. Fees, security guarantees, network coverage, and UX trade-offs all matter. This deep-dive review walks through everything Phantom does in 2026, where it still falls short, and who should actually be using it.

    Quick Verdict (TL;DR)

    • Overall rating: 4.6 / 5. The best general-purpose hot wallet for active onchain users in 2026.
    • Best for: Solana power users, NFT collectors, multi-chain traders who want one app for SOL, ETH, BTC, Base, and Sui.
    • Not for: Heavy Arbitrum / Optimism / BNB Chain users, long-term cold storage, or advanced Bitcoin users who need full UTXO control.
    • Swap fee: 0.85% on select in-app swaps, plus network and bridge fees.
    • Security: Self-custody, transaction simulation, real-time scam detection, Ledger integration. 85 score on CertiK Skynet.
    • Bottom line: If you live onchain and Solana is part of your stack, Phantom is still the wallet to beat.

    What Is Phantom Wallet?
    Phantom Wallet brand image

    Phantom is a non-custodial crypto wallet available as a browser extension for Chrome, Brave, Firefox, and Edge, and as a mobile app on iOS and Android. It started life in 2021 as a Solana-only wallet built by ex-Solana Labs engineers and quickly became the default way to interact with the Solana ecosystem.

    Since 2023 it has aggressively expanded into multi-chain territory. As of 2026, Phantom supports eight chains natively: Solana, Ethereum, Base, Polygon, Sui, Bitcoin (Native and Taproot), Monad, and HyperEVM. It bundles a swap aggregator, a staking interface, an NFT gallery, a dApp browser, transaction simulation, and a fiat on-ramp into one product.

    The company raised a $109 million Series C in 2025 led by Sequoia and Paradigm, valuing the wallet at over $3 billion. That war chest is funding its push to become the default consumer wallet of crypto, not just of Solana.

    Key Stats at a Glance
    Phantom Wallet specs and features infographic 2026

    Features Deep Dive

    1. Multi-Chain Support

    Phantom now natively supports eight chains: Solana, Ethereum, Base, Polygon, Sui, Bitcoin, Monad, and HyperEVM. You can hold and send assets on all of them from a single seed phrase, and the wallet auto-detects which chain a dApp wants to connect to.

    The trade-off is that Phantom does not let you manually add custom networks. So if you live on Arbitrum, Optimism, BNB Chain, Avalanche, Linea, or zkSync, you will still need a second wallet such as MetaMask or Rabby. For most Solana-first users, that limitation is fine. For EVM-first users, it can be a dealbreaker.

    2. In-App Swaps and Bridging

    Phantom’s built-in swap routes through Jupiter on Solana and through 1inch and other aggregators on EVM chains, which means you get aggregator-quality pricing without leaving the wallet. Cross-chain swaps are supported between Solana, Ethereum, Base, Polygon, and Sui through integrated bridges. For a deeper look at how the underlying routers compare, see our Jupiter vs 1inch breakdown.

    The headline cost is a 0.85% Phantom service fee on select swaps, plus the underlying network gas and bridge fees (roughly 0.3% on cross-chain routes). That is higher than swapping directly on Jupiter, where the protocol fee is 0 to 0.1 bps on most pairs, but most users happily pay the premium for the convenience of a single click without leaving the wallet.

    3. Staking

    Native Solana staking inside Phantom currently yields around 7.5% APY. You pick a validator from a curated list, click stake, and rewards compound automatically. The wallet also surfaces liquid staking tokens directly: PSOL (Phantom’s own liquid staking product) targets around 9% APY, while JitoSOL has paid into the 12 to 15% range over the last 12 months thanks to MEV tips. Ethereum staking is routed through Lido and similar providers.

    4. NFTs and Collectibles

    Phantom has one of the cleanest NFT experiences in crypto. The Collectibles tab supports NFTs on Solana, Ethereum, and Polygon, and the Instant Sell feature lets you list a Solana NFT at the best available bid in one tap. For NFT-heavy users this alone is worth the install.

    5. dApp Browser and Connectivity

    The mobile app ships with a built-in dApp browser that lets you connect to Raydium, Jupiter, Uniswap, Aave, Suilend, and any other Web3 app without leaving the wallet. On desktop, Phantom auto-detects EIP-1193 and Solana Wallet Adapter signing requests, so it works as a drop-in replacement for MetaMask on Ethereum and Base.

    6. Transaction Simulation and Scam Detection

    Phantom Wallet mobile interface illustration

    This is the feature that has quietly raised Phantom’s security bar above most competitors. Before you sign, the wallet simulates the transaction and shows exactly which tokens will leave and enter your address. If a malicious dApp tries to drain your wallet via a misleading approval or a hidden token swap, the simulation flags it in red and lets you cancel.

    Phantom also runs an AI-driven scam detection layer that compares contract addresses, mint authorities, and known phishing signatures in real time. It is not perfect, but it has prevented enough drainer attacks that competing wallets have copied the pattern.

    7. Hardware Wallet Integration

    Phantom integrates natively with Ledger devices, letting you keep keys offline while still using the Phantom UI for daily transactions. For long-term holders this is the right setup: convenience of Phantom plus the security of cold storage.

    Fees and Pricing

    Phantom itself is free to download and use. The wallet makes its money through a small fee layer on optional services:

    • In-app swaps: 0.85% on select pairs, charged on top of underlying DEX and aggregator fees.
    • Cross-chain bridges: ~0.3% bridge provider fee plus gas on both source and destination chains.
    • Buy crypto (on-ramp): 1 to 4% depending on the provider and payment method (MoonPay, Coinbase Pay, etc.).
    • Staking: 0% Phantom fee on native Solana staking. Liquid staking products like PSOL and JitoSOL take their own small validator commissions (typically 4 to 10% of yield).
    • Transfers, NFT viewing, dApp connections: Free. You pay only network gas.

    For comparison, MetaMask charges 0.875% on its swap feature and Coinbase Wallet has been raising its swap markups closer to 1%, so Phantom is roughly in line with peers on swap fees while being more aggressive on UX polish.

    Security and Trust

    Phantom is fully self-custodial. Your 12-word seed phrase never touches Phantom’s servers, and the team cannot freeze, recover, or seize your funds. That is both the point and the responsibility of a hot wallet.

    • Audits: The wallet’s smart contract integrations and security architecture have been audited by Kudelski Security, OtterSec, and Trail of Bits.
    • CertiK Skynet score: 85, which puts Phantom in the top tier of consumer wallets.
    • Coinspect security score: 65, indicating solid but not flawless coverage.
    • Open-source: Core components are open-source on GitHub for community review.
    • Bug bounty: Active program through Immunefi with payouts up to $1 million for critical vulnerabilities.
    • Track record: No major wallet-side breach in five years of operation. Funds lost via Phantom have come from user-side phishing or seed phrase exposure, not Phantom itself.

    The transaction simulation feature in particular is what separates 2026 Phantom from 2024 Phantom. A drainer that would have emptied your wallet two years ago now shows a red warning that says “this transaction will move all of your SOL to an unknown address.” That alone has saved millions in user funds.

    User Experience

    This is where Phantom has always shined and where it still leads. The mobile app is genuinely one of the best-designed pieces of software in crypto, full stop. Onboarding takes under two minutes. The home screen shows your portfolio across all chains in one view. Sending, swapping, and staking are all two-tap operations.

    The browser extension is equally polished. It supports passkey unlock, hardware wallet pairing, and a unified portfolio view across every supported chain. Nothing about the UX feels like a 2021 crypto product, which is a low bar that 90% of the industry still fails to clear.

    The main UX gap is power-user features. There is no built-in MEV protection knob on EVM swaps, no manual nonce control, no advanced gas customization, and no support for raw transaction broadcasting. Users who want those should reach for Rabby or MetaMask on EVM chains.

    Pros and Cons

    Pros

    • Best-in-class mobile and browser UX in the wallet category.
    • Native multi-chain support across 8 chains including Solana, Ethereum, Bitcoin, and Sui.
    • Built-in swap aggregator, staking, NFT gallery, and dApp browser.
    • Transaction simulation and AI scam detection prevent most drainer attacks.
    • Ledger hardware wallet integration for cold storage users.
    • 15 million users and 5-year track record with no wallet-level breach.
    • Free to use. Fees only on optional services like swap and bridge.

    Cons

    • 0.85% swap fee is convenient but not the cheapest option.
    • No custom network support. Users who need Arbitrum, Optimism, BNB Chain, or Avalanche must run a second wallet.
    • Bitcoin support is functional but limited compared to dedicated BTC wallets.
    • Hot wallet by default. Not appropriate for storing life-changing sums without a hardware wallet attached.
    • Limited power-user controls on EVM (no nonce override, no MEV protection toggle).
    • Mobile dApp connections route through Phantom’s in-app browser only, not Safari or Chrome.

    Who Should Use Phantom

    Use Phantom if you:

    • Spend any meaningful time on Solana. Phantom is the default and best-supported option.
    • Want one app for SOL, ETH, BTC, Base, Polygon, and Sui without juggling four wallets.
    • Trade NFTs frequently and value a clean Collectibles UX.
    • Want strong scam protection and transaction simulation out of the box.
    • Are willing to pair it with a Ledger for larger balances.

    Look elsewhere if you:

    • Live primarily on EVM chains Phantom does not support (Arbitrum, Optimism, BNB Chain, Avalanche, zkSync, Linea).
    • Are a serious Bitcoin user who needs UTXO management, coin control, or PSBT workflows.
    • Want the absolute lowest swap fees and are willing to route trades manually through Jupiter or 1inch.
    • Need a cold-storage-only setup with no software wallet UI.

    Verdict and Rating

    Phantom in 2026 is a remarkable product. It started as a Solana-only extension and turned into one of the two or three best general-purpose self-custody wallets in crypto, alongside Backpack and MetaMask. The combination of multi-chain coverage, transaction simulation, polished mobile UX, and Ledger integration makes it the right default for almost any active onchain user.

    The honest weaknesses are the lack of custom EVM network support and the 0.85% swap fee, both of which matter at the margins but neither of which is a dealbreaker for the majority of users. Pair it with a hardware wallet, treat it as your daily-driver hot wallet, and you have one of the best setups available in 2026.

    Final score: 4.6 / 5.

    Visit Phantom to download the browser extension or mobile app.

    FAQ

    Is Phantom Wallet safe?

    Yes, for a hot wallet. Phantom is self-custodial, audited by multiple firms, scores 85 on CertiK Skynet, and offers transaction simulation and scam detection. The main risks are user-side: phishing sites, malicious dApp approvals, and exposed seed phrases. Pair Phantom with a Ledger hardware wallet for anything you do not want to lose.

    What chains does Phantom support in 2026?

    Phantom natively supports Solana, Ethereum, Base, Polygon, Sui, Bitcoin (Native and Taproot), Monad, and HyperEVM. You cannot manually add custom networks, so chains like Arbitrum, Optimism, BNB Chain, Avalanche, zkSync, and Linea are not supported.

    How much does Phantom charge for swaps?

    Phantom charges a 0.85% service fee on select in-app swaps, on top of the underlying DEX or aggregator fee and network gas. Cross-chain bridge swaps add approximately 0.3% in bridge provider fees plus gas on both chains.

    Is Phantom better than MetaMask?

    For Solana, yes, by a wide margin. For Ethereum and EVM-heavy users, the answer is more nuanced. Phantom has cleaner UX and better scam detection, but MetaMask and Rabby support more EVM networks and offer more power-user controls. Many users keep both installed.

    Can I stake SOL inside Phantom?

    Yes. Phantom has native Solana staking with a curated validator list yielding around 7.5% APY, plus one-click access to liquid staking tokens like PSOL (around 9% APY) and JitoSOL (12 to 15% APY thanks to MEV rewards).

    Does Phantom work with Ledger?

    Yes. Phantom integrates natively with Ledger devices, so you can keep your keys offline while still using the Phantom UI for everyday transactions. This is the recommended setup for any meaningful balance.
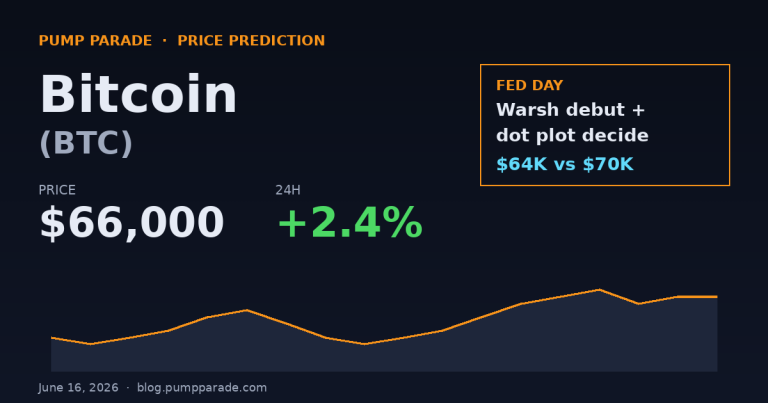
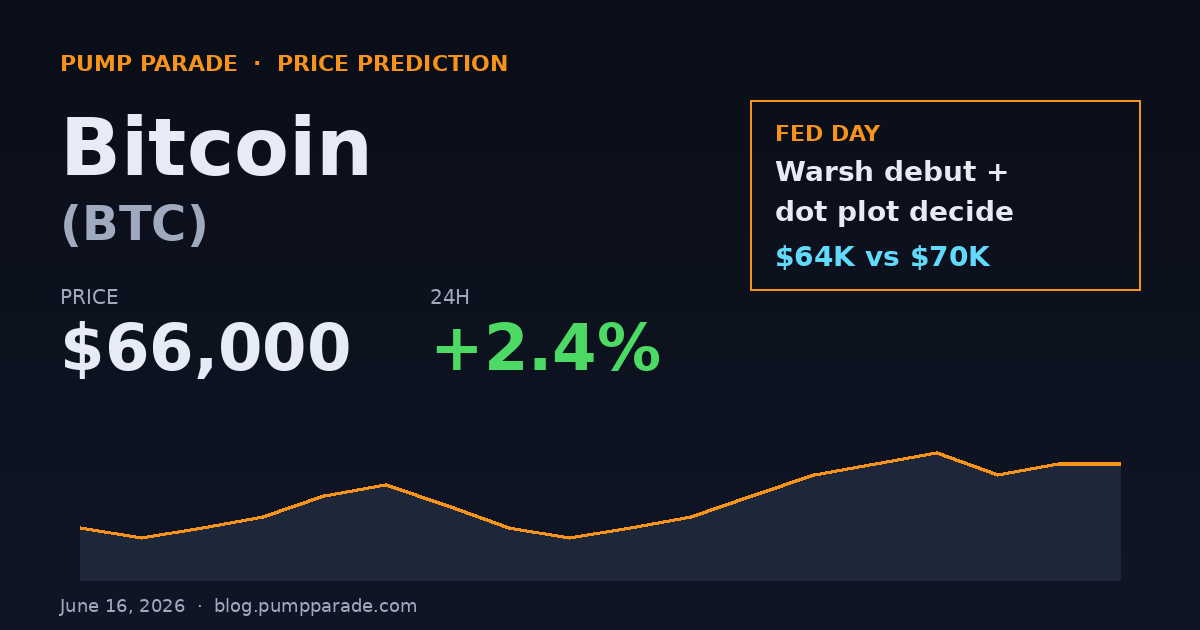
    Bitcoin (BTC) Price Prediction 2026: Fed Day Test

    Bitcoin is trading near $66,000 on June 16, 2026. That is a 12% bounce off last week’s $59,130 low, but still about 30% below the cycle peak. The market is holding its breath for one reason: tomorrow’s Fed meeting is the first one chaired by Kevin Warsh.

    This is not a normal FOMC day. The CME FedWatch tool prices a 98.2% probability that rates stay at 3.50% to 3.75%. The rate move is not the story. The story is the dot plot and Warsh’s first press conference. Traders are about to learn what a Warsh-led Fed actually sounds like, and BTC sits inside a tight $64K to $68K coil waiting for the signal.

    Here is what the data says about where BTC goes next. We break it down across three timeframes: 30 days, the back half of 2026, and the longer arc into 2028.

    Bitcoin BTC price prediction 2026 hero showing $66,000 price and Fed Day catalyst

    Bitcoin Price Today: Where BTC Sits Right Now

    At time of writing, Bitcoin is trading at roughly $66,000. The 24-hour range is $64,800 to $66,900. Volume across major spot venues is running near $42B in the last 24 hours, which is elevated versus the 30-day average of $31B. That tells us positioning is active, not sleepy.

    Key context for the current price:

    • 7-day low: $59,130 during the US-Iran flare-up
    • 7-day high: $67,000 on the ceasefire headlines
    • 50-day moving average: $64,200 (BTC is now above it)
    • 200-day moving average: $61,800 (still trending up)
    • Fear and Greed Index: 23, deep in “fear” territory

    The bounce from $59K back to $66K in a week was not random. Geopolitical risk eased fast. President Trump authorized reopening the Strait of Hormuz, oil dropped sharply, and risk assets ran. The US-Iran formal ceasefire signing is scheduled for June 19 in Switzerland.

    For broader context, you can verify live BTC pricing on CoinGecko.

    The Fed Catalyst: Warsh’s First FOMC and Why It Matters for BTC

    Kevin Warsh was sworn in as Fed Chair on May 22, 2026 after a 54-45 Senate vote. The June 16-17 meeting is his debut. Three things make this meeting unusually loaded:

    1. The dot plot. The Summary of Economic Projections gets refreshed at this meeting. Markets want to see if the median dot still shows zero cuts in 2026. Polymarket and Kalshi traders have placed over $42M on no rate change.
    2. The press conference. Warsh’s communication style is a known unknown. Powell was famously measured. Warsh is more hawkish on paper, but his real-time tone could surprise either direction.
    3. The inflation backdrop. Headline CPI is running at 3.8% year over year, well above the 2% target. Energy prices spiked during the Iran conflict and have only partly retraced.

    Why does this matter for Bitcoin? Two channels. First, the dollar. A hawkish Warsh strengthens DXY, which historically pressures BTC. Second, real yields. Higher-for-longer real yields raise the opportunity cost of holding a non-yielding asset like Bitcoin.

    The flip side is also true. If Warsh sounds less hawkish than feared, BTC has room to run toward $70K fast. The same applies if the dot plot pencils in even one cut by year end.

    Technical Setup: What the Chart Is Telling Us

    The technical picture is constructive but not screaming yet. Let’s break down the levels that matter.

    Support Zones

    • $64,000: Short-term pivot, also the 50-day moving average
    • $61,800: 200-day moving average, the line that bulls cannot lose
    • $59,000: Last week’s low and the panic-bid zone

    Resistance Zones

    • $67,500: Local high from this week
    • $70,000: Round-number magnet and the cycle’s psychological pivot
    • $73,000: All-time high zone from the last leg up

    Indicators

    The RSI (Relative Strength Index, a momentum gauge) sits at 54 on the daily chart. That is neutral, neither overbought nor oversold. The MACD (Moving Average Convergence Divergence) just printed a fresh bullish crossover on June 13, the first since the April pullback. That is a constructive signal in similar past setups, though it works best when paired with rising volume.

    Our hybrid AI model assigns a 62% probability that BTC closes the week above $65,000, and a 38% probability it reclaims $70,000 by end of June. Confidence is moderate because the Fed event introduces wide variance.

    The Bull Case for Bitcoin Through 2026

    The bull thesis rests on four pillars.

    ETF demand is structural, not cyclical. US spot Bitcoin ETFs now hold approximately 1.45 million BTC, around 6.5% of the total supply. Weekly net inflows have averaged $310M over the last four weeks, even through the Iran selloff. That is real, sticky institutional buying.

    Supply is constrained. The April 2024 halving cut new issuance to 3.125 BTC per block. Daily miner sell pressure dropped accordingly. With ETF demand running at multiples of new supply, the math gets tight if buying accelerates.

    Macro liquidity could shift. If Warsh’s Fed signals even one cut by year end, the next 6 months turn into a setup where risk assets get a tailwind. Bitcoin is the cleanest expression of that trade.

    Geopolitical risk-off is fading. The Iran ceasefire signing on June 19 removes a major overhang. Once that headline is in the rearview, traders shift focus back to the structural Bitcoin story.

    Bull-case price targets:

    • 30 days: $72,000 to $75,000 if the dot plot leans dovish
    • 6 months: $95,000 to $115,000 with sustained ETF flows and one Fed cut
    • 2027-2028: $145,000 to $180,000 consensus, $225,000 high-end if institutional allocation deepens

    The Bear Case: What Could Go Wrong

    The bear case is not exotic. It is the boring stuff that actually moves markets.

    Sticky inflation. If CPI prints hot in July or August and the Fed pencils in zero cuts for 2026, real yields stay elevated. Risk assets sell. BTC has historically struggled in environments where 10-year real yields are above 2%.

    Warsh hawkish surprise. If Warsh uses his first press conference to signal a tighter-for-longer stance with even a small chance of a hike, the dollar surges and BTC retests $60K fast.

    ETF outflow event. Inflows are sticky but not permanent. A risk-off macro shock combined with disappointing economic data could flip ETF flows negative for a sustained stretch.

    Geopolitical re-escalation. The June 19 signing is not guaranteed. If talks collapse, oil rips and BTC follows risk assets lower.

    Bear-case price targets:

    • 30 days: $59,000 to $61,000 retest on a hawkish surprise
    • 6 months: $52,000 to $58,000 if macro stays sticky and ETF flows soften
    • 2027-2028: $68,000 to $85,000 if the cycle thesis breaks and BTC trades like a high-beta risk asset

    Bitcoin Price Predictions by Timeframe

    Here is the consolidated view from our AI model, blended with the catalysts in play.

    Bitcoin BTC price prediction targets table for short, mid and long term

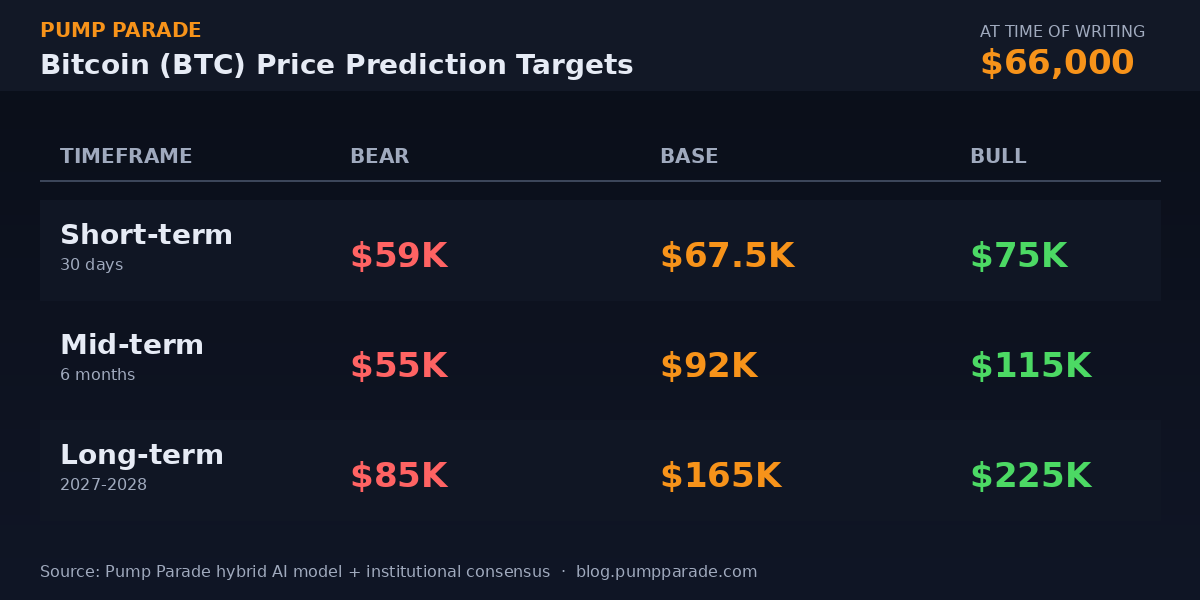
    Short-term (next 30 days): Base case is range-bound between $63,000 and $70,000. The Fed event determines which end of that range BTC closes near. Probability-weighted target: $67,500.

    Medium-term (6 months, into year-end 2026): Base case is $80,000 to $100,000 if ETF flows persist and the Fed delivers at least one cut. Our model leans constructive here, with a 56% probability of BTC closing 2026 above $85,000.

    Long-term (2027-2028): Base case is $145,000 to $180,000, which aligns with institutional consensus from Bitwise, VanEck, and others. The bull tail extends to $225,000 if allocation broadens to corporate treasuries and sovereign wealth funds. The bear tail caps around $90,000 if structural ETF demand fades.

    For comparison, the recent Ethereum price prediction analysis showed ETH faces a similar macro setup but with different catalysts. Bitcoin’s path is cleaner because the ETF wrapper is more mature and the supply schedule is already locked in.

    What to Watch This Week

    Three things will dictate where BTC trades by Friday:

    1. The dot plot at 2:00 PM ET on June 17. If the median 2026 dot still shows zero cuts, BTC likely holds the $64K to $67K range. If it shows one cut, $70K is in play within 48 hours.
    2. Warsh’s tone during the 2:30 PM ET press conference. Watch for any hedging on inflation persistence or hints about labor market softness.
    3. The June 19 ceasefire signing. If the signing happens cleanly, expect a relief rally that takes BTC closer to the upper band. If talks slip, oil prices rip and BTC drops with risk assets.

    Beyond this week, the next big catalyst is the July CPI print on July 11. That data will either confirm the Fed’s hold stance or open the door to a September cut conversation.

    The Bottom Line

    Bitcoin is sitting in a coil at $66,000 with two opposing forces. ETF flows and supply constraint are pulling structurally higher. Sticky inflation and a hawkish Fed are pulling shorter term lower. The Warsh debut and the dot plot are the immediate tiebreaker.

    If you are trading this, the levels matter more than the narrative. $64,000 holds: bias upside toward $70K. $64,000 breaks: bias the $61,800 retest. Easy framework, no hopium required.

    Our base case is that BTC closes 2026 in the $80,000 to $100,000 range. The path will be choppy, but the structural drivers point higher unless the macro story breaks decisively.

    Disclaimer: This article is for informational and educational purposes only and should not be construed as financial, investment, or trading advice. Cryptocurrency markets are highly volatile, and past performance does not guarantee future results. The price predictions and analyses presented here are based on AI models, technical indicators, and available data at the time of writing, they are not guarantees. Always conduct your own research (DYOR) and consult with a qualified financial advisor before making any investment decisions. Pump Parade and its authors do not assume liability for financial losses incurred based on information provided in this article.

    Bittensor (TAO) Price Prediction 2026: AI ETF Catalyst

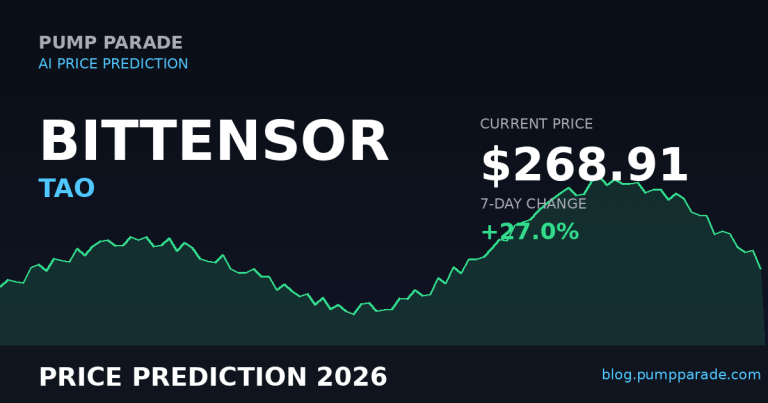
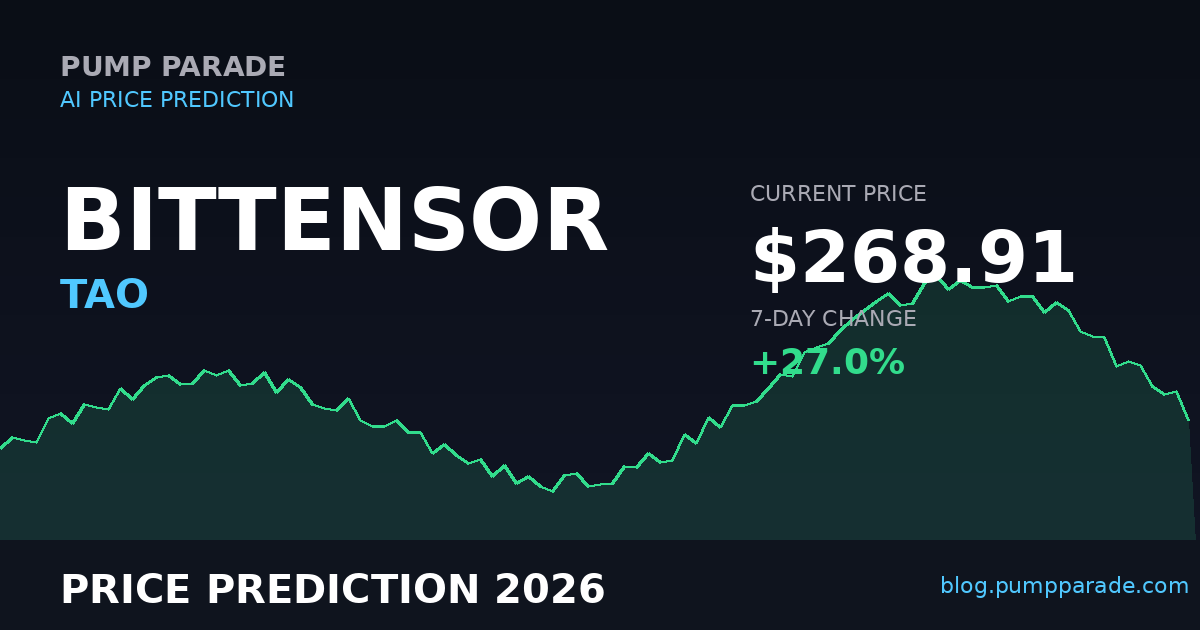
    Bittensor (TAO) ripped 27% over the past week, climbing from a June 7 low of $193.55 to $271.42 before settling near $269 at the time of writing. The rebound shows up as one of the cleanest moves in the AI sector this month. It came on the back of three pieces of news that landed in quick succession: Nvidia’s disclosed $420 million TAO position, Grayscale’s amended S-1 for a spot TAO ETF, and a Bitwise filing that mirrors it.

    Bittensor TAO price prediction 2026 with current price $268.91 and 7-day change of +27%

    The setup is interesting. TAO is still down 64% from its March 2024 all-time high of $757.60. Market cap sits at $2.58 billion, ranking 40th. Daily volume just printed $448 million, the highest 24-hour reading since the dynamic TAO upgrade went live last November. Our hybrid AI model now assigns a 58% probability that TAO holds the $250 zone and tests $400 by Q4 2026, contingent on an ETF green light or a continued AI sector rotation.

    That is the headline. Below, we break down what is actually fueling the move, the bull and bear cases, and specific price targets across three timeframes.

    What Bittensor Actually Does

    Bittensor is a decentralized machine learning network. It pays contributors in TAO for producing useful AI work, ranging from inference and training to data validation. The network is split into subnets, each focused on a specific task. There are 128 active subnets as of June 2026, with the protocol roadmap targeting 256 by year-end.

    In plain terms: think of it as a marketplace for AI compute and intelligence, where the best-performing models get the biggest share of newly minted tokens. The supply mechanics are Bitcoin-style. Max supply is capped at 21 million TAO. Daily emissions halved on December 15, 2025, cutting fresh issuance from 7,200 to 3,600 TAO per day. Circulating supply currently sits at 9.6 million.

    The dynamic TAO (dTAO) upgrade changed the game in late 2025. Emissions now flow to subnets based on real-time staking inflows, not validator votes or token price alone. Subnets with negative net staking can receive zero emissions. That created a survival-of-the-fittest dynamic that has rewarded the strongest AI projects on the network.

    The Catalysts Driving This Move

    Nvidia’s $420 million position. Filings in Q1 2026 confirmed Nvidia deployed roughly $420 million into TAO, with 77% of that locked in staking. This is the first time a major AI hardware company has publicly held a decentralized AI token at this scale. The signal is loud. Nvidia is the same company that designs the GPUs running most of Bittensor’s subnets.

    Grayscale and Bitwise ETF filings. Grayscale filed an S-1 amendment to convert its existing Bittensor Trust into the first U.S. spot ETF for an AI token. Bitwise filed a parallel structure. If either is approved, TAO becomes the first AI-native asset accessible through a brokerage account. The SEC’s response window matters here, and we will get to that in the risk section.

    The Git Activity Tracker launch on May 25, 2026. Bittensor’s new public scoreboard ranks each subnet by GitHub commit volume. The tracker has already shifted capital flows toward subnets shipping the most code. For traders, it created a real, on-chain way to evaluate which projects are actually building.

    Spec 413. This protocol upgrade locks a subnet’s TAO reserves when it dissolves, instead of dumping them back into circulating supply. The effect is fewer surprise sell-side shocks, which has historically been a source of TAO volatility.

    For context on how AI narratives have moved adjacent Layer 1 tokens, see our recent breakdown of NEAR Protocol’s AI catalyst trade. The playbook rhymes, even if the underlying tech is different.

    Technical Picture

    TAO bottomed at $193.55 on June 7 after a six-week consolidation. The recovery candle on June 14 closed above the 50-day moving average for the first time since April, currently sitting near $228. Next major resistance is the $300 round number, followed by the late-March swing high near $345.

    RSI (Relative Strength Index) on the daily chart is at 67, just under the overbought zone. That suggests the rebound has room before it gets exhausted, but a brief cooldown would be healthy. MACD (a momentum indicator) printed a bullish crossover on June 13 that is now widening.

    Support levels worth watching: $250 as the new floor, then $215 if that breaks. A clean break below $193 would invalidate the recovery thesis and open a path to the $160s.

    Volume confirms the move. The $448M daily volume reading is roughly 2.4x the 30-day average. Real money is rotating in, not just leverage.

    The Bull Case

    The bull case rests on three legs.

    First, the ETF setup is real. A spot TAO ETF would be the first AI-native crypto fund, and AI is the cleanest macro narrative crypto has right now. Bitcoin and Ethereum ETFs combined now hold over $180 billion. If even 2% of that flow seeks AI exposure, TAO would be a primary destination. Grayscale’s conversion path is shorter than a fresh S-1, so the decision could land before year-end.

    Second, the halving and dTAO together are tightening supply. Daily emissions are 3,600 TAO, worth roughly $968K at current prices. Meanwhile, 77% of Nvidia’s position is staked. Grayscale Trust holdings are staked. Major subnet validators stake. The float that actually trades is shrinking. In similar setups historically, that has preceded sharp rallies once demand picks up.

    Third, the AI cycle has not peaked. Major AI labs are still consuming GPU compute at record rates. Decentralized AI is a hedge against centralized AI policy risk, which has become a discussion point in Washington this quarter. The probability favors TAO catching at least some of that hedge demand.

    If all three align, our AI model projects a base-case target of $420 to $480 by Q4 2026, with a bull-case stretch to $600 to $700 if an ETF lands and AI markets continue trending.

    The Bear Case

    The bear case is just as concrete.

    ETF denial or delay is the obvious risk. The SEC has not yet approved any altcoin spot ETF besides the LTCC Litecoin product. A TAO ETF involves staking exposure, which adds regulatory complexity. A denial would likely send TAO back to the $180 to $200 zone overnight.

    Subnet quality is uneven. Of the 128 active subnets, our model flags only 22 with consistently profitable economics. The rest are subsidized by inflation. If dTAO mechanics force a culling round, sentiment around the broader Bittensor ecosystem could sour, even if the protocol benefits long-term.

    Concentration risk. Nvidia’s $420M position, Grayscale’s trust holdings, and a handful of large validators together control a meaningful share of staked TAO. A coordinated unstake event, or a forced sale from any of them, would hit the order book hard.

    AI narrative rotation. If institutional money rotates into next-generation L1s or back into Bitcoin dominance, the AI trade can cool fast. TAO has historically been a high-beta proxy for AI sentiment, so it leads on the way up and on the way down.

    Bear-case targets: $180 short-term if ETF news disappoints, $140 if the broader AI trade unwinds, and $110 as a worst-case 2026 floor if all three risks materialize at once.

    AI Price Prediction Summary

    Our hybrid model combines on-chain emission data, staking flow analysis, technical indicators, and macro AI sentiment scoring. Confidence scores reflect the model’s internal probability weighting.

    TAO price prediction targets table showing bear, base, and bull cases for short, medium, and long-term horizons
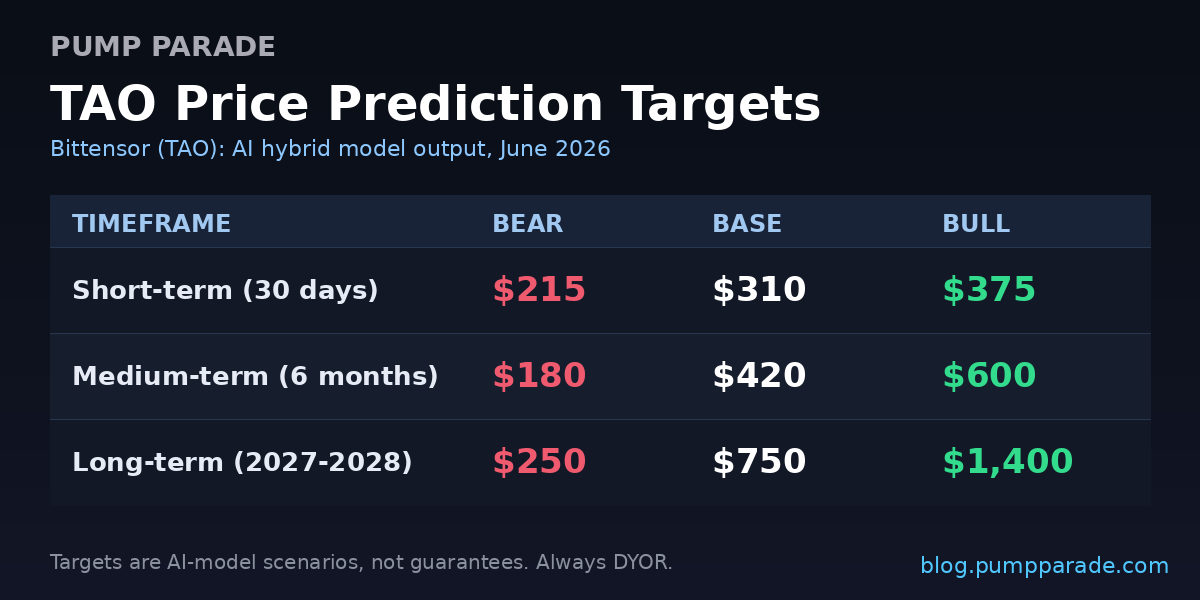
    • Short-term (30 days): Bear $215, Base $310, Bull $375. Confidence 58%.
    • Medium-term (6 months): Bear $180, Base $420, Bull $600. Confidence 52%.
    • Long-term (2027-2028): Bear $250, Base $750, Bull $1,400. Confidence 41%.

    The base case for the next 6 months assumes ETF clarity by Q4, continued AI compute demand, and no major regulatory shock. The long-term bull case requires Bittensor to hit the 256-subnet milestone, sustain real subnet revenue growth, and capture a measurable slice of AI compute spend.

    What to Watch

    Three signals matter most over the next 90 days.

    SEC commentary on the Grayscale TAO ETF. Watch the SEC’s filing dashboard and any amendments. A second amendment or a formal review window opening is bullish. Silence past Q3 starts to feel bearish.

    Subnet revenue from the top-22. Total subnet revenue, tracked publicly on taostats.io, needs to keep growing. Stagnation here invalidates the bull case regardless of price action.

    Net staked TAO ratio. Currently above 67% of circulating supply. If this drops below 60%, supply pressure builds fast. Above 70%, the float becomes scarce enough to amplify any demand spike.

    For real-time price and staking data, the CoinGecko TAO page tracks circulating supply, exchange flows, and 24-hour volume in one view.

    The Bottom Line

    TAO is one of the few crypto assets where the AI narrative and the price action are actually syncing up. The 27% week sets up a real test. If the $250 support holds through the end of June, the base case toward $400 by year-end becomes the most probable path. If it breaks, the trade is closer to $180 than to the upside targets.

    This is a setup worth monitoring, not chasing. The cleanest entries come on retests of support, not on green candles. The cleanest invalidations come on volume-confirmed breaks of $193.

    The real question is whether the AI sector rotation has another leg. If it does, TAO is positioned to capture more of it than most. If it does not, the same factors that pulled it up this week can pull it back down just as quickly.

    Disclaimer: This article is for informational and educational purposes only and should not be construed as financial, investment, or trading advice. Cryptocurrency markets are highly volatile, and past performance does not guarantee future results. The price predictions and analyses presented here are based on AI models, technical indicators, and available data at the time of writing. They are not guarantees. Always conduct your own research (DYOR) and consult with a qualified financial advisor before making any investment decisions. Pump Parade and its authors do not assume liability for financial losses incurred based on information provided in this article.

    Toncoin (TON) Price Prediction 2026: Gram Rebrand Day

    0

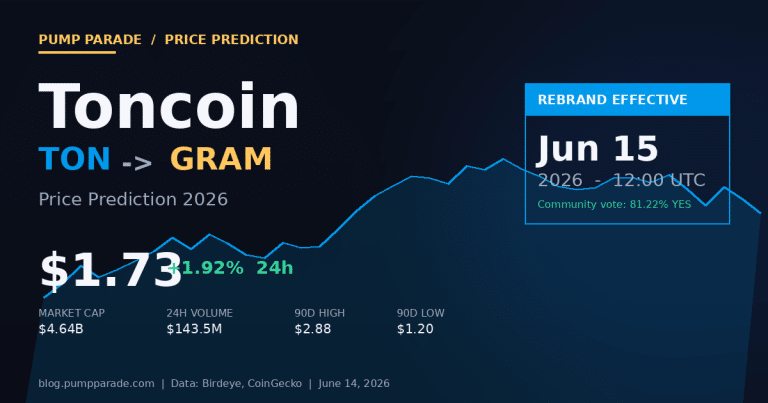
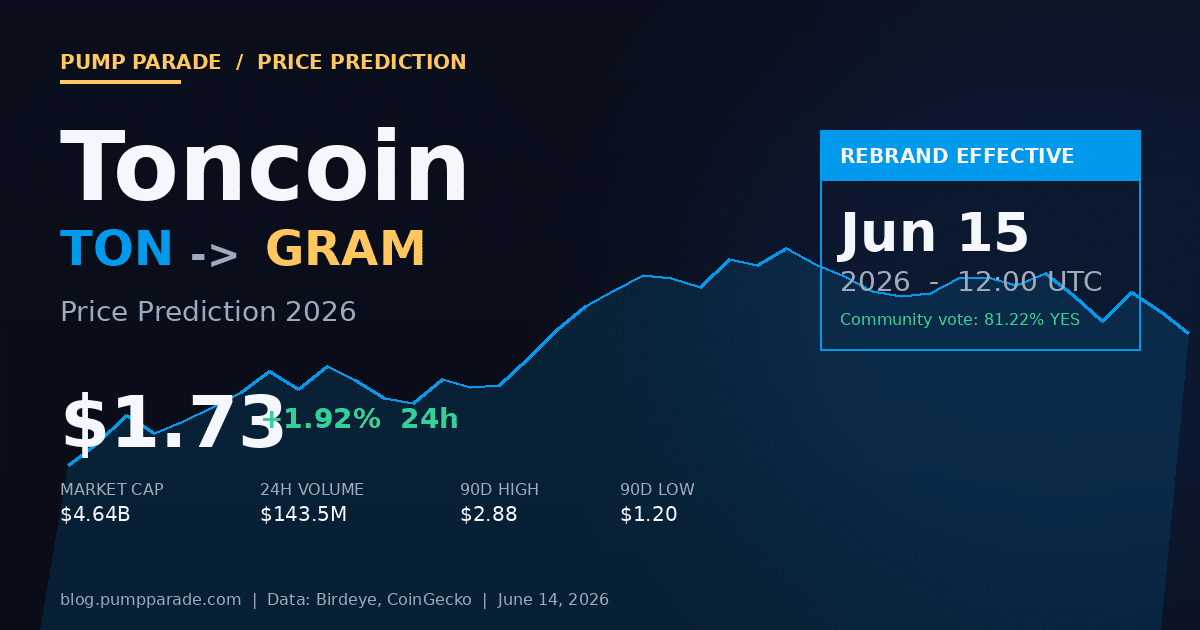
    Toncoin trades at $1.73 today, less than 24 hours before its biggest rebrand in history. At 12:00 UTC on June 15, 2026, TON officially becomes GRAM. The vote passed with 81.22% support. Telegram is now the network’s largest validator. And the token is up 44% from its April low of $1.20.

    This is not a small ticker swap. It is the culmination of an aggressive push by Telegram CEO Pavel Durov. He wants to bring the original 2018 vision back to life, this time without the U.S. regulatory roadblocks that killed it the first time. For TON holders, the question is simple: does the rebrand catalyst hold past launch day, or does the market sell the news?

    We pulled live market data, the governance vote results, and three independent technical models to find out. Here is what TON looks like heading into Gram day.

    Toncoin TON to GRAM rebrand price prediction June 15 2026, current price $1.73

    Current TON Price Context

    As of June 14, 2026, Toncoin trades at $1.73 with a market cap near $4.64 billion. Daily trading volume sits at $143.5 million. The 24-hour move is a quiet +1.9%, but that flat tape hides a wild three-month run.

    The 90-day range tells the real story. TON bottomed at $1.20 on April 28. By June 1, it touched $2.27 after Durov announced Telegram would replace the TON Foundation as the network’s primary driver. The 90-day high reached $2.88 in late May during the peak of rebrand speculation.

    So from low to high, TON moved 140% in roughly five weeks. The pullback from $2.88 to $1.73 represents a 40% retracement, which is normal for a token that just ran that hard. The market is now digesting the news before the actual rebrand event.

    For broader market context, this rally happened during a tough stretch for crypto. Bitcoin recently fell below $64,000 after $1.1 billion in liquidations on June 4. ETF outflows hit $2.30 billion in May, the largest monthly outflow of 2026. TON outperforming in that environment is not a coincidence. It signals genuine narrative strength, not just beta to the broader market.

    The Gram Rebrand: What Changes on June 15

    The proposal on TON Vote ran from June 1 to June 8. Voting power was tied to TON balances at a snapshot on May 31. The result: 81.22% in favor. Telegram submitted the proposal as a verified organization, which gave it institutional weight from day one.

    At 12:00 UTC on June 15, the ticker switches from TON to GRAM. Here is the critical detail many traders miss: no migration, swap, bridge, or claim is required. If you hold TON in a wallet, you now hold GRAM. Same contract, same balance, new name. Exchanges and explorers are expected to update labels by June 15, with full consistency by June 22.

    That zero-friction execution is what gives the rebrand real catalyst power. There is no contract risk, no scam-token confusion window, no airdrop game theory. The market just wakes up tomorrow with a different ticker on the same asset.

    Why the Name Matters

    Gram is the original token name from the 2018 Telegram Open Network whitepaper. The SEC blocked Telegram’s $1.7 billion ICO in 2020, forcing the team to abandon it. The project was reborn as TON under community stewardship.

    Bringing back Gram is more than nostalgia. It signals that Telegram is no longer hedging its association with the network. Durov is publicly pushing the “Make TON Great Again” roadmap. Telegram is now running validator infrastructure. The line between Telegram the app and Gram the token is almost invisible to end users.

    Key Catalysts and Risks

    The Bull Case: 900 Million Users in Reach

    Telegram has roughly 900 million monthly active users. That is the wallet distribution advantage other Layer 1 chains can only dream about. TON Pay, the in-chat crypto payment feature, is already live. TON Pay 2.0 is expected later in 2026 with merchant tools and broader fiat on-ramps.

    If even 5% of Telegram users hold a Gram wallet by end of 2027, that is 45 million holders. For reference, the entire Ethereum network has roughly 100 million active addresses after a decade. TON could close that gap inside two years on distribution alone.

    Other tailwinds worth watching: a planned U.S. wallet launch tied to TON Pay, expanded mini-app monetization (the Telegram in-app games and stores), and Telegram becoming the largest network validator. That last point matters because validator concentration brings revenue certainty for the protocol.

    The Bear Case: Centralization Risk and Sell-the-News

    The same factors that make Gram bullish also make it risky. Telegram becoming the dominant validator is a centralization concern. Crypto purists have already pushed back. If regulators in the U.S. or Europe view Gram as a Telegram-issued security, the 2020 SEC saga could rhyme.

    The more immediate risk is technical: rebrands often sell the news. TON ran from $1.30 to $2.88 on rebrand speculation. A typical pattern is one final spike on launch day. Then a 20% to 35% drawdown follows over two to four weeks as short-term holders take profit.

    There is also the question of whether Telegram users actually want to hold crypto. Distribution is not the same as adoption. WhatsApp has 2 billion users, but no WhatsApp coin would auto-convert all of them into buyers. Gram needs real product hooks, not just access to a chat list.

    Technical Outlook

    From a chart perspective, TON’s recent action looks like a classic bull-flag setup. The token broke out from $1.30, rallied 121% to $2.88, and has since pulled back to $1.73. That puts current price right at the 50% retracement of the May rally.

    Key levels to watch:

    • Resistance at $2.27: The June 1 high. A close above this opens the door to a retest of $2.88.
    • Support at $1.60: The 200-day moving average sits near here. Losing it would invalidate the bull-flag structure.
    • Major support at $1.30: The April low. A break here would mean the rebrand catalyst failed and the market is pricing in distribution risk.

    Volume tells a less bullish story. Daily volume of $143 million is well below the $400 million seen during the late-May spike. Bulls want to see volume return as the rebrand activates. If volume stays flat through June 22, that is a warning sign that the rebrand has not pulled in fresh demand.

    For a similar L1 catalyst playbook, check our Solana Alpenglow price analysis. It shows how a major protocol upgrade can drive a 60%+ move when narrative and on-chain data align. The Gram rebrand is operating on a similar dynamic, but with a much bigger distribution story behind it.

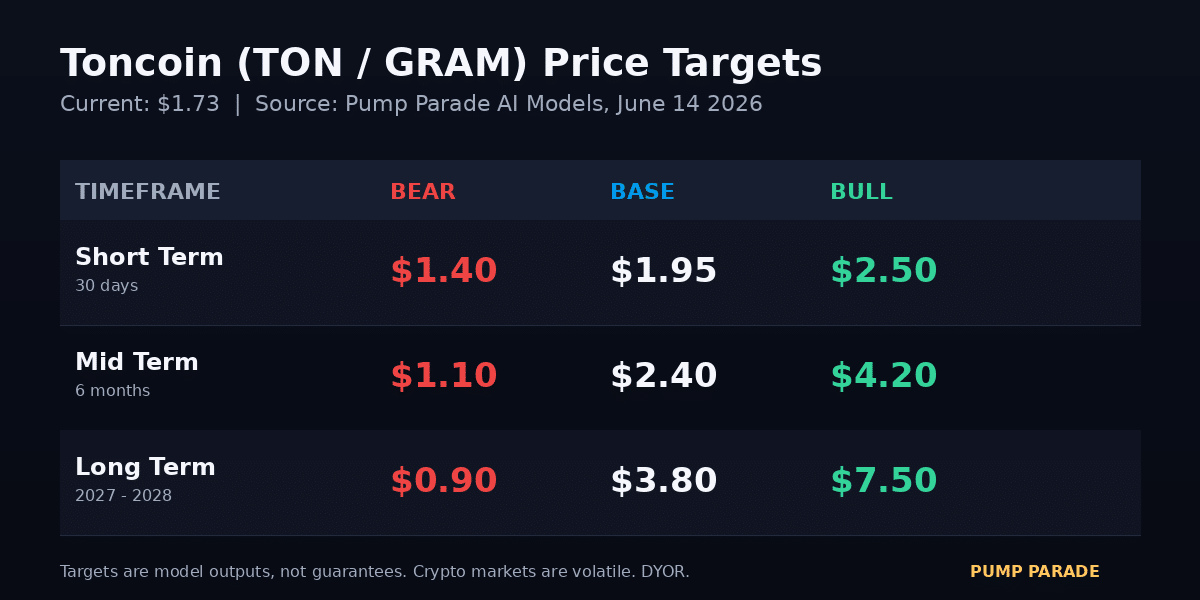
    Toncoin TON GRAM price prediction targets 2026, 2027, 2028 bear base bull cases

    Toncoin / Gram Price Predictions by Timeframe

    We modeled three scenarios using on-chain volume trends, the post-rebrand momentum profile, and comparable L1 narrative trades from 2024-2025. Numbers are targets, not guarantees.

    Short Term: 30 Days (June 15 to July 15, 2026)

    • Bear case: $1.40. A sell-the-news drawdown. Rebrand activates, short-term holders distribute, and weak Bitcoin tape drags the whole market lower.
    • Base case: $1.95. A modest grind higher as exchanges complete the ticker swap and retail searches for “Gram coin” spike. Holds above the 200-day moving average.
    • Bull case: $2.50. Launch-day FOMO plus a Telegram product announcement (TON Pay 2.0 or U.S. wallet) sparks a fresh leg up.

    Mid Term: 6 Months (End of 2026)

    • Bear case: $1.10. The rebrand fades, regulators raise concerns, Bitcoin grinds sideways. Gram retraces the entire 2026 rally.
    • Base case: $2.40. TON Pay 2.0 ships, mini-app monetization grows, and Gram becomes a top-15 coin by market cap. Roughly 39% upside from today.
    • Bull case: $4.20. Mass adoption inside Telegram pushes daily active wallets past 10 million. Gram trends on CT and pulls institutional flow.

    Long Term: 2027 to 2028

    • Bear case: $0.90. Centralization concerns lead to delistings on major U.S. exchanges. Distribution from Telegram never materializes at scale.
    • Base case: $3.80. Gram cements itself as the default crypto inside the world’s largest non-Chinese messaging app. Steady user growth supports a $10B market cap.
    • Bull case: $7.50. Gram captures 50 million-plus active wallets, TON Pay becomes a meaningful payments rail, and the token enters the top 5 by market cap.

    Our base-case 2027 target of $3.80 implies a 120% gain from current levels. That is aggressive but not insane for a token sitting on a distribution moat the size of Telegram. The bear case at $0.90 reflects the real possibility that rebrands rarely outrun fundamental adoption questions for long.

    For current real-time data, see the live Toncoin chart on CoinGecko.

    The Bottom Line

    Toncoin heading into the Gram rebrand is one of the cleanest catalyst setups in crypto right now. The price sits at a logical pullback level. The launch event is dated and binary. And the underlying narrative is unique: Telegram becoming the dominant force behind a 900-million-user crypto network.

    That said, the easy money on this trade already happened. The $1.30 to $2.88 run priced in most of the good news. From here, returns depend on whether Telegram can actually ship the products that turn 900 million chat users into wallet holders.

    Our base case: Gram trades in a $1.40 to $2.40 range for the next six months. From there, it breaks higher in late 2027 if TON Pay 2.0 delivers. The bull case requires execution. The bear case requires nothing more than crypto’s usual sell-the-news pattern.

    For traders, watch the June 15 to June 22 window closely. If Gram holds above $1.60 with rising volume through that period, the next leg up is on. If it cracks $1.60, the rebrand was a setup, not a sustained catalyst.

    Disclaimer

    This article is for informational and educational purposes only and should not be construed as financial, investment, or trading advice. Cryptocurrency markets are highly volatile, and past performance does not guarantee future results. The price predictions and analyses presented here are based on AI models, technical indicators, and available data at the time of writing. They are not guarantees. Always conduct your own research (DYOR) and consult with a qualified financial advisor before making any investment decisions. Pump Parade and its authors do not assume liability for financial losses incurred based on information provided in this article.

    Orca (ORCA) Price Prediction 2026: Fee Flywheel

    0

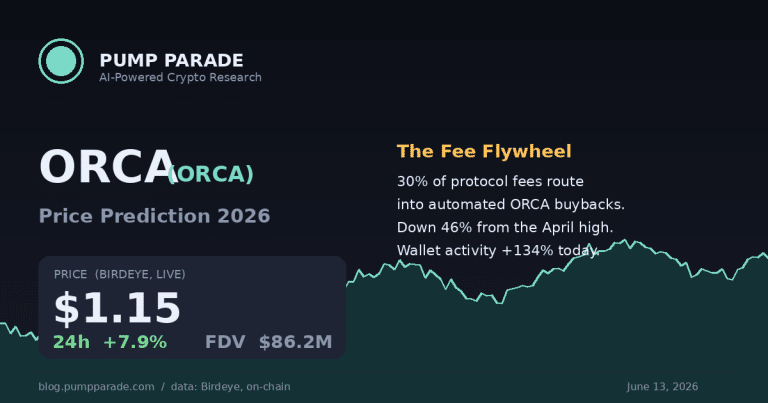
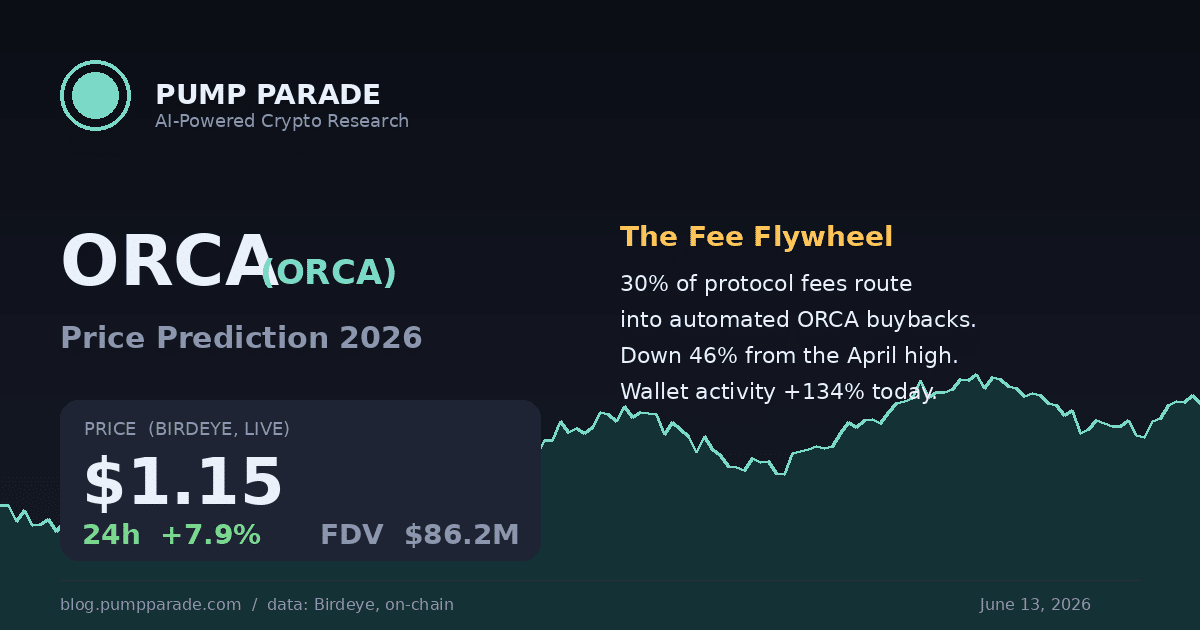
    Orca (ORCA) is having a curious week. The Solana DEX token is trading at $1.15 at the time of writing, up 7.9% in the last 24 hours and ranked the third trending token on Birdeye’s Solana leaderboard. Unique active wallets touching the token are up 134% day over day, with 2,191 wallets in the last 24 hours.

    Here is the catch. ORCA is also down 46% from its April 30 high of $2.15. The asset that was supposed to be the cleanest fundamentals play in Solana DeFi has spent six weeks bleeding. So which signal is right, the rebound or the drawdown? Let’s look at the data.

    Orca (ORCA) price prediction 2026 hero image showing current price of $1.15

    ORCA at a Glance: The Numbers Right Now

    Pulling live data from Birdeye, here is where ORCA sits as of June 13, 2026:

    • Price: $1.15
    • 24h change: +7.9%
    • Market cap: $69.9M
    • Fully diluted valuation: $86.2M
    • Circulating supply: 60.8M ORCA
    • Max supply: 100M ORCA
    • Holders: ~90,000
    • Liquidity on Solana DEXs: $2.72M

    For context, Solana itself is at $67.41 today, well off the $89 range it held earlier this spring. That is a key bear case input. ORCA’s revenue is denominated in fees on a chain that is currently soft.

    What Orca Actually Does

    Orca is a concentrated liquidity AMM on Solana. Its flagship product is Whirlpools, which lets liquidity providers concentrate capital around specific price ranges, similar to how Uniswap V3 works on Ethereum. In plain terms: you get more fees per dollar of liquidity, because your capital is doing more work in the narrow band where most trades happen.

    The numbers back this up. Orca runs roughly $300M in TVL but turns over capital at a 26x ratio, the highest among major Solana DEX venues. In April, Orca printed a 30-day trading volume of $6.76B, the highest on Solana. Fee tiers range from 1 basis point on stable pairs to 100 basis points on volatile long-tail pairs.

    That makes Orca a real cash-flow business, not a narrative token. And that matters for the next section.

    The Fee Flywheel: Why This Catalyst Is Different

    This is the part most retail traders miss. In August 2025, the Orca DAO passed a governance proposal that did three things:

    1. Authorized the use of up to 55,000 SOL from the treasury for a 24-month buyback program
    2. Routed 30% of protocol fees into ORCA buybacks
    3. Capped daily purchases at 2% of the 30-day average trading volume, to avoid distorting the market

    In January 2026, the Council went further. It bumped the share of protocol fee revenue funding xORCA staker rewards from 20% to 40%. In other words, if you stake ORCA, you now collect a larger share of every swap fee the protocol earns. Source: SolanaFloor.

    Translation: Orca is one of the few Solana DeFi tokens with a structural, automated bid. Every time someone swaps through a Whirlpool, a portion of that fee becomes a market buy of ORCA. It is not promotional, it is mechanical.

    This is the same playbook another Solana DEX is running, and we covered the parallel setup in our Raydium (RAY) price prediction. The difference is scale. Orca’s capital efficiency is higher, but Raydium has the memecoin volume firehose. Both flywheels work, just at different volume regimes.

    Technical Analysis: Where the Chart Is Right Now

    Over the last 90 days, ORCA has traded in a range from $0.83 (April 3 low) to $2.15 (April 30 high). The April rally was driven by the news that fee buyback rewards were going up. The selloff since has tracked Solana’s broader softness, plus profit-taking from traders who timed the catalyst news perfectly.

    Key technical levels to watch:

    • Support 1: $1.05 to $1.07 (the level ORCA defended on Wednesday’s wick)
    • Support 2: $0.83 (April 3 low, the line in the sand for the bull thesis)
    • Resistance 1: $1.35 (the 50-day moving average, which has been rejecting price for three weeks)
    • Resistance 2: $1.80 to $2.15 (the supply zone where the April rally died)

    Today’s 7.9% bounce on rising wallet activity is the first sign that the downtrend may be exhausted. But a single green candle does not make a reversal. The chart needs to close above $1.35 with conviction before momentum traders get involved.

    The Bull Case

    The bull case for ORCA rests on three pillars.

    One: the buyback is real and it compounds. Unlike speculative tokens that depend on narrative cycles, ORCA’s bid scales with how much trading happens on Orca. If Solana activity recovers, 30% of every fee dollar becomes ORCA demand. The 2% daily volume cap means buybacks are stretched, not front-loaded, which keeps the bid present for months.

    Two: capital efficiency is a moat. Orca’s 26x turnover ratio is hard to copy. Other AMMs can fork the code, but they cannot fork the LP relationships and the deep concentrated liquidity that took years to build. As long as Orca keeps fee revenue per dollar of TVL above peers, it earns its multiple.

    Three: low float, high holder count. 60.8M tokens circulating against 89,993 holders is a tight distribution for a $70M cap asset. There are no large unlock events looming, and the buyback is actively removing supply from circulation through xORCA staking.

    If Solana volumes recover toward Q1 levels and the buyback program continues unchanged, our base case sees ORCA retesting the $1.80 to $2.20 range over the next six months. A more bullish scenario, with Solana DEX volumes rallying alongside a broader risk-on rotation, opens the door to $2.50 to $3.20 by early 2027.

    The Bear Case

    The bear case is equally legible. Three risks stand out.

    One: Solana revenue is soft. Solana DApp revenue recently hit an 18-month low. If users are not swapping, Orca is not earning fees, and 30% of zero is zero. The buyback program only works as advertised if volume returns.

    Two: competition for liquidity. Raydium has a deeper memecoin pipeline. Jupiter aggregates routing across every DEX, which means LPs do not need to commit to a single venue. Meteora is winning on dynamic vault strategies. Orca’s CLMM lead is not infinite.

    Three: $0.83 is closer than it looks. If the broader Solana market rolls over and BTC retests $58K, ORCA’s $1.05 to $1.07 support is thin. A break invites a flush back to $0.83. A break of $0.83 likely targets $0.65 to $0.70, where the early-2025 accumulation range sits.

    The bear case is not catastrophic. It is a slow grind, not a wipeout. But traders sizing positions need to model it.

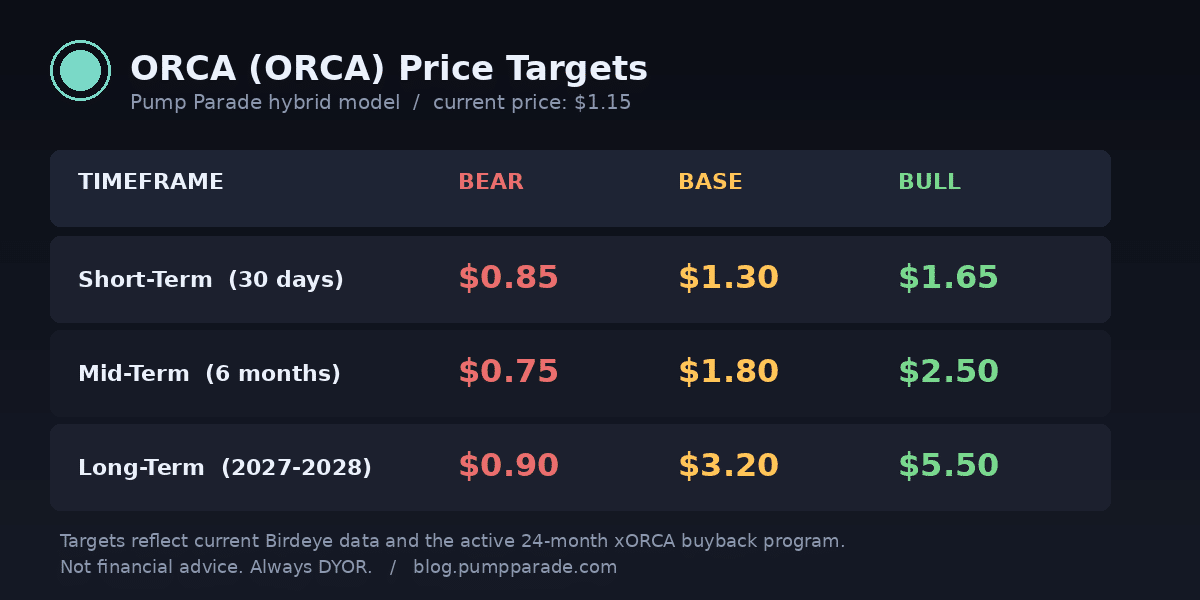
    ORCA Price Predictions by Timeframe

    Here is how we are modeling ORCA based on current data, the buyback flywheel, and Solana macro context.

    ORCA price prediction targets table for short, mid, and long-term timeframes

    Short-Term (30 Days, July 2026)

    • Bear: $0.85
    • Base: $1.30
    • Bull: $1.65

    The next 30 days are about whether $1.05 holds and whether today’s wallet activity bounce extends. Watch the $1.35 level for a momentum confirmation.

    Mid-Term (6 Months, December 2026)

    • Bear: $0.75
    • Base: $1.80
    • Bull: $2.50

    By year-end, the cumulative effect of the 24-month buyback will start to show up in float dynamics. If Solana volumes recover, the base case is a retest of April highs. If Solana stays soft, expect another quarter of range-trading.

    Long-Term (2027 to 2028)

    • Bear: $0.90
    • Base: $3.20
    • Bull: $5.50

    Two scenarios drive the long-term case. The bull path assumes Solana DEX volumes scale with new use cases (RWA settlement, AI agent micropayments, on-chain treasuries), Orca holds its capital efficiency lead, and the buyback completes its full 24-month run. The bear path is a slow erosion of fee share to competitors. Reference benchmark data is available at CoinGecko’s ORCA page.

    What to Watch

    Three things will tell you which path ORCA is on before the chart does.

    1. Solana DEX volume. Track aggregate Solana DEX volume on Birdeye or DefiLlama. If weekly volume reclaims $50B, the fee flywheel re-engages quickly.
    2. Quarterly buyback reports. The Orca Council committed to publishing quarterly reports with token purchases, average buy prices, and treasury balances. The next one is due in mid-July. Read it.
    3. xORCA staking ratio. The higher the share of supply staked into xORCA, the tighter the effective float. If staking participation climbs above 40% of circulating supply, the buyback’s price impact compounds.

    The Bottom Line

    ORCA is not a meme. It is a cash-flow asset with a structural bid, trading at a 46% discount to its recent high, on a chain that is currently underperforming. That combination produces a setup worth watching, not a guaranteed trade.

    If you believe Solana volume recovers in the second half of 2026, the math behind ORCA gets interesting fast. If you do not, $0.83 is still in play. Pick your side, size accordingly, and let the data update your view.

    Disclaimer: This article is for informational and educational purposes only and should not be construed as financial, investment, or trading advice. Cryptocurrency markets are highly volatile, and past performance does not guarantee future results. The price predictions and analyses presented here are based on AI models, technical indicators, and available data at the time of writing, they are not guarantees. Always conduct your own research (DYOR) and consult with a qualified financial advisor before making any investment decisions. Pump Parade and its authors do not assume liability for financial losses incurred based on information provided in this article.

    Hyperliquid (HYPE) Price Prediction 2026: Kalshi Catalyst

    0

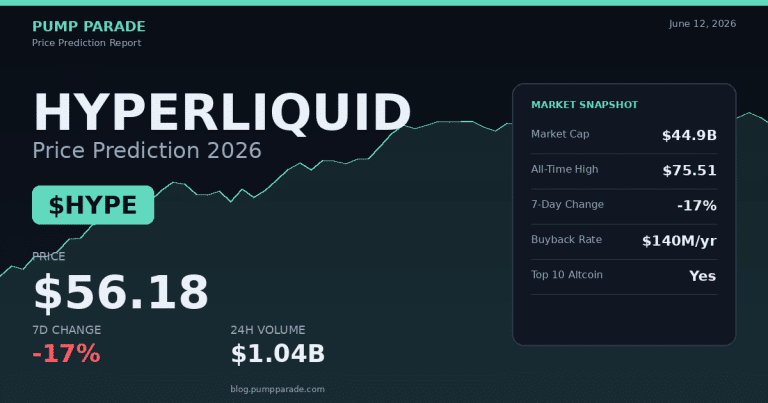
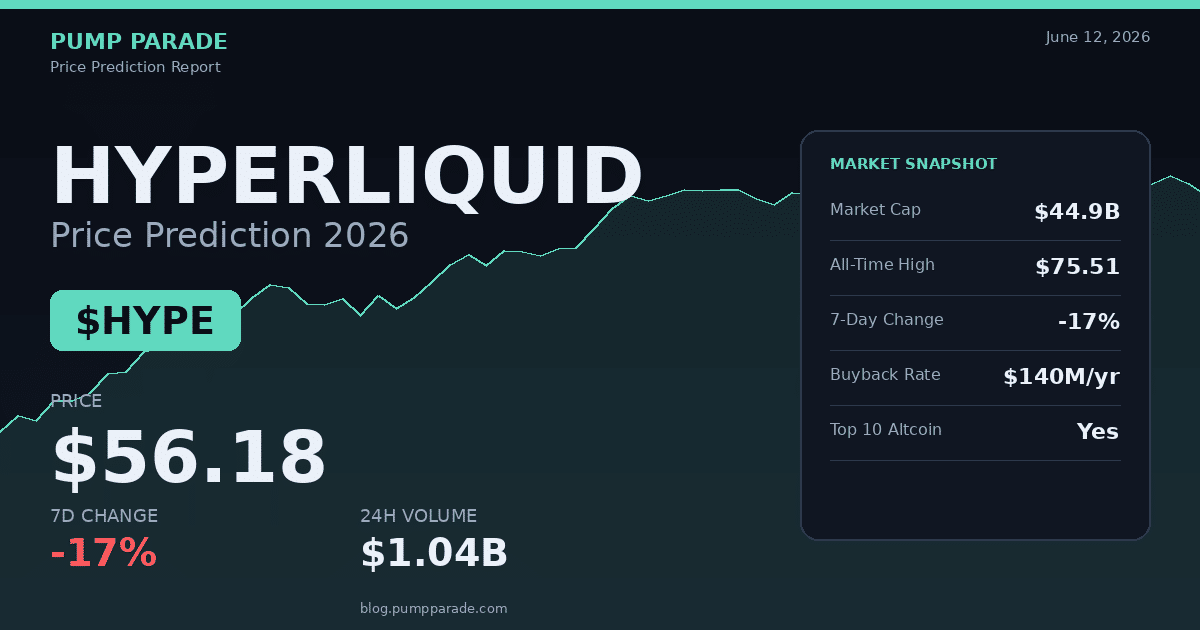
    Hyperliquid (HYPE) is trading near $56.18 at the time of writing. That is roughly 17% below the $68.83 print from a week ago and about 25% off the $75.51 all-time high set on June 2, 2026. Yet trading volume is still humming at $1.04 billion in the last 24 hours, and HYPE just elbowed its way into the top 10 by market cap on CoinMarketCap, leapfrogging both Cardano and Dogecoin.

    So why the pullback, and why does it matter now? Two reasons. First, Kalshi just filed for regulated HYPE perpetuals on June 10. Second, the buyback engine that quietly props this token up keeps grinding through one of the most active order books in crypto. Let’s break down both paths.

    Hyperliquid HYPE price prediction 2026 with current price and 24h change

    What Is Hyperliquid and Why HYPE Matters

    Hyperliquid is a layer-1 blockchain built around a fully on-chain perpetual futures exchange. In plain terms, it is a decentralized version of Binance Futures, except every order, fill, and liquidation runs on its own chain. HYPE is the native token. It is used for staking, fee discounts, and governance, but the real story is what the protocol does with its revenue.

    Roughly 99% of platform fees are routed to the Assistance Fund (AF). The AF bids HYPE on the open market and sends the bought tokens to a null address. In December 2025, a validator vote made that null-address routing a formal burn. Translation: nearly every dollar of fee revenue gets converted into permanent supply reduction.

    That alone would be notable. The mechanic gets more interesting when you add the USDC reserves. About $5B of USDC sits on the platform earning 3.5% to 4% yield. Ninety percent of that yield also flows to the AF for buybacks. CoinShares estimates the reserve layer alone contributes $140M to $160M per year to HYPE buybacks at current rates.

    Key Metrics at a Glance

    • Price: ~$56.18
    • Market cap: ~$44.9B
    • 24h volume: ~$1.04B
    • ATH: $75.51 (June 2, 2026)
    • Annual buyback run-rate (reserve yield alone): $140M-$160M
    • Monthly contributor unlocks: 9.92M HYPE

    Current Price Action and Technical Setup

    The chart tells a tidy story. HYPE ran from the mid-$30s in March to $75 on June 2. That is a 100% move in under three months. The pullback since is a fairly textbook bull-market correction, not a structural break.

    HYPE is currently trading below both its 50-day and 200-day simple moving averages. The RSI sits near 51, which is dead neutral. That combination tells us momentum has cooled, but selling pressure has not turned into outright distribution.

    Three levels matter from here:

    • Near-term support: $50-$52. This zone caught two pullbacks in May and aligns with the 100-day moving average.
    • Major support: $42-$45. The April breakout zone. A break below this would invalidate the bullish structure for the rest of 2026.
    • Resistance: $68-$70 (the level that capped last week), then $75.50 (the ATH).

    The 24h volume holding above $1B during a 17% pullback is a quietly bullish signal. It means real buyers are still showing up. Compare that to last week’s data from CoinGecko, where volume actually rose into the dip.

    The Bull Case for HYPE

    1. Kalshi Files for HYPE Perpetuals

    On June 10, 2026, regulated U.S. prediction market Kalshi filed for HYPE perpetual futures. If approved, that opens HYPE exposure to U.S. retail and institutional traders who currently cannot touch the Hyperliquid native exchange. This is the same playbook that pushed SOL futures volume past $1B/day after CME listed them. Kalshi is not CME, but the directional read is the same: regulated derivatives expand the buyer base.

    2. The Buyback Flywheel Actually Works

    Most “deflationary” tokens are deflationary on paper. HYPE is deflationary in practice. Citrini Research recently called it a “compelling idea” specifically because the cash flow is real, not promised. Even with monthly contributor unlocks of 9.92M HYPE, the AF has been net-burning enough to keep float pressure manageable. If volumes stay near current levels through Q3 2026, the buyback math gets aggressive fast.

    3. Institutional Flows Are Rotating

    On June 1, HYPE-linked products attracted $1.28M in net inflows while spot Bitcoin and Ether ETFs both saw heavy outflows. That is a small number in absolute terms, but the relative signal matters. Capital is starting to look past the majors for productive crypto assets with actual revenue.

    4. Coinbase USDC Deal

    Coinbase took over as the official Aligned Quote Asset deployer for USDC on Hyperliquid earlier this year. That partnership locks in the USDC reserve base that powers the buybacks. The native USDH stablecoin from Native Markets is being wound down, but the Coinbase deal more than replaces it. The buyback engine is now backed by the deepest, most liquid dollar reserve in crypto.

    The Bear Case for HYPE

    The bull case is strong. The bear case is real too.

    1. The FDV Problem

    HYPE has a massive fully diluted valuation overhang. Monthly contributor unlocks of 9.92M tokens equate to roughly $560M of supply hitting the float every month at current prices. The buybacks are real, but they need to keep pace with the unlocks. If volume drops 40% in a broader risk-off move, the math flips bearish quickly.

    2. Macro Conditions Are Tight

    The crypto Fear and Greed Index sits at 12 right now, which is “extreme fear” territory. Bitcoin is trading at $63K, off its recent highs. The total crypto market cap is at $2.25T. If macro keeps deteriorating, HYPE will not escape the gravity, no matter how good the cash flow is.

    3. Concentrated Exchange Risk

    The entire HYPE thesis depends on Hyperliquid the exchange staying dominant in perpetuals. dYdX, Aevo, and a half-dozen other competitors are not going away. Any sustained loss of market share would cut directly into the fee revenue that powers the buybacks.

    4. Regulatory Tail Risk

    A fully on-chain perpetuals venue is exactly the kind of product U.S. regulators love to hate. Kalshi getting approval for HYPE perps is bullish if it happens. If the CFTC blocks it, or worse, takes a broader enforcement stance against the protocol itself, the entire thesis takes damage.

    HYPE Price Predictions by Timeframe

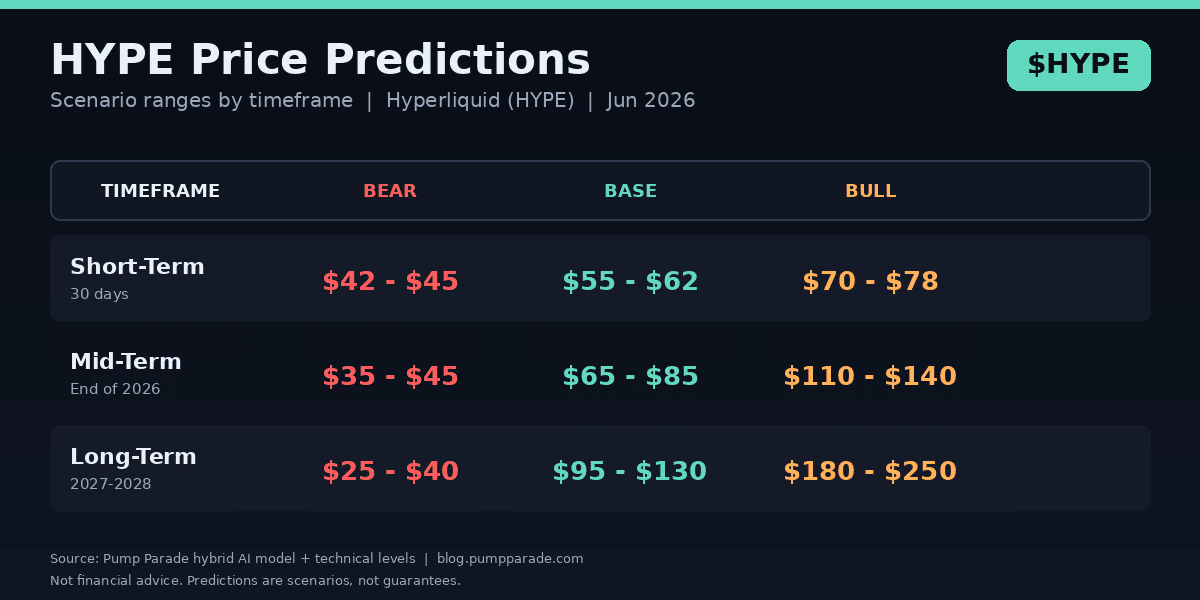
    These are scenario ranges based on our hybrid AI model, current technicals, and the catalysts above. They are not guarantees.

    Hyperliquid HYPE price prediction targets short term mid term long term

    Short-Term (Next 30 Days)

    • Bear target: $42-$45 (broader market shake-out, Kalshi rejection)
    • Base target: $55-$62 (consolidation, modest rebound)
    • Bull target: $70-$78 (Kalshi approval, ATH retest)

    Our model assigns roughly a 55% probability that HYPE finishes July in the $55-$72 range.

    Mid-Term (6 Months, End of 2026)

    • Bear target: $35-$45
    • Base target: $65-$85
    • Bull target: $110-$140

    The base case assumes volumes hold above $1B/day and the buyback math continues to absorb unlock pressure. Arthur Hayes has publicly called for $150 by August 2026. That is the very upper edge of our bull case, and requires both Kalshi approval and a broader risk-on rally.

    Long-Term (2027-2028)

    • Bear target: $25-$40
    • Base target: $95-$130
    • Bull target: $180-$250

    The long-term thesis comes down to one question: does Hyperliquid become the default venue for on-chain derivatives the way Uniswap became the default venue for spot DEX trading? If yes, HYPE has triple-digit potential. If no, the unlocks will grind the price down regardless of buybacks.

    What to Watch

    Three things will determine which scenario plays out:

    1. The Kalshi filing decision. Approval is the cleanest near-term bullish catalyst. Rejection would cap upside at the recent ATH for months.
    2. Weekly volume trend. Sustained $1B+ daily volumes keep the buyback engine running hot. Drops below $600M would be the first real warning sign.
    3. The $50 level. This is the line that decides whether the current pullback is a healthy reset or the start of something worse. Hold $50, the bull case stays intact. Lose $50 with conviction, and we reassess.

    For comparison on how other layer-1 plays are setting up, see our recent breakdown of Jupiter vs 1inch DEX aggregator economics. The fee-capture thesis there mirrors what makes HYPE interesting here.

    The Bottom Line

    HYPE is one of the few crypto tokens with a real cash flow story attached. The buyback flywheel is not theoretical, it is running, and the Coinbase USDC deal cements the dollar base that powers it. The Kalshi filing adds a clean near-term catalyst.

    But the FDV math is real, the monthly unlocks are large, and the broader market is in extreme fear. A token at $56 with a $45B market cap is not a small bet. The risk-reward favors the long side if you believe in the on-chain derivatives thesis, but position sizing matters more than usual here.

    The smart play is to watch the $50 level, the Kalshi decision, and the volume trend. The setup is interesting. The conviction comes from the data, not the noise.

    Disclaimer: This article is for informational and educational purposes only and should not be construed as financial, investment, or trading advice. Cryptocurrency markets are highly volatile, and past performance does not guarantee future results. The price predictions and analyses presented here are based on AI models, technical indicators, and available data at the time of writing, they are not guarantees. Always conduct your own research (DYOR) and consult with a qualified financial advisor before making any investment decisions. Pump Parade and its authors do not assume liability for financial losses incurred based on information provided in this article.

    Jupiter vs 1inch: Best DEX Aggregator 2026

    0

    Jupiter vs 1inch DEX aggregator 2026 hero

    If you’ve ever swapped tokens on-chain and wondered whether you actually got a fair price, you’ve already met the problem that DEX aggregators were built to solve. They scan dozens of pools across multiple decentralized exchanges, split your order, and route it for the best execution. Two names dominate that category in 2026: Jupiter, the undisputed king of Solana, and 1inch, the long-running heavyweight of Ethereum and EVM chains. Both have evolved far beyond simple swap routers. So which one should you actually use this year?

    This in-depth comparison breaks down fees, supported chains, MEV protection, UX, security, and real volume data so you can pick the right aggregator for your wallet, your size, and your chain.

    Quick Verdict (TL;DR)

    • Best for Solana traders: Jupiter wins by a mile. Lowest all-in cost, deepest Solana liquidity, and a full DeFi superapp around the swap router.
    • Best for EVM users and large size: 1inch still has the deepest Ethereum and L2 liquidity, plus Fusion mode that makes swaps gasless and MEV-resistant.
    • Cross-chain power user: 1inch added native Solana support in 2025, so it’s the more flexible single dashboard if you trade across ecosystems.
    • Lowest sticker fee: 1inch dApp charges 0% protocol fee. Jupiter Ultra charges 5 to 10 bps. But total cost depends on chain gas, slippage, and MEV, not just the headline fee.

    Verdict: Jupiter for Solana. 1inch for everywhere else. If forced to pick one tool for 2026, Jupiter has the stronger product velocity and the cheaper overall execution, but only if you live on Solana.

    Product Overviews

    Jupiter: Solana’s DeFi Superapp

    Jupiter Exchange Solana DEX aggregator interface

    Jupiter launched in October 2021 as a humble swap router and has since grown into the most important application on Solana. It handles roughly 95% of all aggregator volume on the network and well over half of total Solana DEX volume. Cumulative aggregator volume has now crossed $1.228 trillion.

    What used to be a single swap page is now a full DeFi stack: Ultra mode aggregation, limit orders, DCA and value averaging, perpetuals with leverage up to 250x on select pairs, a lending market (Jupiter Lend), liquid staking (JupSOL), a native stablecoin (JupUSD), and integrated prediction markets via a Polymarket partnership that went live in February 2026. Combined annualized revenue across these surfaces sits near $57M, with TVL across the broader ecosystem in the multi-billion range when you add Jupiter Lend, JupSOL, and the perps exchange together.

    For the average trader, the key piece is the swap interface at jup.ag, which routes orders across every meaningful Solana DEX including Raydium, Orca, Meteora, Phoenix, Lifinity, and dozens more.

    1inch: The EVM Aggregator Standard

    1inch DEX aggregator interface

    1inch launched in 2019 and has spent six years building what might be the most battle-tested aggregator stack in crypto. By 2026 it has processed over $1 trillion in cumulative volume across Ethereum, BNB Chain, Polygon, Arbitrum, Optimism, Base, Gnosis, and several more, plus a fresh native Solana integration that lets users swap between Solana and EVM chains without using a separate bridge.

    The product surface is broad: the classic Aggregation Protocol (Pathfinder), Fusion (intent-based gasless swaps), Fusion+ (cross-chain intents), a Limit Order Protocol that powers conditional and TWAP orders, a self-custodial mobile wallet, a portfolio tracker, and 1INCH-token-governed parameters.

    Volume has cooled in 2026. The flagship Aggregation Protocol saw a 60.3% volume decline between December 2025 and March 2026, and 1inch slipped from the #1 to #4 aggregator by market share over the same window. Fusion has held up better, down only 26.5%, which is why 1inch is leaning hard into the intent-based mode.

    Features Deep Dive

    Jupiter’s Ultra Mode

    Ultra is Jupiter’s flagship execution layer. Instead of a fixed routing algorithm, Ultra dynamically picks the best path across Solana pools and private market maker liquidity, then quotes a single all-in price. It also wraps in MEV Protect, which obfuscates orders so sandwich bots can’t see them in the public mempool. The user just clicks swap and pays a small dynamic fee, typically 5 to 10 basis points of the trade.

    Beyond Ultra, Jupiter has Limit Order V2 (with front-running protection), DCA, Value Averaging, perps, and a developer API that powers a huge chunk of Solana frontends. If you’ve used Phantom’s in-wallet swap, you’ve used Jupiter underneath.

    1inch’s Pathfinder and Fusion

    Pathfinder is the original 1inch routing algorithm. It splits trades across multiple AMMs and PMM venues to minimize price impact, and is what 1inch is famous for. The 1inch dApp itself charges 0% protocol fee, so you pay only the underlying LP fees and gas.

    Fusion takes a different approach. You sign an off-chain order, professional resolvers compete to fill it, and the winning resolver pays the gas on your behalf. This makes Fusion effectively gasless for the user and provides implicit MEV protection because the order is filled atomically against the resolver’s inventory. The trade-off: resolvers bake a small spread into the quoted output (usually a few basis points), so the “0% fee” headline is technically accurate but not the full story. Fusion+ extends the model to cross-chain swaps across 13+ networks in a single signed intent.

    Fees and Pricing Comparison

    Headline fees can mislead. What matters for traders is total cost: protocol fee + LP fee + gas + slippage + MEV loss. Here is how the two stack up.

    Jupiter (Solana)

    • Protocol fee: 5 to 10 bps on Ultra. 0% on legacy routing.
    • LP fees: Vary by pool, typically 25 to 30 bps on Raydium/Orca v2 pools.
    • Gas: Fractions of a cent on Solana. Effectively free.
    • MEV cost: Near zero with Ultra’s MEV Protect.

    1inch (Ethereum + EVM)

    • Protocol fee: 0% on the dApp.
    • LP fees: 5 to 30 bps depending on venue.
    • Gas: Variable. Ethereum mainnet swaps still cost real money (often $5 to $30+). L2s like Base and Arbitrum bring this down to cents.
    • Fusion spread: A few bps baked into the resolver quote. Gas is paid by the resolver, not you.
    • MEV cost: Material on classic Aggregation Protocol if you don’t use Fusion. Negligible on Fusion.

    In practice, Jupiter is almost always cheaper for trades under $10,000 because Solana’s base layer is so cheap. For very large EVM trades where you need to minimize slippage on illiquid pairs, 1inch’s deeper aggregated liquidity can sometimes win even after accounting for gas.

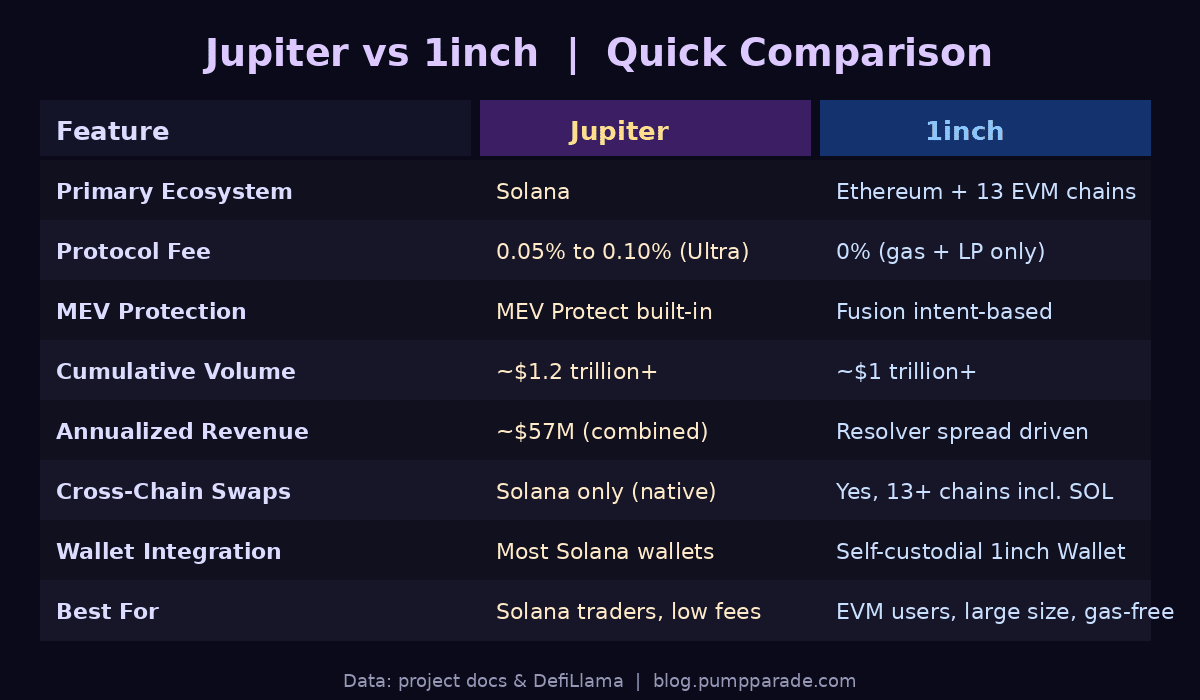
    Comparison Table

    Jupiter vs 1inch DEX aggregator comparison table 2026

    Security and Trust

    Both protocols have track records measured in years and trillions of cumulative volume, which is the strongest security signal you can get in DeFi. 1inch’s smart contracts have been audited by multiple top firms (OpenZeppelin, ABDK, MixBytes, Hacken) and have a public bug bounty. The protocol has never suffered a contract-level exploit on its core router.

    Jupiter has been audited by OtterSec and Halborn across its various surfaces. The aggregator itself has run since 2021 without a protocol-level hack. Its newer products (Perps, Lend, JupUSD) have shorter track records but use audited code and have bounties in place.

    One nuance worth flagging: both are non-custodial. You connect a wallet and sign transactions. Neither service can move your funds, freeze your account, or KYC you. That’s the entire point of DEXs. Counterparty risk is limited to smart contract risk on the routing contracts themselves, plus the underlying liquidity venues.

    User Experience

    Jupiter wins on speed. Solana finality is around 400ms, swaps confirm in roughly a second, and the UI is the cleanest in DeFi. It works with every major Solana wallet (Phantom, Solflare, Backpack, Glow) and has a slick mobile experience.

    1inch is heavier but more feature-rich. The dApp at app.1inch.io handles multiple chains in one interface, and the 1inch Wallet (iOS and Android) is one of the better self-custodial mobile wallets if you live in the EVM world. The downside is that switching between chains and bridging assets still requires more clicks than Jupiter’s single-chain simplicity, and Ethereum gas spikes can make small trades feel painful.

    Newcomers will probably find Jupiter easier. Power users will appreciate 1inch’s deeper feature set, especially Fusion+ for cross-chain.

    Pros and Cons

    Jupiter: Pros

    • Cheapest all-in execution on Solana, period.
    • Ultra mode + MEV Protect handle complexity for you.
    • Full DeFi superapp (perps, lending, DCA, prediction markets).
    • Used by virtually every Solana frontend, so liquidity is unmatched on the chain.
    • Sub-second finality and near-zero gas.

    Jupiter: Cons

    • Solana only. No EVM swaps.
    • 5 to 10 bps Ultra fee adds up for high-frequency strategies vs 0% legacy mode.
    • JUP token volatility can make tokenomics noisy.
    • Some newer products (JupUSD, prediction markets) are still maturing.

    1inch: Pros

    • 0% protocol fee on the dApp.
    • Fusion mode is effectively gasless and resists MEV.
    • Supports 13+ chains including Solana via cross-chain intents.
    • Mature, audited stack with a six-year track record.
    • Strong portfolio tracker and self-custodial wallet bundled in.

    1inch: Cons

    • Ethereum gas still hurts on small trades.
    • Aggregation Protocol volume down 60% in Q1 2026; market share slipping.
    • Fusion resolver spread is real cost not always obvious in the UI.
    • More complex UX for newcomers.

    Verdict and Use-Case Recommendations

    There is no single right answer. The two products optimize for different worlds, and the smart move is to use both depending on the chain.

    • Solana traders of any size: Use Jupiter. Ultra mode is the cheapest, fastest path to good execution on Solana, and the surrounding superapp gives you everything else you need without leaving the tab.
    • EVM users with small to medium trades on L2s: Use 1inch Fusion. Gasless, MEV-resistant, and the resolver spread is competitive with anything else on EVM.
    • Large EVM swaps ($10k+): Use 1inch classic Aggregation Protocol. Deepest liquidity, cleanest price impact.
    • Cross-chain power users: 1inch Fusion+ is the cleanest single-signature cross-chain experience available right now, including Solana <> EVM.
    • DeFi power user who wants one app: Jupiter, if you’re willing to commit to Solana as your home chain.

    Rating: Jupiter 4.7/5. 1inch 4.4/5. Jupiter takes the slight edge in 2026 because of product velocity, lower friction, and dominant ecosystem position. 1inch remains the better tool the moment you leave Solana.

    FAQ

    Is Jupiter better than 1inch?

    On Solana, yes. Jupiter has deeper liquidity, lower gas, and a more polished single-app experience. On EVM, 1inch is better because Jupiter does not operate there.

    Does 1inch work on Solana?

    Yes, as of 2025 1inch supports native Solana swaps and cross-chain intents between Solana and EVM via Fusion+. However, for Solana-only swaps, Jupiter’s native routing is still tighter.

    Which has lower fees, Jupiter or 1inch?

    1inch has a lower headline protocol fee (0% vs Jupiter’s 5 to 10 bps on Ultra). But once you factor in Ethereum gas, Jupiter is usually cheaper for trades under roughly $10,000. On L2s the gap narrows.

    Are Jupiter and 1inch safe?

    Both are non-custodial smart contract protocols with multiple audits, public bug bounties, and multi-year track records. Neither has suffered a router-level exploit. Standard DeFi caveats apply: smart contract risk and liquidity venue risk are non-zero.

    What is the difference between Jupiter Ultra and 1inch Fusion?

    Both are MEV-resistant execution modes, but they work differently. Ultra dynamically routes across Solana liquidity with built-in MEV protection and charges a small explicit fee. Fusion uses off-chain intents and competing resolvers who pay gas on your behalf and bake their spread into the price. Different mechanics, similar end goal: better execution without surprise sandwich attacks.

    Related Reading on Pump Parade

    Data sources: project documentation, DefiLlama (Jupiter Aggregator), and CoinGecko market data, as of June 2026. This article is for informational purposes only and does not constitute financial advice.

    Ethereum (ETH) Price Prediction 2026: Glamsterdam Bet

    0
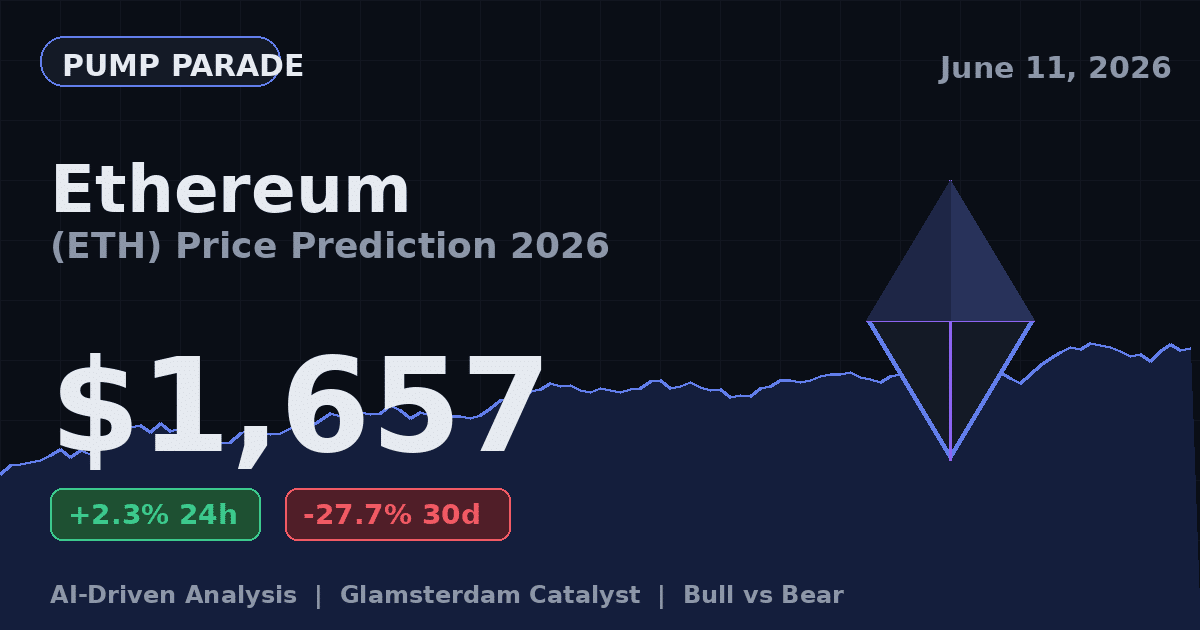
    Ethereum ETH price prediction 2026 with current price 1657 and bullish chart

    Ethereum is trading at $1,657 at time of writing. That price tells two stories at once. The bullish read: ETH is up 2.3% on the day and finally finding bids near a multi-year support shelf. The bearish read: it is down 27.7% in the last 30 days and sits 66.5% below its August 2025 all-time high of $4,946.

    Most price prediction posts skip the second sentence. We are not going to do that. ETH has had a brutal cycle relative to BTC, and any honest 2026 forecast has to start there.

    The setup matters because the next four months are loaded. The Glamsterdam upgrade is moving through devnet. Spot ETH ETFs are still in net outflow mode, but staked-ETF products from BlackRock are quietly building AUM. Around 30% of ETH supply is now locked in validators. So the question is not whether things are bad. They are. The question is whether the fundamentals catching up to the price will create the next leg, or whether ETH spends another six months range-bound below $2,000.

    Let us look at the numbers.

    Ethereum Price Today: A Quick Snapshot

    Here is the on-chain and market picture as of June 11, 2026:

    • Price: $1,657 (per CoinGecko)
    • 24h change: +2.3%
    • 7d change: -6.5%
    • 30d change: -27.7%
    • 1y change: -40.2%
    • Market cap: ~$200 billion
    • 24h volume: ~$12.1 billion
    • Circulating supply: 120.7 million ETH
    • All-time high: $4,946 (Aug 24, 2025)

    ETH is the second-largest crypto by market cap. That position is not in danger, but the gap to Bitcoin has widened sharply. BTC dominance recently pushed above 58%. That is the highest reading since early 2021. For ETH bulls, a turn in that dominance chart is the single most important variable to watch.

    For a related read on where Bitcoin sits in this cycle, see our Bitcoin price prediction with the Reserve catalyst.

    Why ETH Has Been Underperforming

    Three things have driven the drawdown.

    First, ETF flows reversed. U.S. spot Ethereum ETFs have pulled in roughly $11.6 billion in cumulative net inflows since launch. But the recent flow tape has flipped. Weekly outflows hit around $241 million in early June. That is not catastrophic in dollar terms, but it changes the marginal bid story.

    Second, L2 scaling cannibalized fees. Layer-2 rollups now do most of the work that used to drive base-layer fee burn. That made the network cheaper to use, which is good for users. It also made ETH less deflationary, which is bad for the simple “ultrasound money” thesis. The math is what it is.

    Third, macro pressure. A risk-off rotation hit altcoins harder than BTC. ETH wears that rotation more than other large caps because it sits at the top of the L1/L2 stack. When traders de-risk, they often sell ETH first to keep BTC exposure.

    The bear case is real. So is the catalyst stack on the other side.

    The Glamsterdam Catalyst

    Glamsterdam is Ethereum’s next hard fork. It is currently targeting mainnet activation in Q3 2026, with public testnet activations on Holesky and Sepolia in the months before. Developers have stressed the date can slip if testnet validation runs into issues. As of April 2026 the Ethereum Foundation was transitioning to Devnet-5 after testing three of the headline EIPs on Devnet-4.

    Two upgrades carry most of the weight.

    EIP-7732 (Enshrined Proposer-Builder Separation, or ePBS) moves block-building into the protocol itself. In plain terms, it makes the validator job simpler and reduces the leverage that specialist builders have over MEV (the value extracted from ordering transactions). If ePBS lands cleanly, solo staking gets more competitive with the big pools. That is good for decentralization, and arguably good for the long-term valuation case.

    EIP-7928 (Block-Level Access Lists) makes blocks easier for nodes to process in parallel. The intent is a faster effective slot time and lower confirmation latency. Think of it as a behind-the-scenes performance patch that lets the chain handle more without a hard gas-limit bump.

    Neither of these is a clean meme catalyst. They are infrastructure changes that institutional stakers care about deeply and that retail traders mostly ignore until the price moves. That is exactly the kind of setup our AI model tends to underweight in the short term and overweight in the medium term.

    Technical Analysis: Levels That Matter

    Three levels are doing the heavy lifting right now.

    Support at $1,500 to $1,550. This zone has held three retests since late April. A clean break below it opens up the $1,250 area, which is the next high-volume node on the historical profile.

    Pivot at $1,800. Reclaiming this level on a daily close would put the 50-day moving average back in play. RSI (Relative Strength Index) on the daily is at 38, which is the upper end of the oversold zone. A push above $1,800 would likely flip momentum scoring positive on most standard models.

    Resistance at $2,150 to $2,200. This is the heaviest resistance shelf on the chart. It sits at the 200-day moving average and the underside of the channel that broke down in March. ETH has rejected from this band twice. A third test on rising volume is the level to watch.

    For traders, the framework is straightforward. Above $1,800 on a daily close, the bias shifts to neutral. Above $2,200 on rising volume, the bias shifts to bullish. Below $1,500, the structure breaks and bear targets activate.

    The Bull Case for ETH

    Here is what has to go right for the upside scenario.

    • Glamsterdam lands on schedule. A clean Q3 activation shifts narrative back to L1 fundamentals. Historically, post-upgrade ETH has outperformed BTC by 8% to 14% in the 60 days after merge events.
    • ETF flows turn. A reversal from net outflow to net inflow of even $200 million per week is enough to absorb most spot supply at current prices.
    • Staking yield narrative. BlackRock’s ETHB and similar staked ETH products distribute roughly 82% of staking rewards to investors. As tradfi yields compress, a 2% to 4% on-chain yield with optional staking exposure becomes more attractive.
    • BTC dominance peaks. A roll-over from the 58%+ dominance zone has historically triggered an altcoin rotation. ETH is the natural first stop.

    If three of these four play out, the path back to $3,000 by year-end is on the table. A stretch case puts ETH at $3,500 to $4,000 if ETF flows accelerate alongside a confirmed Glamsterdam activation.

    The Bear Case for ETH

    The flip side is just as concrete.

    • Glamsterdam slips into 2027. If devnet issues push activation past Q4 2026, the catalyst stack thins out. ETH risks another six months of grind.
    • ETF outflows accelerate. A sustained $400M+ weekly outflow tape would likely break the $1,500 support and target the $1,250 area.
    • L1 narrative shifts to Solana or modular chains. Capital chasing fee revenue is increasingly going to alt-L1s. If that flow does not reverse, ETH’s relative dominance keeps slipping.
    • Macro deterioration. A risk-off shock would hit ETH harder than BTC. The 0.85+ correlation to NASDAQ tech has not gone away.

    The downside scenario is not a vaporization. It is a slow grind to $1,200 and a longer wait for the next leg. Painful, but not terminal.

    ETH Price Prediction 2026 to 2028

    Our hybrid AI model blends technical signals, on-chain flows, ETF flow data, staking participation, and macro proxies. Here is what it currently outputs across three time horizons. These are probability-weighted ranges, not single-point forecasts.

    Ethereum ETH price prediction table showing bear base bull targets for short mid and long term
    • Short-term (30 days): Bear $1,400 / Base $1,750 / Bull $2,000. The base case assumes ETF outflows stabilize and ETH holds the $1,550 support.
    • Mid-term (6 months): Bear $1,600 / Base $2,400 / Bull $3,100. The base case assumes Glamsterdam activates on schedule and BTC dominance rolls over.
    • Long-term (2027-2028): Bear $1,800 / Base $3,800 / Bull $6,500. The base case assumes Glamsterdam delivers on staking and L1 economics, and ETF AUM crosses $25 billion.

    The model assigns a 58% probability to a $2,400 to $3,100 print at some point in the next six months. That is a meaningful tilt, but it is not a layup. A 22% probability sits on the bear path.

    For independent reference on macro and on-chain data, the CoinGecko Ethereum page tracks the live numbers our model ingests.

    What to Watch in the Next 90 Days

    Three specific signals will tell you which scenario is playing out.

    1. Holesky and Sepolia activations. If both testnets activate Glamsterdam cleanly by mid-July, the Q3 mainnet date is on track. Slippage on either pushes the catalyst.
    2. ETF weekly flow tape. Watch for two consecutive weeks of positive net inflows. That has historically been the inflection point.
    3. BTC dominance. A daily close below 56% would be the cleanest signal that altcoin rotation has started.

    You do not need to predict the outcome. You need to know which signal flips first.

    Bottom Line

    ETH at $1,657 is a setup with real risk and a real catalyst stack. The 67% drawdown from ATH is severe, but the Glamsterdam upgrade and the staked-ETF flywheel are both still developing. The probability favors a recovery toward $2,400 to $3,100 within six months, but the bear path to $1,250 is live until ETH reclaims $1,800 on a daily close.

    The smart move is not to call a single target. It is to size around the signals above and let the chart tell you when the regime has changed.

    Disclaimer: This article is for informational and educational purposes only and should not be construed as financial, investment, or trading advice. Cryptocurrency markets are highly volatile, and past performance does not guarantee future results. The price predictions and analyses presented here are based on AI models, technical indicators, and available data at the time of writing, they are not guarantees. Always conduct your own research (DYOR) and consult with a qualified financial advisor before making any investment decisions. Pump Parade and its authors do not assume liability for financial losses incurred based on information provided in this article.

    XRP (XRP) Price Prediction 2026: CLARITY Vote Test

    0

    XRP is trading near $1.11 at the time of writing. The token is down about 4.4% in the last 24 hours, and the market cap sits at $68.7 billion. Daily volume is healthy at $1.77 billion, but the price action looks tense. Buyers are defending the 200-day moving average. Sellers keep capping rallies near $1.22.

    The catalyst that matters most this month is political, not technical. The Senate placed the CLARITY Act on its legislative calendar on June 1. If the full Senate passes it before the August recess, XRP gets clean legal status as a digital commodity. That single legal change could reset the price ceiling for the rest of 2026.

    XRP price, market cap and 24h change June 10 2026

    This article breaks down where XRP stands, what the chart is telling us, and what our model expects across three timeframes. We will give you both the bull case and the bear case, so you can size your own conviction.

    XRP at a Glance: Where the Token Stands Today

    Ripple Labs created XRP as a settlement token for cross-border payments. The XRP Ledger is fast, cheap, and built for institutions. That use case has not changed. What has changed is the legal environment around it.

    The 2023 court ruling already separated programmatic XRP sales from securities law. The CLARITY Act, if passed, would lock that in by statute. Ripple has spent the last two years building rails for tokenized assets and stablecoin settlement on the XRP Ledger. Spot XRP ETFs launched in November 2025 and have pulled in $1.43 billion in cumulative net inflows since then.

    Key metrics, current as of June 10, 2026:

    • Price: $1.11
    • Market cap: $68.7 billion (ranked #6)
    • 24-hour volume: $1.77 billion
    • 24-hour change: -4.4%
    • Cumulative spot ETF inflows since November 2025: $1.43 billion
    • May 2026 ETF net subscriptions: $131.94 million (monthly record)

    You can confirm the live price and volume via CoinGecko.

    The CLARITY Act Catalyst: Why This Vote Is Different

    The Digital Asset Market Clarity Act split the regulatory job between the SEC and the CFTC. Tokens that act like commodities get CFTC oversight. That includes XRP. The bill cleared the Senate Banking Committee on May 14 with a 15 to 9 bipartisan vote. The Senate placed it on the General Orders calendar on June 1.

    Three things still need to happen before a floor vote. First, the Banking Committee version has to merge with the Senate Agriculture Committee’s Digital Commodity Intermediaries Act. Second, Democratic concerns about an ethics provision tied to the president’s crypto holdings need a fix. Third, the Senate needs to find floor time before the August recess.

    The White House has set a soft July 4 deadline. Ripple and over 200 crypto firms are pressing senators to schedule the vote. The CLARITY Act needs 60 votes to clear a filibuster. The math is tight but not impossible.

    For more on how the CLARITY Act could move altcoin prices, see our breakdown of Hedera’s setup under the same catalyst.

    Why the Vote Matters for the Price

    Scenario-weighted models from analysts cluster the median XRP target near $1.46 with no CLARITY passage. With the bill signed into law, that median moves to $1.56 and tail-case scenarios extend toward $2.20. The bill removes the biggest legal cloud over XRP. That alone should compress the discount investors apply to the token.

    Technical Analysis: What the Chart Says Now

    XRP has spent the last six weeks in a range. The floor is the 200-day moving average near $1.12. The ceiling is the $1.22 to $1.25 zone. Price is currently testing the floor.

    The relevant levels:

    • Major support: $1.11 (200-day MA), then $0.92 if that breaks
    • First resistance: $1.22 (recent range high)
    • Second resistance: $1.53 (March 2026 swing high)
    • Third resistance: $1.71 to $1.83 (extension zone)

    The 14-day RSI sits at 74 on the weekly, which is overbought territory. That sounds bearish, but in trending markets a high RSI often signals strength, not exhaustion. The 50-day moving average has crossed above the 200-day. Traders call this a golden cross. It does not guarantee a rally, but it is the kind of setup that often precedes one.

    Translation: the market is coiled. It needs a catalyst to pick a direction. The CLARITY Act vote is the most likely trigger.

    The Bull Case for XRP

    If the CLARITY Act passes before August, the path to $1.80 opens fast. Spot ETFs would likely see another wave of inflows as institutional allocators clear compliance hurdles. The May 2026 ETF inflow record of $131.94 million could double in a strong follow-through month.

    Ripple’s stablecoin RLUSD has been growing on the XRP Ledger. Tokenized real-world asset projects are also picking the XRPL for settlement rails. If both trends accelerate, on-chain activity rises and the deflationary fee burn picks up.

    Bull case price targets:

    • 30 days: $1.85 if CLARITY passes the floor vote
    • 6 months: $3.20 if ETF inflows compound and regulatory tailwinds persist
    • 2027 to 2028: $6.50 in a full bull cycle with sustained institutional adoption

    The Bear Case for XRP

    The bear case starts with what is already happening. Spot XRP ETFs posted their first net outflow in over a month on June 3, with Bitwise alone shedding $4.06 million. Franklin’s XRPZ was the only fund to attract new money the next day, at $3.83 million, well below the May pace. The momentum that drove XRP from $0.95 to $1.55 earlier this spring has cooled.

    Ripple is also unlocking 1 billion XRP from escrow this month. Most of those tokens get re-locked, but the supply optics are bearish if traders fixate on the headlines. A failed Senate vote would be the worst-case macro event. The token could give back the entire 2026 rally if CLARITY misses the August deadline and crypto-skeptical senators win the news cycle.

    Bear case price targets:

    • 30 days: $0.85 if the 200-day MA breaks and CLARITY momentum stalls
    • 6 months: $1.05 in a sideways grind with no political progress
    • 2027 to 2028: $1.50 in a macro recession scenario

    Pump Parade AI Price Prediction Summary

    Our hybrid model weighs technical structure, on-chain activity, ETF flows, and regulatory probability. Here is the current output, broken down by timeframe.

    XRP price prediction targets table: bear, base, bull cases by timeframe

    The base case for the next 30 days is $1.30, with a probability of about 48%. The base case for the next 6 months is $2.10, with 42% probability. The long-term base case for 2027 to 2028 is $3.80, with 38% probability.

    The key swing factor in every timeframe is the CLARITY Act. If it passes, our model lifts the base case by 25 to 35%. If it stalls, the median drifts toward the bear scenario.

    What to Watch in the Next 30 Days

    Three things will tell you which scenario is playing out:

    1. The Senate floor schedule. If CLARITY gets a vote date before July 4, that is a strong bullish signal. If the calendar stays empty, expect rangebound price action.
    2. ETF daily flows. Watch the Bitwise and Franklin XRP ETFs. A return to $20 million plus in daily net inflows would confirm that institutions are leaning in.
    3. The 200-day moving average at $1.12. Holds here, and the base case stays intact. A weekly close below $1.05 invalidates the bullish technical setup.

    The real question is not whether XRP can go higher. It is whether the political timeline cooperates. Position sizing should reflect that uncertainty. Smaller bets, wider time horizons, and clear invalidation levels beat heroic conviction in this kind of setup.

    Final Take

    XRP is one of the most asymmetric setups in the top 10 right now. The downside if CLARITY fails is real, but bounded by ETF demand and the 200-day MA. The upside if the bill passes is much larger, with $2 to $3 in play before year-end. We are watching the Senate calendar more than the chart this month.

    If you want a framework for trading catalyst-driven setups, the basic rule is to scale in before the catalyst and scale out into the news, not after. Patience pays more than precision in trades like this.

    Disclaimer: This article is for informational and educational purposes only and should not be construed as financial, investment, or trading advice. Cryptocurrency markets are highly volatile, and past performance does not guarantee future results. The price predictions and analyses presented here are based on AI models, technical indicators, and available data at the time of writing, they are not guarantees. Always conduct your own research (DYOR) and consult with a qualified financial advisor before making any investment decisions. Pump Parade and its authors do not assume liability for financial losses incurred based on information provided in this article.

    Aave Review 2026: Fees, Features & Verdict

    0

    If you have spent any time in DeFi over the past five years, you already know Aave. It is the largest decentralized money market in crypto, the protocol that essentially defined on-chain lending, and the place where billions of dollars in stablecoins and blue-chip collateral sit earning yield right now. But 2026 has been a rough year for DeFi blue chips. With the AAVE token down more than 35% over the last 30 days and lending demand cooling across the market, traders are asking whether Aave is still the safest place to park capital, or whether smaller competitors have finally caught up.

    This Aave review covers what the protocol actually offers in 2026, how its fees and yields compare, what makes its risk framework different, and whether depositors and borrowers should still be using it today.

    TL;DR Verdict

    Rating: 4.4 / 5

    Aave remains the most battle-tested lending protocol in crypto. Roughly $11.8 billion in supplied liquidity sits across 14+ chains, against about $9.6 billion in active borrows, which means the order book is deep enough to absorb almost any retail or institutional position you can throw at it. The v3 architecture, isolation mode, e-mode, and Portal cross-chain plumbing give Aave a risk and capital efficiency stack that no other lender has matched at this scale. The native GHO stablecoin and the Umbrella safety module add upside that previous versions did not have. The downside is that yields on stables have compressed to single digits in the current cycle, the AAVE token has badly underperformed BTC and ETH year to date, and the protocol still carries the complexity of years of upgrades. For depositors who want size and security over the highest possible APY, Aave is still the default. For yield hunters, you can do better on smaller forks if you accept the risk.

    Aave Review 2026 hero image
    Aave is still the deepest lending pool in DeFi heading into the second half of 2026.

    What Is Aave?

    Aave is a decentralized, non-custodial liquidity protocol. Users supply assets to shared pools and earn variable interest. Other users post collateral and borrow against it, paying interest that flows back to suppliers. There is no order book, no counterparty match, no centralized middle layer. Everything settles on smart contracts and interest accrues per block.

    The protocol launched in 2017 as ETHLend, rebranded to Aave (Finnish for “ghost”) in 2018, and shipped its first pool-based lending product in early 2020. The current generation, Aave v3, went live in March 2022 and has been the dominant version ever since. By June 2026 it had been deployed across Ethereum mainnet, Base, Arbitrum, Optimism, Polygon, Avalanche, BNB Chain, Plasma, MegaETH, Scroll, Linea, Sonic, Gnosis, Metis, and several other EVM chains.

    You can use the official Aave app directly from a wallet like Phantom, Rabby, or Ledger, or you can interact with the smart contracts through any of dozens of front ends and aggregators. We covered the broader wallet stack in our MetaMask vs Rabby Wallet comparison if you need a refresher on the EVM tooling side.

    Aave Key Stats at a Glance

    Aave protocol key stats infographic for 2026
    Source: DefiLlama, CoinGecko, Aave protocol disclosures (June 2026).

    Two notes on these figures. The $11.8B supplied number reflects the sum of TVL across all live v3 deployments. Net deposits available for new borrowers sit at roughly $2.2 billion once you back out current debt. AAVE token data is from the open market and is volatile, treat it as a snapshot, not a fundamental anchor.

    Features Deep Dive

    Multi-Chain v3 Lending Pools

    The core product is the variable rate lending pool. Each market on Aave v3 lists a curated set of assets, sets a loan-to-value (LTV) ratio per asset, and uses a kinked utilization curve to set rates. When pool utilization is low, borrowing is cheap. When it rises above the optimal point (usually 80% to 90%), the borrow rate ramps up sharply, which pulls in suppliers and pushes some borrowers to repay. The mechanism is decade-old at this point and has weathered multiple liquidation cascades without socializing losses to depositors.

    Isolation Mode and E-Mode

    Two v3-only features deserve attention. Isolation mode lets the DAO list new or riskier assets with a debt ceiling so that any bad debt is contained to that asset alone. E-mode (Efficiency Mode) lets users who only borrow correlated assets, such as stablecoins against stablecoins or ETH against staked ETH, push their LTV up to 93% or higher. For a stablecoin trader who wants to lever a basis trade or a staker who wants to loop into more yield, e-mode is the cheapest place in DeFi to do it.

    GHO, the Aave-Native Stablecoin

    GHO launched in 2023 and has grown into one of the largest decentralized stablecoins in the market. It is overcollateralized through Aave v3 facilitators, pays a fixed-rate borrow APY set by governance, and burns 100% of interest paid into the Aave DAO treasury. Stakers of AAVE in the safety module get a discount on their GHO borrow rate, which gives the token a real, measurable utility beyond pure governance.

    Portal and Cross-Chain Liquidity

    Portal is Aave’s native bridge layer, which lets aTokens move across chains by burning on one side and minting on the other. In practice this means a depositor on Ethereum can move liquidity to Base or Arbitrum without exiting their position, and arbitrageurs can keep rates in sync across deployments. It is one of the most underrated features in DeFi.

    Umbrella Safety Module

    The original safety module let AAVE holders stake their tokens as a backstop. In 2025, the DAO rolled out Umbrella, an upgraded version that lets individual asset suppliers (for example, USDC suppliers on Ethereum) stake their aTokens as their own market-specific insurance, earning extra yield in return. The model spreads risk more efficiently than the old single-asset stkAAVE backstop and is the closest thing DeFi has to a true insurance product at the protocol level.

    Flash Loans

    Aave invented the flash loan and still has the deepest one. A flash loan lets a developer borrow any amount of any listed asset for the duration of a single transaction, with no collateral, as long as the loan is repaid by the end of that transaction. The fee is 0.05%. Arbitrage bots, liquidators, and refinancers use Aave flash loans constantly, and they generate non-trivial revenue for the DAO without adding meaningful risk.

    Fees and Pricing

    Aave does not charge a flat trading fee like a DEX. Costs come in three places.

    Borrow interest. This is the headline cost. Variable rates are set algorithmically per asset based on pool utilization. Stablecoin borrow APYs typically sit in the 5% to 10% range in 2026, while ETH and BTC borrows run much lower, often under 3%. Stable-rate borrows have been deprecated on most markets in favor of variable-only.

    Reserve factor. A portion of the interest paid by borrowers, usually 10% to 25% depending on the asset, is routed to the DAO treasury rather than to suppliers. This is how the protocol funds itself.

    Liquidation penalty. If your health factor drops below 1, your position can be liquidated. Liquidators repay part of your debt in exchange for your collateral plus a bonus, usually 5% to 10%. Aave keeps a small slice of that bonus.

    Aave v3 interest rate snapshot
    Indicative borrow and supply rates on Aave v3 Ethereum (June 2026).

    Flash loans cost a flat 0.05% of the borrowed amount, paid in the same transaction. There are no deposit, withdrawal, or account fees of any kind. Gas is the user’s problem, which on Ethereum mainnet can be the biggest real-world cost of using the protocol for small positions, and is why most retail users are now defaulting to the Base, Arbitrum, or Polygon deployments.

    Security and Trust

    This is where Aave actually earns its premium valuation. The protocol has been live for six years across multiple chains and has never had a smart contract exploit that resulted in lender losses. There have been bugs, oracle issues on specific assets, and tail-risk liquidation cascades during market crashes (most notably the November 2022 CRV incident), but no event has impaired the senior deposit claim.

    The codebase has been audited by OpenZeppelin, Trail of Bits, Certora, ABDK, Peckshield, and others, with most audit reports linked from the official security page. Certora runs continuous formal verification on the v3 contracts, which catches a class of bugs that traditional audits miss.

    Aave protocol app interface
    The Aave v3 web app surfaces every market, asset, and yield in one dashboard.

    Governance is on-chain through the Aave DAO and AAVE token. Most parameter changes (interest rate curves, debt ceilings, listing new assets) flow through a forum proposal and a formal vote. That process is slower than what you get on smaller forks, but it has prevented the kind of unilateral, governance-rug behavior that has killed other lenders.

    User Experience

    The official Aave app is one of the cleanest UIs in DeFi. The dashboard shows your net worth, total supplied, total borrowed, health factor, and net APY in one screen. You can switch between markets (Ethereum, Base, Arbitrum, etc.) with a single dropdown. Each asset row shows supply APY, borrow APY, utilization, and your individual position. Risk parameters like LTV, liquidation threshold, and reserve factor are exposed in the details panel rather than hidden.

    Mobile support is solid through a web wrapper, and the protocol also works fine inside any wallet’s in-app browser. There is no native mobile app, which is a small but persistent friction for users who would rather not connect a wallet from a browser session.

    The one piece of UX that still frustrates newcomers is health factor management. Aave does a good job of warning you, but a leveraged loop across e-mode plus the Portal bridge is genuinely complex. New users should start with conservative LTVs and use a position monitor like DeBank or Zapper alongside the app.

    Pros and Cons

    Pros

    • Deepest liquidity in DeFi. $11.8B supplied means almost any size order fills without moving the rate curve materially.
    • Battle-tested security. Six years live across multiple chains with no exploit-driven depositor losses.
    • v3 features. Isolation mode, e-mode, and Portal are real capital-efficiency advantages that forks have struggled to copy correctly.
    • Native stablecoin. GHO gives the DAO recurring revenue and AAVE stakers a real yield kicker.
    • Multi-chain reach. 14+ live deployments mean you can stay on whichever chain has the cheapest gas for your size.
    • Transparent risk parameters. Every LTV, liquidation threshold, and reserve factor is visible on chain and discussed in public governance.

    Cons

    • Yields are middle of the pack. Supply APYs on stables sit in the 4% to 6% range. Smaller forks pay more for additional risk.
    • AAVE token has lagged. Down 35%+ over the last 30 days and still 90%+ below the 2021 ATH despite strong protocol fundamentals.
    • Governance is slow. New asset listings and parameter changes can take weeks.
    • Ethereum mainnet gas. Small positions on L1 are economically painful. Use Base or Arbitrum if you have less than $5,000 at stake.
    • Complexity ceiling. e-mode, Portal, GHO, Umbrella, and v3 risk parameters together are a lot to learn for a first-time user.

    Who Should Use Aave in 2026

    Aave is the right protocol for you if any of these describe your use case.

    Stablecoin yield with size. If you have six figures or more in USDC, USDT, or DAI, Aave is the safest place in DeFi to earn 4% to 6% with the option to add Umbrella staking on top. Smaller protocols can match or beat that yield but with materially more smart contract and depeg risk.

    Leveraged staking and basis trades. e-mode on the ETH/stETH or USDC/USDT pairs offers the cheapest leverage in DeFi for delta-neutral or directional positions in correlated assets.

    Borrowing against blue-chip collateral. If you want to hold spot ETH or BTC and borrow stables against them without selling, Aave’s variable borrow APYs on WETH and WBTC are usually under 3%, which is competitive with anywhere else on chain.

    GHO minters. Borrowing GHO at the AAVE-staker discount is one of the cheapest ways to mint a decentralized stablecoin in 2026.

    If you are primarily chasing the highest possible yield on small stablecoin balances, you may do better on smaller, newer lending protocols, with the obvious caveat that you are taking on more smart-contract risk for the additional basis points. Our earlier Kamino Finance review covers one of the better non-EVM alternatives if you want to compare a Solana-native lender.

    Verdict and Rating

    Final rating: 4.4 / 5.

    Aave in 2026 is what people mean when they talk about DeFi infrastructure. It is the lending venue you reach for when you actually need depth, when you care about your assets being there a year from now, and when you want governance and risk parameters to be visible rather than hidden in a multisig somewhere. The flip side is that it is no longer the highest-yielding option. The market has matured around Aave, which means the easy money has been arbitraged out.

    If you treat Aave as a savings layer and a borrowing utility rather than a degen yield play, it is still the best product in its category by a wide margin. Use Base or Arbitrum for small positions, e-mode for correlated leverage, and the Umbrella safety module if you want a bit more yield on your senior deposit. Skip it if you would rather chase 15% to 20% APYs on protocols a tenth of its size.

    FAQ

    Is Aave safe to use in 2026?
    Aave has the strongest security track record in DeFi lending. The v3 contracts have been audited multiple times by OpenZeppelin, Trail of Bits, Certora, and others, and the protocol has never suffered an exploit that impaired depositor balances. That said, no smart contract is risk free. Use sensible LTVs and do not put life-changing money on any single protocol.

    What chains does Aave support?
    Aave v3 is live on Ethereum mainnet, Base, Arbitrum, Optimism, Polygon, Avalanche, BNB Chain, Plasma, MegaETH, Linea, Scroll, Sonic, Gnosis (xDai), Metis, and several other EVM chains. The largest pool by far is on Ethereum mainnet, but Base and Arbitrum are the cheapest places to use the protocol for retail size.

    How does Aave compare to Compound or Morpho?
    Aave is significantly larger than Compound and is the protocol Morpho builds on top of in many markets. Compound v3 is simpler but lists fewer assets and fewer chains. Morpho Blue offers more granular vaults but routes a meaningful portion of its activity to Aave underneath. For most users, going directly to Aave is the path of least resistance and lowest abstraction risk.

    What is GHO and how is it different from DAI?
    GHO is the Aave-native overcollateralized stablecoin. Borrow rates on GHO are set by governance rather than a market curve, which keeps them stable and predictable. All interest paid by GHO borrowers flows directly to the Aave DAO treasury. DAI (now MakerDAO’s Sky USDS) is older, larger, and uses a different governance and revenue model. Both peg to $1.

    Do I need to stake AAVE to use the protocol?
    No. Staking AAVE in the safety module is purely optional and is mostly relevant if you want the GHO borrow rate discount, governance voting weight, or the extra staking APY. Suppliers and borrowers do not need to hold AAVE at all.

    What is the AAVE token’s role?
    AAVE is the governance token. Holders vote on protocol parameters, new asset listings, treasury spending, and upgrades. Stakers in the safety module act as a backstop for shortfall events and earn a share of protocol revenue plus emissions. The token is not required for normal protocol use but accrues real cashflow through the safety module and GHO mechanics.