More
    Home Blog Page 14

    Uniswap (UNI) Price Prediction 2026: Burn Catalyst

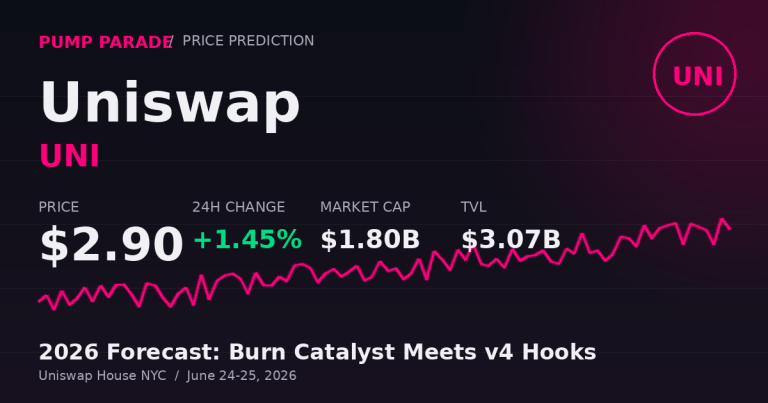
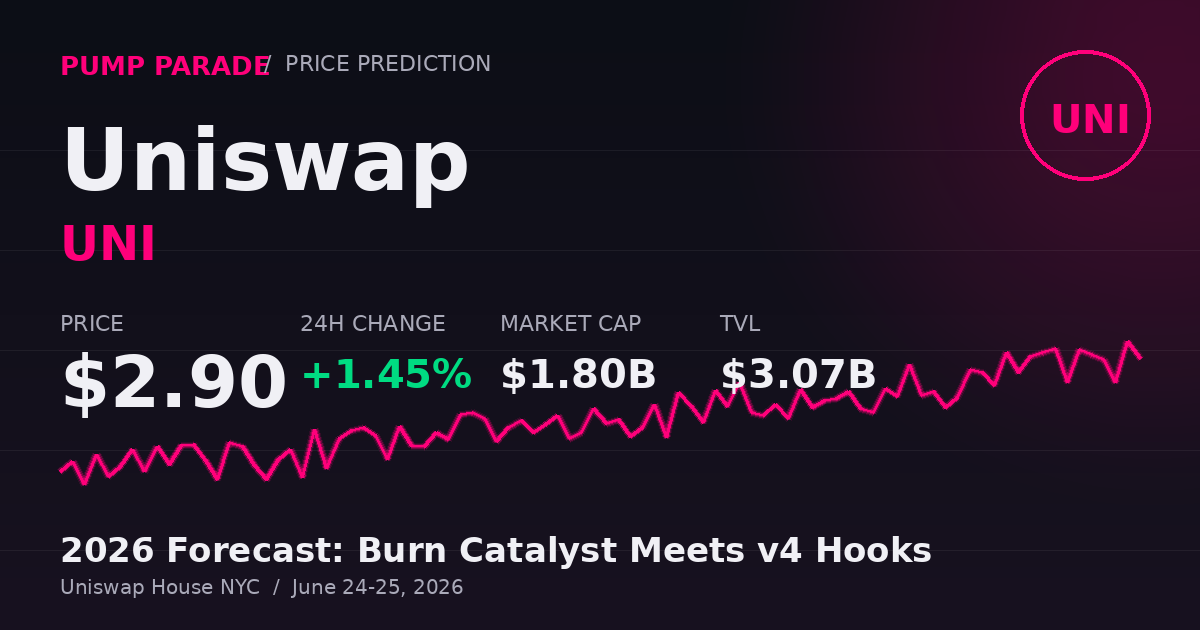
    Uniswap (UNI) trades at $2.90 today, up 1.45% on the day but still down nearly 17% over the last week. The token has burned 100 million UNI since December, launched a fee switch, and watched v4 process a fifth of all Ethereum DEX volume. None of it has fixed the chart.

    That tension is the story right now. Uniswap House opens in New York City today, June 24, 2026, and runs through tomorrow. The two-day event packs 32 speakers across 15 talks, all centered on v4 hooks, institutional DeFi, and AI-powered UX. The protocol has never had more product to sell. The token has rarely traded with less enthusiasm.

    This Uniswap price prediction breaks down the real data, the burn math, and the catalysts that could finally pull UNI off the floor.
    Uniswap UNI price prediction 2026 hero image showing $2.90 price, market cap, and TVL data

    Uniswap Price Today: Where UNI Actually Stands

    Here is the current snapshot. UNI is at $2.90 with a market cap around $1.80 billion and a fully diluted valuation near $2.59 billion. Daily volume sits at roughly $137 million. Total Value Locked across all Uniswap pools is just over $3.07 billion, more than the market cap of the token itself.

    The recent price action looks ugly on every meaningful timeframe. UNI is down 17% over seven days, 14% over thirty days, and 58% over the past year. The all-time high of $44.92 set in May 2021 looks like ancient history. Yet the protocol underneath the token is doing more volume than at any point in its existence.

    According to CoinGecko data, Uniswap still processes between 50% and 65% of weekly decentralized exchange volume depending on chain activity. That dominance has not translated into UNI buyers. The market is asking a fair question: if v4 is winning, why is UNI losing?

    The UNIfication Burn: A Slow Fuse

    The biggest structural change to UNI in years happened in late December 2025. Uniswap governance approved the UNIfication proposal, which burned 100 million UNI tokens from the supply and flipped the long-debated protocol fee switch.

    Here is how the new fee math works. On v2 pools, the LP share dropped from 0.30% to 0.25%. The 0.05% difference now goes to the protocol. On curated v3 pools, the protocol takes 25% of LP fees on the lowest tiers and 16.7% on the highest. Those fees fund a programmatic UNI burn that runs continuously.

    The 100 million tokens burned in December represented about 14% of the circulating supply at that time. The supply now sits near 621.6 million UNI against a 1 billion max. Over time, the burn flow should pull more tokens out of circulation if v4 volume keeps climbing.

    So why has the price not responded? Two reasons. First, the fee burn has only been live for about six months. The absolute UNI removed per week is still small relative to the float. Second, the broader market priced UNI as a governance token for years. The shift to a cash-flow asset takes time to digest. Both factors fade with time, which is part of the bull thesis.

    V4 Hooks: The Product That Could Actually Move UNI

    Uniswap v4 went live on Ethereum mainnet on January 30, 2026, with simultaneous deployments on Arbitrum, Base, Optimism, and Polygon. By the end of Q1, v4 pools had attracted more than $4 billion in TVL and were processing roughly 20% of all DEX volume on Ethereum mainnet.

    The unlock is hooks. A hook is a small piece of code that runs at specific points in a pool’s life. It can fire before a swap or after liquidity is added. Builders can use hooks to ship dynamic fees, MEV protection, custom oracles, on-chain limit orders, or whatever else they can write. More than 1,500 builders joined hook programs in 2025 and over 2,500 custom liquidity pools have been deployed.

    Why does this matter for UNI? Hooks turn Uniswap from a single AMM into a programmable liquidity layer. Every new hook adds reasons for liquidity to land on v4 instead of a competitor. More volume means more fees, more fees means more burn, more burn means tighter supply. The story works if v4 share keeps climbing. Most analysts expect v4 to pass 50% of Uniswap volume by the end of 2026.

    For traders comparing the broader DEX landscape, our Raydium vs Orca DEX comparison shows how the Solana DEX market is fragmenting in parallel. That fragmentation is part of why Uniswap is racing to ship hooks fast.

    Institutional DeFi and Tokenized Stocks

    The other Uniswap catalyst is one the token holder base barely talks about. Uniswap is becoming a tokenized asset venue. Users can now trade tokenized versions of SpaceX, Apple, Tesla, and NVIDIA shares through the Uniswap app, wallet, and API. UniswapX is integrated with Securitize for BlackRock’s BUIDL fund.

    If real-world assets become a meaningful slice of DEX volume, Uniswap captures protocol fees on every trade. Standard Chartered modeled this out and projects UNI targets of $6.50 in 2026 and up to $100 by 2030. That long-dated number is aggressive and rests on tokenized asset volume scaling through the late 2020s. The 2026 target is closer to consensus and roughly aligns with our base case below.

    UNI Technical Outlook: Where the Chart Stands

    UNI’s chart is a study in repeated tests of the $2.50 to $3.00 range. The token has bounced off the low end of that band three times in 2026. Each bounce has stalled before reclaiming the 200-day moving average near $3.40. Bulls need a clean break and hold above $3.40 to confirm a trend change.

    The 24-hour high is $2.94 and the low is $2.84. Volume around $137 million is below the 30-day average. That tells you the market is waiting for a catalyst, not selling hard. Uniswap House could be that catalyst if a major v4 product launch or partnership drops during the event.

    Bearish counter-argument: UNI has had catalysts before. The fee switch was the holy grail for years. It activated, and the price kept drifting lower. Some traders are now treating UNI as a value trap rather than a growth bet. That view is fair until the burn rate gets big enough to matter.

    UNI Price Prediction by Timeframe
    Uniswap UNI price prediction targets for 2026 to 2028 showing bear, base, and bull scenarios across short, mid, and long term

    Short-Term: Next 30 Days (July 2026)

    The 30-day window is driven by sentiment from Uniswap House and the broader DeFi tape.

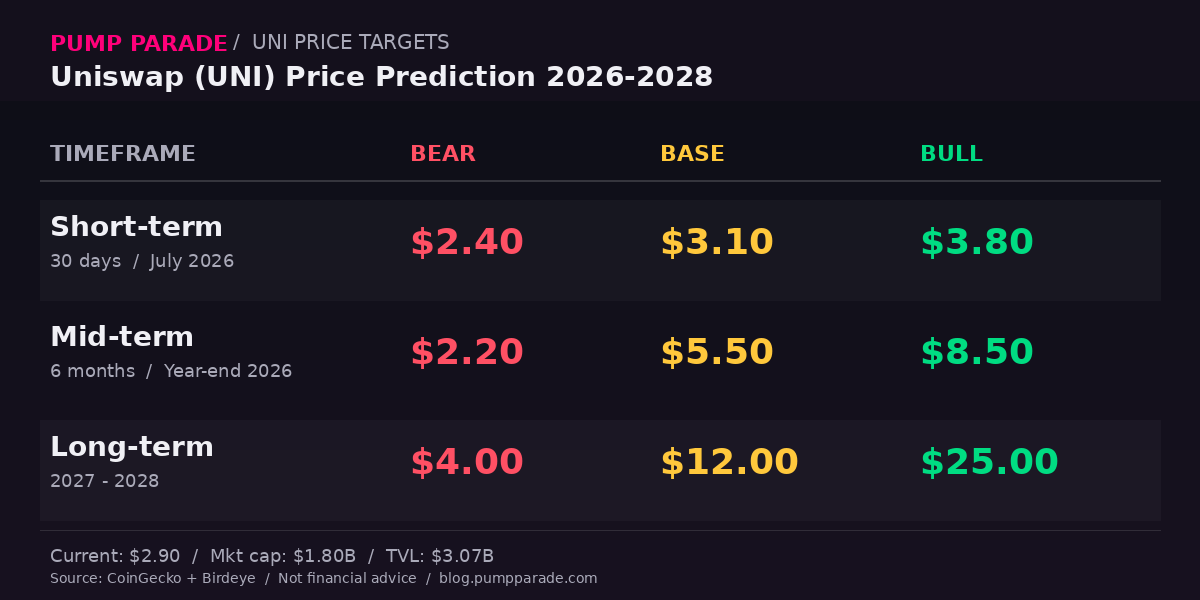
    Bear: $2.40. NYC event passes without a major product reveal and macro stays risk-off. UNI breaks the $2.50 support and tests the 2026 lows.

    Base: $3.10. The event delivers solid news on hooks adoption and a couple of institutional partnerships. UNI recovers to the 50-day average and consolidates.

    Bull: $3.80. A major partnership drops, possibly with a top-tier hook developer or a tokenized asset issuer. UNI breaks $3.40 and runs to retest the spring 2026 highs.

    Mid-Term: 6 Months (Year-End 2026)

    The 6-month view depends on v4 share, burn velocity, and whether real-world asset volume scales.

    Bear: $2.20. v4 growth stalls, competing DEXs eat share, and the burn fails to outpace governance unlocks. UNI keeps grinding.

    Base: $5.50. v4 captures the projected 50% of Uniswap volume, fee burn ramps, and RWA flows add a meaningful slice of volume. This aligns roughly with the Standard Chartered 2026 target.

    Bull: $8.50. A breakout DeFi quarter, tokenized assets cross 10% of UniswapX volume, and the burn becomes visible in supply data. UNI re-rates to a cash-flow multiple.

    Long-Term: 2027 to 2028

    This is the cash-flow thesis. If protocol fees compound and supply keeps shrinking, UNI becomes a different kind of asset.

    Bear: $4.00. DeFi share peaks, hook innovation slows, and a competitor wins the next cycle of liquidity wars.

    Base: $12.00. Uniswap remains the dominant DEX, v4 hooks become an ecosystem standard, and the burn meaningfully tightens supply over two years.

    Bull: $25.00. Tokenized stocks and bonds become real volume on UniswapX. The protocol captures a slice of every DEX trade through aggregator hooks. UNI trades like a high-multiple fintech.

    Risk Factors Worth Watching

    A few things could break this thesis. Regulatory action on tokenized securities is the biggest single risk. If U.S. regulators force Uniswap to geo-block tokenized stocks, the RWA leg of the bull case weakens. Second, a major hook exploit would dent the trust in v4 and slow developer adoption. Third, the broader Ethereum gas market matters. If L2 economics shift hard and rollup fees compress, Uniswap’s share of total DEX volume on layer 2s could move in unexpected directions.

    The crypto market overall remains in a neutral to cautious posture, with total market cap near $1.68 trillion as of mid-June 2026. Bitcoin sits in a tight range and the Fed has signaled it is in no rush to cut. UNI will trade with that tape until it does not.

    The Bottom Line on Uniswap Price

    UNI at $2.90 is a value-versus-growth debate. The growth case rests on v4 hooks, tokenized assets, and a fee burn that compounds quietly. The value trap case is the obvious one: every prior catalyst has failed to move the price.

    Our base case puts UNI around $3.10 in 30 days and $5.50 by year-end 2026, with $12 plausible by 2027 to 2028 if the burn math works. The bull case stretches to $8.50 by year-end and $25 over the longer view. The bear case is real and warrants stops below $2.40 if you trade the breakout.

    Uniswap House this week is a useful read on sentiment. Watch the announcements out of New York. If a hook partnership lands with a recognized institutional player, the chart story changes quickly. If the event passes quietly, the slow burn thesis is your only edge.

    Disclaimer: This article is for informational and educational purposes only and should not be construed as financial, investment, or trading advice. Cryptocurrency markets are highly volatile, and past performance does not guarantee future results. The price predictions and analyses presented here are based on AI models, technical indicators, and available data at the time of writing, they are not guarantees. Always conduct your own research (DYOR) and consult with a qualified financial advisor before making any investment decisions. Pump Parade and its authors do not assume liability for financial losses incurred based on information provided in this article.

    Banana Gun Review 2026: Fees, Features & Verdict

    0

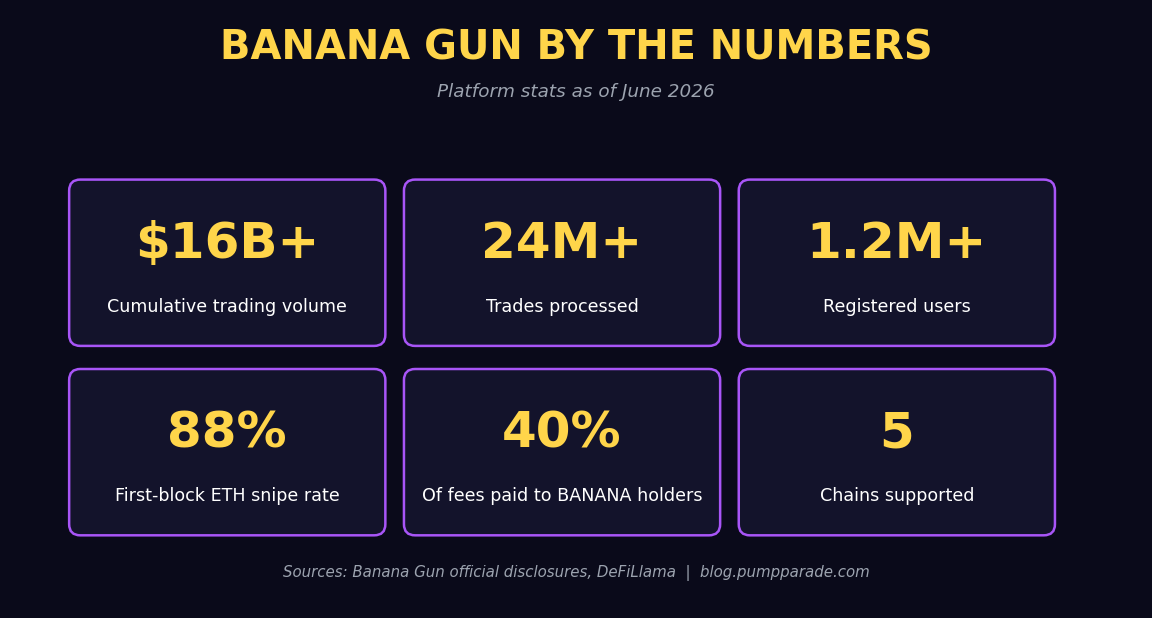
    If you trade on-chain across multiple networks, you have probably watched a token launch on Ethereum while a Solana pump happens in parallel, and felt the friction of juggling two or three different bots. Banana Gun built its entire 2026 product cycle around solving exactly that problem, and the numbers behind the platform are no longer small. According to its own disclosures, the bot has now processed more than $16 billion in cumulative trading volume across 24 million trades, with over 1.2 million registered users running snipes, swaps, and copy trades from inside a single Telegram session.

    So the question is not whether Banana Gun is a real product. It clearly is. The question is whether it deserves a slot in your trading stack in 2026, especially next to Solana-native names like Photon, GMGN, and BullX, and Telegram veterans like BonkBot and Maestro. This review breaks down the speed, the fees, the BANANA token revenue share, the security history, and the honest weak spots. By the end, you should know exactly whether Banana Gun fits your style.

    Banana Gun official logo

    Quick Verdict: Banana Gun Review 2026

    Rating: 4.2 / 5

    Banana Gun is still one of the strongest multi-chain Telegram trading bots in 2026. It is the right choice for traders who actively rotate between Ethereum, Solana, BNB Chain, Base, and MegaETH, and for anyone who wants exposure to a real revenue-share token without dealing with another DeFi protocol. It is not the right choice if you trade Solana memecoins exclusively, in which case Solana-native UIs will likely feel snappier.

    Best for: Multi-chain sniper-traders, copy-trade enthusiasts, BANANA holders who want fee revenue.
    Skip if: You only trade Solana memecoins and prefer a polished web UI over Telegram.

    What Is Banana Gun?

    Banana Gun launched in 2023 as a Telegram-native Ethereum sniping bot. The early product was narrow on purpose: get into a new ERC-20 token in the first block after liquidity is added, before retail traders can catch up. That narrow focus paid off. Banana Gun consistently topped the Ethereum sniping leaderboards through 2024 and built a reputation as one of the fastest first-block bots on mainnet.

    What changed in 2026 is the surface area. The March 2026 update consolidated five chains, Ethereum, Solana, BNB Chain, Base, and MegaETH, into a single Telegram session. Users can now snipe on Ethereum, swap on Solana, and run a copy-trade strategy on Base, all from the same wallet keys and the same chat. The platform also rolled out a web companion called Banana Pro, aimed at traders who want a chart-driven dashboard alongside the Telegram interface.

    Banana Gun is built and marketed under the brand-friendly tagline “for degens, by degens,” but the architecture under the hood has matured into something closer to a full DeFi execution layer.

    Platform Stats and Traction

    Banana Gun 2026 platform stats: 16 billion dollars in volume, 24 million trades, 1.2 million users, 88 percent first-block snipe rate, 40 percent revenue share, 5 chains
    Banana Gun by the numbers, as of June 2026.

    Numbers matter more than narrative in this category. Here is where Banana Gun sits as of June 2026:

    • Cumulative volume: over $16 billion across all chains since 2023
    • Total trades processed: more than 24 million
    • Registered users: over 1.2 million
    • Chains supported: Ethereum, Solana, BNB Chain, Base, MegaETH
    • Lifetime protocol fees (per DefiLlama): roughly $87 million
    • 30-day fees (per DefiLlama, as of writing): approximately $27,400

    The 30-day fee number is worth context. Crypto trading bot revenue compresses hard outside of active memecoin cycles. During peak market activity in late 2025, Banana Gun was generating over $92,000 in weekly fees. The March 2026 consolidation phase saw weekly fees stay above $17,000 even with much quieter on-chain conditions. That floor under quiet conditions is one of the cleaner indicators that real, recurring trading is happening on the platform.

    Key Features Deep Dive

    Multi-Chain Sniping From One Session

    The flagship 2026 feature is unified session management. You connect once, configure your gas and slippage defaults per chain, and then snipe or swap on any of the five supported networks without re-importing keys or switching bots. Copy trading works the same way: a single mirror configuration can replicate a wallet across multiple chains simultaneously if that wallet trades across them.

    For ETH sniping specifically, Banana Gun reports an 88% first-block success rate, meaning when a new token launches, the bot lands the snipe in the first block 88 times out of 100 attempts. That number comes from the platform itself and should be treated accordingly, but it is consistent with the bot’s track record in third-party sniper leaderboards over the last two years.

    The Banana Simulator (Pre-Trade Honeypot Check)

    Before any swap or snipe is sent on-chain, the Banana Simulator runs the transaction against live state and checks the sell function. If the sell check fails, suggesting a honeypot or hidden mint, the trade is blocked automatically. This is one of the more useful safety primitives in the trading bot space, because honeypot detection at the bot layer means a user can be aggressive on new tokens without manually scanning every contract.

    MEV Protection By Default

    MEV protection is on by default with no toggle, no upcharge, and no manual configuration. Transactions are routed through private mempool flows on Ethereum, through Jito bundles on Solana, and through the rebuilt engine on MegaETH. For traders who have been sandwiched on a public mempool before, this is a meaningful default.

    BANANA Token Revenue Share

    This is where Banana Gun stands out economically. The protocol redistributes 40% of all platform trading fees directly to BANANA token holders. To be eligible, a wallet has to hold a minimum of 50 BANANA tokens. Distributions happen every four hours, six times per day, automatically, and are paid in the native asset of the chain that generated the fee (ETH or SOL, in most cases).

    Putting that in concrete terms: weekly fees of $70,000 to $115,000 during early 2026 translated to $28,000 to $46,000 per week flowing back to BANANA holders. During the quieter March 2026 phase, payouts dropped to roughly $7,000 per week. The revenue share is real and verifiable on-chain, but it scales directly with market activity. Holders are effectively long crypto trading volume.

    Banana Pro Web Dashboard

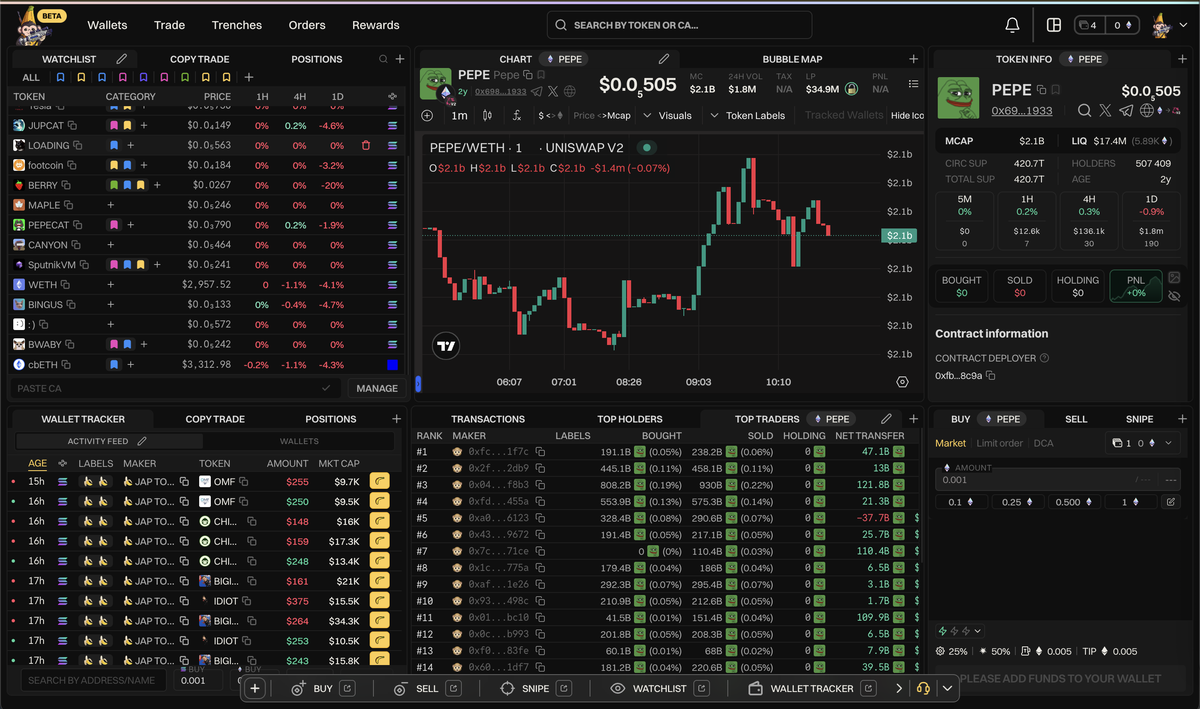
    Banana Pro web dashboard with chart and trade interface
    The Banana Pro web companion dashboard.

    For traders who want a chart-and-clicks experience instead of slash commands, Banana Pro is the companion web app. It surfaces token charts, wallet positions, P&L tracking, and one-click trades to the same backend that powers the Telegram bot. The two interfaces share state, so positions opened in Telegram appear in Pro, and vice versa.

    Fees and Pricing

    Banana Gun runs a flat fee model. There is no monthly subscription, no premium tier, and no token-gated discount layer.

    Action Fee Notes
    Ethereum manual trades and limit orders 0.5% Lower than BonkBot’s 1% baseline
    Ethereum sniper 1% Standard sniper bot rate
    All other chains (SOL, BNB, Base, MegaETH) 1% Flat across non-ETH networks
    Stablecoin swaps 0% No fee on stable-to-stable
    Subscription None Pay-per-trade only

    For comparison: BonkBot charges 1% across the board, Maestro charges 1% with a premium tier, and Trojan sits around 0.9% on Solana with feature-gated tiers. Banana Gun’s Ethereum manual fee of 0.5% is genuinely one of the cheapest flat rates on a major trading bot, and the 0% stablecoin swap policy is a nice touch for traders who park between trades.

    Security and Trust

    This is the section where balance matters most. Banana Gun has a complicated security history.

    The 2024 exploit. In September 2024, Banana Gun suffered an exploit linked to a Telegram message oracle vulnerability. Roughly $3 million was drained from 11 users before the team paused the bot and patched the issue. The exploit was a message-layer weakness rather than a breakdown of the core trading or wallet engine, but it is still on the public record and any honest review needs to flag it. The team did publish a post-mortem and reimbursed affected users.

    Current security stack. Since the 2024 incident, Banana Gun has hardened sessions and added several pre-trade safeguards. The current safety surface includes:

    • Pre-trade honeypot simulation (the Banana Simulator)
    • Anti-rug monitoring that tracks contract changes in real time
    • Reorg protection against block reorganization attacks
    • MEV protection routed via private mempools and Jito
    • Session hardening and additional 2FA-style controls for high-value wallets

    Audits. The platform has not published a full third-party security audit covering its entire 2026 stack. For a product moving billions in volume, this remains a fair criticism. Competing products like Photon and BullX also operate without publicly visible audits, but that is an industry-wide gap, not a defense.

    Bottom line: Banana Gun is meaningfully more secure than it was in 2024, but it is still a custodial-style Telegram bot, and traders should size positions accordingly.

    User Experience

    The Telegram bot interface is what it is. Slash commands, callback buttons, and a stack of recent token messages. If you have used BonkBot, Trojan, or Maestro, the muscle memory transfers directly. New users should expect a 30 to 60 minute learning curve to get comfortable with the per-chain settings, gas presets, and slippage defaults.

    The Banana Pro web dashboard is the bigger UX upgrade for 2026. Charts are usable, position tracking is clean, and one-click trades feel responsive. It is not as feature-rich as a dedicated terminal like Photon or Axiom on Solana, but it solves the biggest historical complaint about Telegram bots: no native chart context.

    There is no dedicated mobile app outside of Telegram itself. For users who already live in Telegram on mobile, this is a non-issue. For users who want a standalone iOS or Android app, it is a gap.

    Pros and Cons

    Pros

    • True multi-chain coverage from a single Telegram session (ETH, SOL, BNB, Base, MegaETH)
    • 88% first-block Ethereum snipe rate, one of the highest in the industry
    • 40% of platform fees redistributed to BANANA token holders, paid in ETH and SOL every four hours
    • Pre-trade honeypot simulator blocks bad contracts before funds move
    • MEV protection on by default across all chains
    • Competitive Ethereum fee at 0.5% on manual trades, 0% on stablecoin swaps
    • Banana Pro web dashboard adds real chart and position UX
    • Real, verifiable revenue and usage history (over $16B cumulative volume)

    Cons

    • 2024 exploit history is on the public record, even if patched and reimbursed
    • No published full third-party audit of the current 2026 stack
    • Custodial wallet model (your keys live inside the Telegram session)
    • Solana memecoin traders may find Solana-native UIs faster and snappier
    • No dedicated standalone mobile app outside Telegram
    • BANANA token revenue share scales directly with market activity, so payouts are volatile
    • Occasional reports of slow or failed transactions during peak congestion

    How Banana Gun Compares

    If you are weighing Banana Gun against Solana-native bots, two of our recent reviews are worth reading side by side: Photon vs BullX and GMGN vs Trojan. Both compare Solana-only trading tools that go deeper on memecoin-specific features but lack Banana Gun’s multi-chain reach. For pure Solana speed, those tools usually edge out a multi-chain bot. For a single interface across Ethereum, Solana, and EVM L2s, Banana Gun is the clearest leader in its category in 2026.

    Final Verdict

    Rating: 4.2 / 5

    Banana Gun in 2026 is no longer the narrow Telegram sniper it was in 2023. It is a full multi-chain execution layer with a real revenue-share token, real defaults around MEV and honeypot protection, and real on-chain volume to back it up. The 2024 exploit and the lack of a current public audit are fair concerns, and any user should size positions to what they would be comfortable losing if a Telegram session was ever compromised.

    For multi-chain traders, BANANA holders, and anyone who values a single execution surface across Ethereum, Solana, and emerging EVM chains, Banana Gun is the most complete option available in its category right now.

    Frequently Asked Questions

    Is Banana Gun safe to use in 2026?
    Banana Gun has hardened its session and message layer significantly since the September 2024 exploit, and it now ships with pre-trade honeypot simulation, MEV protection, and reorg protection by default. It is still a custodial Telegram bot, however, and users should treat the in-bot wallet as a hot wallet only. Do not store long-term holdings there.

    What chains does Banana Gun support?
    As of mid-2026, Banana Gun supports Ethereum, Solana, BNB Chain, Base, and MegaETH from a single unified Telegram session. Copy trading and sniping work across all five.

    How much does Banana Gun cost?
    Banana Gun charges 0.5% on Ethereum manual trades and limit orders, 1% on the Ethereum sniper and all other supported chains, and 0% on stablecoin swaps. There is no monthly subscription and no premium tier.

    How does the BANANA token revenue share work?
    The protocol redistributes 40% of all platform trading fees to BANANA token holders. To be eligible, a wallet must hold a minimum of 50 BANANA. Distributions happen every four hours and are paid in ETH or SOL depending on which chain generated the fee.

    Is Banana Gun better than BonkBot or Maestro?
    It depends on what you trade. For pure Solana memecoins, BonkBot’s Solana-native UX is slightly faster. For EVM-heavy traders and multi-chain rotators, Banana Gun has the cleaner multi-chain experience and a cheaper Ethereum manual fee. Maestro is a closer fight, and the answer there comes down to whether you value Banana Gun’s revenue share token over Maestro’s premium tier features.

    Disclaimer: This article is for informational and educational purposes only and should not be construed as financial, investment, or trading advice. Cryptocurrency markets are highly volatile, and past performance does not guarantee future results. Always conduct your own research (DYOR) and consult with a qualified financial advisor before making any investment decisions. Pump Parade and its authors do not assume liability for financial losses incurred based on information provided in this article.
    Cardano (ADA) Price Prediction 2026: Leios Catalyst

    0

    Cardano just shipped its biggest scaling experiment in years. The Leios “Musashi Dojo” public testnet went live on June 23, with a stated goal of pushing the network past 1,000 transactions per second. The market reacted by sending ADA to a fresh five-year low near $0.16.

    That gap between technical ambition and price action is the story right now. ADA trades at $0.1612 with a $6.04B market cap, down roughly 14% on the week and around a third off its early-June levels. Volume is healthy at $208M in 24 hours, so this is not a thinly traded panic, it is a real repricing.

    The question for traders: does the Leios catalyst justify a contrarian setup, or is the testnet news already priced in?

    Cardano ADA price prediction Leios testnet catalyst

    Where ADA Sits Right Now

    Cardano is the 20th largest cryptocurrency by market cap and one of the most-traded altcoins outside the top 10. Today’s snapshot, per CoinGecko market data:

    • Price: $0.1612 USD
    • Market cap: $6.04 billion
    • 24h volume: $208.1 million
    • 7-day change: -14.4%
    • Distance from June high: roughly -33%

    The chart is in a clear downtrend. ADA broke below the $0.175 horizontal support that had held since early 2025. Below that, the next visible demand zone sits in the $0.135 to $0.145 range, a level last tested in 2021. Translation: there is not much technical support between current price and that band.

    RSI on the daily is hovering near 30, which signals oversold but not yet washed out. In past Cardano cycles, RSI has dipped into the low 20s before sustained bounces. The data suggests sellers still have room to push lower before exhaustion sets in.

    The Leios Catalyst: What Actually Shipped

    Leios is the name for Cardano’s new consensus upgrade. The public testnet that went live today is called Musashi Dojo, named after the 16th-century samurai Miyamoto Musashi. The five planned phases are Earth, Water, Fire, Wind, and Void, lifted straight from Musashi’s Book of Five Rings.

    In plain terms, Leios is an overlay protocol. It sits on top of Cardano’s existing Praos consensus rather than replacing it. The key change is parallel block production. Right now, Cardano processes transactions one block at a time. Leios introduces “endorser blocks” that fire in parallel during periods of high demand. Think of it like adding multiple checkout lanes to a single-line grocery store.

    The numbers that matter:

    • Target throughput: 1,000+ TPS at full rollout (roughly 30 to 65 times current capacity, depending on the source)
    • Initial gain at launch: 2 to 5 times current throughput
    • Mainnet hard fork target: November 2026
    • Codebase size: 705,000 lines of code

    Charles Hoskinson, Cardano’s founder, called the launch a milestone he “could only have dreamed of.” That kind of statement gets eye rolls in crypto Twitter, but the technical scope here is real. Leios has been in research since 2022 and represents the biggest scaling redesign Cardano has attempted.

    The Bull Case: Why Some Traders See a Setup

    Buyers looking at ADA right now are working from a simple thesis. The fundamentals are improving while the price is collapsing. That divergence sometimes marks a bottom. Sometimes it does not. Here is what is on the bull side of the ledger.

    Three Catalysts in a 90-Day Window

    Cardano has stacked its biggest catalysts of the year into a tight window:

    • Leios Musashi Dojo testnet: Live now (June 23)
    • Van Rossum hard fork: Late June 2026, brings Plutus V3 smart contract upgrades
    • ADA ETF eligibility: August 9, 2026, when Cardano qualifies for spot ETF filings under updated SEC rules

    Any one of these could move the needle. All three landing in roughly 60 days is a different kind of setup. If the ETF window opens and an institutional issuer files, the speculative trade becomes harder to fade.

    Oversold Conditions

    RSI near 30, price at a five-year low, and sentiment on Crypto Twitter near multi-year bearish extremes. These are not bullish signals on their own. They are the conditions that often precede mean reversion when paired with a credible catalyst.

    A Real Technical Story

    Unlike many altcoins still hunting for product-market fit, Cardano has shipped working infrastructure. The Leios documentation shows a parallel block design with adversarial testing built into the testnet phases. If the math holds in production, Cardano goes from being a slow chain to a competitive one almost overnight.

    The Bear Case: Why the Chart Disagrees

    Now the other side. The data is not flattering for ADA right now, and ignoring it is how traders blow up positions.

    The Trend Is Broken

    ADA broke a horizontal support that had held for over a year. In trading, broken support often becomes resistance. The $0.175 level is now likely a ceiling on bounces, which caps upside even on positive news. Until ADA reclaims that level on volume, the chart says sell rallies.

    Testnet Is Not Mainnet

    The Leios mainnet hard fork is not scheduled until November 2026. That is roughly five months of “we are testing this.” Crypto markets price catalysts on a curve. The bulk of the upside often gets paid out when the upgrade actually ships, not when the testnet launches. The “buy the testnet, sell the mainnet” trade can work, but it can also chop traders to pieces.

    Throughput Without Demand Is a Press Release

    Solana, Sui, NEAR, and a half dozen other chains can already do 1,000+ TPS. Cardano catching up matters less than Cardano attracting the developer mindshare and applications that actually need that throughput. DEX volume, stablecoin issuance, and active addresses on Cardano have all trended down in 2026. The pipes get bigger, but the water is not flowing yet.

    The ETF Trade May Disappoint

    August 9 ETF eligibility is real, but eligibility is not the same as approval. The Solana spot ETF approval took months after eligibility. Even if approved, the inflow profile may be muted given Cardano’s market cap is below most other ETF-eligible assets. Compare this setup to the recent Litecoin ETF test to see how the market handled a similar window.

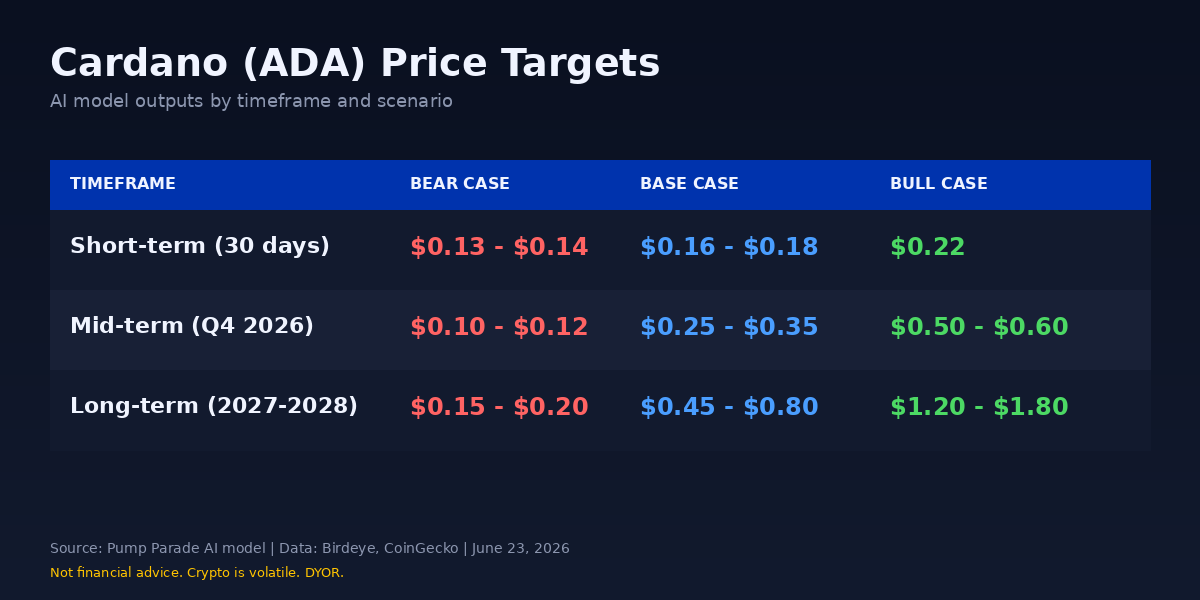
    Cardano ADA price targets bear base bull cases

    Price Predictions: ADA Targets by Timeframe

    Our AI model weighs technical structure, on-chain activity, catalyst calendar, and macro conditions. Here are the targets it returns for three timeframes. As always, these are probabilities, not guarantees.

    Short-Term (Next 30 Days)

    • Bear case: $0.13 to $0.14 (retest of 2021 demand zone)
    • Base case: $0.16 to $0.18 (range-bound consolidation)
    • Bull case: $0.22 (reclaim of $0.175 plus a sentiment shift on the Van Rossum fork)

    Most likely outcome in our model: choppy range between $0.15 and $0.19 as the market digests three catalysts in quick succession. Traders looking for cleaner setups may want to wait for either a confirmed breakdown or a confirmed reclaim of $0.175.

    Mid-Term (Six Months, Q4 2026)

    • Bear case: $0.10 to $0.12 (Leios mainnet delays plus ETF rejection)
    • Base case: $0.25 to $0.35 (Leios mainnet ships on schedule, no major macro shocks)
    • Bull case: $0.50 to $0.60 (Leios live, ETF approved, broader altcoin rotation)

    The November mainnet hard fork is the pivot. If it ships clean, our model gives ADA a credible path to the $0.30 zone by year-end. If it slips into 2027, the base case rolls forward and the bear case becomes more probable.

    Long-Term (2027 to 2028)

    • Bear case: $0.15 to $0.20 (Leios fails to attract developers, ecosystem stagnates)
    • Base case: $0.45 to $0.80 (steady ecosystem growth, throughput becomes a competitive advantage)
    • Bull case: $1.20 to $1.80 (Leios drives a Cardano DeFi resurgence, institutional ETF flows compound)

    The long-term case for ADA is not about Leios alone. It is about whether the upgrade catalyzes a real ecosystem rebuild. Cardano has the brand, the holder base, and now the throughput. What it needs is applications people use.

    What to Watch in the Next Two Weeks

    If you are tracking ADA, here are the data points that will tell you whether the trend is shifting:

    • Daily active addresses: A sustained move above 80,000 would suggest real network activity returning
    • DEX volume on Minswap and Sundaeswap: Watch for a reversal of the 2026 downtrend
    • $0.175 reclaim: A daily close above this level on volume is the first technical green flag
    • Van Rossum hard fork execution: Smooth deployment versus delays will set the tone for the Leios mainnet expectation
    • ETF filing news: Any S-1 filing from a major issuer ahead of August 9 would shift the trade meaningfully

    Our Take

    This is the kind of setup that splits traders cleanly into two camps. The chart traders see a broken trend and a token that has nothing on the right side of the price action. The fundamental traders see three catalysts stacked into 60 days at a five-year low. Both are looking at the same data and reaching different conclusions, which is usually where the most interesting trades live.

    Our base case is that ADA chops between $0.14 and $0.22 over the next 30 days, then breaks decisively one way or the other as the Van Rossum fork and ETF window come into focus. The asymmetric trade here is small position sizing with patience: the downside from $0.16 is maybe 30%, while the upside on a clean catalyst stack could be 100% or more by Q4. That is not a guarantee, it is a risk-reward observation worth watching.

    For now, ADA is a token where conviction matters more than timing. If you believe Cardano can convert technical milestones into real network usage, current prices are interesting. If you do not, the chart is giving you every reason to wait.

    Disclaimer: This article is for informational and educational purposes only and should not be construed as financial, investment, or trading advice. Cryptocurrency markets are highly volatile, and past performance does not guarantee future results. The price predictions and analyses presented here are based on AI models, technical indicators, and available data at the time of writing, they are not guarantees. Always conduct your own research (DYOR) and consult with a qualified financial advisor before making any investment decisions. Pump Parade and its authors do not assume liability for financial losses incurred based on information provided in this article.
    Tron (TRX) Price Prediction 2026: Stablecoin Catalyst

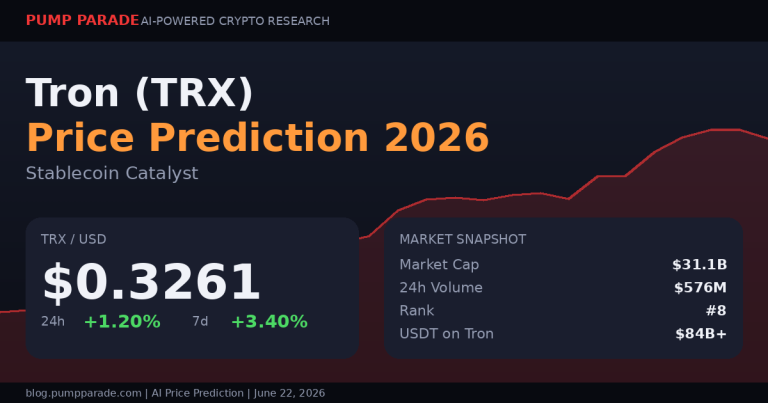
    Tron trades at $0.3261 today, up 1.2% in 24 hours and 3.4% on the week. The chain just printed a record 14.3 million transactions in a single day. It now hosts over $84 billion in USDT supply, more than any other network. And in the last three weeks, it has picked up a CFTC-regulated listing on Bitnomial, EU-regulated perpetuals on OKX Europe, and a Hyperlane integration that connects it to 150-plus blockchains.

    That is a lot of structural news for a top-10 asset that almost no one is talking about. Our AI model assigns a 58% probability that TRX retests its all-time high of $0.43 in 2026, with $0.50 in play if stablecoin flows keep accelerating. The bear case is real too: token unlocks, regulatory tail risk, and a market that often forgets Tron exists.

    Tron TRX price prediction 2026 hero image showing current price and market snapshot

    Here is the data, both sides of the trade, and our price targets.

    What is Tron and why does it matter right now

    Tron is a layer-1 blockchain built for cheap, fast transactions. In plain terms, it does one thing better than almost anyone: move stablecoins. The network hosts more than $84 billion in USDT, the largest stablecoin float in crypto. That makes Tron the settlement rail for a huge share of global crypto remittances and OTC flows.

    The numbers explain the rest of the thesis. Tron currently ranks #8 by market cap at $31.1 billion. Circulating supply sits at roughly 94.8 billion TRX. The chain just set an all-time daily record of 14.3 million transactions, beating every previous spike in the network’s history. That activity is not memecoin noise. It is mostly stablecoin movement, which tracks real economic use.

    Three recent catalysts are worth knowing about:

    • Bitnomial listing (June 5, 2026): TRX became tradable on Bitnomial, a CFTC-regulated derivatives venue in Chicago. This is the cleanest US institutional gateway TRX has ever had.
    • OKX Europe perpetuals (June 1, 2026): TRX perpetual futures launched on OKX Europe under MiCA-compliant terms, opening regulated leverage to EU traders.
    • Hyperlane integration: Tron is now reachable from 150-plus chains via Hyperlane messaging, removing one of its biggest historical pain points, weak interoperability.

    Layer that on top of Tron Inc., the publicly-traded company that recently added 1.2 million TRX to its treasury, taking total holdings above 700 million tokens. Corporate accumulation is happening with TRX well below its $0.43 all-time high.

    Technical analysis: what the chart is telling us

    TRX is trading in a tight $0.30 to $0.34 range that has held since early May. The 50-day moving average sits at $0.319, and the 200-day moving average is at $0.297. Price is holding above both, which is a constructive setup.

    The RSI (Relative Strength Index, a momentum gauge that runs from 0 to 100) prints around 54. That is the middle zone. Not overbought, not oversold, and consistent with a coiled chart waiting for a catalyst.

    Four levels matter most right now:

    • Support 1: $0.30, the floor of the current range and the 200-day reclaim zone.
    • Support 2: $0.27, the April swing low. A break here invalidates the range.
    • Resistance 1: $0.345, the May high. Clean break opens room to $0.40.
    • Resistance 2: $0.43, the all-time high. A multi-week consolidation above the 50-day suggests TRX has the structure to attempt this level if a catalyst hits.

    The MACD (a trend indicator that compares short and long moving averages) is flat, signaling neither buyers nor sellers control the tape. That usually changes fast when range-bound charts get news.

    Bull case: stablecoin demand and an institutional on-ramp

    The bull case for Tron is mechanical, not narrative-driven. Stablecoin supply on the network is growing, and TRX is the gas token. More USDT flowing through Tron means more burned TRX, more validator demand, and more reason for any payments business to hold TRX on its balance sheet.

    Specific catalysts that could push TRX higher:

    • Stablecoin growth. USDT supply on Tron has expanded by roughly $11 billion year to date. If that pace continues into Q4, Tron’s stablecoin float clears $95 billion.
    • Regulated US access. The Bitnomial listing makes TRX one of the few non-BTC, non-ETH assets with a clean US derivatives venue. This unlocks hedged exposure for funds that could not touch TRX through spot.
    • EU perpetuals. OKX Europe is one of the larger regulated venues post-MiCA. TRX perpetuals there add real liquidity to European order books.
    • Tron Inc. treasury accumulation. Corporate buying at sub-$0.35 reduces float and signals long-term conviction from a public-company balance sheet.
    • Hyperlane bridge expansion. Tron has long been an island in DeFi. The Hyperlane connection lets liquidity move across 150-plus chains, which improves the chain’s relevance for cross-chain DeFi.

    Our AI model’s bull case puts TRX at $0.43 to $0.50 by Q4 2026, assuming stablecoin flows stay strong and at least one of the regulated venues posts meaningful open interest growth. A move beyond $0.50 would need either an ETF filing or a clear regulatory blessing in the US, neither of which is on the near-term calendar.

    Bear case: unlocks, regulatory risk, and narrative fatigue

    The bear case is just as easy to make. Tron has structural issues that bulls tend to wave away.

    • Concentration risk. The Tron Foundation and entities tied to founder Justin Sun still hold a meaningful slice of supply. Any large transfer or sale can move price hard.
    • Token unlocks and inflation. While TRX is technically deflationary in net terms during high-activity periods, supply mechanics are sensitive to network usage. A drop in transaction count would shift the balance back toward net issuance.
    • Regulatory tail risk. The SEC’s prior actions against Tron-related entities are not fully resolved. New cases or enforcement actions, especially around USDT settlement on Tron, would hit TRX directly.
    • Narrative fatigue. Tron has been a top-10 asset for years without ever becoming a darling of crypto Twitter. That can keep speculative inflows muted even when fundamentals improve.
    • Competition for USDT settlement. Solana and Base are both aggressively courting stablecoin issuers. If a meaningful share of USDT migrates off Tron, the gas-burn thesis weakens.

    The bear scenario looks like this: TRX loses the $0.30 floor, drifts to $0.27, and gets stuck in a $0.22 to $0.28 range through Q3 if macro turns risk-off or if a regulatory headline lands. That is not catastrophic, but it does mean the bull thesis is on pause.

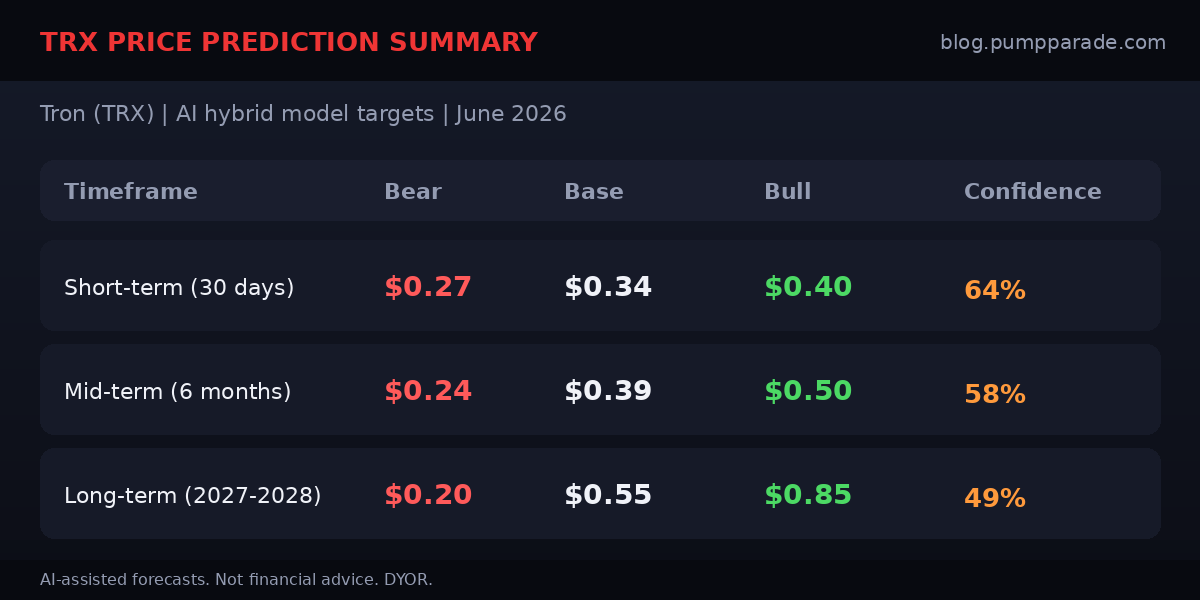
    AI price prediction summary

    Our hybrid AI model combines technical indicators, on-chain metrics, and catalyst-weighted scenarios. Confidence scores reflect the model’s internal probability estimate, not a guarantee.

    TRX price prediction summary table: short-term, mid-term, and long-term bear, base, and bull targets with AI confidence

    The base case for 30 days is a continuation of the current range with a slight upward bias as Bitnomial and OKX Europe build open interest. The base case for six months is a successful retest of $0.43, the all-time high, with $0.50 reachable if stablecoin flows stay on trend. The long-term base of $0.55 assumes Tron remains the dominant USDT settlement layer through the next bull cycle.

    The bull case for 2027 to 2028 requires three things to happen: USDT supply on Tron clears $100 billion, a US spot ETF gets filed (even if not approved), and Tron Inc. doubles its treasury holdings. None of those are base-case assumptions, which is why the bull target sits at $0.85 with sub-50% confidence.

    What to watch

    If you are tracking TRX, these are the signals that will move the trade:

    • Open interest on Bitnomial and OKX Europe. Regulated derivatives growth is the single best leading indicator of institutional interest.
    • USDT supply on Tron. Watch for the next $5 billion milestone. Tronscan and Artemis both track this in near real time.
    • Daily transaction count. The 14.3 million record set a new ceiling. Sustained activity above 10 million per day supports the gas-burn thesis.
    • Tron Inc. filings. Any public-company disclosure of further TRX purchases would be a clean bullish signal.
    • Macro tape. Tron tends to trade with BTC dominance. If BTC dominance falls and altcoin rotation kicks in, TRX participates.

    For broader Solana ecosystem context, our recent Jupiter (JUP) Price Prediction 2026: Frontier Catalyst covers the other side of the stablecoin and DEX flow story. For up-to-date market cap and supply data, CoinGecko’s TRON page is the cleanest live reference.

    Bottom line

    Tron is a quiet top-10 asset with loud fundamentals. The chain hosts more stablecoins than anyone, just set a transaction record, and picked up two regulated venues in three weeks. The chart is coiled. The catalysts are stacking. And TRX is still 24% below its all-time high.

    That does not make it a guaranteed trade. The bear case (concentration, regulatory tail risk, narrative fatigue) is real and not going away. But for traders looking for an asset where structural growth is doing the heavy lifting and price has not yet caught up, TRX is one of the cleaner setups in the top 10 right now.

    Our AI model leans constructive: 58% probability of a retest of $0.43, with $0.50 in play if stablecoin flows accelerate. The smart move is to size positions for the range, watch open interest on Bitnomial and OKX Europe, and treat $0.30 as the line in the sand.

    Disclaimer: This article is for informational and educational purposes only and should not be construed as financial, investment, or trading advice. Cryptocurrency markets are highly volatile, and past performance does not guarantee future results. The price predictions and analyses presented here are based on AI models, technical indicators, and available data at the time of writing, they are not guarantees. Always conduct your own research (DYOR) and consult with a qualified financial advisor before making any investment decisions. Pump Parade and its authors do not assume liability for financial losses incurred based on information provided in this article.
    NEAR Price Prediction 2026: AI Resharding Catalyst

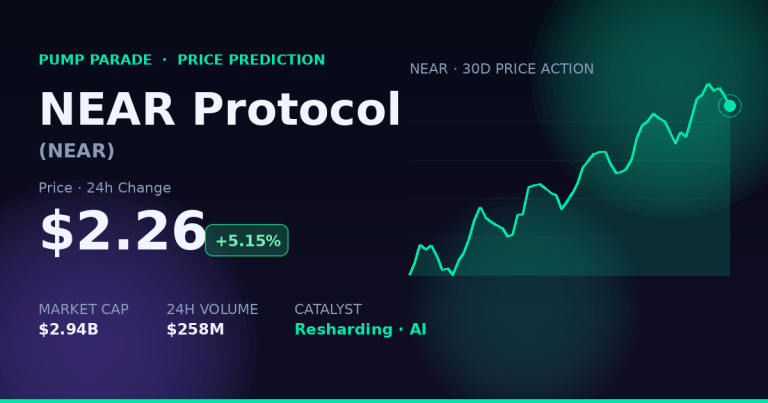
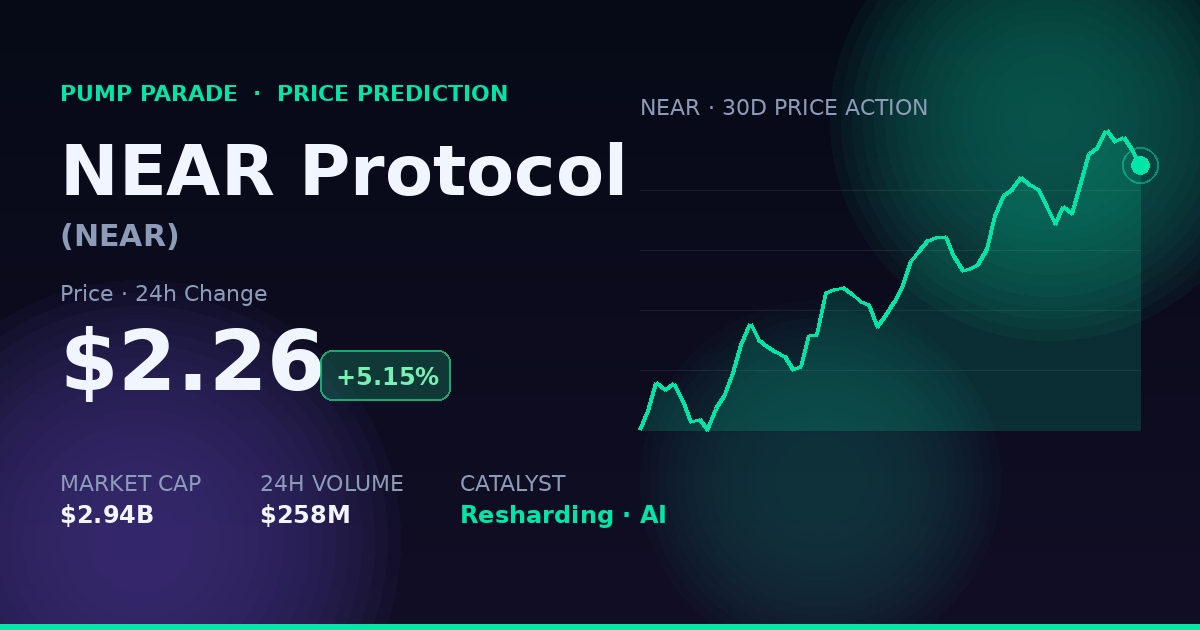
    NEAR Protocol (NEAR) price prediction 2026 hero graphic with current price and chart

    NEAR Protocol is trading at $2.26 at the time of writing, up 5.15% in the last 24 hours. That move is small. The story behind it is not.

    NEAR is now up roughly 200% from its 2026 low. Daily volume sits near $258 million on a market cap of about $2.94 billion. A golden cross printed on the daily chart in early June. The protocol’s v2.13 upgrade is rolling out this month. And the AI narrative just got a fresh shot of adrenaline from the Anthropic IPO filing.

    So the question every NEAR holder is asking: is this a real trend change, or another AI hype pump that fades into a long bleed? Let’s break down the data, the catalysts, and what our AI model sees for the rest of 2026 and beyond.

    NEAR Protocol at a Glance

    NEAR Protocol is a layer 1 blockchain built around sharding, a design that splits the network into smaller chains running in parallel. Translation: more transactions per second without giving up decentralization.

    Since 2024, NEAR has repositioned itself as an “AI-native execution layer.” The pitch is simple. AI agents need a chain where they can own assets, sign transactions, and trade across networks without humans in the loop. NEAR is building the rails for that.

    Current snapshot (price data via CoinGecko):

    • Price: $2.26
    • 24h change: +5.15%
    • Market cap: ~$2.94 billion
    • 24h volume: ~$258 million
    • Year-to-date trend: +200% from local low

    What’s Driving the Move: Three Real Catalysts

    1. Dynamic Resharding (v2.13) Goes Live This Month

    This is the headline upgrade. Until now, adding a new shard to NEAR was slow. It needed validator coordination, a governance vote, and a staged rollout. Weeks of work.

    Dynamic resharding flips that. When a shard hits a state size threshold, it splits on its own. No vote. No manual rollout. The network scales itself as demand grows.

    Why it matters: if AI agents are going to do real volume on-chain, the chain needs to scale without humans babysitting it. Dynamic resharding is the piece that makes that possible.

    2. Post-Quantum Cryptography Lands With It

    The same v2.13 release ships post-quantum signing. NEAR picked FIPS-204 (ML-DSA), the lattice-based signature standard NIST locked in back in August 2024.

    In plain terms: NEAR is making itself harder to break with future quantum computers. That sounds like a 2030s problem. But governments are already pushing the issue. France has mandated quantum-safe encryption by 2027. Enterprise buyers and regulators care about this now.

    3. The AI Trade Just Got Hotter

    On June 1, Anthropic filed confidential IPO papers with the SEC. The filing followed a funding round that valued the company at $900 billion. The IPO is expected to price between October and December 2026.

    NEAR rallied more than 15% on the news. The logic from traders: when an AI giant goes public, the whole AI-adjacent trade gets a bid. NEAR is one of the few large-cap L1s with a clear AI product story, including its NEAR AI agent marketplace and recent partnerships with Brave and Venice.

    For context on how the AI narrative is shaping crypto prices this year, see our recent Bittensor (TAO) price prediction, which covers the parallel ETF catalyst building in the AI sector.

    Technical Analysis: What the Chart Is Saying

    NEAR’s chart shifted character in May. Here is what stands out.

    Golden cross confirmed. The 50-day moving average crossed above the 200-day in early June. A golden cross is a pattern traders use to mark a trend change from down to up. It is not a buy signal on its own, but it usually clusters with other bullish signals.

    RSI in the middle of the range. The 14-day Relative Strength Index (a momentum gauge from 0 to 100) is sitting around 58. That is healthy. Above 70 would mean overbought. Below 30 would mean oversold. At 58, NEAR has room to keep climbing without being stretched.

    MACD bullish. The Moving Average Convergence Divergence indicator just turned positive on the daily. Last time MACD looked this clean on NEAR was the Q4 2023 rally.

    Key levels to watch:

    • Support: $2.05, then $1.80 (the breakout base)
    • Resistance: $2.65, then $3.20 (the level analysts are calling the breakout trigger)
    • Bull target zone: $4.20 if $3.20 breaks with volume

    Bull Case: Why NEAR Could Run to $5 and Beyond

    The bull case rests on three pieces lining up at the same time.

    One: v2.13 ships clean and dev activity migrates to NEAR for AI workloads. If even a small share of AI agent volume lands on NEAR, throughput and fee revenue compound.

    Two: The broader AI trade stays hot through the second half of 2026. Anthropic prices its IPO in Q4. OpenAI follows. Capital that wants AI exposure in liquid markets flows into crypto names with real product hooks. NEAR is on that short list.

    Three: Bitcoin holds above its 200-day moving average and altcoin rotation kicks in. In past cycles, when BTC stabilizes and AI narratives heat up, mid-cap AI tokens have outperformed the index by 3x to 5x.

    If those conditions hold, our model sees a path to $5 to $6 by year-end 2026, with a stretch case toward $11 in 2027 if NEAR captures meaningful AI agent volume.

    Bear Case: What Could Send NEAR Back to $1

    The bear case is just as concrete. Three things to watch.

    Arthur Hayes exited his stake. On June 7, the BitMEX co-founder sold his full position in NEAR. He cited profit-taking and broader market risk. Hayes is a single trader, but his exit triggered a sharp dip and shows how sensitive the token still is to influencer flows.

    The AI trade can fade fast. If Anthropic delays its IPO into 2027, or if a high-profile AI failure (an agent that loses user funds, a hack, a regulatory action) shifts sentiment, the AI-tagged tokens will give back gains quickly. NEAR has rallied alongside the narrative. It can correct alongside it too.

    Token unlocks and supply pressure. NEAR’s inflation rate sits around 5% per year. Validator rewards and ecosystem grants keep new supply hitting the market. In a sideways tape, that supply is a slow drag.

    If those risks compound, the bear scenario points to a retest of $1.40, with a worst case at $1.20 if BTC corrects and AI sentiment unwinds together.

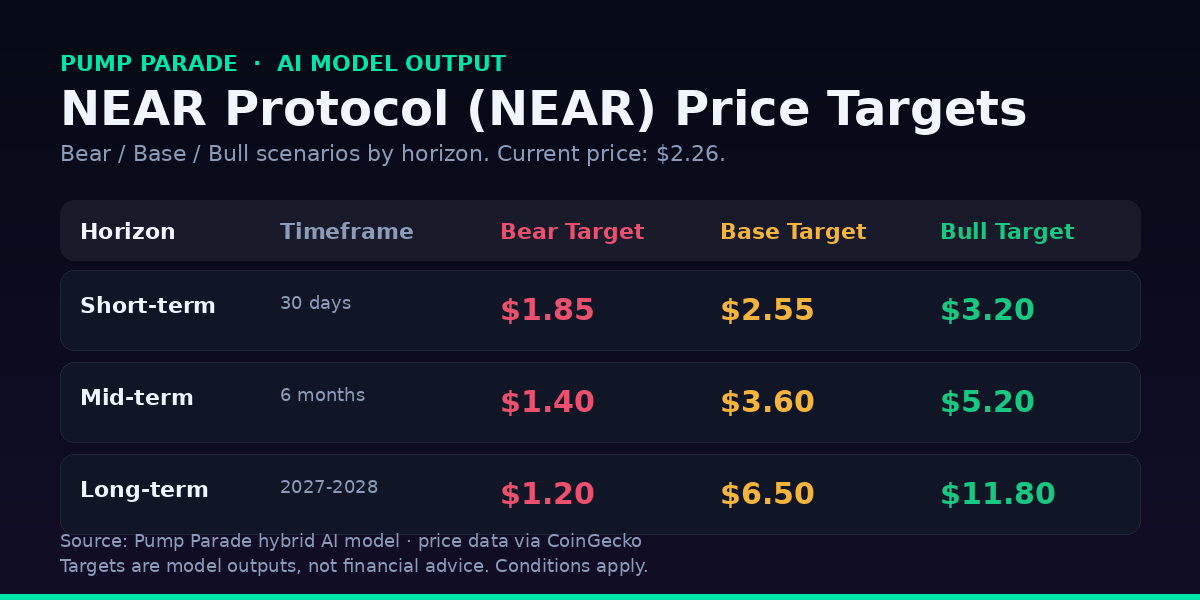
    NEAR Price Prediction Summary

    NEAR Protocol price prediction table for 2026 to 2028 with bear, base, and bull targets

    Here is how our hybrid AI model frames the next three horizons. Each scenario carries conditions, not guarantees.

    Short-Term (30 Days)

    • Bear: $1.85 (rejection at $2.65, broader risk-off)
    • Base: $2.55 (chop above $2.05, modest follow-through)
    • Bull: $3.20 (v2.13 launches clean, AI flows continue)

    Mid-Term (6 Months)

    • Bear: $1.40 (AI trade fades, BTC corrects to $50K range)
    • Base: $3.60 (sideways to up, NEAR holds AI mindshare)
    • Bull: $5.20 (Anthropic IPO prices, altcoin rotation, dev migration)

    Long-Term (2027 to 2028)

    • Bear: $1.20 (AI narrative deflates, NEAR loses ground to competitors)
    • Base: $6.50 (steady AI integration, normal cycle dynamics)
    • Bull: $11.80 (NEAR becomes a top-3 AI L1 by usage and TVL)

    Model confidence is highest on the short-term range. Long-term targets are sensitive to the AI narrative holding through the next bear market cycle, which is a strong assumption.

    What to Watch Next

    If you are tracking NEAR, four things matter more than the daily price action.

    1. v2.13 mainnet launch and the first auto-shard event. A clean rollout is the proof point for the whole thesis.
    2. NEAR AI agent volume. Look at active agents on the marketplace and the dollar value of transactions they sign. Real usage will show up there first.
    3. The $3.20 level. A daily close above $3.20 on strong volume opens the door to $4+ quickly. Failure to break it sets up a range trade.
    4. Anthropic IPO timing. A confirmed Q4 2026 pricing window keeps the AI bid alive. A delay into 2027 takes the wind out of the trade.

    The Bottom Line

    NEAR has the cleanest combination of catalysts among the AI-tagged layer 1s right now. A real technical upgrade. A real narrative tailwind. A real golden cross. None of that guarantees a price target. All of it shifts the probability higher than it was three months ago.

    The base case favors a grind toward $3.20, with $5+ on the table if v2.13 lands well and the AI trade stays in motion. The bear case is real, and the Hayes exit is a useful reminder that AI tokens can swing on a single headline.

    Watch the upgrade. Watch the level. And size accordingly.

    Disclaimer: This article is for informational and educational purposes only and should not be construed as financial, investment, or trading advice. Cryptocurrency markets are highly volatile, and past performance does not guarantee future results. The price predictions and analyses presented here are based on AI models, technical indicators, and available data at the time of writing. They are not guarantees. Always conduct your own research (DYOR) and consult with a qualified financial advisor before making any investment decisions. Pump Parade and its authors do not assume liability for financial losses incurred based on information provided in this article.
    Jupiter (JUP) Price Prediction 2026: Frontier Catalyst

    Jupiter (JUP) is trading at $0.1995 as of June 20, 2026, up 7.6% in the last 24 hours. The Solana DEX aggregator’s token has been the quiet winner of the week, climbing from $0.145 on June 11 to test resistance at $0.20. The catalyst: Solana Foundation just made Jupiter a core partner in its new Frontier Traders program, and Jupiter Mobile crossed $730M in monthly trading volume.

    So can JUP reclaim its $1.99 all-time high from January 2024? Or is the 90% drawdown a signal that the market has moved on? Here’s what the data says, plus our bull and bear targets through 2028.

    Jupiter (JUP) price prediction 2026 hero card showing current price $0.1995, +7.6% 24h change

    Jupiter (JUP) Overview: The Trading Layer of Solana

    Jupiter is the dominant DEX aggregator on Solana. It routes trades across every major liquidity venue to find the best price, then layers products on top: perpetuals, a launchpad, a mobile wallet, and soon a stablecoin called JupUSD. If you trade on Solana, you almost certainly touch Jupiter at some point.

    The token, $JUP, is a governance asset. It votes on protocol parameters, fee splits, and ecosystem grants. It also benefits from a buyback program funded by protocol fees, which has tightened circulating supply on the margin.

    Here are the numbers that matter, pulled live from Birdeye:

    • Price: $0.1995
    • 24h change: +7.6%
    • Market cap: $694M
    • Fully diluted valuation: $1.37B
    • Circulating supply: 3.48B JUP
    • Holders: 828K wallets
    • All-time high: $1.99 (Jan 2024)

    The drawdown from the ATH is roughly 90%. Brutal, but standard for governance tokens that launched at peak hype and then had to grow into their valuation.

    The Catalysts Driving JUP Right Now

    1. Solana Frontier Traders Program

    The Solana Foundation just named Jupiter a core partner in its Frontier Traders program, an initiative aimed at on-boarding high-volume traders to the Solana ecosystem. Translation: the foundation is steering institutional and pro trader flow toward Jupiter’s stack. JUP popped 10% on the announcement and has held the gains.

    2. Jupiter Mobile Hits $730M Monthly Volume

    Jupiter Mobile, the in-house wallet and trading app, just printed $730M in monthly trading volume. The app crossed 1 million downloads last year (up 290% year-over-year), and mobile has historically driven 10x to 100x user growth for DeFi platforms. This is real distribution, not vapor.

    3. JupUSD Stablecoin Launch

    Jupiter is launching JupUSD, a stablecoin backed by Ethena’s yield-bearing assets. If it captures even $500M of circulation, it pulls meaningful fee revenue back to the protocol. Aggressive estimates put potential supply at $1B to $2B within 12 months. Stablecoin issuance is one of the most reliable revenue engines in crypto.

    4. Perps Volume at $263B Annual Run Rate

    Jupiter Perps processed $263B in trading volume during 2025. Solana’s perpetuals market is the fastest-growing segment in DeFi, and Jupiter sits at the center of it. More volume means more fees, and more fees mean more buyback pressure on JUP.

    Technical Analysis: Reading the JUP Chart

    JUP’s chart is telling a recovery story, but the structure is still fragile.

    Key levels:

    • Support: $0.145 (June 11 swing low), then $0.12 (April basing area)
    • Resistance: $0.20 (current battle), then $0.27 (March 2026 high)
    • Major breakout level: $0.42 (the December 2025 rejection zone)

    The Relative Strength Index, or RSI, a momentum indicator that ranges from 0 to 100, is sitting near 62 on the daily chart. That is bullish but not yet overbought. The MACD, which tracks the difference between two moving averages, just printed a bullish crossover above the zero line for the first time since April. Both signals favor continuation, not exhaustion.

    The 50-day moving average sits at $0.168, now acting as dynamic support. The 200-day sits at $0.31, which doubles as a major medium-term target. A weekly close above $0.20 would be the first real confirmation that the trend has flipped from down to up.

    The Bull Case for JUP

    The bull thesis is straightforward: Jupiter is the toll booth of the most active blockchain in crypto, and the market is finally pricing that in.

    Solana volumes have surged on the back of meme trading, real-world asset tokenization, and the Alpenglow upgrade. Jupiter captures a share of nearly every trade. If Solana DEX volumes hit new highs in late 2026, JUP’s revenue follows mechanically.

    Layer in the JupUSD stablecoin, Jupiter Mobile distribution, and a tightening buyback program, and the setup resembles what BNB looked like before its 2024 run, a utility token tied to an entire ecosystem’s growth.

    If volumes hold and a spot Solana ETF brings fresh capital into the ecosystem, JUP has a credible path to retest $0.50 by year-end and approach the $1 mark by mid-2027.

    The Bear Case for JUP

    The bear case is just as concrete. Two big risks.

    Token unlocks. JUP has a heavy unlock schedule through 2028. Roughly 53M tokens unlock monthly, with a 200M cliff scheduled for February 2026 representing about 6% of circulating supply hitting the market in one day. Persistent sell pressure from team and ecosystem allocations could cap upside even in a bull tape.

    The FDV of $1.37B versus a circulating market cap of $694M means roughly half the supply is still locked. Holders who buy today are betting that demand grows faster than supply unlocks.

    Competitive pressure. Hyperliquid is eating perpetual market share across all chains. New aggregators on Solana, like DFlow and BananaGun’s routing layer, are pulling away niche flow. Jupiter’s moat is real but not unbreakable.

    If Solana volumes cool or unlocks overwhelm buyback demand, JUP can retest $0.12 quickly. A break below that level opens the door to the $0.08 to $0.10 range, where the project would essentially be valued at a fraction of its annualized fee revenue.

    JUP Price Predictions: Short, Medium, and Long-Term

    Based on our AI model output blended with on-chain trend data and the catalyst pipeline, here are the price ranges we are watching.

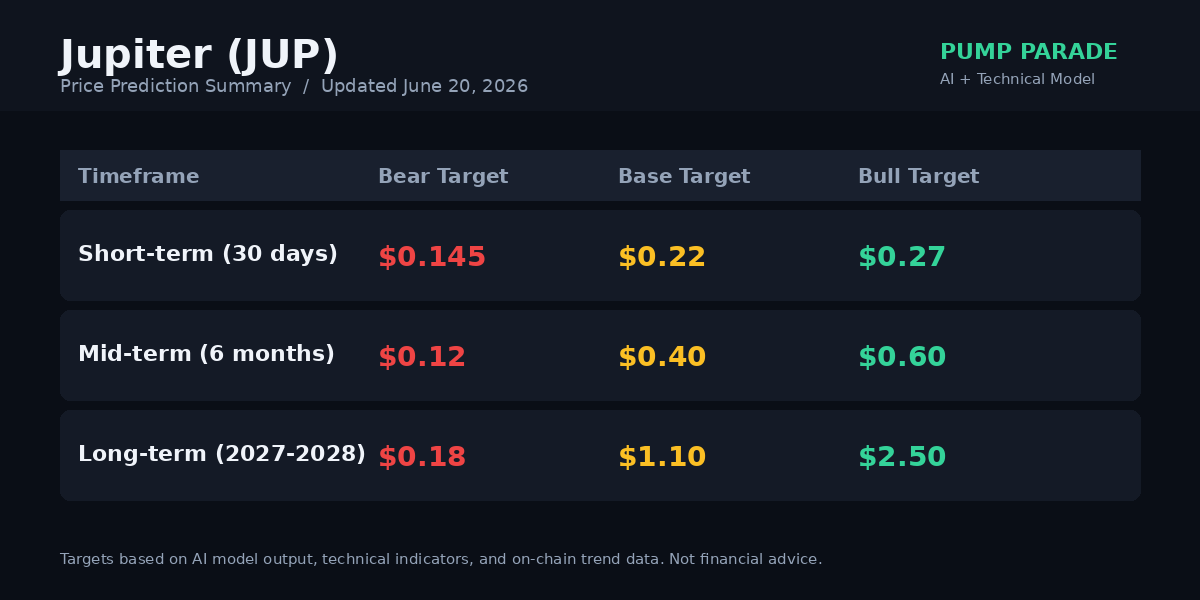
    Jupiter (JUP) price prediction summary table with short-term, mid-term, and long-term bear, base, and bull targets

    Short-term (next 30 days): JUP trades in a $0.17 to $0.27 range. A daily close above $0.20 with volume could push the token toward $0.27 quickly. A failure to hold $0.17 brings $0.145 back into view. Our base case is $0.22 with a 58% probability per the AI model.

    Medium-term (next 6 months): If Jupiter Mobile keeps compounding and JupUSD launches on schedule, we see a base case of $0.35 to $0.45 by year-end. The bull case extends to $0.60 if Solana ETF flows materialize. The bear case retests $0.12 if unlocks overwhelm demand.

    Long-term (2027 to 2028): The bull case for JUP rests on Solana becoming a dominant settlement layer for retail and institutional trading. In that world, JUP can revisit the $1.50 to $2 range and potentially set a new ATH above $2.50 by late 2027. The bear case is JUP trading in a $0.15 to $0.25 channel as unlocks absorb buyback flow. The most likely outcome lands somewhere between $0.80 and $1.30.

    How JUP Compares to Other Solana DEX Tokens

    Jupiter is not the only Solana DEX worth watching, but it has the broadest product stack. For a deeper comparison of how Jupiter stacks up against the leading EVM aggregator, see our earlier piece on Jupiter vs 1inch as the best DEX aggregator in 2026. The short version: Jupiter wins on Solana, but it has to keep innovating to stay ahead of cross-chain rivals.

    For broader market context, current JUP price data is also tracked at CoinGecko.

    What to Watch Next

    A few specific signals will tell you which scenario is playing out.

    • $0.20 weekly close: Confirms the trend reversal. Without it, treat any rally as a bounce.
    • JupUSD launch date and TVL ramp: The first $100M of supply will signal real product market fit.
    • Jupiter Mobile volume: If monthly volume crosses $1B, the mobile thesis is intact.
    • Token unlock absorption: Watch whether the February and quarterly unlocks get bought through, or whether they cap rallies.
    • Solana ecosystem health: JUP is a leveraged play on SOL. If SOL stalls below $130, JUP will struggle to break out.

    The Bottom Line on JUP

    Jupiter has the strongest product stack of any Solana-native protocol, a real revenue model, and a buyback program that ties price to usage. The Frontier Traders partnership and JupUSD launch are concrete near-term catalysts. The chart has flipped constructive.

    The unlocks are real and the competition is real. JUP is not a coin to ape into and forget. It is a setup to monitor, with clear levels that tell you whether the bull case is intact or whether the bear case is winning.

    At $0.20 with strong fundamentals and a heavy supply overhang, JUP is one of the more interesting risk-reward setups in the Solana ecosystem right now. Worth watching closely.

    Disclaimer: This article is for informational and educational purposes only and should not be construed as financial, investment, or trading advice. Cryptocurrency markets are highly volatile, and past performance does not guarantee future results. The price predictions and analyses presented here are based on AI models, technical indicators, and available data at the time of writing, they are not guarantees. Always conduct your own research (DYOR) and consult with a qualified financial advisor before making any investment decisions. Pump Parade and its authors do not assume liability for financial losses incurred based on information provided in this article.
    Litecoin (LTC) Price Prediction 2026: ETF Test

    0

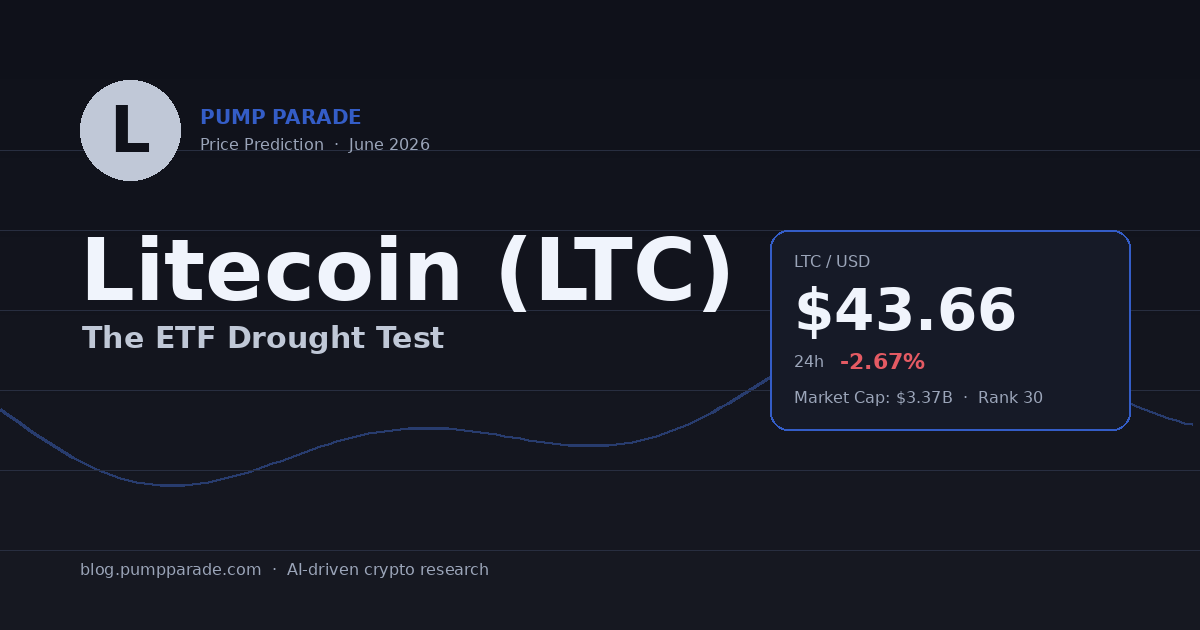
    Litecoin trades at $43.66 today, down 2.67% in 24 hours. That puts LTC roughly 89% below its all-time high near $410. Volume is steady at about $214 million, and market cap sits at $3.37 billion, good for rank 30 on the leaderboard.

    Here’s the thing: Litecoin has a spot ETF in the United States. Three of them, actually. So why is the price stuck in the low $40s? That gap between regulatory wins and price action is the entire LTC story right now. Let’s break it down.

    Litecoin LTC price prediction 2026 hero image showing current price and 24h change

    Where LTC Stands Today

    Litecoin is one of the oldest large-cap coins in crypto. Charlie Lee forked Bitcoin’s code in 2011 to make a faster, cheaper version. The pitch held up for years. Now the network sees roughly $214 million in daily volume, with 77.29 million LTC in circulation out of an 84 million max supply.

    That hard cap matters. Only about 6.7 million LTC are left to mine. By the next halving, expected around July 27, 2027, the network will have minted 87.5% of all LTC that will ever exist.

    The technical picture is less exciting. LTC trades below its 50-day and 200-day moving averages. RSI hovers near 50, the textbook definition of indecision. Translation: the market is waiting for a catalyst, and so far this year, every catalyst has underdelivered.

    The ETF Catalyst That Hasn’t Worked

    Canary Capital’s LTCC, the first U.S. spot Litecoin ETF, launched on Nasdaq in late October 2025. Eight months later, it holds roughly $5.43 million in net assets. For context, the first spot Bitcoin ETFs pulled in billions in their opening weeks.

    Worse, U.S. spot Litecoin ETFs have logged fifteen straight sessions of zero net inflows. Other altcoin ETFs, including products tied to XRP and Solana, are pulling capital. Litecoin is not. The bull case for LTC assumed ETF approval would unlock a wave of institutional buying. The data so far says no.

    There were a few bright spots. The SEC approved the T. Rowe Price Active Crypto ETF on June 14, with LTC among the eligible holdings. CoinShares and Grayscale also have spot Litecoin ETF filings in the pipeline. More wrappers may help, but only if demand actually shows up.

    This pattern is not unique to Litecoin. The broader altcoin-ETF era is testing a thesis that wrappers alone create buyers. Dogecoin is facing a similar test with its own ETF streak, and the results are mixed.

    What Could Actually Move LTC

    If the ETF inflow story is broken for now, what’s left? Three catalysts are worth watching.

    1. The 2027 Halving

    The next Litecoin halving cuts block rewards from 6.25 LTC to 3.125 LTC. Daily issuance drops from about 3,600 LTC to roughly 1,800. That is a real supply shock, and miners know it.

    Historically, LTC has rallied into halvings and sold off after. The 2019 halving saw LTC run from $30 to $140 in the six months before the event, then crash. The 2023 halving was quieter, with LTC trading sideways. Past performance is not a guarantee, but the setup is familiar.

    2. Payments and MimbleWimble

    Litecoin’s MimbleWimble Extension Block (MWEB) added optional privacy in 2022. Adoption was slow. But with privacy coins like Zcash rallying hard in 2026 on regulatory clarity, LTC could ride a similar tailwind if traders rediscover the feature.

    Payment adoption is the other angle. Litecoin still gets used at thousands of merchants through BitPay and similar processors. It is not a flashy narrative, but cheap and fast settlement on a battle-tested chain has value.

    3. Regulatory Tailwinds

    U.S. crypto regulation has been moving in favor of clean-cut, proof-of-work assets. Litecoin checks every box: no premine, no ICO, no foundation drama. If the CLARITY Act framework progresses and asset classification gets sorted, LTC may quietly benefit as a low-risk allocation for traditional finance.

    The Bear Case

    Now the other side of the trade. Litecoin has some real problems worth naming.

    Demand is the biggest one. The data is brutal. Spot ETFs are not pulling capital. On-chain transaction counts are well below 2021 peaks. The Lightning Network and various Layer 2s have taken much of the “fast and cheap payments” pitch that Litecoin used to own.

    Narrative is the second problem. Crypto runs on stories. Litecoin’s story, “digital silver,” has been around for over a decade. Newer chains like Solana, Sui, and Hyperliquid offer fresher, louder pitches. Capital tends to follow attention, and LTC is not getting much.

    Competition for the ETF dollar is the third issue. With spot ETFs now live for BTC, ETH, SOL, XRP, DOGE, LTC, and more, institutional buyers can pick winners. Litecoin needs to give them a reason. So far, it hasn’t.

    Technical Outlook

    The chart is messy. LTC has been pinned in a $42 to $56 range for most of June 2026. The 50-day SMA sits near $48 and is acting as resistance. The 200-day SMA near $55 is the next big level above that.

    RSI on the daily is at 50, meaning no clear momentum either way. MACD is flat. Volume on green days has been weaker than volume on red days, a subtle distribution signal.

    Key levels to watch:

    • Support: $40 (psychological), $35 (March 2026 low)
    • Resistance: $48 (50-day SMA), $55 (200-day SMA), $70 (Q1 2026 high)

    For the bullish case to activate, LTC needs a daily close above $55 on real volume. Without that, the range trade continues.

    Price Predictions

    Here are our model’s targets across three timeframes. These are scenarios, not promises.

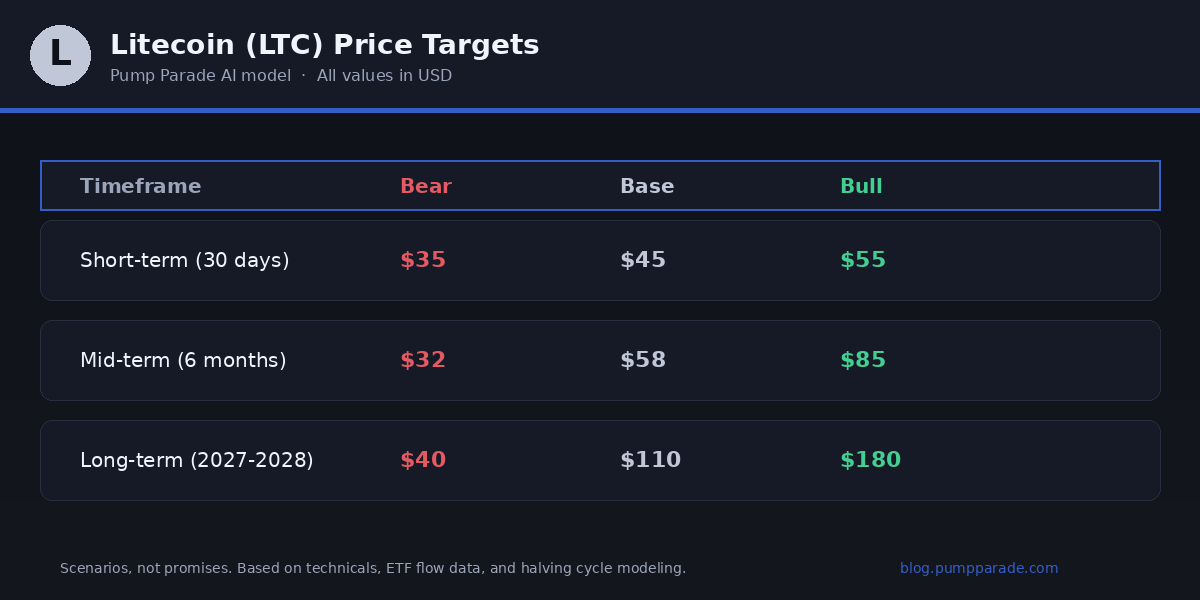
    Litecoin LTC price prediction targets table for short-term, mid-term, and long-term scenarios

    Short-term (Next 30 days)

    The path of least resistance is sideways. Without a fresh ETF inflow streak or a surprise macro tailwind, LTC likely chops between $40 and $55.

    • Bear case: $35. A break of $40 support drags LTC toward the March low.
    • Base case: $45. Range-bound action continues.
    • Bull case: $55. A surprise inflow week or BTC rally pulls LTC to the 200-day SMA.

    Mid-term (6 months)

    By Q1 2027, halving anticipation should start to build. Historically, LTC begins front-running its halving roughly 6 to 9 months out.

    • Bear case: $32. Continued ETF outflows plus a broader crypto correction.
    • Base case: $58. Halving narrative starts pricing in, light institutional buying returns.
    • Bull case: $85. A clean break above $70 plus rotational flows from BTC.

    Long-term (2027 to 2028)

    This is where the halving thesis lives. If history rhymes, LTC could see meaningful upside in the 12 months around the July 2027 event. But the magnitude has shrunk with each cycle.

    • Bear case: $40. The halving is a non-event, demand stays weak, LTC trades flat.
    • Base case: $110. Modest halving rally plus general altcoin season.
    • Bull case: $180. ETF inflows turn on, halving runs in full, and Litecoin reclaims a top 15 spot.

    The Bottom Line

    Litecoin is the cleanest, most regulated, longest-running large-cap crypto that nobody is buying right now. That is both the bear case and, in time, possibly the bull case.

    If you believe the altcoin-ETF era eventually delivers and that the 2027 halving setup rhymes with prior cycles, accumulating LTC in the low $40s is a setup worth monitoring. If you believe Litecoin has a permanent narrative problem and that capital will keep rotating to newer chains, this range is exactly where LTC deserves to trade.

    The data favors patience over conviction either way. Watch ETF flow data on CoinGecko and price action around $48 and $55. Those are the levels that will tell the story.

    Disclaimer: This article is for informational and educational purposes only and should not be construed as financial, investment, or trading advice. Cryptocurrency markets are highly volatile, and past performance does not guarantee future results. The price predictions and analyses presented here are based on AI models, technical indicators, and available data at the time of writing, they are not guarantees. Always conduct your own research (DYOR) and consult with a qualified financial advisor before making any investment decisions. Pump Parade and its authors do not assume liability for financial losses incurred based on information provided in this article.
    Zapper vs DeBank: Best Crypto Portfolio Tracker 2026

    0

    The two biggest names in crypto portfolio tracking finally go head-to-head. We tested both in 2026 to find out which one deserves a permanent tab in your browser.

    If you hold tokens across more than one chain, you have probably already met the pain of trying to add up your net worth across wallets, exchanges, lending positions, LP tokens, and the random NFT you forgot you minted. Two products dominate this category in 2026: Zapper and DeBank. Both let you punch in a wallet address and see everything that wallet owns. Both are free. Both have been around since the early DeFi summer. But they have grown into two very different products, and picking the right one depends entirely on how you trade and what chains you actually use.

    This review compares them across chain coverage, supported protocols, fees, security, social features, mobile experience, and overall UX. By the end you will know exactly which tracker fits your workflow.

    TL;DR: The Quick Verdict

    • Best for Solana, Bitcoin, and multi-chain users who want to trade in-app: Zapper.
    • Best for EVM power users who want the deepest DeFi position parsing and a social feed: DeBank.
    • Best free tier: Tie. Both give you the core tracking experience without paying a cent.
    • Overall winner for most readers: Zapper, because of its broader chain coverage (including Bitcoin and Solana) and built-in swaps.

    If you only ever touch Ethereum, Arbitrum, Base, and other EVM chains, DeBank is still our pick. If your bags live on more than one ecosystem, Zapper wins.

    Product Overviews

    Zapper

    Zapper launched in 2020 and was one of the first tools to make DeFi positions human-readable. In 2026 the consumer app supports 60+ chains including Ethereum, Base, Arbitrum, Optimism, Polygon, BNB Chain, Avalanche, Solana, and Bitcoin. Its data layer powers Coinbase, Rainbow, and other major wallets, which is a strong signal that the underlying infrastructure is enterprise grade.

    The standout feature is “Zaps,” one-click multi-step DeFi actions. Want to take ETH, swap it to a stablecoin, and deposit it into a yield vault in one transaction? Zapper handles the whole flow. It is the rare product that lets you go from “tracking” to “doing” without leaving the page.

    Zapper portfolio tracker product preview

    DeBank

    DeBank is the EVM specialist. In 2026 it claims support for 100+ EVM-compatible chains and 1,300+ DeFi protocols, which is genuinely the deepest on-chain coverage in the category. It does not support Solana or Bitcoin, and it never tries to be a swap interface. Instead, it doubles down on two things: parsing complex DeFi positions (concentrated liquidity, lending, staking, derivatives) and Web3 social.

    The social layer, called DeBank Stream, is essentially Twitter for wallets. Every post is tied to a verified on-chain identity, so when a whale brags about a 10x trade you can actually verify it. There is also a Web3-native messenger and a “Follow” feature for tracking smart money wallets.

    DeBank portfolio tracker product preview

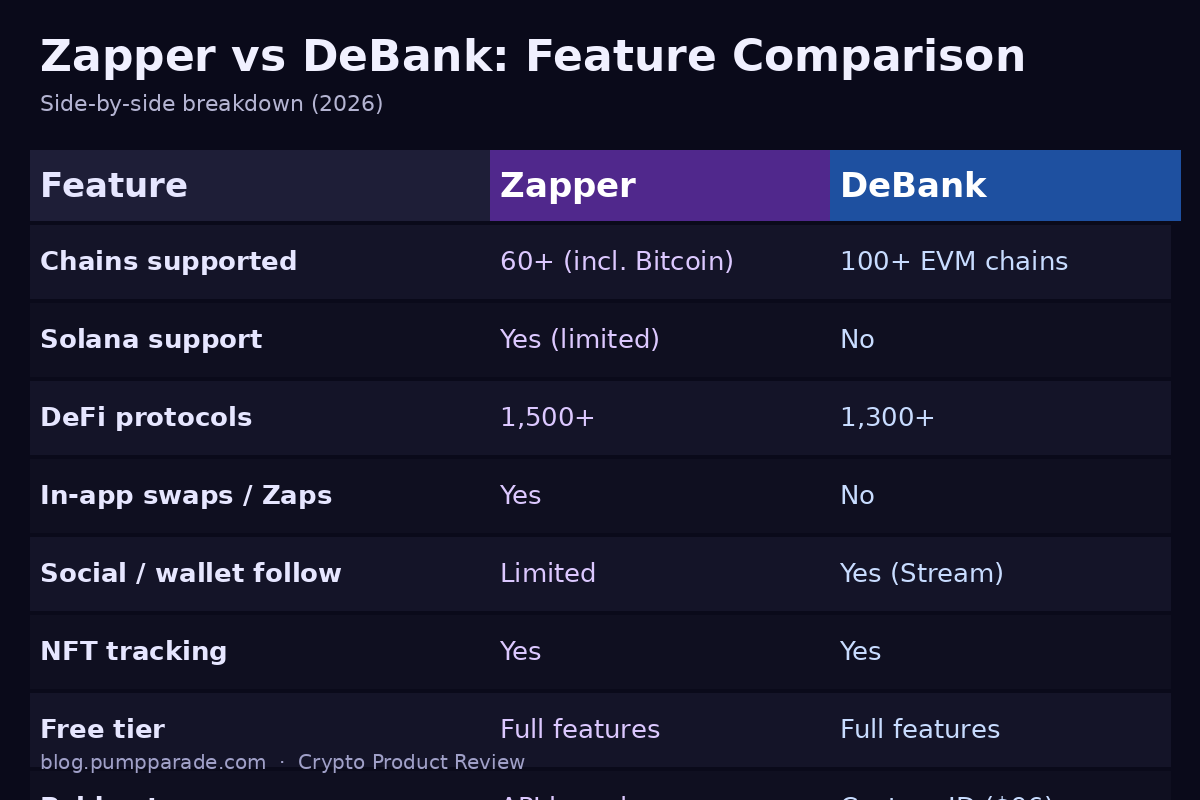
    Zapper vs DeBank feature comparison table

    Chain Coverage

    This is the single biggest difference between the two products. Zapper covers 60+ networks that span EVM, Solana, and Bitcoin. The Bitcoin support is recent and rare, and the Solana coverage finally caught up to where multi-chain traders need it to be. DeBank stays in EVM land with 100+ chains, including every L2 you have heard of (Base, Arbitrum, Optimism, Linea, zkSync, Scroll, Mantle, Manta Pacific) plus a long tail of newer chains.

    If your portfolio touches Solana, Hyperliquid, or Bitcoin, DeBank simply will not show you the full picture. You will end up running two tabs. If you live entirely on EVM rails, DeBank actually has slightly broader chain depth than Zapper at the long tail.

    DeFi Protocol Support

    DeBank wins on raw protocol count. It parses 1,300+ protocols and is particularly good at the messy ones: Uniswap V3 concentrated liquidity positions with accurate range and fees, Pendle yield-bearing tokens shown with maturity dates, GMX and Hyperliquid perp positions with full PnL, and complex Aave or Morpho lending positions broken out by asset.

    Zapper covers 1,500+ apps according to its own data, but in practice the parsing is slightly less detailed for the most obscure protocols. Where Zapper pulls ahead is in showing the actions available next to each position. See a position you want to exit? The Zap button is right there.

    Fees and Pricing

    Both products have generous free tiers. Here is the honest breakdown.

    Zapper. Portfolio tracking, NFT viewing, transaction history, the social feed, and basic swaps are free. Zapper charges a small fee on Zap transactions (typically a few basis points on the swap component, plus the underlying DEX fee). The developer API has paid plans for businesses, but consumer users never have to pay.

    DeBank. Everything that matters is free. Multi-chain tracking, wallet following, DeFi parsing, DeBank Stream, and the messenger all cost nothing. The paid extras are vanity items: a custom DeBank ID costs around $96 (one-time), and there are some advanced social features behind a small fee. None of it is required to use the product.

    Verdict: free vs free. Neither one nickel-and-dimes the user, which is refreshing in a space where every other tool is trying to launch a token or a Pro tier.

    Security and Trust

    Crypto trackers are read-only by default, which is the main reason they are safer than the wallets they monitor. You give them a public address, not a private key. That said, security still matters when you connect a wallet to execute a transaction.

    Both companies have multi-year track records and have powered millions of dollars in DeFi activity without a major incident. Zapper has been audited multiple times (most recently by Pessimistic and others) and uses well-known router contracts for its Zaps. DeBank’s surface area for risk is smaller because it does not handle transactions itself, but its data has been the source of truth for projects like Lido, Compound, and dozens of fund dashboards.

    The realistic risk is not the tracker itself. It is the wallets and approvals you connect through it. DeBank’s approvals dashboard, which shows every token allowance you have ever signed and lets you revoke them, is one of the most useful security features in either product. If you do nothing else after reading this article, go run that scan on your main wallet.

    User Experience and Mobile

    This is where personal taste kicks in.

    Zapper feels like a modern fintech app. The portfolio view is dense without being cluttered, the NFT gallery is genuinely beautiful, and the iOS and Android apps are kept in sync with the web product. The “Activity” feed of recent transactions across the network is also addictive for anyone who likes watching on-chain action in real time.

    DeBank is more spreadsheet-like. The web UI is information-dense and prioritizes precision over polish. Power users tend to prefer it because every number is exactly where you expect it to be. The mobile app is solid but not as feature-complete as the web version. DeBank Stream is the wildcard here: if you want to follow the wallets of well-known traders and see what they are doing in real time, no other product offers anything close.

    NFT Tracking

    Zapper has the better NFT experience overall. High-resolution media, accurate floor prices across the major marketplaces, traits, rarity scores, and one-click listing through aggregators. DeBank has NFT support but treats it as a secondary concern, mostly showing collections with floor prices and basic metadata. If you actually trade NFTs, use Zapper.

    Social Features

    This is DeBank’s signature win. DeBank Stream turned out to be one of those features people did not know they wanted. You follow a wallet, you see their swaps, mints, and posts. You can verify holdings claims with one click. The trolling is real, the alpha is occasionally real, and the platform has built a small but engaged community of on-chain natives.

    Zapper has Farcaster integration and a feed of activity across followed wallets, but it is more of a discovery tool than a social network. It works well, but it is not where the on-chain conversations happen.

    Pros and Cons

    Zapper Pros

    • 60+ chains including Solana and Bitcoin
    • In-app Zaps for one-click DeFi actions
    • Best-in-class NFT viewing experience
    • Polished mobile apps
    • Powers Coinbase, Rainbow, and other major wallets (data quality signal)

    Zapper Cons

    • Slightly thinner parsing for obscure DeFi protocols
    • Small fee on Zap transactions
    • Social features are an afterthought

    DeBank Pros

    • Deepest DeFi position parsing in the category
    • DeBank Stream social layer with verified wallet posts
    • Token approval revoker that may save you from a future drain
    • Free across the board for what matters
    • Web3 messenger built in

    DeBank Cons

    • No Solana, no Bitcoin, no non-EVM support
    • No in-app swaps or transactions
    • UI is more spreadsheet than app
    • NFT experience is basic

    Side-by-Side: At a Glance

    For readers who scrolled straight here, the short version is in the comparison graphic above. The cliff notes:

    • Multi-chain breadth: Zapper
    • EVM depth and protocol coverage: DeBank
    • In-app actions: Zapper
    • Social and following: DeBank
    • NFTs: Zapper
    • Cost: Tie

    Who Should Use Which

    Pick Zapper if you are a multi-chain user (especially anyone with Solana or Bitcoin exposure), if you actually trade NFTs, or if you want to swap and rebalance without leaving the tracker.

    Pick DeBank if you are an EVM-first power user, if you run yield strategies that involve concentrated liquidity or complex lending positions, if you care about token approval hygiene, or if you want to follow the on-chain moves of specific wallets through DeBank Stream.

    Honestly, the best workflow for serious users is to use both. Zapper as the daily-driver tracker and execution layer. DeBank for deep EVM audits, approval revokes, and social. They cost nothing, so there is no real downside to running both.

    Final Verdict

    If we had to pick only one for the average reader of this site, it is Zapper. Solana and Bitcoin support is no longer optional in 2026, and the ability to execute trades without bouncing to another tab is a real productivity win. DeBank is still excellent, and it is the right choice for an EVM-only audience, but Zapper’s chain breadth and Zaps push it over the line.

    Rating: Zapper 4.6 / 5 · DeBank 4.4 / 5

    Looking for more reviews of trading tools? See our breakdown of Jupiter vs 1inch for the best DEX aggregator in 2026, or our Phantom Wallet review for the best Solana wallet pairing.

    FAQ

    Is Zapper or DeBank safer to use?
    Both are read-only by default, which means giving them your public wallet address does not expose your funds. The risks come from connecting your wallet to sign transactions (Zapper) or signing token approvals on the underlying protocols (both). DeBank’s approval revoker is one of the strongest security tools either product offers.

    Does DeBank support Solana?
    No. DeBank is EVM-only in 2026. If you have Solana positions you need a different tracker, and Zapper is currently the most complete option that covers both ecosystems.

    Do I need to pay for Zapper or DeBank?
    No. Both have full free tiers for portfolio tracking. Zapper charges small fees on Zap transactions. DeBank’s paid items (custom ID, advanced social) are entirely optional.

    Can I track multiple wallets with both products?
    Yes. Both let you bundle multiple addresses into a single portfolio view. Zapper’s “Bundle” and DeBank’s “Watchlist” are equivalent features.

    Which one has better NFT support?
    Zapper, by a wide margin. The viewer is polished, the floor prices are accurate, and you can list and buy without leaving the app.

    Can either replace a tax tool like CoinTracker?
    Not really. Both show your current state and recent history beautifully, but neither generates tax-ready cost basis reports across every transaction. Use them as the daily tracker, then export to a dedicated tax tool at year end.

    Disclosure: Pump Parade may earn affiliate revenue if you sign up to certain products through the links in this article. This does not influence our editorial verdict. All testing was done with our own wallets.

    Worldcoin (WLD) Price Prediction 2026: $10 in Sight?

    Worldcoin (WLD) is trading at $0.62, after ripping 157% in the last 30 days and posting back-to-back weeks of green candles. The token most people had written off as dead is now one of the loudest stories on crypto Twitter. The rally is being driven by a rare mix: a public 8.4% supply buyer, a Sam Altman halo, and a tokenomics change that cuts daily emissions by 43%.

    So is $10 actually on the table, or is this the kind of squeeze that fades the second the unlock narrative shifts? This Worldcoin price prediction for 2026 looks at what changed, what the chart is telling us, and what realistic targets look like across short, mid, and long timeframes.

    Worldcoin WLD price prediction 2026 with current price $0.625 and 156% 30-day gain

    Worldcoin (WLD) Snapshot: Where the Token Sits Today

    The numbers, pulled from CoinGecko at the time of writing:

    • Price: $0.625
    • Market cap: $2.14 billion
    • 24-hour volume: $1.65 billion
    • Circulating supply: 3.41 billion (of 10 billion max)
    • 24h change: -3.66%
    • 7-day change: +28.99%
    • 30-day change: +156.98%
    • All-time high: $11.74 (March 2024)
    • All-time low: $0.23 (May 2026)

    Translation: WLD bottomed about a month ago, then more than doubled. It is still down 95% from its 2024 peak, which is the part bulls love to point at when they pitch the “asymmetric upside” idea. Bears point at the same chart and call it dead cat territory.

    Both sides are looking at real data. The question is which set of catalysts wins from here.

    What Is Worldcoin, in Plain Terms

    Worldcoin (rebranded to “World”) is the crypto project co-founded by OpenAI CEO Sam Altman. The pitch is simple: as AI agents flood the internet, you need a way to prove a human is actually a human. World’s answer is the Orb, a device that scans your iris and issues you a “World ID” plus a small amount of WLD tokens.

    The project now claims over 16 million verified users. Deployments are expanding across Latin America, Asia, and parts of the United States after a regulatory thaw earlier this year. WLD is the token that ties the network together: it is used for incentives, governance, and increasingly as a unit of payment inside World apps.

    The bull thesis in one line: in an AI-first internet, the proof-of-human layer is infrastructure, and infrastructure layers tend to be worth a lot.

    The Catalyst Stack: Why WLD Is Moving Now

    1. Eightco Holdings Quietly Bought 8.4% of Circulating Supply

    The single biggest driver of the rally was the disclosure that Nasdaq-listed Eightco Holdings (ORBS) holds 283.45 million WLD tokens, equal to about 8.4% of circulating supply. The position is part of a roughly $406 million treasury that also includes indirect OpenAI equity exposure.

    This is not a random degen wallet. It is a public company putting WLD on its balance sheet, which means quarterly reporting, audit trails, and a built-in incentive to defend the price. The market read this as institutional validation and bid the token 20% in a single session, with follow-through buying through the week, according to Yahoo Finance.

    2. The July 24 Unlock Rate Cut (a Real, Mechanical Bull Case)

    Here is the part most casual readers are missing. On July 24, 2026, WLD’s daily unlock schedule changes:

    • World Community Token unlocks drop from 3.2M WLD per day to 1.6M (a 50% cut)
    • Investor and team unlocks drop from 1.9M WLD per day to 1.3M (a 32% cut)
    • Aggregate daily emissions fall ~43%, from roughly 5.1M to 2.9M WLD per day

    In plain terms, the daily sell pressure that has weighed on WLD all year is about to drop by almost half. That does not guarantee a rally, but it removes a meaningful tailwind for shorts. Supply-side relief is one of the cleanest setups in token analysis, and the market is pricing some of it in already.

    3. The OpenAI IPO Whisper

    Sam Altman’s involvement is the soft catalyst. Every credible report on a potential OpenAI IPO sends a reflex bid into WLD because traders see it as the closest liquid proxy. The link is not formal: WLD is not OpenAI equity. But narrative trades do not need a legal connection, only a believable story. As long as that story keeps refreshing, WLD will get a beta to it.

    Technical Analysis: What the Chart Says

    WLD is in a clear uptrend on the daily, with the structure looking like a textbook accumulation-to-markup transition.

    Key levels to watch:

    • Immediate support: $0.55 (prior breakout zone). Losing this opens the door back to $0.45.
    • Major support: $0.45 to $0.48 (volume shelf from late May).
    • Immediate resistance: $0.72 (recent local high).
    • Major resistance: $1.00 (psychological level and prior consolidation).
    • Stretch target: $1.85 (38.2% Fib retracement from the 2024 ATH).

    Momentum indicators:

    • The daily RSI is at 68, just under overbought. That is a warning, not a sell signal. Strong uptrends often run with RSI between 65 and 80 for weeks.
    • MACD is positive with a widening histogram, confirming momentum is still building.
    • Price is above the 20, 50, and 200-day moving averages. The 50-day just crossed above the 200-day, a “golden cross” that historically lines up with multi-month uptrends.

    What the chart is telling us: the move is real and structurally healthy, but a 5% to 15% pullback to retest $0.55 would be normal and probably welcome before any push at $1.

    The Bull Case: How WLD Gets to $5 and Beyond

    The bull setup is straightforward if you accept three premises:

    1. Daily emissions drop 43% in late July, easing sell pressure
    2. OpenAI continues to dominate AI headlines, keeping the narrative bid intact
    3. Eightco’s position signals more corporate treasury demand, similar to how MicroStrategy seeded a BTC treasury trend

    If all three hold, WLD does not need a miracle to retrace toward the $5 to $10 range that some analysts at CoinCentral have started flagging. The Fibonacci 1.618 extension from the recent base sits near $9, which is where most TA-driven longs are targeting if $1 breaks cleanly.

    For perspective, $10 WLD at current circulating supply implies a market cap of about $34 billion. That would put it near the size of today’s top 15 tokens. Aggressive, but not historically absurd for a project with a real user base and an AI narrative behind it.

    The Bear Case: Why This Could Stall Hard

    Now the other side, because no serious analysis ignores it.

    1. Supply is still the dominant story long term. Only 34% of WLD’s max supply is in circulation. Even with the July unlock rate cut, the network keeps issuing about 2.9M tokens per day. At $0.62, that is roughly $1.8 million of new supply hitting the market daily. Demand has to absorb that consistently for the price to keep rising.

    2. Regulatory risk has not gone away. Iris scanning is still a political flashpoint in several jurisdictions. A high-profile pushback in any major market could spook the narrative quickly.

    3. The Eightco buy is a single buyer. Concentrated positions cut both ways. If ORBS ever needs liquidity, a partial unwind would print on every trading desk in crypto and likely trigger a sharp drop.

    4. WLD is reflexive to AI sentiment. If the AI trade cools, even temporarily, WLD will get hit harder than tokens with independent narratives.

    Invalidation level for the current bull setup: a daily close below $0.45. Below that, the recent base breaks and the technical case has to be reset.

    WLD price targets table for 30 days, end of 2026, and 2027-2028

    Worldcoin (WLD) Price Predictions by Timeframe

    Combining technicals, on-chain context, and the catalyst calendar, here is how our model frames the next 30 days, 6 months, and out to 2027 to 2028. These are scenarios, not promises.

    Short-term (next 30 days): Expect chop between $0.55 and $0.85 as the market absorbs profit-taking ahead of the July 24 unlock change. A breakout above $0.85 on volume would set up a run at $1. A break below $0.55 invalidates the immediate setup.

    Mid-term (6 months, end of 2026): If the July unlock cut lands and OpenAI news flow stays supportive, the base case is a grind toward $1.50 to $2.50. The bull case extends to $3.50 if a second corporate treasury announcement or a high-profile World ID integration hits. Bear case revisits $0.40.

    Long-term (2027 to 2028): This is where the AI infrastructure thesis either gets paid or does not. If World ID becomes a default proof-of-human standard inside major AI platforms, $5 to $10 is on the table. If the network plateaus and adoption stalls, expect WLD to range between $0.80 and $2.

    (See the prediction graphic below for the bear, base, and bull targets at a glance.)

    What to Watch From Here

    • July 24, 2026: Unlock rate cut goes live. This is the single biggest mechanical catalyst on the calendar.
    • Eightco quarterly filing: Any update on position size, hedging, or rebalancing.
    • OpenAI IPO headlines: Confirmed or denied, both move the token.
    • World ID integrations: Especially with consumer AI platforms or major social apps.
    • $1.00 reclaim: Daily close above this opens the path to $1.85 and the broader uptrend continues.

    For broader context on how AI-linked tokens are setting up in this cycle, see our recent Bittensor (TAO) price prediction, which covers the AI ETF narrative shaping the sector.

    The Bottom Line

    WLD is one of the cleaner setups in crypto right now: a fresh base, a credible corporate buyer, a mechanical reduction in sell pressure, and a narrative engine tied to the most-watched company in tech. None of that guarantees the move continues, but the risk-reward at $0.62 with $0.45 as a clear invalidation level is better than most tokens trading on vibes alone.

    Smart positioning: respect the trend, define risk at $0.45, take profits in tranches above $1, and reassess hard if the July unlock event lands and the price fails to hold the gains. This is a story trade with real fundamentals attached. Treat it as both.

    Disclaimer: This article is for informational and educational purposes only and should not be construed as financial, investment, or trading advice. Cryptocurrency markets are highly volatile, and past performance does not guarantee future results. The price predictions and analyses presented here are based on AI models, technical indicators, and available data at the time of writing, they are not guarantees. Always conduct your own research (DYOR) and consult with a qualified financial advisor before making any investment decisions. Pump Parade and its authors do not assume liability for financial losses incurred based on information provided in this article.
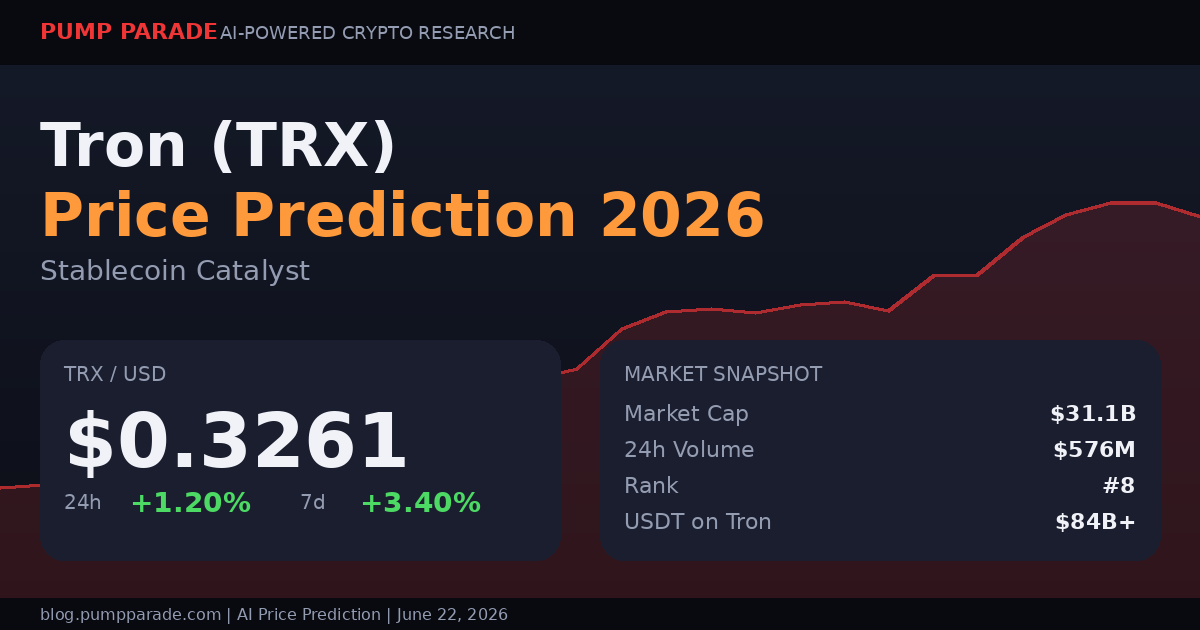
    Pump.fun (PUMP) Price Prediction 2026: GO Catalyst

    Pump.fun’s token sits at $0.00148 on June 17, 2026. That is down 6.6% in 24 hours, up 1.6% on the week, and roughly 87% below the July 2025 all-time high of $0.01214. The chart looks ugly. The business does not.

    Here is the tension that defines this trade. Pump.fun pulled in $124.7 million in Q1 2026 revenue, about 30% of Solana’s total app revenue. It just burned $370 million worth of PUMP in April. It launched a new product called GO on June 5. And on June 12, a 10 billion token unlock hit one of the thinnest memecoin tapes Solana has seen all year. So which signal wins, the cash machine or the supply wall? Let’s break down both sides.

    Pump.fun PUMP price chart and 24h change June 2026

    What PUMP Is, in Plain Terms

    Pump.fun is the largest memecoin launchpad on Solana. Anyone can mint a token in seconds, and the platform takes a fee on every trade. The PUMP token was sold in a public ICO in July 2025 that raised $600 million in 12 minutes. The token captures part of that fee stream through a buyback-and-burn program.

    In April 2026, Pump.fun changed how that program works. The team burned $370 million of PUMP, which was 36% of the circulating supply at the time. Going forward, 50% of net revenue is committed to ongoing market buybacks. The other 50% funds product bets like GO. Both moves were reported in detail by The Block.

    The result is a token with a simple thesis: if revenue stays high, buybacks soak up float and the price has a floor. If revenue dries up, the unlock schedule wins.

    Current Price Context and Key Levels

    Here is the on-chain snapshot from Birdeye at time of writing:

    • Price: $0.00148
    • 24h volume: $11.3 million
    • Liquidity: $16.4 million on Solana
    • Holders: 121,053
    • 30-day range: $0.00137 to $0.00183
    • Circulating supply: ~857.8 billion PUMP

    The chart is sideways with a slight downward drift. PUMP is testing the lower third of its 30-day range. The $0.00137 level acted as the local floor on June 10 and again on June 13. Above, $0.00163 is the first ceiling, followed by $0.00183 from May highs.

    Technical indicators are mixed. RSI (the Relative Strength Index, a momentum reading from 0 to 100) is hovering near 42 on the daily, which signals weakness but not oversold conditions. The 20-day moving average is rolling over. The MACD (Moving Average Convergence Divergence, a trend indicator) is flat. In plain terms: no clear buyers, but no panic either.

    The Bull Case for PUMP

    Three things matter for the upside.

    1. The cash flow is real. Pump.fun generated $124.7 million in Q1 2026 alone. Even with memecoin volumes cooling, the platform booked roughly $1.59 million in revenue on June 12 according to live snapshots. Half of that flow now goes to buybacks. At current prices, that is a steady bid no other token of this size has.

    2. GO opens a second product line. The GO platform launched on June 5 as a decentralized bounty marketplace. Users post a task, lock funds in escrow, and pay whoever completes it. The launch drew $144,000 in bounties within hours. The product is controversial, and we will get to that in the bear case. But it is the first time Pump.fun has shipped a second business since the launchpad debuted.

    3. The float just got smaller. The April burn removed 36% of the circulating supply in a single transaction. That is not marketing fluff. Combined with the 50% buyback policy, the supply trajectory now points down even with scheduled unlocks. If revenue holds, buybacks alone will absorb the July 12 unlock of 82.5 billion PUMP over a few quarters.

    Bull-case targets, assuming Solana memecoin volumes recover to half their early-2026 average and GO finds product-market fit, sit between $0.0030 and $0.0048 by year-end. That is a 2x to 3x from current prices, well short of the 2025 ATH.

    The Bear Case for PUMP

    Three things matter for the downside.

    1. The memecoin tape is cracking. Solana DEX memecoin volume fell from $5.2 billion in the week of June 5 to about $1.1 billion by June 14. That is a near 80% drop. Pump.fun’s revenue is volume-dependent. If trading stays thin into Q3, buyback firepower drops with it.

    2. The unlock schedule is heavy. The June 12 unlock added 10 billion PUMP, worth around $14.2 million, to a market with thin order books. The next major unlock on July 12 is roughly eight times larger at 82.5 billion tokens. Even with buybacks running, that is a wall of supply hitting a market where retail interest has cooled.

    3. Regulatory heat is rising. New York Governor Kathy Hochul publicly targeted the GO platform after some early bounties pushed extreme content. The story was covered by BeInCrypto and other outlets. If state or federal action follows, GO could lose users before it scales. That removes one of the three pillars of the bull thesis.

    Bear-case targets, if memecoin volumes keep contracting and GO faces enforcement action, point to a retest of $0.00120 in the short term and a 2026 low near $0.00095 if the July unlock finds no bid. That is roughly 35% to 50% downside from current levels.

    AI Model Price Predictions

    PUMP price prediction targets: short-term, mid-term, long-term bear base bull

    Our hybrid AI model blends on-chain flow data, buyback velocity, technical structure, and Solana ecosystem sentiment. Here is what it sees across three time horizons.

    Short-term (30 days): The model assigns a 58% probability that PUMP holds the $0.00137 to $0.00163 range. A break above $0.00163 on rising volume opens a path to $0.00195. A break below $0.00137 invites a flush to $0.00120. Base case target: $0.00155.

    Mid-term (6 months): By Q4 2026, three outcomes look credible. The bear path lands near $0.00110 if memecoin volume keeps falling and GO stalls. The base path lands near $0.00230 if revenue stabilizes at Q1 levels. The bull path reaches $0.00380 if GO scales and Solana memecoin volume recovers above $3 billion per week. Base case target: $0.00230.

    Long-term (2027-2028): The model leans cautiously constructive. If Pump.fun retains 25%+ of Solana app revenue and the buyback program continues uninterrupted, a return toward the $0.0060 to $0.0085 zone becomes plausible by mid-2028. A full retrace to the $0.01214 ATH requires both volume recovery and a new product line beyond GO. The model assigns a 22% probability to that scenario. Base case target: $0.0070.

    Confidence scores: short-term 64%, mid-term 51%, long-term 38%. The further out, the less the model trusts itself, which is the honest answer for any memecoin-adjacent asset.

    What to Watch From Here

    Three concrete signals decide which path PUMP takes:

    July 12 unlock absorption. If price holds above $0.00130 through the unlock day, buybacks are working. If it breaks lower on heavy volume, the supply story wins. This is the cleanest test of the buyback thesis in 2026.

    GO daily bounty volume. Track whether GO sustains $500,000-plus in daily locked bounties through the end of June. Anything less, and the second product line is a marketing event, not a business. Anything more, and Pump.fun has a credible Story Two.

    Solana memecoin weekly volume. Watch the weekly aggregate. A return above $2.5 billion per week revives the fee engine. Staying near $1 billion confirms the slowdown is structural, not cyclical. For context on how memecoin volume affects related tokens, see our Bonk price prediction, which tracks the same dynamic from a different angle.

    You can verify current PUMP data and trading activity directly on CoinGecko or Birdeye before acting on any of this.

    Bottom Line

    PUMP is the rare memecoin-adjacent token with real revenue and a real buyback. It is also fighting a brutal unlock schedule into a cooling market. The asymmetric setup tilts slightly positive, but only if Pump.fun’s revenue holds through Q3 and GO finds traction without regulatory blowback.

    The 87% drawdown from ATH already prices in a lot of pain. The question is whether the floor at $0.00120 to $0.00137 holds the next time supply hits the tape. That answer comes by mid-July.

    Would we put $1,000 into PUMP today? Only as a small, sized position with a clear stop below $0.00120, and only if you have a six-month horizon. This is not a trade for tight stops or weak hands.

    Disclaimer: This article is for informational and educational purposes only and should not be construed as financial, investment, or trading advice. Cryptocurrency markets are highly volatile, and past performance does not guarantee future results. The price predictions and analyses presented here are based on AI models, technical indicators, and available data at the time of writing, they are not guarantees. Always conduct your own research (DYOR) and consult with a qualified financial advisor before making any investment decisions. Pump Parade and its authors do not assume liability for financial losses incurred based on information provided in this article.