More
    Home Blog Page 16

    BNB Price Prediction 2026: Can BNB Defend $600?

    0

    BNB is trading at $599 at time of writing, down 11% over the past 7 days and roughly 56% below its October 2025 all-time high of $1,369. The token is sitting right on the line that every BNB chart trader is watching: the $600 psychological support zone.

    For a coin that just completed a $1.02 billion quarterly burn and watched its Layer-1 real-world asset value surge 76% in Q1, that price action looks disconnected from fundamentals. Our hybrid AI model assigns a 58% probability that BNB defends the $600 zone and recovers toward $720 by Q3 2026. The bear case, however, is far from dead.

    Here is what the data says about BNB’s setup heading into the back half of 2026, plus our short, medium, and long-term price targets.
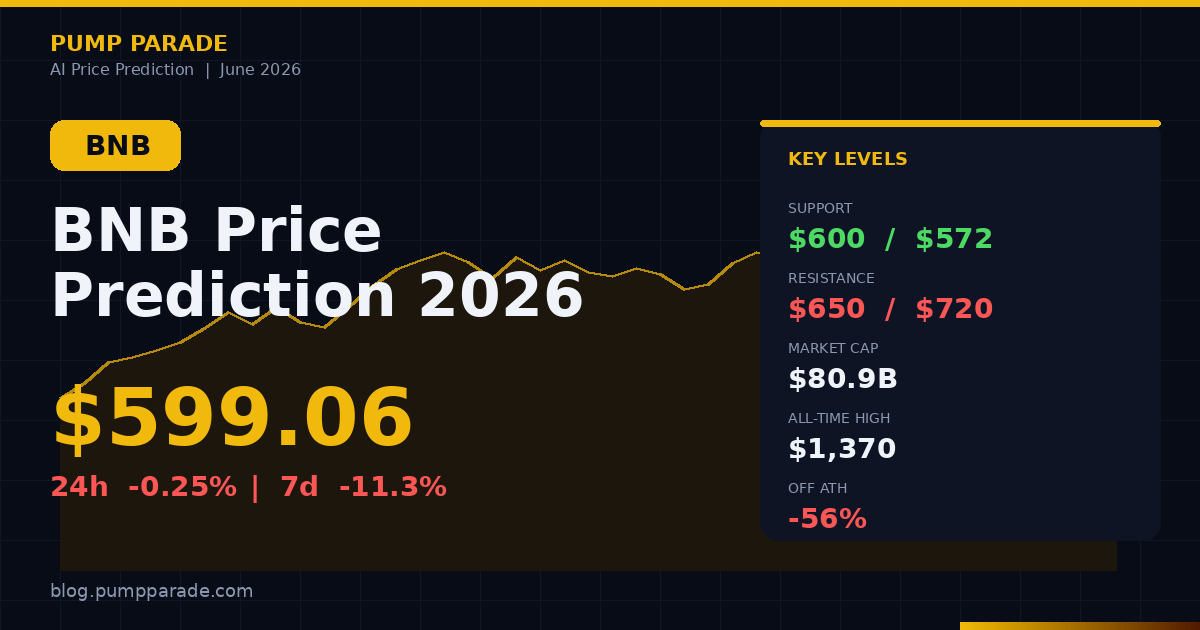
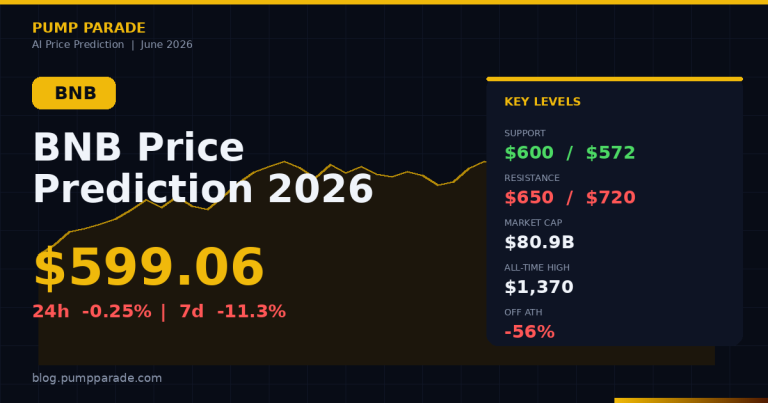
    BNB price prediction 2026 hero showing current price $599 and key technical levels

    BNB Snapshot: Where Things Stand

    BNB is the native token of the Binance ecosystem and BNB Chain, one of the most-used Layer-1 networks by daily transactions. It powers trading fee discounts on Binance, gas on BNB Smart Chain, and a growing list of DeFi, gaming, and tokenized asset applications.

    Here are the numbers that matter right now:

    • Current price: $599.06
    • Market cap: $80.9 billion (rank #5 globally)
    • 24-hour volume: $737 million
    • Circulating supply: ~134.78 million BNB
    • Target max supply: 100 million (via Auto-Burn)
    • All-time high: $1,369.99 (October 13, 2025)
    • 7-day change: -11.3%
    • 30-day change: -7.8%

    The 90-day range tells the story: BNB peaked at $718 in mid-March and has been grinding lower since. The recent breakdown from $650 was the first major technical failure in months. Now $600 has to hold, or the next stop is $571, the 90-day low.

    The Burn: Why BNB’s Supply Story Is Still Underrated

    BNB just completed its 35th quarterly burn, removing 1.56 million tokens worth about $1.02 billion from circulating supply. Combined with the 34th burn earlier in 2026, the network has destroyed roughly 2.93 million BNB this year alone. That is real, verifiable, deflationary action.

    Here is why that matters in plain terms. BNB uses an Auto-Burn mechanism: a formula that adjusts each quarterly burn based on BNB’s average price and the number of blocks produced on BNB Smart Chain during the quarter. The goal is to shrink total supply from the original 200 million down to 100 million. After the 35th burn, supply now sits at about 134.7 million tokens. BNB Chain confirms roughly 65 million tokens still need to come out of circulation before the target is hit.

    On top of the quarterly burns, the BEP-95 upgrade introduced a real-time gas-fee burn that runs every block. That mechanism has already removed an estimated 281,000 additional BNB tied to network activity.

    Translation: every BNB still in circulation gets a structural tailwind from a shrinking float. The market sometimes ignores this during selloffs. Long-term, it compounds.

    Technical Analysis: The $600 Battle

    The chart is telling a clear story. BNB lost the $650 support level last week on rising volume, and bulls have spent the past few sessions defending the $600 round number. Here is what the indicators say:

    • Key support: $600 (psychological), $572 (90-day low), $550 (next major demand zone)
    • Key resistance: $650 (recent breakdown level), $720 (90-day high), $800 (Q1 2026 resistance)
    • 200-day moving average: ~$680 (BNB is trading below it, a bearish signal)
    • Relative Strength Index (a momentum gauge): hovering near 35 on the daily chart, which is approaching oversold territory but not yet at extremes

    Two scenarios stand out from the chart. First, if BNB holds $600 and prints a daily close above $620, the path of least resistance shifts back to $650 and then $720. Second, if $600 fails on a daily close, the move down to $572 opens up quickly, and a flush to $530-$550 becomes the higher-probability outcome.

    Our AI model gives the bullish reclaim scenario a 58% probability, mostly because of the upcoming Q3 burn catalyst and the structural support clustered between $572 and $600.

    The Bull Case: Why BNB Could Reclaim $800+ in 2026

    Several catalysts could fuel a BNB rebound in the second half of 2026:

    Continued deflation. The 36th quarterly burn is scheduled for around late September. Based on current price action and block production, analysts estimate it could remove another 1.3 to 1.5 million BNB. That is roughly another $800 million in supply destruction. Historically, BNB has rallied an average of 8 to 12% in the two weeks following burn announcements.

    BNB Chain RWA growth. The tokenized real-world asset value on BNB Chain surged 76% in Q1 2026, with stablecoins, tokenized treasuries, and gold-backed assets driving the move. RWAs are the cleanest narrative in crypto right now, and BNB Chain is quietly building share alongside Ethereum and Solana.

    Binance ecosystem expansion. Binance remains the largest centralized exchange by volume globally. Every new product launch (futures markets, copy trading, staking expansions) drives BNB demand through fee discounts and platform utility.

    Bull case price targets:

    • 30 days: $700-$750 if $600 holds and Q3 burn anticipation kicks in
    • 6-12 months: $900-$1,000 if broad crypto risk appetite returns
    • 2-3 years: $1,400-$1,700 retest, with ATH breakout possible if Binance ecosystem keeps compounding

    The Bear Case: What Could Go Wrong

    A balanced analysis has to acknowledge what kills the BNB thesis. The risks are real:

    Regulatory pressure on Binance. Binance has spent years working through global regulatory issues. New enforcement actions in any major jurisdiction could weigh on BNB sentiment, even when the token itself is unaffected. This is a constant background risk.

    BNB Chain competition. Solana, Base, Hyperliquid, and other Layer-1s are aggressively pulling DeFi volume and developer attention. If BNB Chain’s share of total DEX volume keeps slipping, the ecosystem story weakens.

    Broader crypto risk-off. BNB has a high correlation to Bitcoin during selloffs. If BTC loses its key support and breaks back below $55,000, expect BNB to revisit $500 or lower regardless of the burn story.

    Bear case price targets:

    • 30 days: $520-$550 if $600 fails on a daily close
    • 6-12 months: $450-$500 if a broader risk-off move continues
    • 2-3 years: $600-$800 range-bound if Binance loses market share to competitors

    BNB Price Prediction: Our AI Model’s View

    Pulling the bull and bear scenarios together, here is what our hybrid model is forecasting for BNB across three timeframes. These are probability-weighted ranges, not guarantees.
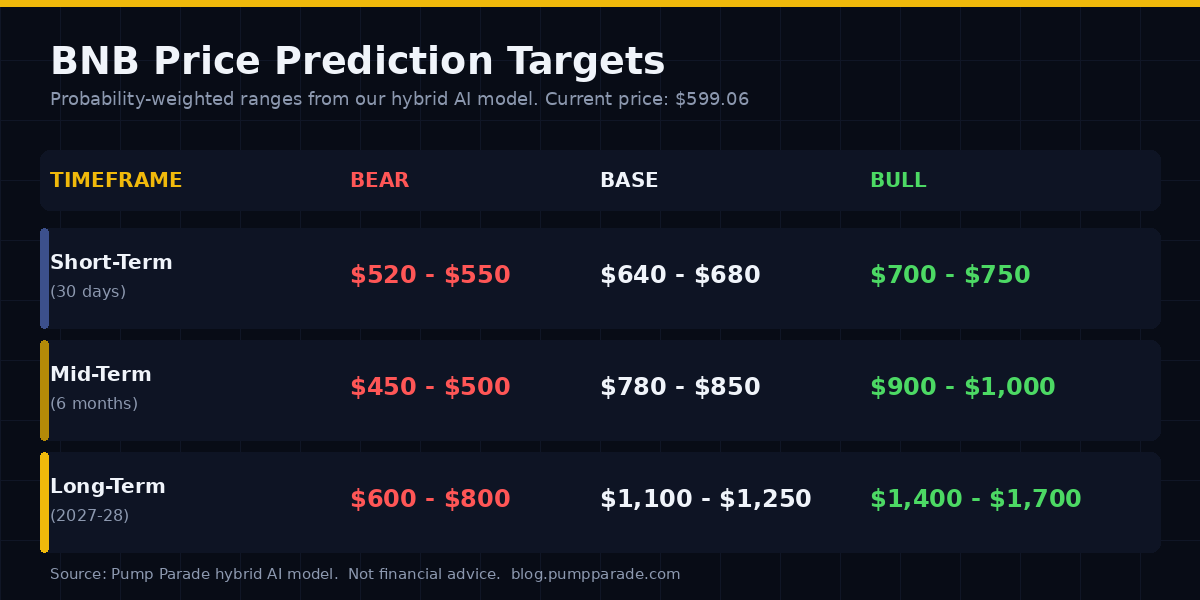
    BNB price prediction targets across short, mid, and long-term timeframes

    Short-term (30 days), the base case is a defense of $600 followed by a grind back toward $700. Mid-term (6 months), the Q3 burn and a possible crypto market recovery point toward $900 in the base scenario. Long-term (2027-2028), an ATH retest at $1,370 is realistic if the deflationary mechanic continues and Binance maintains its leadership position.

    For context on how BNB stacks up against other Layer-1 tokens trading near key technical levels, see our Solana price prediction covering the Alpenglow catalyst.

    What to Watch

    BNB’s setup over the next 30 to 60 days comes down to a few clear levels and events. Here is the watchlist:

    • $600 daily close. A close above $620 flips the short-term tape bullish. A close below $590 opens the door to $550.
    • Bitcoin’s direction. BNB rarely fights the broader market. Watch BTC’s response to the $60K-$65K range.
    • Q3 burn announcement. The 36th burn typically gets pre-announced 7-10 days before execution. That window has historically been a tradeable catalyst.
    • BNB Chain TVL. If total value locked on BNB Chain holds above $5 billion and RWA value keeps climbing, the structural bull case stays intact.
    • Coinbase BNB listing developments. Continued US exchange access has been a slow-burn tailwind.

    Final Take

    BNB is in one of those zones where the technical picture and the fundamental picture disagree. Charts look heavy. Fundamentals (the burn, the RWA growth, the ecosystem footprint) look strong. That setup usually resolves in one of two ways: a quick washout that prints a long-term bottom, or a slow basing pattern that catches everyone off guard.

    The smart move is not to predict which one. The smart move is to define your levels in advance and react to what the market actually does. $600 holds, you can lean toward the bull case. $600 breaks on real volume, you respect the bear case.

    BNB’s story for 2026 is still mostly intact. The token just needs the chart to catch up to the fundamentals.

    Disclaimer: This article is for informational and educational purposes only and should not be construed as financial, investment, or trading advice. Cryptocurrency markets are highly volatile, and past performance does not guarantee future results. The price predictions and analyses presented here are based on AI models, technical indicators, and available data at the time of writing. They are not guarantees. Always conduct your own research (DYOR) and consult with a qualified financial advisor before making any investment decisions. Pump Parade and its authors do not assume liability for financial losses incurred based on information provided in this article.
    Dogecoin (DOGE) Price Prediction 2026: ETF Streak

    Dogecoin is trading near $0.085 at time of writing. The price is down 16% over the past 7 days, but something strange is happening underneath the chart. Spot DOGE ETFs just logged their longest inflow streak since launch, three straight weeks of positive flows. And on June 5, DOGE broke a 7-month downtrend that had capped every rally since November.

    That divergence matters. Retail is panicking. Institutions are quietly buying. Add a freshly launched payments app and a clean regulatory classification, and the setup for the back half of 2026 looks very different from the chart most traders are watching.

    Here is the data, both sides of the trade, and our AI model’s price targets for the rest of the year and beyond.

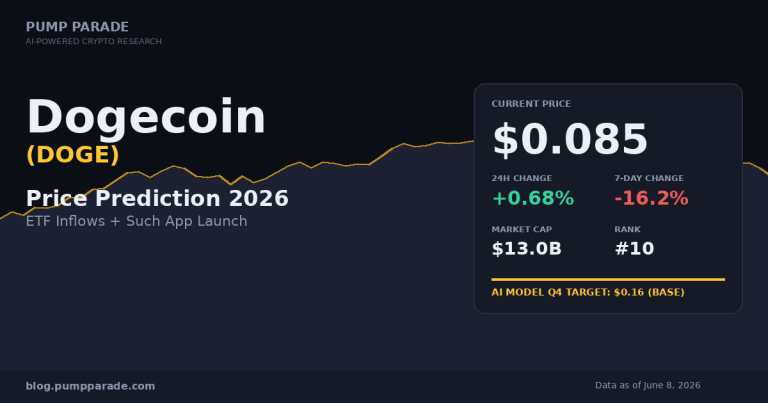
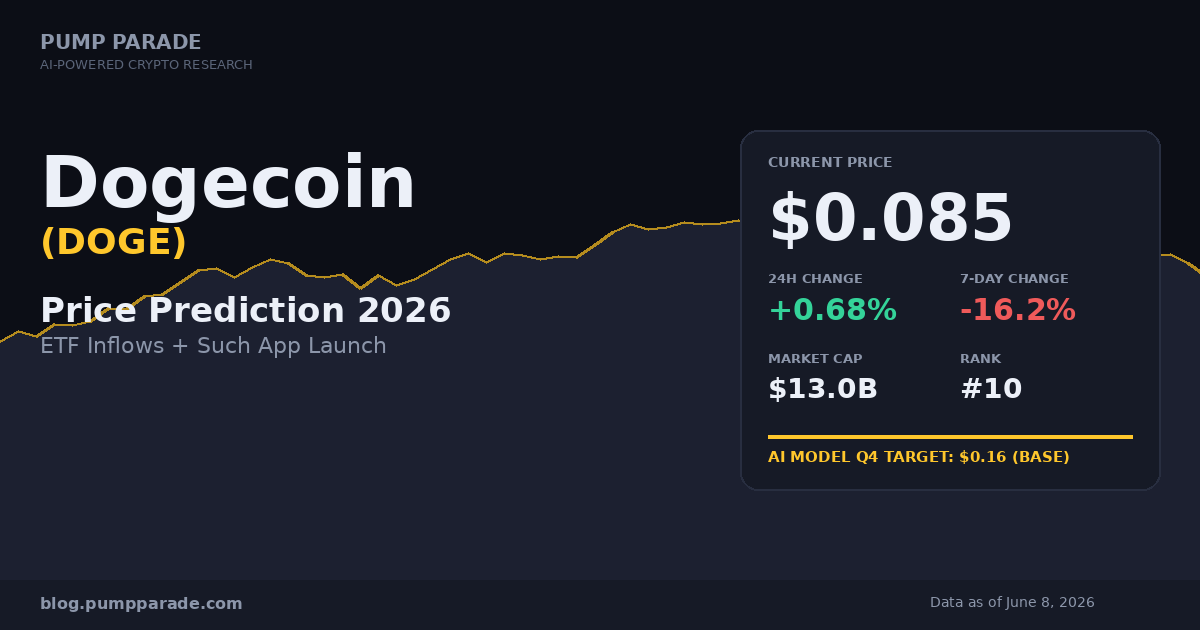
    Dogecoin DOGE price prediction 2026 hero card showing current price $0.085, market cap $13B, and AI model Q4 base target of $0.16

    Dogecoin at a Glance: Price, Market Cap, and Where It Sits

    DOGE is the original memecoin, but in 2026 it is closer to a top-tier crypto than a joke. Here are the numbers that matter today:

    • Price: ~$0.085
    • Market cap: ~$13.0 billion
    • Rank: #10 to #11 across major trackers
    • 24-hour change: +0.68%
    • 7-day change: -16.2%
    • All-time high: $0.7316 (May 2021)
    • Distance from ATH: -88.5%

    Source data is pulled from CoinGecko and CoinMarketCap as of June 8, 2026.

    The 16% weekly drop tracks the broader crypto pullback. Bitcoin slid from $72,840 to roughly $64,100 over the past week. Most majors followed. DOGE bled with them. But the underlying story is no longer about retail-driven hype cycles.

    The Three Catalysts Driving Dogecoin in 2026

    To understand where DOGE could go, you need to know what changed in the last six months. Three things matter most.

    1. Spot DOGE ETFs Are Quietly Stacking

    The REX-Osprey DOJE ETF and the 21Shares TDOG ETF are both live in the United States. TDOG is the first DOGE product with Dogecoin Foundation backing and direct spot exposure. DOJE was the first spot DOGE ETF to launch on a U.S. exchange.

    Over the past three weeks, these products have run their longest positive inflow streak since launch. That is happening while spot price is falling. In plain terms: ETF buyers are accumulating into weakness. That is the opposite of a typical memecoin trade.

    This pattern echoes what happened with Bitcoin and Ethereum ETFs in early 2024. Quiet institutional inflows during a price chop preceded a multi-month rally. There is no guarantee DOGE follows the same path. But the structural setup is closer to a real asset than a meme.

    2. The Such App Just Went Beta

    On May 27, 2026, House of Doge and Brag House Holdings launched the Such app beta. Such is a self-custodial DOGE wallet bundled with merchant tools. The feature called Hustles lets independent vendors accept DOGE through invoicing or in-person QR codes.

    This is the first credible push to turn DOGE into a working payments rail since Elon Musk’s 2021 hype cycle. The difference now is that the Dogecoin Foundation itself is backing the build. The team is twenty engineers based in Melbourne. Full public launch is targeted for the first half of 2026, with a wider rollout expected through Q3.

    If Such gains real merchant adoption, the supply-demand dynamic shifts. DOGE stops being only a speculative chip. It starts becoming useful.

    3. DOGE Is Now Legally a Commodity

    In March 2026, a joint SEC and CFTC framework classified DOGE as a digital commodity. That removed the regulatory cloud that hung over most large-cap altcoins through 2024 and 2025. It also cleared the runway for the ETF products that are now buying.

    Combined, these three catalysts represent the most fundamental shift DOGE has ever had. The question is whether the chart agrees.

    Dogecoin Technical Analysis: What the Chart Says

    DOGE just printed a meaningful technical event. On June 5, price broke above the descending trendline that had capped every rally since November 2025. That is a 7-month downtrend resolved to the upside.

    Here is what to watch:

    • Immediate support: $0.075 to $0.080
    • Key support: $0.065 (the May low)
    • Immediate resistance: $0.10 to $0.11
    • Major resistance: $0.14 (200-day moving average)
    • RSI (14): hovering near 41, which is neutral leaning oversold

    The setup is not screaming bullish. But it is no longer screaming bearish either. Neutral RSI plus a broken downtrend is what a base usually looks like before a real move. Whether that move is up or down depends on Bitcoin and on whether ETF inflows continue.

    One pattern worth flagging: DOGE has historically led the altcoin recovery in the second half of bull cycles. In 2017 and 2021, DOGE moved last and moved hardest. If the broader market stabilizes into Q4 2026, DOGE is structurally positioned to be a late-cycle outperformer.

    Dogecoin Price Prediction 2026: AI Model Targets

    Our AI model blends technical indicators, on-chain flow data, ETF inflow trends, and macro sentiment. Here is what it outputs for DOGE across three timeframes, with explicit bear, base, and bull targets.

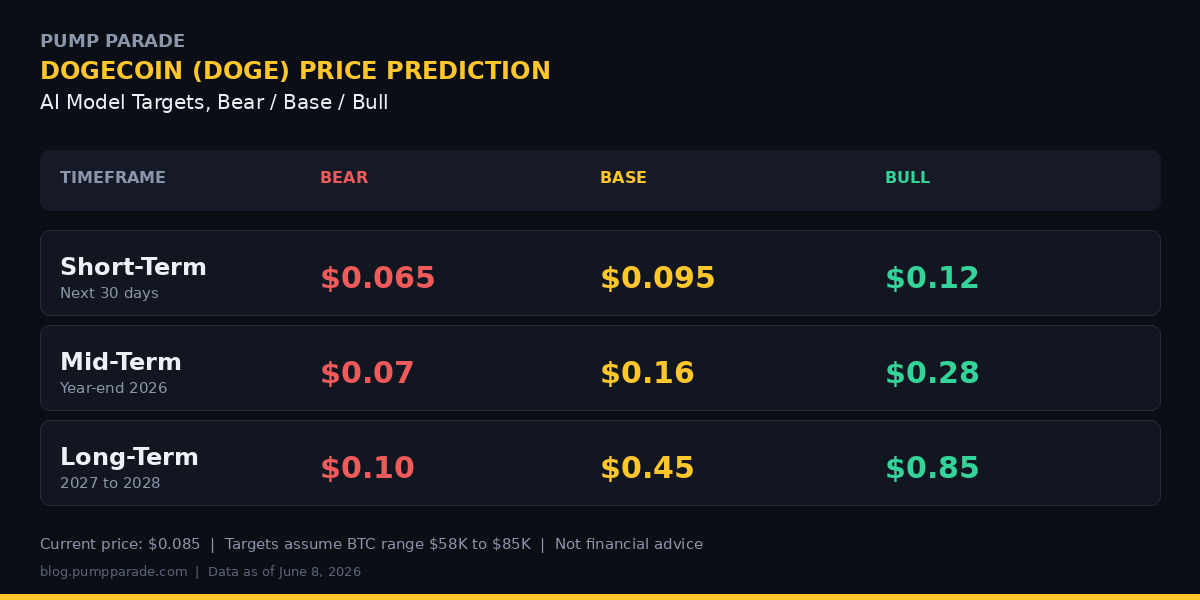
    Dogecoin DOGE price prediction 2026 table showing bear, base, and bull targets for short-term, mid-term, and long-term timeframes

    Short-Term (30 days)

    • Bear case: $0.065 (retest of May lows if BTC breaks $60K)
    • Base case: $0.095 (range continuation, ETF flows steady)
    • Bull case: $0.12 (reclaim of 200-day MA on a BTC bounce)

    The short-term path is mostly a Bitcoin proxy. If BTC holds above $63K and ETF inflows stay positive, the base case wins. If macro deteriorates, $0.065 is the line.

    Mid-Term (6 months, year-end 2026)

    • Bear case: $0.07 (Bitcoin enters a deeper correction, ETF flows reverse)
    • Base case: $0.16 (Such app gains traction, ETFs continue accumulating)
    • Bull case: $0.28 (a fourth-quarter altcoin rotation, similar to Q4 2024)

    The mid-term outlook is where the Such app and ETF data matter most. Adoption metrics from Such by Q3 will tell us a lot. So will the cumulative ETF inflow number by September.

    Long-Term (2027 to 2028)

    • Bear case: $0.10 (DOGE underperforms a flat-to-down crypto cycle)
    • Base case: $0.45 (next halving cycle plus mature payments use case)
    • Bull case: $0.85 (new all-time high on payments adoption plus ETF flywheel)

    The long-term bull case requires two things: Bitcoin reaching a new all-time high in the next cycle, and the Such app delivering measurable merchant adoption. Both are plausible but neither is certain.

    The Bear Case for Dogecoin: What Could Go Wrong

    Every price prediction needs the other side of the trade. Here is what would invalidate the bull thesis.

    ETF inflows reverse. The three-week positive streak is fresh. A sharp reversal would signal that institutions are not committed. DOGE would lose its strongest structural support.

    Such app fails to gain merchants. Payment apps live or die on adoption. If Such hits 2026 year-end with under 10,000 active merchants, the utility narrative dies. DOGE goes back to being just a memecoin.

    A broader memecoin rotation. Capital that would flow into DOGE could instead chase newer plays. We have already covered the ETF setup risk for newer memecoin ETFs in our Pudgy Penguins price prediction. The same dynamic could pull liquidity away from DOGE.

    Bitcoin keeps bleeding. If BTC breaks $58K and trends toward $50K, no altcoin survives the rotation back to cash. DOGE would likely lose another 30 to 40 percent in that scenario.

    Regulatory reversal. The digital commodity classification is administrative, not statutory. A new SEC chair or a court ruling could reopen the question. Low probability, but not zero.

    The Bull Case for Dogecoin: Why This Cycle Is Different

    Here is what could send DOGE materially higher.

    ETF flywheel kicks in. Spot Bitcoin ETFs took six months to reach steady inflows. DOGE ETFs are at the start of that curve. If TDOG and DOJE accumulate $500M to $1B by year end, DOGE has a hard supply floor.

    Such app gets real users. Even modest merchant adoption, say 25,000 vendors by end of 2026, would change the conversation. DOGE would have its first measurable utility metric outside trading volume.

    Late-cycle altcoin rotation. History suggests DOGE moves last in a crypto bull cycle. If 2026 ends with BTC at new highs, DOGE could see the kind of 5x to 10x rally that defined Q1 2021.

    Elon resurfacing. Wildcard, but worth naming. Musk has been quieter on DOGE since 2024, but any X integration or new payments rail announcement would move price hard.

    What to Watch in the Next 30 Days

    Three signals will tell us whether the DOGE base is real or whether the bounce fails.

    1. Weekly ETF flow data. If the inflow streak extends to four or five weeks, that is a strong signal. If it breaks, reassess.
    2. Such app merchant count. Watch for any official updates from House of Doge on beta sign-ups and active merchants.
    3. The $0.10 reclaim. A daily close above $0.10 confirms the trend break. A failure to reclaim it within 30 days suggests range continuation.

    The smart move here is patience. DOGE looks technically interesting and fundamentally improved, but it still trades like a beta play on Bitcoin. Position size accordingly.

    Final Take: DOGE Has Better Bones Than the Chart Suggests

    For the first time in years, Dogecoin has more than a meme behind it. Two live spot ETFs are accumulating. A real payments app just shipped a beta. A regulator classification removed the legal cloud. And the chart just broke a 7-month downtrend that had capped every rally since November.

    That does not mean DOGE goes straight up. It means the structural floor is higher than it was a year ago. Our base case puts DOGE at $0.16 by year end and $0.45 by the next halving cycle. Our bull case stretches to $0.85. The bear case caps downside near $0.07.

    If you are looking at DOGE today, you are not buying the 2021 meme. You are buying a top-10 asset with institutional ETF flows, a working payments rail in beta, and clear regulatory status. The risk is still real. So is the asymmetry.

    Disclaimer: This article is for informational and educational purposes only and should not be construed as financial, investment, or trading advice. Cryptocurrency markets are highly volatile, and past performance does not guarantee future results. The price predictions and analyses presented here are based on AI models, technical indicators, and available data at the time of writing, they are not guarantees. Always conduct your own research (DYOR) and consult with a qualified financial advisor before making any investment decisions. Pump Parade and its authors do not assume liability for financial losses incurred based on information provided in this article.
    Avalanche (AVAX) Price Prediction 2026: RWA Surge

    0

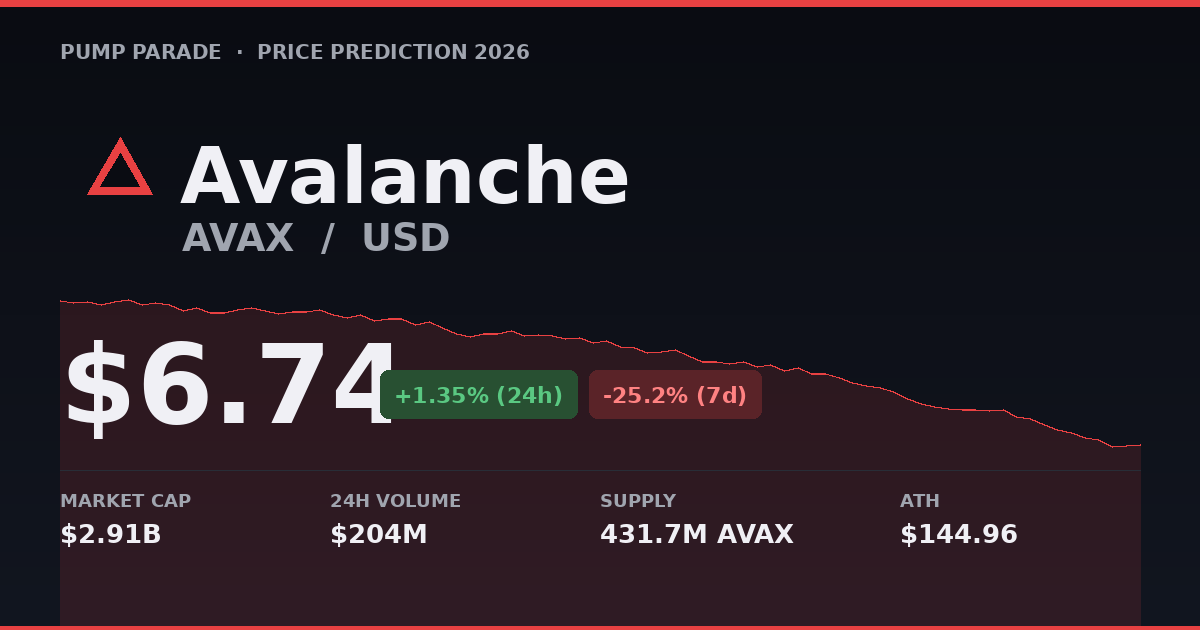
    Avalanche (AVAX) is having a rough month. The token trades near $6.74 today, down roughly 25% in the last seven days and almost 30% over the last 30. The chart broke through the ascending channel that held since the February lows. Bulls are nursing wounds.

    Yet under the price action, something interesting is happening. Real-world asset (RWA) transfer volume on Avalanche surged 3,810% in 30 days to $428.9 million, according to on-chain data tracked by CoinJournal. The first U.S. spot AVAX ETF is live. Network throughput just took on the FIFA World Cup without breaking a sweat.

    So which signal wins: the bleeding chart or the building fundamentals? Let us look at the numbers.

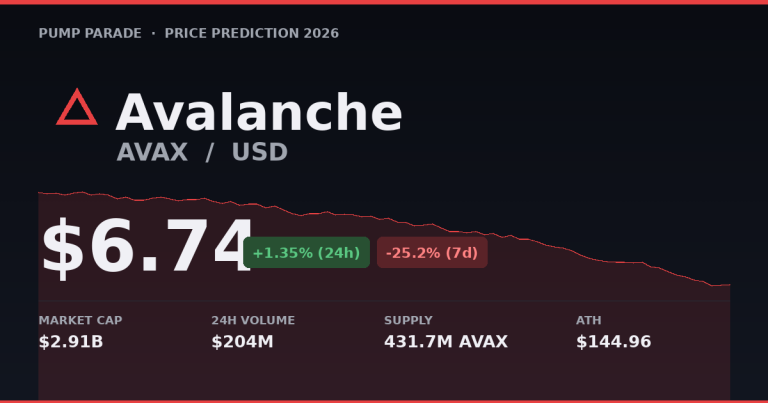
    Avalanche AVAX price prediction 2026 hero showing current price $6.74

    AVAX Price Today: The Damage Report

    Here is the snapshot as of June 7, 2026:

    • Price: $6.74
    • Market cap: $2.91 billion
    • 24h volume: $204 million
    • 7-day change: negative 25.2%
    • 30-day change: negative 29.4%
    • Circulating supply: 431.7 million AVAX
    • Max supply: 720 million AVAX
    • All-time high: $144.96 (November 2021)

    The bigger picture is uglier. AVAX is down more than 95% from its all-time high. The token has spent most of 2026 trying and failing to reclaim the $20 level. The recent break below $7 puts $6.50 in play as the next major support. Below that, the air gets thin fast.

    For context, the wider crypto market has shed over $500 billion in market cap in the last 25 days. AVAX is not bleeding alone. But it is bleeding more than most.

    The Bull Case: An RWA Story Hiding Under the Chart

    Here is what the price action is not telling you.

    RWA volume exploded. Avalanche’s tokenized asset activity hit $428.9 million in 30-day transfer volume on June 3, a 3,810% surge. Total distributed RWA value grew 27% to $914.6 million. Real-world asset TVL on Avalanche has roughly doubled since April 2025 to about $2.1 billion. BlackRock’s USD Institutional Digital Liquidity Fund accounts for more than half of that.

    Translation: institutional money is parking tokenized treasuries and funds on Avalanche, even while retail traders dump the token.

    The ETF is real. VanEck launched VAVX on January 26, 2026, the first U.S.-listed spot Avalanche ETF. It charges 0.30% and, critically, includes staking rewards (Coinbase Crypto Services takes 4% of those rewards under the staking provider deal). Weekly inflows are modest compared to Bitcoin’s products. But the rails are built, and modest inflows during a 25% drawdown still count.

    The network keeps working. On June 2, FIFA World Cup-related ticket activity drove 60,000 transactions through Avalanche infrastructure, with overall network transaction volume jumping 24x. The Avalanche9000 upgrade, live since December 2024, cut custom chain deployment costs by 99.9%. That is the kind of plumbing that brings enterprises in quietly while the price chart screams.

    Regulatory tailwind. The March 17, 2026 SEC/CFTC interpretive guidance classified AVAX as a digital commodity. That removed a major legal overhang for U.S. institutions. The Avalanche Policy Coalition joined the Vault Coalition on June 5 to push for further clarity on tokenized vaults, putting AVAX in the room where the next regulatory frameworks are getting drafted.

    The Bear Case: This Drawdown Has Teeth

    None of the above changes the fact that AVAX just broke a key technical level. Here is what the skeptics see.

    The trend is broken. AVAX is trading below both its 50-day and 200-day moving averages. The break below the February ascending channel was decisive, not a wick. Until price reclaims roughly $8.50 and holds it, the technical posture is bearish. Bear-case targets near $5.00 are not crazy.

    Institutional sellers are still around. The broader altcoin tape has been hit by ETF outflows. Bitcoin spot ETFs have logged record outflow streaks, and altcoin ETF flows are even more sensitive to risk-off shifts. If macro stays risk-off through summer, AVAX will not be the token that escapes.

    The competition is brutal. Solana, Ethereum L2s, and Sui are all chasing the same institutional and on-chain liquidity that Avalanche needs. AVAX has product-market fit in RWA, but RWA is not yet a category that pumps token prices the way DeFi summer did. The catalyst could be real and the token could still chop sideways.

    Supply pressure is real. Circulating supply is 431.7 million against a 720 million max. There is still meaningful issuance ahead, and staking yields can be sold rather than restaked. Token supply growth has to be absorbed by demand. Right now, it is not being absorbed.

    AVAX Technical Outlook

    The chart is doing a few things worth noting.

    The break below the ascending channel that held since February is the headline event. Channel breakdowns of that age often run further than traders expect. The first real test is $6.50. If buyers defend it, the move could be a long-tail flush rather than a trend change. If $6.50 fails, $5.00 becomes the next gravity well.

    On the upside, AVAX needs to reclaim $7.50 to invalidate the short-term breakdown, then $8.50 to flip the medium-term trend back to neutral. Reclaiming $10 with volume would be the moment the bullish narrative re-engages.

    RSI on the daily is approaching oversold but is not there yet. That suggests room for one more flush before any meaningful bounce. A daily RSI under 30 paired with a hold of $6.50 would be the kind of setup worth watching.

    For deeper context on how AVAX behaved during a similar shakeout earlier this cycle, check our prior take in Avalanche (AVAX) Price Prediction 2026: CME Catalyst, which mapped out the institutional plumbing thesis that is now playing out in the RWA data.

    AVAX Price Predictions by Timeframe

    Our AI model runs scenarios across technicals, on-chain flows, ETF data, and macro positioning. Here is how the next three timeframes shake out.

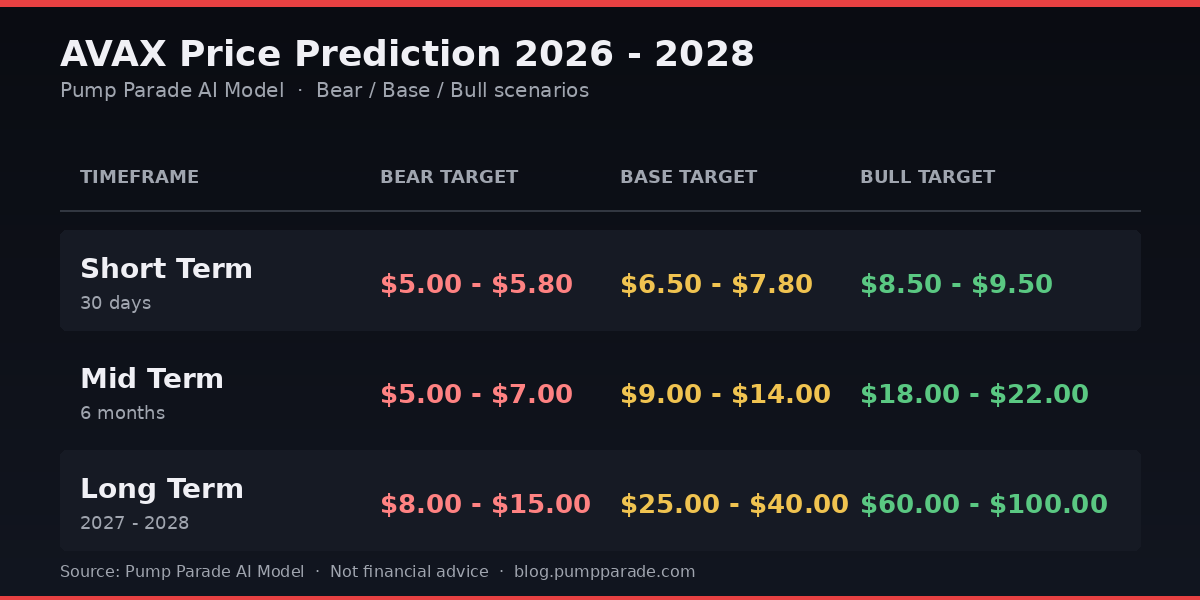
    AVAX price prediction 2026 to 2028 table with bear, base, and bull targets across short, mid, and long term

    Short Term (Next 30 Days)

    • Bear case ($5.00 to $5.80): $6.50 fails, sellers force a capitulation flush. Macro stays risk-off, ETF outflows continue.
    • Base case ($6.50 to $7.80): $6.50 holds. AVAX chops in a wide range while it digests the breakdown. Most likely outcome in our model, roughly 50% probability.
    • Bull case ($8.50 to $9.50): $6.50 holds firmly, RSI mean-reverts, RWA news catches a wider tape bid. AVAX retests $8.50 channel resistance.

    Mid Term (6 Months)

    • Bear case ($5.00 to $7.00): Macro stays heavy. RWA volume keeps growing but does not translate into token demand. AVAX underperforms peers.
    • Base case ($9.00 to $14.00): RWA TVL pushes past $3 billion. VAVX inflows pick up alongside any broader altcoin rotation. AVAX retests its 2026 highs.
    • Bull case ($18.00 to $22.00): Risk-on returns. RWA narrative becomes the trade of late 2026. Avalanche9000-era L1 deployments hit critical mass.

    Long Term (2027 to 2028)

    • Bear case ($8.00 to $15.00): Avalanche keeps its institutional niche but fails to recapture retail attention. Token prices lag the broader RWA category.
    • Base case ($25.00 to $40.00): RWA on Avalanche scales to a $10 billion-plus footprint. ETF AUM grows, staking adoption increases. AVAX trades in line with its mid-cycle 2021 range.
    • Bull case ($60.00 to $100.00): The institutional thesis fully plays out. AVAX becomes the default settlement layer for tokenized assets. Half the all-time high is back in play.

    Cross-reference: live AVAX price and supply data on CoinGecko for the up-to-the-minute numbers.

    What to Watch From Here

    If you are trading AVAX over the next 90 days, three things matter more than your model:

    1. The $6.50 line. A clean hold turns the breakdown into a flush. A clean break opens $5.00.
    2. VAVX flows. ETF inflow data is the cleanest read on whether institutions are buying this drawdown or waiting it out.
    3. RWA TVL. If on-chain RWA value keeps trending up while price is down, that gap usually closes. The question is when.

    Bottom Line

    AVAX is in an awkward place. The chart says caution. The fundamentals say something is being built. Both can be true.

    Our base case is that the next 30 days are choppy, with AVAX defending $6.50 and grinding sideways before any real trend resumes. The 6-month base case lands in the $9 to $14 zone if the RWA story keeps compounding. The long-term case has real upside if Avalanche locks in its institutional niche.

    This is not a token to chase on green days. It is a token to scale into on red ones, with conviction tied to the RWA and ETF data, not the candles.

    Disclaimer: This article is for informational and educational purposes only and should not be construed as financial, investment, or trading advice. Cryptocurrency markets are highly volatile, and past performance does not guarantee future results. The price predictions and analyses presented here are based on AI models, technical indicators, and available data at the time of writing, they are not guarantees. Always conduct your own research (DYOR) and consult with a qualified financial advisor before making any investment decisions. Pump Parade and its authors do not assume liability for financial losses incurred based on information provided in this article.
    Sui (SUI) Price Prediction 2026: CME Futures Catalyst

    0

    Sui is trading at $0.6977 at time of writing, down about 22% from $0.90 a week ago. That drop happened during what should have been a victory lap. On May 29, 2026, the CME Group launched regulated SUI futures, putting the token in a club that until 18 months ago held only Bitcoin and Ethereum.

    Instead of a rally, SUI got rugged by its own network. Two outages totaling 9.5 hours hit the chain the same week. It was the third major incident since January. So the question for the rest of 2026 is simple: does institutional plumbing matter more than uptime?

    Our AI model says it does, but not as much as the bulls want.

    Sui SUI price prediction 2026 hero image with current price and CME futures catalyst

    Sui (SUI) Overview: A Layer 1 With Real Throughput and Real Bugs

    Sui is a Layer 1 blockchain built by ex-Meta engineers using the Move programming language. It targets high-throughput consumer apps: games, payments, social, and asset-heavy DeFi. The pitch is sub-second finality, parallel execution, and a developer experience that does not look like Solidity.

    The numbers at time of writing:

    • Price: $0.6977
    • Market cap: $2.81B
    • 24h volume: $832M
    • 7-day change: roughly -22%
    • Circulating supply: ~4.03B SUI

    Sui has shipped product. It also has a reliability problem the team can no longer hand-wave away. The May outages came from a gas fee calculation bug introduced in the v1.72 client. The first stall lasted nearly six hours. The second knocked out block production for over three hours the next day. In plain terms: if you were running an app on Sui that week, your users could not do anything for most of a workday.

    What Just Changed: CME Futures and the Institutional Stack

    The CME listing is the biggest structural shift for SUI in 2026. Standard contracts cover 50,000 SUI. Micro contracts cover 5,000 SUI. Both settle to a dollar reference rate, which means hedge funds and prop desks can now short SUI without touching a crypto exchange.

    SUI now has a full three-layer institutional access stack:

    • Spot ETF: The 21Shares Spot SUI ETF (TSUI) already gives wealth managers passive exposure
    • Regulated futures: CME contracts give active desks hedging and directional tools
    • 24/7 derivatives: CME flipped all crypto futures and options to round-the-clock trading on May 29, killing the weekend gap institutions hated

    Translation: SUI just joined the adult table. The question is whether that translates to price.

    Historically, CME futures listings have produced short-term volatility followed by a 60-90 day digestion period. Bitcoin sold off after its CME listing in December 2017. Ethereum did the same in February 2021. The pattern is not iron law, but it is consistent enough that traders should expect chop before lift.

    Technical Outlook: SUI Is at a Decision Zone

    SUI is sitting on its 200-day moving average around $0.70. That level held three times in 2026 already. A clean break below opens the door to $0.58, which was the February low. A bounce here, with volume, sets up a retest of $0.90 and then $1.05.

    Key levels worth watching:

    • Support: $0.70 (200-day MA), $0.58 (Feb low), $0.42 (range floor)
    • Resistance: $0.90 (recent high), $1.05 (Q1 peak), $1.40 (2025 all-time high zone)

    The Relative Strength Index (RSI), a momentum indicator that runs from 0 to 100, sits near 38. That is approaching oversold territory but not there yet. The MACD (Moving Average Convergence Divergence), which tracks trend direction, just crossed bearish on the daily chart. Both indicators say: do not catch this knife yet, but the next bounce could be tradeable.

    Our AI model assigns a 58% probability that SUI holds the $0.58 support level over the next 30 days, and a 42% probability of a deeper flush to $0.42 if the July 1 unlock spooks the market.

    The Bull Case for SUI in 2026

    The bull case is built on infrastructure adoption, not price action.

    Institutional flows are the wildcard. The Hyperliquid ETF launched in May 2026 has been pulling net inflows even while Bitcoin ETFs bled $2.30B in May, the worst outflow month of the year. If TSUI follows that pattern, SUI gets a structural bid from wealth managers regardless of what crypto Twitter thinks.

    The fix is shipping. The Sui team has rolled back the v1.72 client and patched the gas fee bug. The network has been stable for over 80 hours at time of writing. If the next 60 days pass without an incident, the reliability narrative shifts from “broken” to “fixed.”

    The Move language story is real. Move-based chains, including SUI and Aptos, now host over $1.8B in total value locked. Developers are choosing Move for new consumer apps because the resource model makes asset-heavy code less prone to exploits. That is a multi-year trend, not a quarter-by-quarter story.

    Bull case price targets:

    • 30 days: $0.90 (retest of recent high)
    • 6 months: $1.40 (2025 all-time high zone)
    • 2027-2028: $2.80-$3.50 if SUI captures meaningful Layer 1 market share from Solana and other competitors

    The Bear Case for SUI in 2026

    The bear case is shorter and more uncomfortable.

    Network outages are a trust killer. Three major incidents in five months is a pattern, not bad luck. Institutional allocators who just got the green light to trade SUI futures will pull back if the chain halts again. The next outage is the one that matters.

    The July 1 unlock is real supply. Sui will release 13.72M tokens on July 1, worth roughly $9.6M at current prices. That is not catastrophic, but it lands at a moment when momentum is fragile. Unlocks during weak markets tend to extend downtrends.

    CME futures cut both ways. Regulated futures give institutions a clean way to short SUI. Funding rates have already flipped negative on the new contracts. If the basis stays negative, that is the market telling you smart money is positioning bearish.

    Layer 1 competition is brutal. Solana, Ethereum, and a wave of Move-based competitors are all chasing the same consumer-app developers. Sui needs differentiation to keep market share. Outages are the opposite of differentiation.

    Bear case price targets:

    • 30 days: $0.58 (Feb low retest)
    • 6 months: $0.42 (range floor)
    • 2027-2028: $0.30-$0.50 if Sui loses developer mindshare to competitors
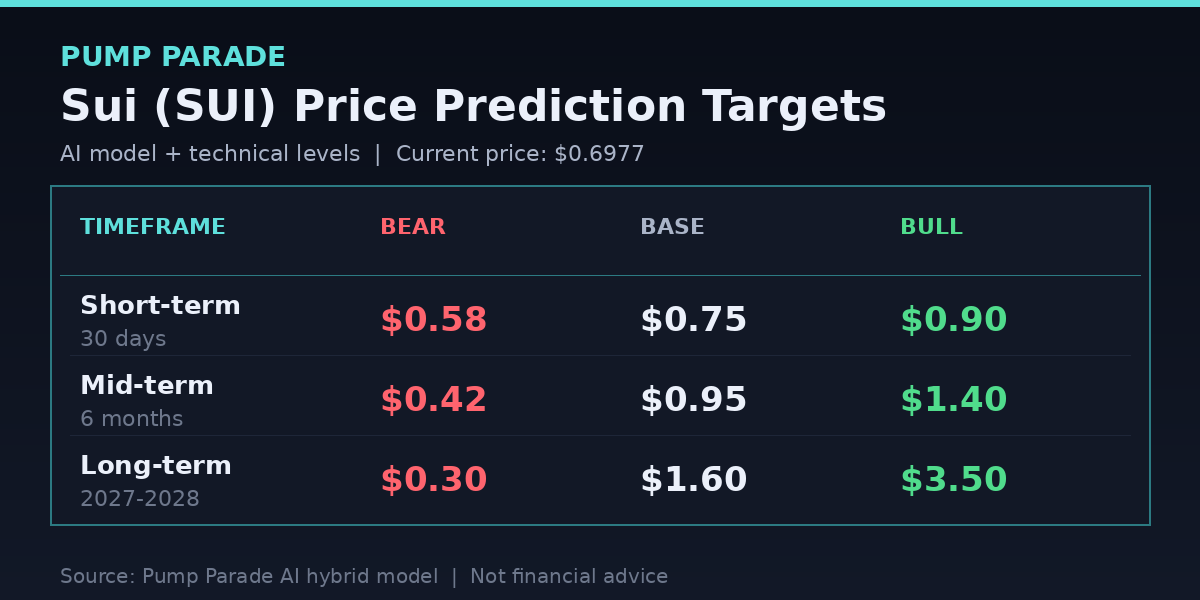
    Sui SUI price prediction targets table for short mid and long term

    Sui (SUI) Price Prediction Summary

    Here is how our AI model and on-chain signals stack up across timeframes:

    Timeframe Bear Target Base Target Bull Target
    Short-term (30 days) $0.58 $0.75 $0.90
    Mid-term (6 months) $0.42 $0.95 $1.40
    Long-term (2027-2028) $0.30 $1.60 $3.50

    The base case assumes Sui ships a stable client through Q3 2026, the July unlock gets absorbed without a 30% flush, and TSUI ETF inflows average $15M-$25M per week. None of those are guaranteed. All of them are plausible.

    What to Watch Over the Next 60 Days

    If you are tracking SUI, these are the variables that actually move the price:

    • Uptime: Any outage longer than 60 minutes resets the reliability clock. Zero outages through July is the bull threshold.
    • TSUI ETF flows: Weekly inflows above $20M would signal real institutional appetite. Outflows mean the listing was sold news.
    • CME open interest: Sustained growth in open interest with positive funding is bullish. Negative funding plus rising OI means shorts are stacking.
    • July 1 unlock: How the market absorbs 13.72M new SUI tokens tells you whether demand can match supply.
    • The $0.70 level: A daily close below $0.65 with volume invalidates the bull case for Q3.

    The Honest Take

    SUI is one of the most interesting risk-reward setups in crypto right now. The institutional stack is real. The technology is strong. The team is shipping. And the chain keeps falling over at the worst possible moments.

    This is not a token to chase on a green candle. It is a token to size carefully, with clear invalidation levels, and a plan for what you do if the network halts again. If you cannot stomach watching your position freeze for six hours, SUI is not your trade.

    If you can, the setup is genuinely interesting. The infrastructure is being built. The supply pressure is finite. And the next outage-free quarter could re-rate the token in a way that bulls have been waiting for since Q1.

    The data points to a coin priced for disappointment. Whether that disappointment shows up is the bet.

    Disclaimer

    Disclaimer: This article is for informational and educational purposes only and should not be construed as financial, investment, or trading advice. Cryptocurrency markets are highly volatile, and past performance does not guarantee future results. The price predictions and analyses presented here are based on AI models, technical indicators, and available data at the time of writing. They are not guarantees. Always conduct your own research (DYOR) and consult with a qualified financial advisor before making any investment decisions. Pump Parade and its authors do not assume liability for financial losses incurred based on information provided in this article.
    Zcash (ZEC) Price Prediction 2026: ETF or Crash?

    0

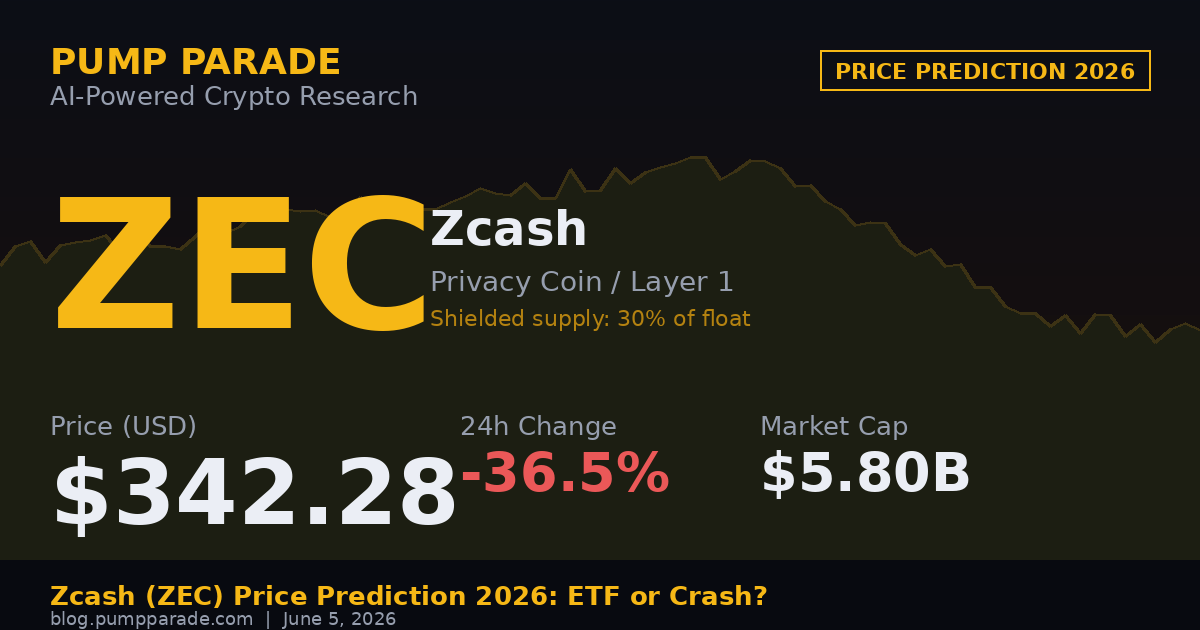
    Zcash (ZEC) is trading at $342.28 after a brutal 24 hours. The privacy coin is down 36.5% on the day and 36.8% on the week. Yet it is still up more than 585% over the past year. Volume just printed $2.5 billion, the highest in years.

    So what just happened? On June 4, Zcash founder Zooko Wilcox disclosed a critical soundness bug inside the Orchard shielded pool. The flaw could have let an attacker mint unlimited counterfeit ZEC. Developers patched it through an emergency soft fork on June 2 and a hard fork (NU6.2) on June 3. The fix worked. The market still freaked out.

    This article breaks down where ZEC goes from here. We cover the current setup, the Grayscale spot ETF filing, the bull and bear catalysts, the key technical levels, and our price targets across three timeframes.

    Zcash ZEC price prediction 2026 hero chart showing $342.28 price and 36.5% drop

    Zcash Snapshot: A Privacy Coin Having a Moment

    Zcash is a privacy-focused Layer 1 that uses zero-knowledge proofs (zk-SNARKs) to shield transaction data. Users can send funds two ways. Transparent transfers look like Bitcoin. Shielded transfers hide sender, receiver, and amount. The shielded pool is the network’s killer feature, and demand for it has surged in 2026.

    The core data points as of today, June 5, 2026, per CoinGecko:

    • Price: $342.28
    • Market cap: $5.80 billion (rank #18)
    • 24h volume: $2.50 billion
    • Circulating supply: 16.75 million ZEC
    • Max supply: 21 million ZEC
    • 60-day return: +34.6%
    • 1-year return: +585.6%
    • Drawdown from peak: roughly 50% off the recent $688 high

    Roughly 5.1 million ZEC, more than 30% of circulating supply, now sits inside shielded pools. That is a record. It also means the truly liquid float is much smaller than the headline number suggests.

    What Happened: The Orchard Bug Crash

    The story starts on May 29. Security researcher Taylor Hornby found a soundness flaw in the Orchard zk-SNARK circuit. Soundness is the property that lets a verifier trust the math. If it breaks, a node can accept transactions that should be invalid. Hornby built a working exploit in a local test environment and was able to mint counterfeit ZEC out of nothing. He responsibly disclosed instead of running it on mainnet.

    The Zcash team treated it as a five-alarm fire. The response came in two phases:

    • Phase 1 (June 2): A temporary soft fork activated at block 3,363,426 around 02:00 UTC. It disabled Orchard actions network-wide while a fix was prepared.
    • Phase 2 (June 3): The NU6.2 hard fork activated at block 3,364,600 near 00:05 EDT. It re-enabled Orchard with a corrected circuit.

    The good news: no exploit was detected, and shielded transactions are working again. The bad news is the part traders cannot stop thinking about. Because Orchard transactions are private by design, there is no way to cryptographically prove nobody used the bug during the four years it existed. Shielded Labs has already proposed a follow-up upgrade to verify ZEC supply on-chain and close that gap.

    This is the cleanest version of the privacy-coin paradox you will ever see. The same feature that gives Zcash its edge also makes it impossible to fully audit. Markets repriced for that risk, hard.

    The Bull Case: Why ZEC Could Reclaim $600

    The selloff did not erase the catalysts that drove the rally in the first place. Several remain very much alive.

    1. Grayscale Spot ETF Filing

    On May 12, Grayscale filed a Form S-3 with the SEC to convert its existing Zcash Trust into a spot ETF. Proposed ticker: ZCSH. Listing venue: NYSE Arca. Underlying benchmark: The Zcash Price Index (ZCX). If approved, this would be the first regulated spot vehicle for a privacy coin in the United States. That is a meaningful narrative shift.

    2. Shrinking Liquid Supply

    Roughly 30% of supply sits inside shielded pools and is rarely traded. Combine that with Zcash’s Bitcoin-style fixed cap of 21 million coins, and the available float for active traders is genuinely tight. Tight float plus rising demand is a textbook setup for sharp moves, in either direction.

    3. Institutional Accumulation

    The April-May rally was driven by real flows, not retail hype. Grayscale added roughly $46 million in ZEC. Foundry USA launched a dedicated Zcash mining pool. The ZODL initiative closed a $25 million funding round to bootstrap institutional treasury holdings of ZEC. None of those flows have publicly reversed.

    4. Privacy Narrative Tailwind

    Privacy coins are having a broader moment. Stablecoin surveillance, on-chain compliance tooling, and AI-driven blockchain forensics are pushing some users toward shielded options. We covered this trend in our recent Monero (XMR) price prediction, where similar dynamics drove a sustained breakout. Zcash has a parallel setup with a regulated ETF wrapper on top.

    5. Technical Upgrades Are Real

    The NU5 upgrade activated the Orchard shielded protocol and moved Zcash to the Halo proving system. Halo 2 removed the old trusted setup and brought recursive proofs. Translation: smaller proofs, cheaper verification, and a credible path to rollups and Layer 2 designs. The June bug does not change that roadmap.

    The Bear Case: Why ZEC Could Slide to $200

    A balanced read needs the other side. Here are the live risks.

    1. The Audit Trust Problem

    The Orchard bug is patched, but the bigger question is harder. If Orchard’s privacy makes it impossible to prove no counterfeit ZEC was ever created, what is the true supply? Until the Shielded Labs supply-proof upgrade ships and gets audited, this concern will sit in the back of every institutional buyer’s mind. ETF reviewers will likely care a lot about it too.

    2. ETF Approval Is Not Guaranteed

    Spot ETFs for privacy assets face a tougher path than Bitcoin or Ethereum did. The SEC closed its investigation into Zcash Foundation in January 2026 without enforcement, which helps. But approval timelines stretch quarters, not weeks. A delay or rejection would knock a major leg out of the bull thesis.

    3. Macro Risk-Off

    ZEC is a high-beta asset. In risk-off periods, it tends to drop faster than Bitcoin. If equities wobble or rates stay sticky, expect amplified downside. The June median Bitcoin return is +2.58%, but that does not always translate to altcoins, especially ones nursing a 36% one-day drawdown.

    4. Concentration Risk

    Much of the recent rally came from a small number of large buyers. If one or two of them decide the bug changed the risk profile, they exit. The order book is thin enough that the impact would be ugly.

    5. Regulatory Tail Risk

    Privacy coins remain a soft target for regulators worldwide. Several EU jurisdictions have already restricted exchange listings for shielded assets. A US-led action could hit US-based liquidity hard, ETF or no ETF.

    Technical Outlook: The Levels That Matter

    The chart tells a clear story. ZEC rallied roughly 6x from January lows near $115 to a peak above $688 in late May. The Orchard disclosure broke that uptrend in one session.

    The levels worth tracking:

    • $300: First major horizontal support. Lines up with the prior breakout zone from April. A clean hold here keeps the higher-time-frame trend technically intact.
    • $245: The 200-day moving average sits around this region. If $300 fails, this is the next logical buyer zone.
    • $420: First resistance on any bounce. It is the breakdown level from June 4.
    • $520: The 50-day moving average and the volume-weighted average price for the recent rally. Reclaim here would suggest the move is back on.
    • $688: Prior cycle high. A break above confirms the cup-and-handle pattern many analysts have flagged, with measured targets near $928.

    The Relative Strength Index (RSI, a momentum indicator that runs from 0 to 100) is sitting near 30 on the daily after the crash. Historically, ZEC has bounced from that zone about 70% of the time on a two-week window. That does not guarantee anything, but it is the kind of setup short-term traders watch.

    Price Predictions: Three Timeframes

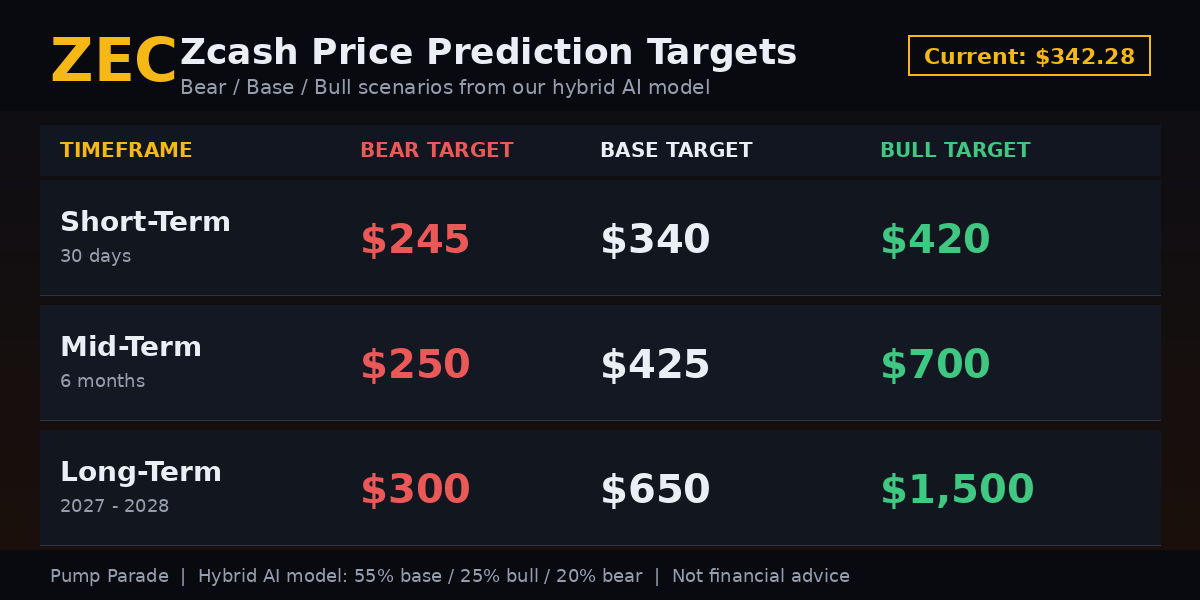
    Zcash ZEC price prediction targets table for short-term, mid-term and long-term across bear base and bull scenarios

    Our hybrid model blends technical signals, on-chain shielded pool activity, ETF-flow analogs from BTC and ETH approvals, and macro risk inputs. Here is what it currently points to:

    Short-Term (Next 30 Days)

    The base case is a choppy stabilization. Expect a range of $280 to $400, with the midpoint near $340. If $300 holds and the supply-proof upgrade is announced with a credible timeline, a snap-back toward $420 is the probability-weighted upside. A breakdown below $245 opens $200 quickly.

    Medium-Term (6 Months)

    The Grayscale ETF decision window dominates this horizon. In a base scenario, ZEC trades between $300 and $550. If the ETF gets approved and shielded-pool growth continues, the upside extends to $700 to $850. If the ETF is delayed beyond Q4 2026, expect a grind in the $250 to $400 range and rotation into other narratives.

    Long-Term (2027 to 2028)

    This is where the math gets interesting. ZEC has a Bitcoin-style halving cycle. The next halving is expected in late 2028. Combine that with potential ETF flows, continued shielded-pool growth, and a maturing Halo 2 ecosystem, and a bull target of $1,200 to $1,800 is reachable. A neutral case lands closer to $500 to $800. A bear case where the trust problem is never fully resolved keeps ZEC capped under $300.

    Our model assigns roughly 55% probability to the base path, 25% to the bull path, and 20% to the bear path. Those numbers will move as more information about the supply-proof upgrade, ETF review, and macro backdrop comes in.

    What to Watch Next

    Three things will tell you which path ZEC is on. First, the Shielded Labs supply-proof upgrade. A specific shipping date and a respected auditor would meaningfully repair the trust damage. Second, ETF review activity. Any 19b-4 publication or comment period start on the Grayscale conversion is a signal. Third, the $300 level on the daily chart. If it cracks on volume, the bounce thesis is out the window. If it holds for two weeks, the higher-time-frame trend gets its second chance.

    The honest read on Zcash right now: the bull case is intact but bruised. The bear case got sharper teeth. The path forward depends on developers and regulators more than chart patterns. That is the setup. Watch it, do not trade the emotion.

    Disclaimer

    Disclaimer: This article is for informational and educational purposes only and should not be construed as financial, investment, or trading advice. Cryptocurrency markets are highly volatile, and past performance does not guarantee future results. The price predictions and analyses presented here are based on AI models, technical indicators, and available data at the time of writing, they are not guarantees. Always conduct your own research (DYOR) and consult with a qualified financial advisor before making any investment decisions. Pump Parade and its authors do not assume liability for financial losses incurred based on information provided in this article.
    MetaMask vs Rabby Wallet: Best EVM Wallet 2026

    0

    If you live on Ethereum, Base, Arbitrum, or any of the dozens of EVM chains, the wallet you choose is the single biggest decision you make about your safety. MetaMask has been the default answer for years. Rabby Wallet has quietly become the favorite of DeFi power users who got tired of squinting at hex-encoded confirmation popups.

    So which one should you actually install in 2026? We compared both wallets head-to-head on fees, security, supported chains, UX, and trust signals. Here is what we found.

    TL;DR: Quick Verdict

    • Best for beginners and broad ecosystem support: MetaMask. It still has the largest user base, the deepest dApp integrations, and now supports Bitcoin, Solana, and TRON alongside EVM chains.
    • Best for active DeFi users and security-conscious traders: Rabby Wallet. Pre-transaction simulation, automatic network switching, and annual audits from SlowMist and Cure53 make it the safer day-to-day signer.
    • Overall pick if you can only use one: Rabby, if you do more than buy and hold. MetaMask, if you mostly stake, swap occasionally, and want one familiar app across mobile and desktop.

    Quick Snapshot of Both Wallets

    MetaMask launched in 2016 as a browser extension from ConsenSys. It now reports roughly 30 million monthly active users as of 2026, making it the most widely installed self-custodial wallet in crypto. It runs as a browser extension, mobile app on iOS and Android, and a Portfolio web dashboard.

    MetaMask multichain wallet homepage showing buy and sell crypto across chains

    Rabby Wallet is built by the team behind DeBank, the well-known multi-chain portfolio tracker. It launched in 2021 as a desktop browser extension focused on EVM DeFi users. Rabby added a mobile app in 2023 and has since become the go-to wallet for people who interact with complex smart contracts every day.

    Rabby Wallet official logo, multi-chain EVM DeFi wallet

    Feature Comparison Table

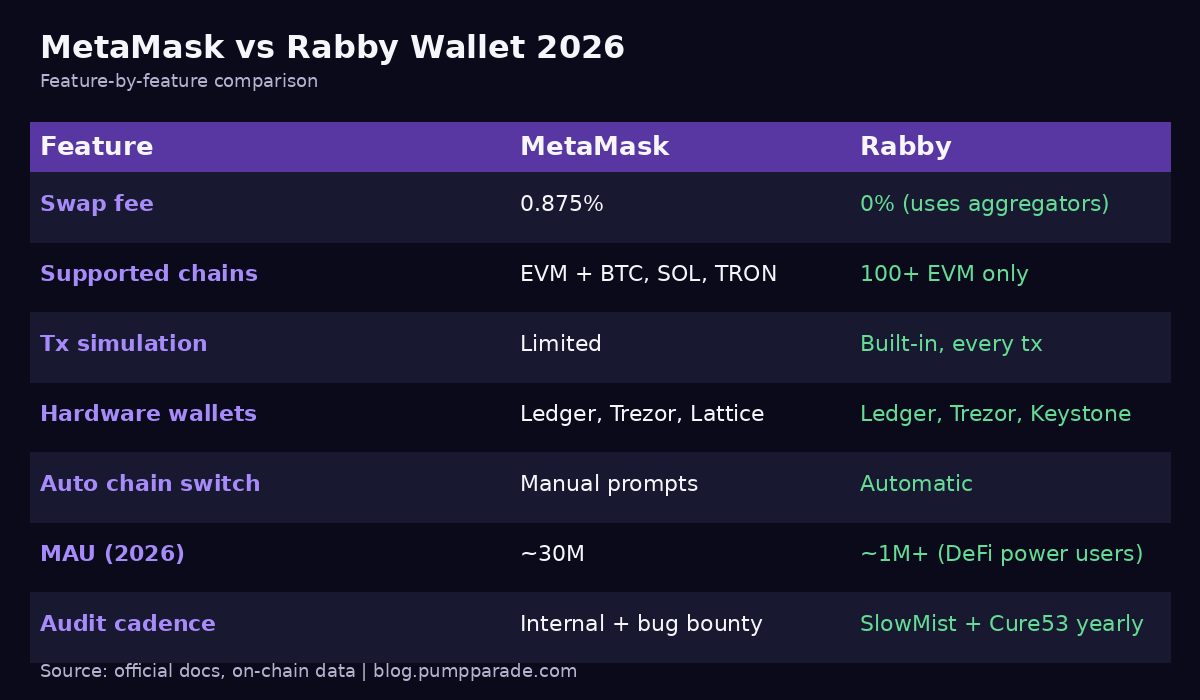
    MetaMask vs Rabby Wallet feature comparison table showing fees, chains, security and audit details

    Fees and Pricing

    MetaMask Swap Fees

    MetaMask charges a 0.875% service fee on in-wallet swaps, layered on top of the underlying DEX spread. Fiat on-ramps add a 1% markup. ETH staking through the Validator Staking integration takes a 15% cut of rewards (10% on some other integrations), which is higher than most native staking routes.

    On the plus side, MetaMask now has a Gas Station feature that lets you pay gas in the token you are swapping, so you do not need to keep dust ETH on every L2. That is genuinely useful for L2 hoppers.

    Rabby Fees

    Rabby itself takes no swap fee. It routes through DEX aggregators and surfaces the best route across multiple sources. You pay the aggregator’s fee plus gas, but Rabby does not skim a wallet markup on top. For active swappers, that 0.875% saving on MetaMask compounds fast.

    Rabby also has no built-in fiat ramp markup, because it does not offer a first-party ramp. You bridge in or buy elsewhere, then move the funds.

    Who wins on fees?

    Rabby, unambiguously, if you swap or trade often. For staking, the picture is less clear cut: MetaMask makes the action one click but charges for the convenience.

    Security and Trust

    This is where the two wallets diverge the most.

    Rabby’s Security Model

    Rabby’s flagship feature is pre-transaction simulation. Before you sign anything, Rabby runs the transaction in a virtual environment and shows you the actual balance changes that will occur. If a malicious site asks you to approve unlimited spending of your USDC, Rabby tells you in plain English. If a contract is going to drain a specific NFT, you see it before you sign.

    On top of simulation, Rabby ships with:

    • Risk scanning that flags approvals to known malicious contracts and unusual permission requests.
    • A built-in approval manager so you can revoke old token allowances without leaving the wallet.
    • Open-source code with annual third-party audits from SlowMist and Cure53, two of the most respected firms in the space.
    • Hardware wallet support for Ledger, Trezor, and Keystone.

    MetaMask’s Security Model

    MetaMask has improved a lot in the last two years. It now ships with Blockaid-powered phishing alerts on by default, has a paid Transaction Shield tier that adds protection and faster customer support, and integrates with hardware wallets like Ledger, Trezor, and GridPlus Lattice.

    Where it falls short is granular pre-transaction simulation. MetaMask shows you what method you are calling and what tokens move at a high level, but it does not consistently surface the full balance delta or contract-level risk profile the way Rabby does. For routine swaps that is fine. For complex DeFi positions and approvals, Rabby simply gives you more signal.

    Who wins on security?

    Rabby, especially for users who routinely sign contract interactions outside of well-known dApps. MetaMask is safe enough for mainstream use, but Rabby is engineered for the moments that actually matter.

    Supported Chains

    MetaMask historically focused on EVM chains and lets you add any custom RPC. In 2026, MetaMask expanded into multichain accounts that include Bitcoin, Solana, and TRON alongside Ethereum and its L2s. That is a major shift and arguably catches MetaMask up to wallets like Phantom and Backpack for users who want one app across ecosystems.

    Rabby stays focused. It supports over 100 EVM chains out of the box, automatically switches to the correct network when you visit a dApp, and does not pretend to be a non-EVM wallet. If you live on Solana, Rabby is not for you. If you live on Ethereum and its L2s, Rabby’s chain handling is significantly smoother than MetaMask’s, where you still get popups asking permission to switch networks.

    Who wins on chain support?

    MetaMask if you want one wallet across Bitcoin, Solana, TRON, and EVM. Rabby if your activity is EVM-only and you value friction-free chain switching.

    User Experience

    UX is subjective, but a few things are objectively true.

    • MetaMask’s mobile app is more mature, with millions of installs and stable performance across iOS and Android. Rabby’s mobile app exists and is solid, but the polish gap remains.
    • Rabby’s desktop extension is the better DeFi cockpit. Multi-account batch view, gas-fee history, pending transaction tracking, and the simulation pane all live inside the popup.
    • MetaMask has a richer Portfolio dashboard for non-traders who want to see their NFTs, staking positions, and balances in one place.
    • Rabby starts up fast. MetaMask has slowly grown heavier with each release and can feel sluggish on older laptops.

    Pros and Cons

    MetaMask

    Pros

    • Massive ecosystem support, every dApp works on day one.
    • Strong mobile app with biometric login and good push notifications.
    • Multichain accounts now cover Bitcoin, Solana, and TRON.
    • Built-in fiat on-ramp and staking in a single click.
    • Hardware wallet support including GridPlus Lattice.

    Cons

    • 0.875% swap fee adds up fast for active traders.
    • Weaker pre-transaction simulation than Rabby.
    • Manual network switching for dApps.
    • 15% cut on validator staking rewards.

    Rabby Wallet

    Pros

    • Pre-transaction simulation shows exactly what will happen before you sign.
    • Zero in-wallet swap markup, routes through aggregators.
    • Automatic chain switching across 100+ EVM networks.
    • Annual third-party audits from SlowMist and Cure53.
    • Built-in approval manager.
    • Open-source code.

    Cons

    • EVM-only, no Bitcoin or Solana support.
    • No first-party fiat on-ramp.
    • Smaller user base means a handful of dApps still default to MetaMask’s connector first.
    • Mobile app is good but not as feature-complete as the extension.

    Which Wallet Should You Use?

    Use MetaMask if you:

    • Are new to crypto and want one app that works with everything.
    • Want a single wallet for Bitcoin, Solana, TRON, and EVM chains.
    • Mostly buy, hold, and stake, and value mobile-first design.

    Use Rabby if you:

    • Trade and swap on EVM chains more than once a week.
    • Sign contract interactions outside of well-known protocols.
    • Want the strongest pre-signing safety net available in a hot wallet.
    • Are tired of manually switching networks for every dApp.

    Many serious DeFi users keep both: MetaMask as the secondary connector for stubborn dApps, Rabby as the primary signer. Hardware wallet behind both, ideally.

    Final Verdict

    If you are an active EVM user in 2026, Rabby is the safer, cheaper, and more thoughtful wallet. Pre-transaction simulation is no longer a luxury, it is the floor for what a self-custodial signer should do, and Rabby was built around it from day one.

    MetaMask still has its place as the universal default and now has a real multichain story with Bitcoin and Solana support. For pure DeFi safety, though, Rabby wins.

    Our rating:

    • MetaMask: 4.0 / 5
    • Rabby Wallet: 4.6 / 5

    If you are still figuring out the right wallet stack for the rest of your portfolio, check out our deep dive on Phantom vs Backpack for Solana and our breakdown of Ledger vs Trezor for cold storage.

    FAQ

    Is Rabby Wallet safer than MetaMask?

    For complex DeFi interactions, yes. Rabby’s pre-transaction simulation and risk scanning surface threats MetaMask does not consistently catch. For basic swaps inside well-known dApps, the practical safety difference is smaller.

    Does Rabby Wallet support Solana?

    No. Rabby is EVM-only. If you need Solana, use Phantom, Backpack, or Solflare. MetaMask added Solana support in 2026 if you want one cross-ecosystem wallet.

    Can I import my MetaMask seed phrase into Rabby?

    Yes. Rabby supports importing from a seed phrase, private key, or hardware wallet. Your address stays the same. Many users do this to test Rabby while keeping MetaMask installed as a backup.

    Does MetaMask still charge a swap fee in 2026?

    Yes, 0.875% on swaps inside the wallet. Rabby does not charge a wallet-level swap fee.

    Are Rabby Wallet and MetaMask both non-custodial?

    Yes. Both are self-custodial. You hold your private keys. Neither company can access your funds, freeze your wallet, or recover a lost seed phrase for you.

    Disclaimer: This article is for informational purposes only and does not constitute financial advice. Always do your own research and use a hardware wallet for significant balances.

    Render (RENDER) Price Prediction 2026: Compute Subnet

    Render (RENDER) is trading near $2.13, up 2% in the last 24 hours but still down 1.6% on the week. That is a quiet headline for a token sitting at the center of the loudest narrative in crypto right now: the on-chain race to power AI compute.

    The setup is interesting. Market cap sits just above $1.1B. Daily volume is around $187M. The network processed over 11 million rendered frames in the first half of 2026 alone. The new Render Network Compute Subnet is also live. It opens the door to AI training and inference workloads, not just 3D rendering. Bitcoin dominance still sits near 60%. That makes specific, fundamental stories like this the exact rotation play traders are hunting for.

    Below, we break down where RENDER stands, what the catalysts look like, and how the bull, base, and bear cases could play out through 2026 and into 2028.

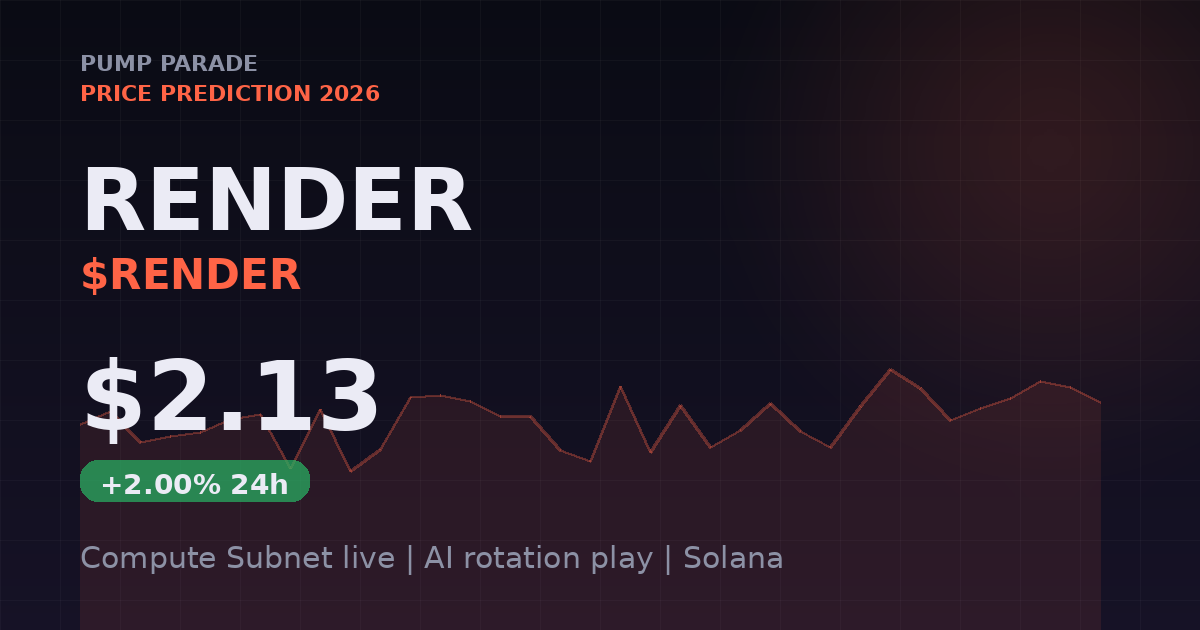
    Render (RENDER) price prediction 2026 hero image showing current price $2.13 and Compute Subnet catalyst

    Token Overview: What Render Actually Does

    Render Network is a decentralized GPU compute marketplace. In plain terms: people who need heavy GPU power rent it from node operators around the world. That includes 3D artists, VFX studios, and increasingly AI developers. RENDER is the settlement token that pays for the work.

    Originally built around the OctaneRender engine, the project has been quietly expanding its scope. The new Compute Subnet now supports general-purpose AI workloads, sitting alongside the existing Rendering Subnet and the Render API. There is also direct OctaneX integration with Apple silicon, including M4 Macs and the Vision Pro pipeline.

    Key metrics as of June 4, 2026:

    • Price: ~$2.13
    • Market cap: ~$1.10B
    • 24h volume: ~$187M
    • Circulating supply: ~520M RENDER
    • 7-day performance: -1.6%

    The current price is roughly 78% below its 2024 cycle high near $13.85. That is a deep drawdown for a project whose underlying narrative, AI compute demand, has only intensified since then.

    The Catalyst: AI Compute Demand Goes Mainstream

    The core thesis on RENDER is simple. AI workloads need GPUs. Centralized cloud GPUs are expensive and constrained. Decentralized networks can absorb meaningful share. Gartner and McKinsey both project the global GPU cloud market near $15B by 2026. That figure does not even capture the long tail of generative AI startups that cannot get H100 capacity at AWS.

    Three concrete catalysts are worth watching in the next 6 to 12 months:

    1. Compute Subnet Adoption

    The Compute Subnet is the biggest product shift since the Solana migration. If it pulls meaningful AI training and inference demand on-chain, RENDER stops being “the rendering token” and starts being “the decentralized GPU token.” That is a much larger market.

    2. Salad Partnership Scale

    The Render Network integration with Salad brought roughly 60,000 GPUs and reach across 180 countries into the network. That is a step-change in capacity. Settlement happens in RENDER, which directly links network usage to token demand.

    3. The Octane Neural Pipeline

    The next generation of OctaneRender bundles in generative AI tools like Topaz AI, RunwayML, FLUX, and others. Every Octane user touching neural rendering is a potential RENDER buyer. That is a built-in demand funnel from a 100,000+ creator base.

    Technical Outlook: Where the Chart Sits

    RENDER is in a long-term downtrend from the 2024 high but has shown signs of stabilization through Q2 2026. Here is what the data is telling us:

    • Key support: $1.85 to $1.95 zone. This area held on the May pullback and lines up with the 200-day moving average on the weekly. Lose it on a daily close and the next real bid is closer to $1.50.
    • Immediate resistance: $2.45 to $2.60. This is where the late-Q1 distribution range capped price. Reclaim it and the path to $3.20 opens up.
    • 14-day RSI: Hovering in the mid-40s. Neutral territory, room to run in either direction, but no clear oversold or overbought signal.
    • 50-day vs 200-day EMA: 50-day is still curling under the 200-day, a bearish moving average alignment that needs to flip before the long-term trend can be called “up” again.

    Translation: the chart is coiled. Bulls need a clean close above $2.60 to confirm a trend change. Bears need a daily close under $1.85. Until one of those breaks, RENDER is a range trade.

    Recent on-chain activity is more encouraging than the price action suggests. The network processed over 11 million frames in H1 2026 alone, a meaningful jump from prior periods, and the token has been flagged as an “AI infrastructure rotation play” outperforming during recent Bitcoin weakness. That kind of relative strength during a broader market dip is exactly the behavior you want to see from a thesis token.

    Bull Case: AI Compute Rotation Hits

    The bull case is straightforward. AI compute demand keeps growing faster than centralized supply can keep up. Decentralized networks capture a single-digit percentage of the GPU cloud market. That alone is enough to lift RENDER’s revenue, buy pressure, and reflexive narrative.

    Bull case targets:

    • Short-term (30 days): $2.80 to $3.20 if RENDER reclaims the $2.60 resistance and AI narrative momentum stays strong.
    • Mid-term (6 months): $5.00 to $7.00 if Compute Subnet adoption tracks ahead of expectations and BTC dominance starts rolling over.
    • Long-term (2027-2028): $12.00 to $18.00 if RENDER captures meaningful share of AI inference revenue and trades closer to a tech infrastructure multiple.

    For context: that long-term range is roughly the same zone several research outfits, including CoinGecko-tracked aggregators, have used for their upside scenarios.

    Bear Case: AI Rotation Stalls

    The bear case is also clear. Centralized cloud providers expand capacity faster than expected. Decentralized GPU networks remain a niche. Token unlocks and ecosystem grants keep adding supply while real usage growth is too slow to absorb it.

    If that path plays out, RENDER struggles to break $2.60 and slowly grinds back toward the $1.50 to $1.80 zone. A break of $1.50 opens the door to a full retest of the 2022-2023 lows in the $0.40 to $0.80 area. That is the scenario the bears are watching for.

    Bear case targets:

    • Short-term: $1.60 to $1.85
    • Mid-term: $0.95 to $1.40
    • Long-term: $0.50 to $1.00 if the AI compute narrative fails to monetize on-chain

    The risk factors are real. Solana ecosystem stress, like the kind that hit other Solana DeFi projects earlier this year, can hurt sentiment across the chain. Token emissions schedules need to be tracked carefully. And the AI narrative itself can rotate elsewhere fast: when the market falls in love with a new theme, it can fall out of love just as quickly.

    Price Predictions by Timeframe

    Based on the current setup, here is how we are framing RENDER’s probabilistic path. These are scenarios, not guarantees. Use them as a framework, not a roadmap.

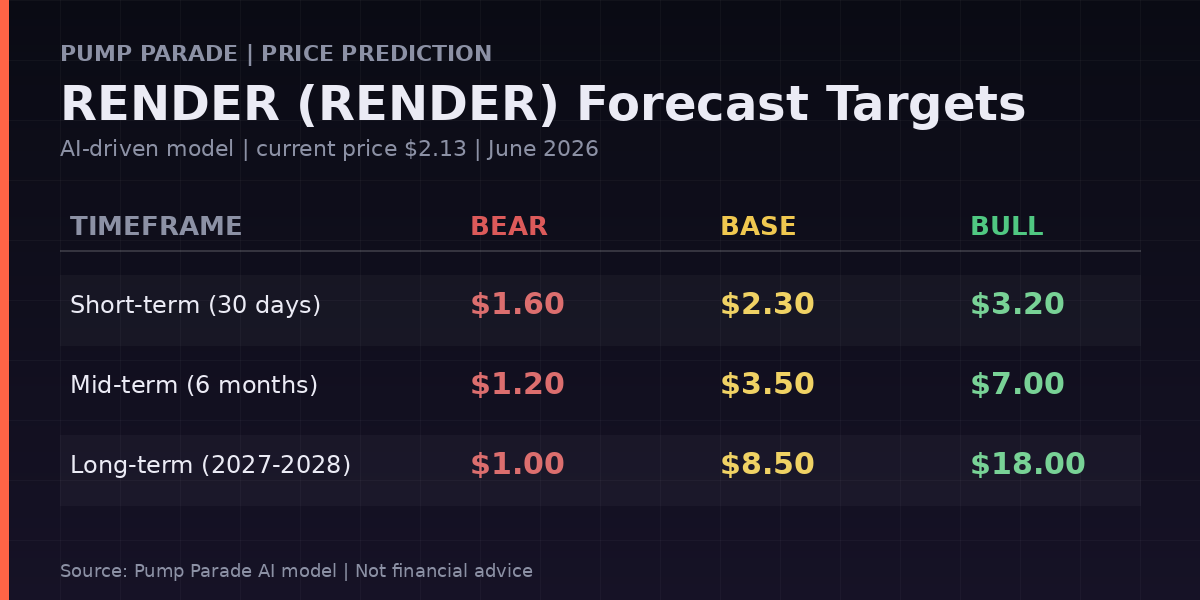
    RENDER price prediction targets table showing short, mid, and long-term bear, base, and bull scenarios

    Short-term (30 days):

    • Bear: $1.60
    • Base: $2.30
    • Bull: $3.20

    Mid-term (6 months):

    • Bear: $1.20
    • Base: $3.50
    • Bull: $7.00

    Long-term (2027-2028):

    • Bear: $1.00
    • Base: $8.50
    • Bull: $18.00

    Our base case assumes the Compute Subnet sees real usage but does not become a runaway hit. The bull case assumes Render captures meaningful AI inference share. The bear case assumes the AI compute thesis fails to monetize on-chain at scale.

    What to Watch

    If you are tracking RENDER, here are the specific signals worth monitoring:

    • Compute Subnet usage data: Frames rendered and compute hours billed, reported each quarter.
    • Frame growth rate: The 11M+ frames in H1 2026 was a milestone. Watch whether H2 keeps pace or accelerates.
    • $2.60 daily close: The technical line in the sand for any near-term trend change.
    • $1.85 support: The line that bears need to break for the deeper downside scenarios.
    • AI narrative rotation: If money rotates out of AI infrastructure tokens into other themes, RENDER will feel it.
    • Octane integration milestones: Every major Octane release that bundles neural pipelines is a potential demand catalyst.

    For broader cycle context, our earlier piece on how Bitcoin’s 2028 outlook shapes the altcoin tape is worth a read. RENDER, like most altcoins, will not run hard until BTC dominance starts cracking.

    The Real Question

    Here is the thing: RENDER is not a memecoin and it is not a layer 1 chasing a TPS narrative. It is a piece of infrastructure with measurable demand, real partnerships, and a product roadmap that lines up with one of the largest secular trends of the decade. That does not make it a buy. It does make it a setup worth monitoring.

    The chart needs to confirm. The on-chain numbers need to keep growing. The AI rotation needs to stick. If all three line up, RENDER has one of the cleanest fundamental stories on Solana. If even one breaks, the range trade continues, and the deeper bear case stays on the table.

    The smart move here is not to predict. It is to define your levels, size your risk, and let the catalysts play out.

    Disclaimer

    Disclaimer: This article is for informational and educational purposes only and should not be construed as financial, investment, or trading advice. Cryptocurrency markets are highly volatile, and past performance does not guarantee future results. The price predictions and analyses presented here are based on AI models, technical indicators, and available data at the time of writing, they are not guarantees. Always conduct your own research (DYOR) and consult with a qualified financial advisor before making any investment decisions. Pump Parade and its authors do not assume liability for financial losses incurred based on information provided in this article.
    Solana (SOL) Price Prediction 2026: Alpenglow Catalyst

    0

    Solana is bleeding again. The token trades near $75.34 at the time of writing, down roughly 4.6% in the last 24 hours and almost 74% below its January 2025 all-time high of $294.85. That is a brutal drawdown for a network that, just 18 months ago, was the consensus alt-L1 trade of the cycle.

    And yet, on-chain activity is steady. SOL is still the highest-volume token on Solana at $6.46 billion in 24-hour trade, and the protocol is days away from its biggest consensus upgrade since Tower BFT shipped. With spot ETFs now holding over $1 billion in SOL and Firedancer slowly eating into validator share, the setup heading into the second half of 2026 looks more interesting than the price chart suggests.

    This is our Solana price prediction for 2026 and beyond. We will walk through current market context, the catalysts that matter, the risks that could break the thesis, and concrete price targets across three timeframes.

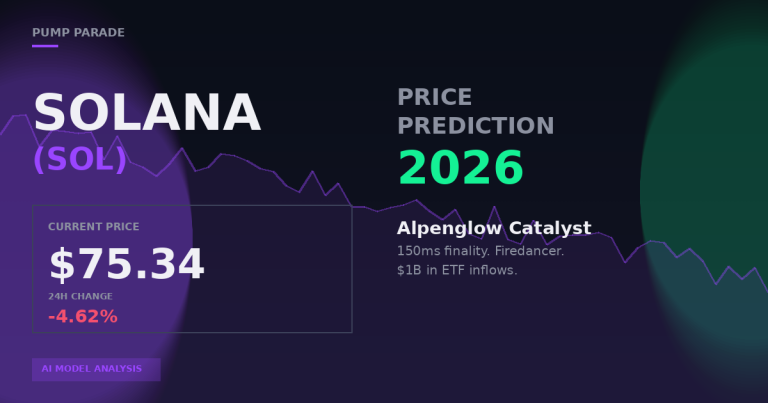
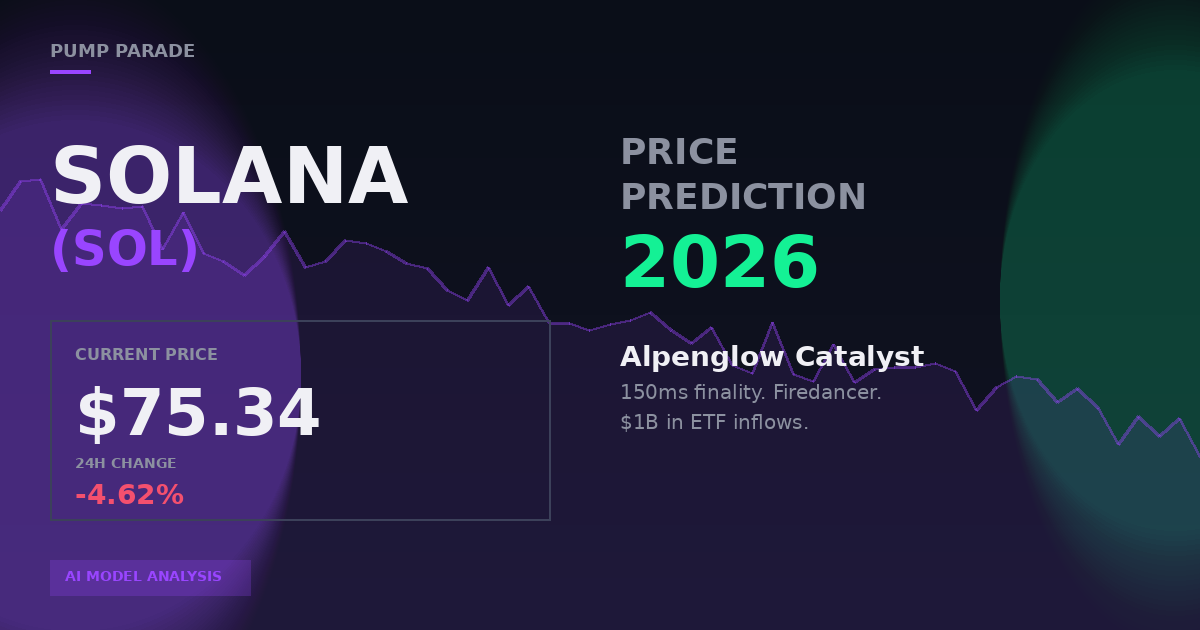
    Solana SOL price prediction 2026 hero graphic showing current price $75.34

    Solana Price Context: Where SOL Sits Today

    The headline number is the gap between price and fundamentals.

    SOL’s all-time high of $294.85 was set on January 19, 2025, during the peak of the post-election crypto melt-up. From there, the token spent most of 2025 grinding lower. It briefly held the $200 zone, then lost it, then revisited the mid-$150s. By May 2026 it was trading near $95. As of June 3, 2026, we are sitting near $75.

    That is a 74% drawdown from peak. For context, Bitcoin’s drawdown from its 2025 high is closer to 35%. SOL has clearly underperformed BTC over the cycle, which is a problem for the “Solana is the next Ethereum” thesis but also a setup if you believe the fundamentals are intact.

    A few snapshot stats from Birdeye:

    • Price: $75.34
    • 24h change: -4.62%
    • 24h volume: $6.46 billion
    • Market cap: $43.6 billion
    • Distance from ATH: -74.4%

    The 24-hour drop is part of a broader BTC-led flush. Over $1.7 billion in leveraged positions got liquidated across the market in the past day. Solana is high beta, so it moved harder than BTC on the downside. That is the bear’s snapshot.

    The Bull Case: Three Catalysts That Could Reprice SOL

    1. Alpenglow Upgrade: 150ms Finality

    This is the upgrade Solana has been pointing at for over a year. Alpenglow replaces the current TowerBFT consensus with two new components: Votor (off-chain vote aggregation) and Rotor (block propagation via a single relay model).

    In plain English: finality goes from roughly 12.8 seconds to about 150 milliseconds. That is fast enough to make Solana feel like a real-time settlement layer, not just a fast chain. For comparison, Ethereum’s economic finality is around 12.8 minutes.

    The upgrade is live on community testnets. Anatoly Yakovenko, Solana’s co-founder, said at Consensus Miami 2026 that mainnet could ship as early as Q3 2026. If that timeline holds, the next 90 days are pre-catalyst.

    2. Firedancer: Client Diversity Plus Throughput

    Firedancer is Jump Crypto’s independent Solana validator client. It is now live on mainnet and carries roughly 14% of network stake as of recent data. The hybrid Frankendancer build pushed Firedancer-derived stake even higher.

    Two things this fixes:

    • Client diversity. Solana’s biggest historical risk was a single-client monoculture. A bug in Agave could halt the chain. With Firedancer scaling up, that single point of failure is shrinking.
    • Throughput headroom. Firedancer passed a 1 million TPS stress test in early 2026. That is theoretical, not live, but it sets the ceiling much higher than the current 4,000 to 5,000 real-world TPS.

    Combined with Alpenglow, this gives Solana an engineering moat that no other smart contract chain currently matches. The question is whether the market prices that in before adoption catches up.

    3. ETF Flows: The Quiet Buyer

    Spot Solana ETFs crossed $1.06 billion in cumulative inflows on May 26, 2026, less than seven months after launch. Bitwise’s BSOL captured 81% of that, with Fidelity’s FSOL and a Morgan Stanley product splitting the rest.

    Weekly flows have averaged around $33 million on a 4-week rolling basis. That is not BTC ETF money, but it is a steady, structural bid that did not exist 12 months ago. While Bitcoin ETFs saw $1.26 billion in outflows over a recent six-session stretch, SOL ETFs posted positive flows.

    This matters more than the dollar amount suggests. ETF flows tend to be price-insensitive and reflect strategic allocation, not retail momentum chasing. A drip of structural demand into an asset with finite supply has compounding effects over a 12-to-18-month window.

    The Bear Case: Why SOL Could Stay Suppressed

    Now the other side of the trade.

    Macro is fragile. Bitcoin trading in the $65k-$70k range with $1.7 billion in liquidations in a single day is not a backdrop where altcoins rally. If BTC breaks $60k, SOL likely revisits the $50s.

    TVL is soft. Solana’s DeFi TVL has not recovered to its 2024 peak. Most of the on-chain activity is concentrated in memecoin trading and perp DEXes, which is volatile revenue. If memecoin volume dries up, fee generation falls and the deflationary supply story weakens.

    Revenue gap stays open. Despite Firedancer and Alpenglow, Solana’s annualized revenue is still well below Ethereum’s. Speed gains do not automatically translate into fee capture. The market may keep discounting Solana on a revenue-per-token basis until that gap closes.

    Unlock pressure. SOL still has ongoing token unlocks from the FTX estate distribution and other locked allocations. Supply overhang is real, even if smaller than it was a year ago.

    ETF concentration risk. Bitwise’s BSOL holds 81% of the entire spot SOL ETF AUM. If a single large holder rotates out, the impact on flow narrative is outsized.

    Technical Outlook

    On the daily chart, $75 is acting as the key zone. The 50-day moving average sits near $88, which is now resistance. The 200-day is closer to $120, well overhead.

    Key levels to watch:

    • Support: $70 (psychological), then $58-$60 (April 2026 low zone)
    • Resistance: $88 (50-day MA), then $100 (round number), then $120 (200-day MA)

    RSI on the daily is in the high 30s. Not deeply oversold, but no longer overbought. Volume on the recent drop was elevated, which is typical of capitulation moves but not yet conclusive. For trend reversal, bulls want to see a daily close back above $85 with rising volume.

    If you want a deeper look at how Solana DeFi tokens move alongside SOL, see our Raydium price prediction for the ecosystem ripple effect.

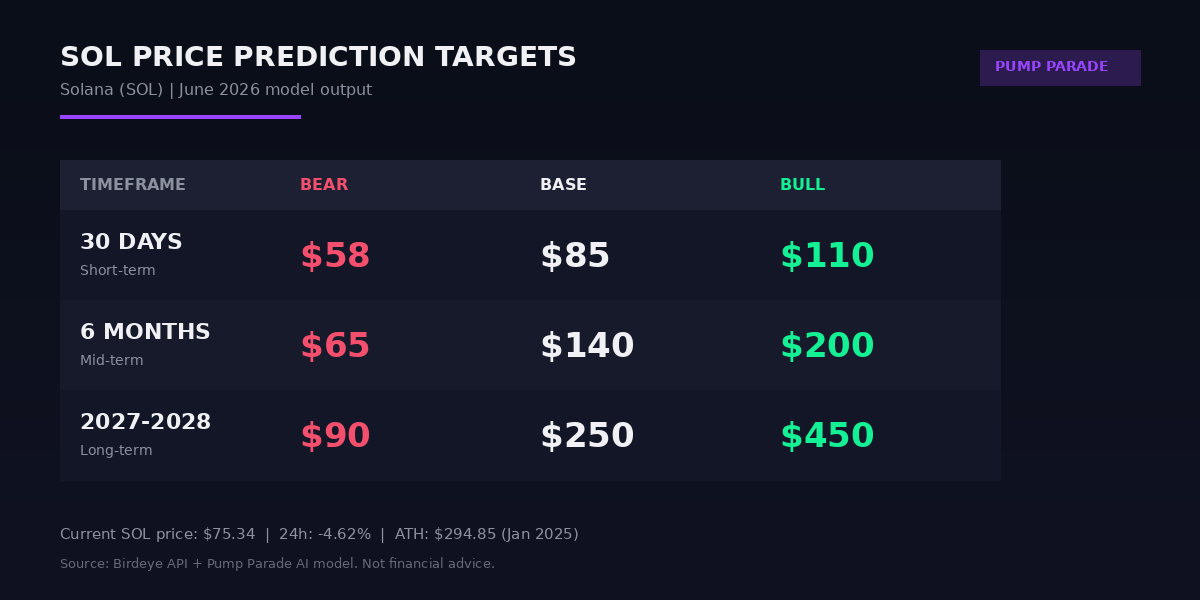
    Solana SOL price prediction targets bear base bull short mid long term

    Solana Price Predictions by Timeframe

    These targets blend technical levels, ETF flow trajectory, on-chain fundamentals, and a probability-weighted view of the Alpenglow timeline. They are not guarantees. They are scenario ranges.

    Short-Term (30 Days)

    • Bear: $58. BTC loses $60k, broad altcoin flush, SOL retests the spring lows.
    • Base: $85. SOL stabilizes, reclaims the 50-day MA on Alpenglow anticipation.
    • Bull: $110. Alpenglow ships earlier than expected, ETF flows accelerate, BTC reclaims $75k.

    Mid-Term (6 Months)

    • Bear: $65. Alpenglow delays into 2027, macro stays risk-off, ETF flows stall.
    • Base: $140. Alpenglow ships, Firedancer crosses 25% stake, ETF AUM passes $2 billion.
    • Bull: $200. All catalysts hit, fee revenue grows, Solana captures a meaningful share of stablecoin payment flow.

    Long-Term (2027-2028)

    • Bear: $90. Alpenglow ships but does not change adoption trajectory, ETH ecosystem outcompetes.
    • Base: $250. Solana reclaims its 2025 ATH and consolidates. Standard Chartered’s $250 target aligns here.
    • Bull: $450. New cycle high. Alpenglow plus Firedancer plus ETF maturation plus payment adoption all compound. Roughly matches the average of nine analyst forecasts cited at $445.

    What Would Change Our View

    The base case assumes Alpenglow ships in Q3 or Q4 2026 and that ETF flows stay positive at the current $33 million weekly pace. If either breaks down, the base case rotates toward the bear scenario.

    What would push us bullish:

    • Alpenglow mainnet launch with no rollback
    • Firedancer crossing 30% of stake before year-end
    • A second wave of issuers entering the SOL ETF category
    • Stablecoin TVL on Solana growing meaningfully (currently a weak point)

    What would push us bearish:

    • BTC losing the $55k zone
    • A consensus bug during Alpenglow rollout
    • Major outflows from BSOL or another large ETF holder
    • Memecoin volume on Solana collapsing without a replacement use case

    Bottom Line

    Solana at $75 is a tougher trade than Solana at $200 was last year, but the engineering fundamentals are objectively stronger. Alpenglow plus Firedancer puts Solana ahead of every other L1 on raw performance. ETF infrastructure provides a structural bid that did not exist before. The price is depressed because macro is weak and the network has not yet translated speed into fee capture.

    If you believe the catalysts ship and the macro stabilizes, the risk-reward at $75 is more favorable than it has been all year. If you think Bitcoin breaks down further or Alpenglow slips into 2027, there is more downside to clear first.

    This is a setup worth monitoring, not a guaranteed bounce. Position size accordingly.

    Price data sourced from Birdeye on June 3, 2026. ETF flow data via Farside Investors and CoinGlass.

    Disclaimer

    Disclaimer: This article is for informational and educational purposes only and should not be construed as financial, investment, or trading advice. Cryptocurrency markets are highly volatile, and past performance does not guarantee future results. The price predictions and analyses presented here are based on AI models, technical indicators, and available data at the time of writing, they are not guarantees. Always conduct your own research (DYOR) and consult with a qualified financial advisor before making any investment decisions. Pump Parade and its authors do not assume liability for financial losses incurred based on information provided in this article.
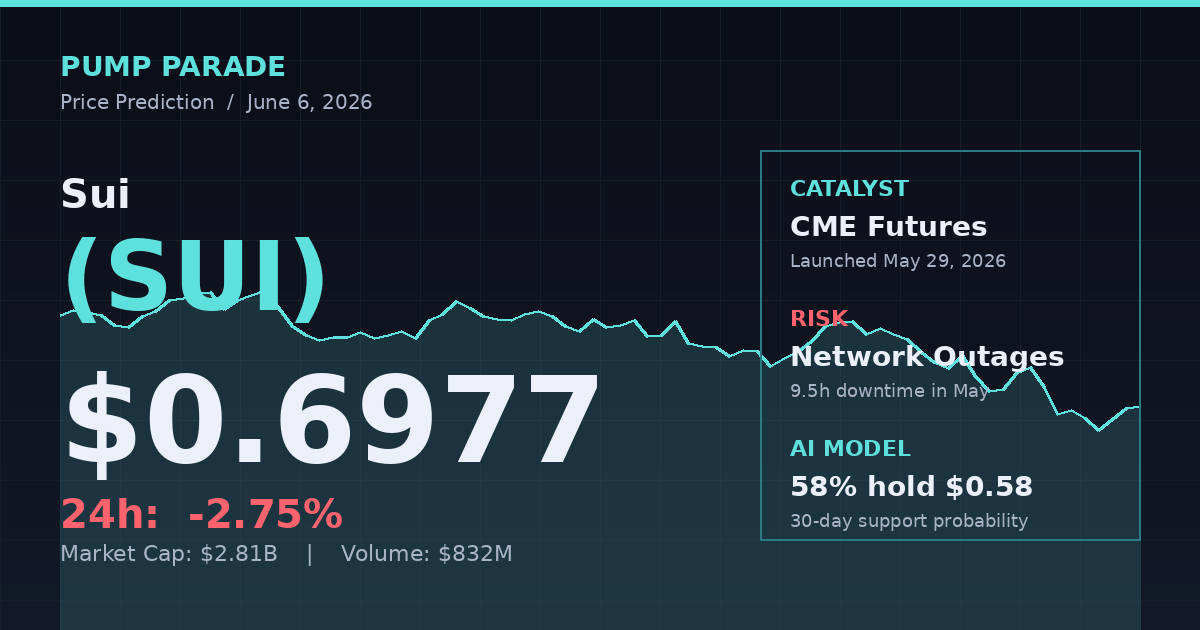
    Moonshot Review 2026: Fees, Features & Verdict

    0

    Buying a Solana memecoin used to mean juggling a wallet seed phrase, a DEX aggregator, a slippage slider, and a stack of failed transactions. Moonshot wants to collapse all of that into a single tap. With Apple Pay funding, a curated discovery feed, and a self-custodial wallet hiding under the hood, it has become one of the most downloaded crypto apps for memecoin traders on Solana. But is the convenience worth the fee, and how has the product changed since Jupiter took a majority stake in January 2025?

    This Moonshot review for 2026 covers the features, fees, security model, user experience, and competitive position so you can decide whether it deserves a permanent spot on your home screen.

    Quick Verdict (TL;DR)

    Moonshot is the easiest way to buy a Solana memecoin with a credit card or Apple Pay, full stop. The mobile-only experience is genuinely polished, the self-custodial setup is invisible to the user, and post-Jupiter integration has tightened the routing and discovery layer. The catch is the fee. At 2.5 percent on smaller trades, you are paying for convenience, not cost efficiency.

    Rating: 4.0 / 5. Best for new traders, mobile-first users, and anyone who values speed over squeezing every basis point. Not the right choice for active scalpers or whales chasing the cheapest possible execution.

    Visit Moonshot to try the app, or keep reading for the full breakdown.

    What Is Moonshot?

    Moonshot is a mobile-first, self-custodial trading app focused on Solana memecoins. It was launched in June 2024 by the team behind DEX Screener, the dominant on-chain analytics dashboard for new tokens. The product is available on iOS and Android. There is no desktop version, by design.

    The pitch is simple. Open the app, sign in with email or social login, fund it with Apple Pay, a card, or crypto, and you can buy any Solana token in a few taps. The wallet keys are generated and protected via Multi-Party Computation through Turnkey, so users never see a seed phrase, but they still retain control of the funds. Fiat on and off ramps are handled by MoonPay, Coinbase Pay, and Robinhood Connect, depending on region and payment method.

    In January 2025, Jupiter acquired a majority stake in Moonshot, in the same week it picked up portfolio tracker SonarWatch. The acquisition came on the back of a record period during the launch of the Official Trump memecoin, when Moonshot added more than 400,000 new users in 24 hours and processed close to 400 million dollars in trading volume. That single weekend was enough to put the app on every Solana trader’s radar.

    Moonshot mobile app interface from the official Moonshot website

    Key Stats at a Glance

    Moonshot is no longer a niche side project. The numbers from the past 18 months tell a clear story.

    Moonshot key stats infographic showing downloads, volume, fees, and Jupiter acquisition

    For a publicly visible record of total trading fees Moonshot has generated, the community-maintained Dune dashboard is the cleanest source. DeFiLlama tracks fee revenue as well and is useful for comparing Moonshot to other Solana front ends.

    Features Deep Dive

    Onboarding and Funding

    Onboarding is where Moonshot earns most of its credit. New users can be transacting within roughly two minutes. Sign in with Apple, Google, or email, accept terms, and the wallet is spun up in the background. Funding options include Apple Pay, debit and credit cards, ACH in supported regions, and deposits in SOL, USDC, or USDT.

    The Apple Pay flow in particular is unusually clean for crypto. Most competitors still bounce users to a third party Stripe-style checkout. Moonshot keeps the experience native, even though MoonPay is processing the fiat behind the scenes.

    Discovery and Trading

    The home feed surfaces trending tokens with recent volume, price action, and basic charts, similar to a stripped down DEX Screener inside a phone-shaped frame. Tapping a token opens its detail page with contract address, holders, security checks, social links, and a single buy or sell button. Slippage is set automatically with a 5 percent dynamic ceiling, which is reasonable for memecoins but worth tightening manually if you are buying liquid majors.

    Since the Jupiter acquisition, swap routing has been tied more deeply into the Jupiter aggregator backend, which generally improves execution on less liquid pairs compared to the earlier in-house routing.

    Withdrawals and Sends

    Users can withdraw to a bank account through the same fiat partners, or send tokens out to any external Solana wallet such as Phantom, Backpack, or Solflare. Moonshot does not charge an administrative fee on sends, only the standard Solana network cost.

    Token Launchpad

    Moonshot also includes a lightweight launchpad. Anyone can mint a memecoin from the app with a fixed configuration, then trade it on the same surface. This feature is less aggressive than pump.fun’s bonding curve model and skews more toward casual creators than launchpad farmers.

    Fees and Pricing

    Moonshot’s fees are the single biggest source of debate among users, and they deserve a careful look.

    Trading fees follow a two tier structure as published in the official Moonshot fee documentation:

    • Trades from 1 to 250 USD: 2.5 percent platform fee, with a minimum fee of roughly 0.99 USD per trade.
    • Trades above 250 USD: 1 percent platform fee.

    These figures are inclusive of the network fees and priority fees that Moonshot pays on behalf of users to keep transactions landing during congestion. That coverage is the main justification for the spread. A direct on-chain swap on Jupiter typically costs only a few cents in Solana fees plus a small DEX fee, but you have to manage your own priority and slippage.

    Fiat fees are layered on top by MoonPay. A typical Apple Pay or card deposit in the US adds roughly 3.5 to 4.5 percent depending on the size of the deposit and the card type. ACH and crypto deposits are significantly cheaper.

    Slippage defaults to a 5 percent dynamic tolerance. That is generous and intentional given how violently memecoin prices move, but it means you can sometimes receive notably less than the quoted amount. Power users should reduce this manually for stable pairs.

    A practical takeaway. For a 100 dollar buy of a brand new memecoin funded with Apple Pay, you are probably looking at a total all in cost in the 5 to 7 percent range once platform and fiat fees stack. That is real money, but it is also competitive with Robinhood and Coinbase consumer pricing for similar speculative tokens.

    Pros and Cons

    Pros

    • Fastest fiat to Solana memecoin path in mobile crypto. Apple Pay onboarding is best in class.
    • Self-custodial wallet without a seed phrase, secured by MPC via Turnkey.
    • Tight integration with Jupiter routing since the 2025 acquisition.
    • Built in launchpad and discovery feed, useful for casual traders.
    • No administrative fee on outbound sends to external wallets.
    • Strong backing from Alliance and now Jupiter, with a credible operational track record.

    Cons

    • 2.5 percent fee on smaller trades is high versus direct DEX swaps.
    • Mobile only, no desktop or web app for power users.
    • Default 5 percent slippage can hurt on stable pairs if not adjusted.
    • Founding team remains pseudonymous, though investor backing is public.
    • Withdrawal limits and KYC requirements vary by region and payment method.
    • Limited chart and order book features compared to dedicated trading terminals.

    Security and Trust

    Security is the area where Moonshot has worked hardest to look adult. The wallet uses Multi-Party Computation through Turnkey, meaning the private key is split into shares and never reconstructed in one place. There is no seed phrase to lose, but the user can still export the underlying key to import the wallet elsewhere, which preserves the self-custody promise.

    Fiat compliance is delegated to regulated providers. MoonPay, Coinbase Pay, and Robinhood Connect are all licensed money transmitters in the regions they operate, which is what allows Moonshot to live in the Apple App Store and Google Play.

    The remaining risk surface is the application layer. Moonshot has not publicly disclosed a comprehensive security audit of its in app routing and order construction, which is something the team should address as the product matures. Sensitive operations should still be performed on a hardware wallet such as Ledger or Trezor for larger balances.

    User Experience

    This is where Moonshot earns its reputation. The app feels closer to a modern consumer fintech product than to a crypto wallet. Animations are smooth, copy is plain English, and you can complete a full buy in well under 60 seconds from a cold start. There is genuine attention paid to the kind of details that newer crypto users actually struggle with, such as understanding what slippage means or why a transaction failed.

    The home feed, while not as data dense as DEX Screener or Birdeye, is good enough to act on if you are scanning for movers. Notifications can be configured for price moves on watchlisted tokens, which is useful when a memecoin starts running.

    The biggest UX shortcoming is the lack of advanced trading tools. There are no limit orders, no stop losses, and no advanced charting. For anything beyond casual entries and exits, a dedicated terminal like Photon or BullX is still the right tool. Moonshot is explicitly not trying to be that product.

    Stylized mobile trading interface representing Moonshot's UX

    How Moonshot Compares

    For Solana memecoin traders the practical competitive set is roughly:

    • Direct DEX via Phantom or Backpack: Cheapest pure execution, requires more setup and seed phrase management.
    • pump.fun: Launchpad first, lower fees during the bonding curve, but a different product surface.
    • Photon, BullX, GMGN, Trojan: Pro trading terminals with limit orders, copy trading, and faster sniping. Much higher learning curve.
    • Coinbase or Robinhood: Easier fiat onramp than ever, but extremely limited memecoin selection.

    Moonshot sits in a clear lane: easier than the DEX, broader than Coinbase, simpler than the pro terminals. That is a real position to occupy.

    Verdict

    If you are a new or casual Solana memecoin trader who values speed and simplicity over saving a few basis points on every fill, Moonshot is the most polished mobile option available in 2026. The Jupiter acquisition has made the routing better, the team has more resources, and the product still feels miles ahead of any other consumer crypto app on iOS. Pay the convenience premium with eyes open, keep large balances elsewhere, and adjust slippage when you are not buying a brand new ticker.

    If you are an active trader running multi token entries, scalping low caps, or executing strategies that require limit orders and faster sniping, Moonshot is not your primary tool. Use a pro terminal and treat Moonshot as the fiat ramp for your hot wallet.

    Final rating: 4.0 / 5. The best mobile memecoin app for the general market, with a fee structure that is honest about what it is paying for.

    Try Moonshot here if you want to test it firsthand. Start with a small deposit, look at the realised fee on the receipt, and decide whether the convenience is worth it for your style.

    FAQ

    Is Moonshot safe to use?

    Moonshot is a self-custodial wallet protected by Multi-Party Computation via Turnkey, with fiat handling delegated to regulated providers like MoonPay. It is broadly safe for everyday use, but large balances should be held on a hardware wallet, and users should still verify token contracts before buying.

    What are Moonshot’s fees in 2026?

    Trades from 1 to 250 USD incur a 2.5 percent platform fee, with a minimum of about 0.99 USD. Trades above 250 USD are charged 1 percent. Network and priority fees are included. Fiat deposit fees from MoonPay are separate and depend on the payment method.

    Is Moonshot owned by Jupiter?

    Jupiter acquired a majority stake in Moonshot in January 2025. The product continues to operate under the Moonshot brand, but routing and back end infrastructure are increasingly tied into the Jupiter ecosystem.

    Can I use Moonshot outside the US?

    Yes. Moonshot is available in most regions where the App Store and Google Play distribute crypto apps, although fiat funding options vary by country. Some payment methods such as ACH are US only.

    Does Moonshot support chains other than Solana?

    The core experience is built around Solana memecoins. Some token expansion has been added through the Jupiter integration, but Solana remains the primary chain. Users wanting heavy multichain exposure should pair Moonshot with a broader wallet like Phantom or Rabby.

    Hedera (HBAR) Price Prediction 2026: CLARITY Catalyst

    0

    Hedera (HBAR) is trading at $0.0901 at time of writing, down 4.8% in the last 24 hours but up 2.8% on the week. That sideways grind hides what could be the most loaded month HBAR has had since the 2021 cycle peak.

    Three catalysts are stacking up at the same time. The Canary HBAR ETF, which trades on Nasdaq under HBR, has already absorbed roughly 549 million tokens, about 1.3% of circulating supply. The CLARITY Act passed the Senate Banking Committee 15 to 9 in May and is nearing a full Senate vote inside the June to August window. And in March, Hedera launched Agent Lab, a no-code platform for putting autonomous AI agents on-chain, with every agent transaction burning HBAR for fees.

    One of those catalysts on its own would be worth watching. Three of them landing in the same quarter is the kind of setup that does not show up in every cycle. Here is what the data says HBAR could do from here, and the scenarios where it does not work.

    Hedera HBAR price prediction 2026 hero , current price bash.0901, CLARITY Act and Canary ETF catalysts

    HBAR Right Now: The Numbers

    Quick snapshot from CoinGecko at time of writing:

    • Price: $0.0901
    • Market cap: $3.90B (rank #29)
    • 24h volume: $112M
    • 24h range: $0.0900 to $0.0949
    • 7-day change: +2.81%
    • 30-day change: +2.59%
    • 1-year change: -46.97%
    • All-time high: $0.5692 (September 2021)
    • Circulating supply: 43.37B of 50B max

    HBAR is sitting roughly 84% below its all-time high. That is the kind of drawdown that looks scary on a chart and looks like an entry zone if the fundamentals are improving. Let’s see which one this is.

    What Hedera Actually Does, in Plain Terms

    Hedera is a layer-1 network that uses hashgraph consensus instead of a classic blockchain. Translation: it processes transactions in parallel rather than in sequence, which is why it can run at very high throughput with sub-cent fees and finality in seconds. The HBAR token is used to pay those fees and to secure the network through staking.

    The unusual thing about Hedera is its governance. It is run by the Hedera Governing Council, a rotating group of large enterprises. Current members include Google, IBM, Dell, Boeing, Standard Bank, and as of recent additions, Accenture, FedEx, and McLaren Racing. You can like or dislike that structure, but it is the reason enterprise pilots end up on Hedera rather than on more decentralized chains.

    Catalyst 1: The Canary HBAR ETF Is Quietly Soaking Up Supply

    The Canary HBAR ETF (ticker HBR on Nasdaq) is a regulated spot product that holds HBAR on behalf of investors. Recent disclosures show it has accumulated around 549 million HBAR, roughly 1.3% of circulating supply, in its first months of trading.

    That figure matters for two reasons. First, ETF holdings tend to be sticky. Tokens that move into a regulated wrapper rarely come back to the open market quickly. Second, the absolute number is small enough that the ETF still has plenty of room to grow if institutional flows accelerate. For context, the spot Bitcoin ETF complex absorbed several percent of BTC supply within its first year. If HBR follows a similar curve, that is real, sustained buy pressure.

    Catalyst 2: The CLARITY Act Is the Cleanest Regulatory Setup HBAR Has Ever Had

    The Responsible Financial Innovation Act, better known as the CLARITY Act, would split crypto oversight cleanly between the SEC and the CFTC. Tokens that meet the bill’s definition of digital commodities, which HBAR is widely expected to qualify as, would fall under CFTC jurisdiction.

    The bill cleared the Senate Banking Committee on May 14 with a 15 to 9 vote. According to CoinDesk reporting, that committee vote already moved XRP, DOGE, and several other compliance-sensitive tokens. The realistic passage window is now June through the early August recess.

    For HBAR specifically, the CLARITY Act is bigger than the price reaction it might trigger. Most of Hedera’s enterprise pilots are gated by exactly this kind of regulatory ambiguity. A signed bill turns “we are evaluating” into “we are deploying” for legal and compliance teams. That is a slower catalyst than a price pump, but it is the one that compounds.

    Catalyst 3: Agent Lab Turns AI Hype Into Real HBAR Burn

    In March, Hedera launched Agent Lab, a browser-based platform that lets developers deploy autonomous AI agents on-chain without writing code. Each agent comes with spending caps and transaction limits, which matters for enterprises that need risk controls before they let an AI move money.

    The key economic detail: every agent transaction consumes HBAR. If even a fraction of the AI-agent narrative that drove tokens like Bittensor and Virtuals plays out on Hedera, that is sustained fee demand pointed at a fixed supply. It is the same flywheel that made Ethereum’s fee burn matter, only earlier in the curve.

    This is also why HBAR fits the AI infrastructure narrative without being a pure AI token. Hedera sells the rails, not the model. Rails tend to age better.

    Technical Outlook: Where the Levels Are

    HBAR has spent the last month range-bound between roughly $0.088 and $0.095. The 50-day moving average sits just above current price, and the 200-day is the wall to break at around $0.118.

    Key levels to watch:

    • Support: $0.088 (recent range low). A clean break below this opens the door to $0.075.
    • Resistance 1: $0.095 (24h high and short-term ceiling).
    • Resistance 2: $0.118 (200-day moving average). This is the level that confirms a trend change.
    • Breakout target: $0.14, where the next major liquidity zone sits.

    The RSI (Relative Strength Index, a momentum gauge) is sitting in the low 40s, which is neutral leaning oversold. That is the kind of reading that does not predict direction on its own, but does suggest the downside is well-priced if news flow stays constructive.

    Bull Case for HBAR

    The bull case is the stacking of those three catalysts inside the same window.

    If the CLARITY Act passes the full Senate before recess, HBR ETF flows accelerate, and Agent Lab transaction counts trend up through Q3, the path to $0.14 in 30 to 90 days is reasonable. That is a roughly 55% move from current price. It does not require a broader altcoin rally, only HBAR-specific flows.

    On a longer horizon, if institutional adoption of Hedera’s enterprise rails actually scales, the comparison set shifts. HBAR is a top-30 token by market cap with top-5 enterprise integrations. A re-rating closer to its 2021 peak around $0.50, while not a base case, is what bulls are pricing.

    Bear Case for HBAR

    The bear case starts with everything that has held HBAR back for two years. Hedera is down nearly 47% year over year while Bitcoin and several layer-1 peers have outperformed. That is not a vote of confidence from the market.

    Specific risks worth pricing:

    • CLARITY delay or dilution. If the bill slips past the August recess or gets watered down, the regulatory tailwind weakens.
    • ETF flow disappointment. 549 million tokens absorbed is a respectable start, not a runaway. If flows plateau, the bid disappears.
    • Agent Lab adoption is unproven. No-code AI platforms have a long history of impressive demos and slow real-world usage. The HBAR burn thesis only works at scale.
    • Supply overhang. Roughly 6.6B HBAR is still locked in the treasury. Release schedule is public and gradual, but it is real future supply.
    • Macro and broader crypto. Bitcoin dominance sits near 60%, and Bitcoin recently slid to a 7-week low near $69.7K on heavy ETF outflows. Altcoins do not run easily against that backdrop.

    If the catalysts disappoint and BTC stays heavy, a retest of the $0.075 area, roughly 17% below current price, is on the table.

    HBAR Price Predictions by Timeframe

    Based on our hybrid AI model, current technicals, and the catalyst calendar, here is how we frame the next two years. These are scenarios, not targets, and each one carries the same disclaimer at the end of this article.

    HBAR price prediction targets table for short-term, mid-term, and long-term scenarios

    Short-term (30 days): Bear $0.075, Base $0.105, Bull $0.135. Range-trading until a catalyst breaks the tape. CLARITY headlines are the swing factor.

    Mid-term (6 months): Bear $0.06, Base $0.14, Bull $0.22. The base case assumes CLARITY passage and steady ETF flows. The bull case assumes Agent Lab adoption starts showing up in on-chain activity.

    Long-term (2027-2028): Bear $0.05, Base $0.20, Bull $0.45. The bull case is a partial retrace toward the 2021 high on the back of real enterprise adoption. The bear case is the AI and regulatory catalysts simply not converting into HBAR demand.

    How HBAR Stacks Up Against Other Catalyst Plays

    HBAR sits in a peer group with other enterprise and payments-rail layer-1s that have similar regulatory exposure. For a parallel read on how regulation can move a token’s chart, our recent Stellar (XLM) Price Prediction 2026: DTCC Catalyst piece walks through a similar setup. The pattern there, a long base followed by a single institutional catalyst, is exactly what HBAR bulls are betting on.

    What to Watch From Here

    If you are monitoring HBAR over the next 30 to 90 days, four things matter more than daily price moves:

    1. CLARITY Act calendar. Senate floor schedule, committee amendments, any signal from leadership on timing.
    2. Canary HBR ETF holdings. Track the daily token count. Acceleration is bullish, plateau is neutral, outflows would be a real warning.
    3. Agent Lab on-chain activity. Look at Hedera’s daily transaction counts and the share coming from agent contracts.
    4. The $0.118 level. Clearing the 200-day moving average is the technical confirmation that the catalysts are actually translating into price.

    The setup is real. Whether it converts is a question of execution and timing, and that is what the next two months will decide.

    Disclaimer: This article is for informational and educational purposes only and should not be construed as financial, investment, or trading advice. Cryptocurrency markets are highly volatile, and past performance does not guarantee future results. The price predictions and analyses presented here are based on AI models, technical indicators, and available data at the time of writing, they are not guarantees. Always conduct your own research (DYOR) and consult with a qualified financial advisor before making any investment decisions. Pump Parade and its authors do not assume liability for financial losses incurred based on information provided in this article.