More
    Home Blog Page 21

    Lido DAO (LDO) Price Prediction 2026

    0
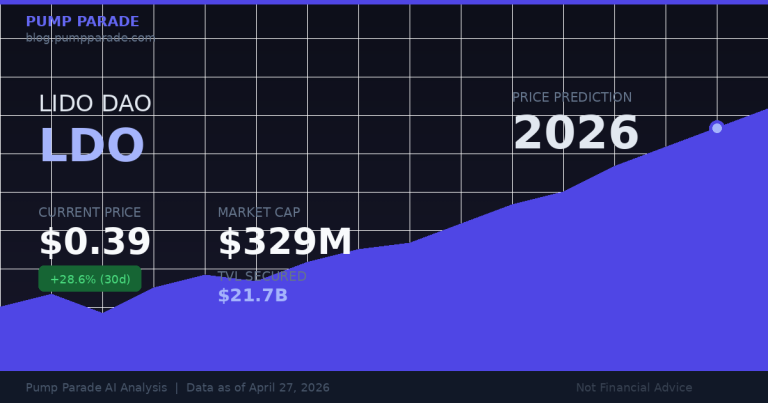
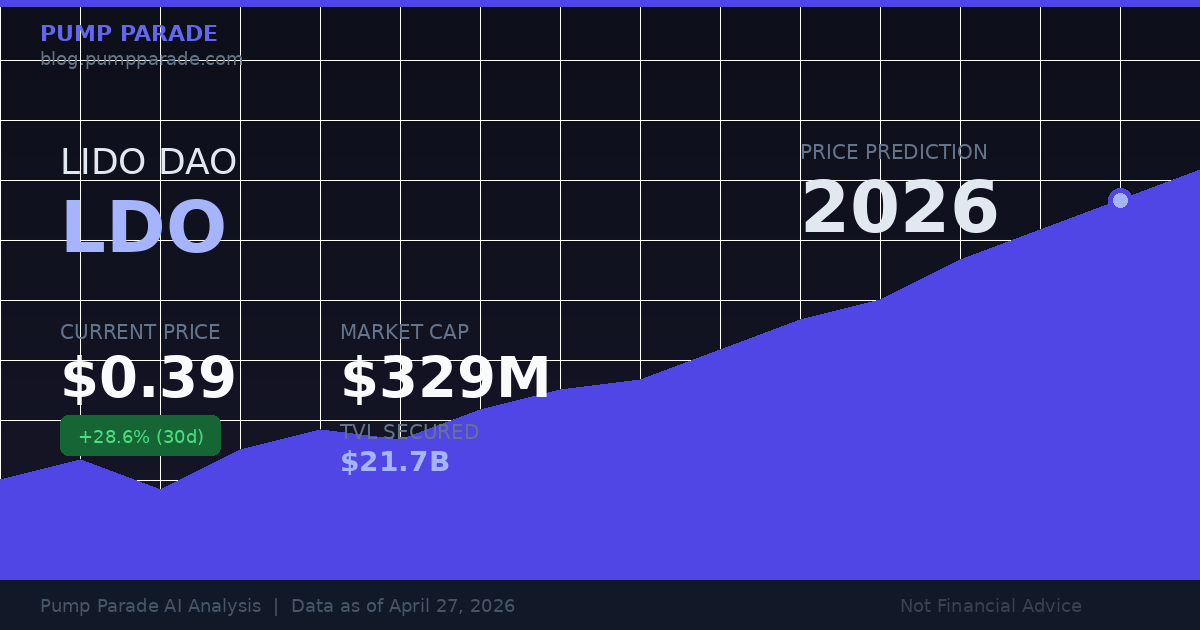
    Lido DAO LDO price prediction 2026 hero graphic showing current price $0.39 and market data

    Lido DAO (LDO) hit an all-time low of $0.271 on March 8, 2026. Six weeks later, it is trading at $0.39, up 28.6% over the past 30 days. The intraday high on April 27 touched $0.467, driven by a confirmed technical breakout from a multi-month descending channel. Volume surged to $322 million in the past 24 hours.

    That is not a random bounce. Lido V3, launched in January 2026, introduced a new modular staking architecture called stVaults. That product is now live, and early adoption is building. Behind the token sits $21.7 billion in total value locked, making it one of the largest DeFi protocols on Ethereum by assets. The market cap of the LDO token is only $329 million. That mcap-to-TVL ratio of 0.02 is one of the lowest in the sector.

    This article breaks down what is driving LDO right now, where the bull and bear cases stand, and what our AI model says about price targets through 2028.

    What Is Lido DAO?

    Lido is the largest liquid staking protocol on Ethereum. It lets you stake ETH without running a validator yourself. In return, you receive stETH, a token that represents your staked position and earns daily staking rewards.

    In plain terms: you deposit ETH, Lido stakes it with professional node operators, and you get a liquid token you can use in DeFi while still earning roughly 3-4% APR. This solved a key problem with Ethereum’s Proof of Stake model, where native staking locks up funds for extended periods.

    Today, Lido controls approximately 23% of all staked ETH, making it by far the largest single staking provider on the network. As of April 27, 2026, roughly $21.7 billion in ETH sits in Lido’s contracts.

    LDO is the governance token. Holders vote on protocol parameters, fee structures, and validator whitelisting. It does not directly capture protocol fees but acts as a claim on the protocol’s direction and future revenue streams.

    What Changed: Lido V3 and stVaults

    The most important development for Lido in 2026 is the V3 upgrade. It launched on Ethereum mainnet on January 30, 2026, and introduces a new primitive called stVaults.

    stVaults are isolated staking environments. Each vault can customize how rewards are distributed, which validators it uses, and how it interacts with DeFi protocols, all within Lido’s existing liquidity and security framework. The fixed Lido protocol fee is 10%, but for early vault operators, Lido cut its infrastructure fee to 0% on March 31, 2026, to accelerate adoption.

    Early integrations are already live. Linea has integrated native yield for bridged ETH. Nansen launched its first Ethereum staking product using stVaults. The goal set in Lido’s GOOSE-3 strategic proposal is to attract 1 million ETH staked through these vaults by the end of 2026.

    This is a meaningful shift. Lido is moving from a single-product liquid staking protocol to a modular staking infrastructure layer. The addressable market expands from retail stakers to include institutional operators, L2s, and DeFi protocol builders. See also our analysis of Ethereum’s own price trajectory in 2026, since LDO’s fortunes are tightly correlated with ETH demand.

    Technical Analysis: The Breakout Is Real

    LDO has been inside a descending channel since mid-2025. On April 27, 2026, analysts confirmed a breakout and completed a breakout-and-retest sequence on the daily chart.

    Key levels to know:

    • Support: $0.36, aligning with the former channel resistance that is now being retested as support. A close below this invalidates the near-term bull case.
    • Next resistance: $0.52, which is the 50-day moving average. LDO needs to reclaim this level to confirm the trend reversal.
    • Major resistance: $0.80 to $0.90, a congestion zone from Q4 2025 where previous rallies failed.

    The RSI (Relative Strength Index, a momentum indicator) was coming off oversold territory after the March lows. It is now in the mid-50s, meaning momentum is building without being overbought. That is historically a good entry window for continuation moves.

    On-chain data from the April 27 breakout day showed 141 new wallet addresses entering the protocol, the strongest network growth in nearly two months. That is organic participation, not just leverage speculation.

    Bull Case: Why LDO Could Trade Much Higher

    The bull case for LDO in 2026 has three distinct pillars.

    1. Extreme undervaluation relative to TVL. A market cap of $329 million sitting on top of $21.7 billion in TVL is a 0.02 mcap/TVL ratio. For context, most mature DeFi protocols trade at 0.05 to 0.15. If Lido re-rates even to 0.05, that implies a market cap of $1.08 billion, roughly 3x current levels. This is not a price target, it is a valuation framework that shows how much compression has occurred.

    2. Lido V3 opens new revenue streams. stVaults allow Lido to serve institutional clients, L2s, and DeFi protocols that need customized staking. Lido’s $60 million expansion plan for 2026 targets exactly this market. As TVL grows through vaults and new wrappers like stETH-based ETPs, the case for LDO as the governance token of a growing fee-generating platform improves.

    3. ETH staking demand is structurally growing. As ETH price recovers and the staking yield remains attractive at 3-4%, more ETH flows into staking. Lido captures roughly 23 cents of every dollar that goes into Ethereum staking. A sustained ETH bull market is a direct tailwind.

    Bear Case: The Risks Are Real Too

    The bear case for LDO deserves equal weight.

    1. LDO does not directly capture fees. The governance token gives holders voting rights, not a direct claim on protocol revenue. This has been a persistent criticism. If Lido does not implement a fee-sharing mechanism, LDO remains a bet on narrative and speculation, not cash flows.

    2. Competition is intensifying. Rocket Pool, Stader, and Frax Ether all compete for ETH staking market share. Ethereum’s planned future upgrades could also make solo staking easier, reducing the market Lido serves.

    3. Regulatory risk for liquid staking. Regulators in the US and EU have scrutinized liquid staking products. A ruling that stETH constitutes a security would be a severe negative catalyst for the protocol and LDO alike.

    4. The ATH is a long way up. LDO’s all-time high was $7.30 in August 2021. The token is currently down 94.7% from that peak. Even a recovery to $1 represents a significant move, and a full cycle recovery is a multi-year thesis.

    LDO Price Predictions 2026
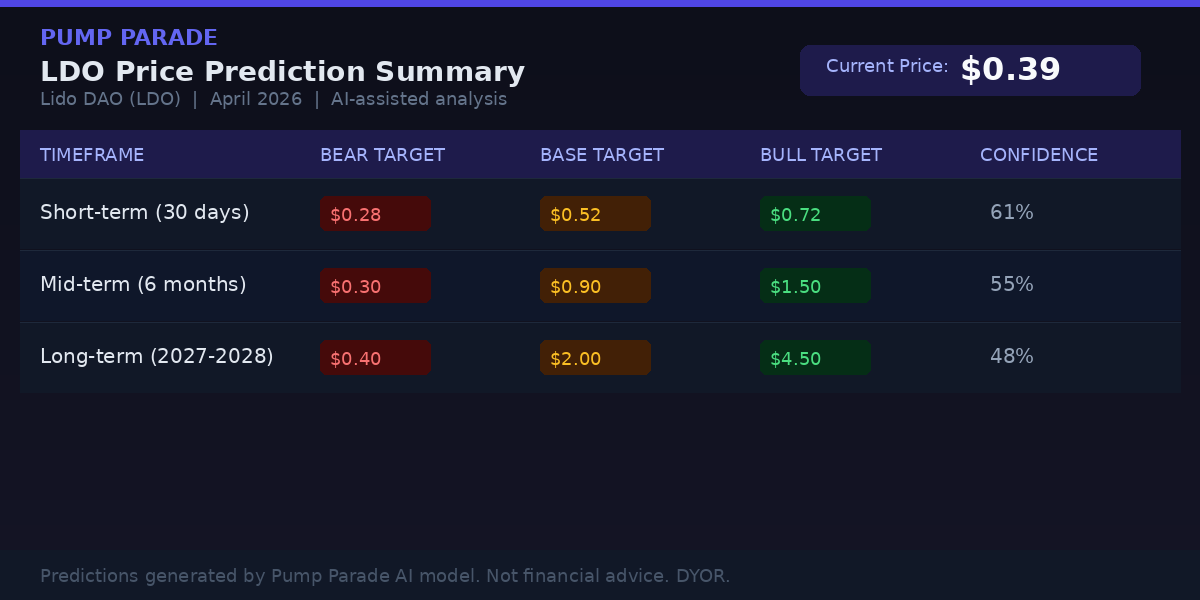
    Lido DAO LDO price prediction table 2026 showing bear base and bull targets for short mid and long term

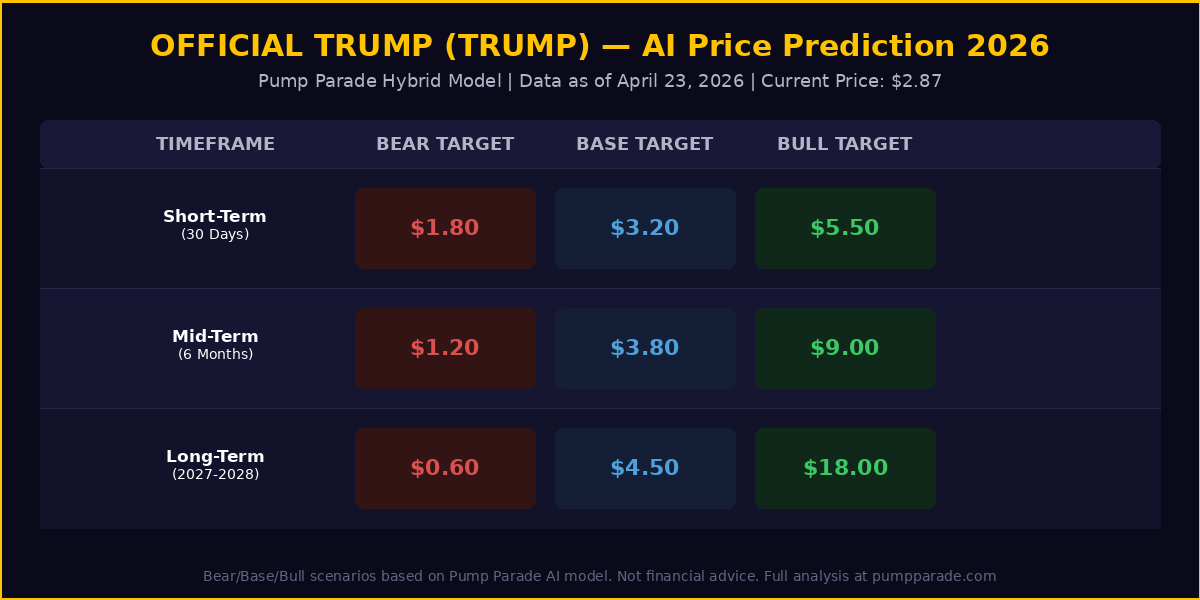
    Our hybrid AI model analyzes technical indicators, on-chain data, and market sentiment to generate probabilistic price ranges. These are not guarantees. They are structured scenarios with assigned conditions.

    Short-Term (30 Days): May 2026

    Bear target: $0.28. A failed retest of the breakout level at $0.36, followed by a macro risk-off event or Ethereum weakness, could push LDO back toward the ATL range.

    Base target: $0.52. The most probable scenario. LDO consolidates the breakout and grinds toward the 50-day moving average at $0.52. This requires ETH to hold its current range and no major negative news for Lido specifically.

    Bull target: $0.72. If the breakout accelerates and volume sustains, LDO could test the Q4 2025 resistance zone quickly. This would require broad DeFi risk-on sentiment and a continued ETH rally.

    Model confidence: 61%

    Mid-Term (6 Months): Q4 2026

    Bear target: $0.30. A prolonged DeFi bear market, regulatory action against liquid staking, or significant stVaults adoption failure could keep LDO suppressed.

    Base target: $0.90. If stVault adoption hits 500,000 ETH by year-end and the broader crypto market holds its current levels, LDO could re-rate meaningfully. $0.90 would still be just 12% of the all-time high.

    Bull target: $1.50. This requires a strong ETH bull market, successful institutional product launches via stVaults, and a governance vote to implement some form of fee sharing. Each of these is possible but not guaranteed.

    Model confidence: 55%

    Long-Term (2027-2028)

    Bear target: $0.40. Continued competitive pressure and no fee accrual mechanism keep LDO as a low-utility governance token.

    Base target: $2.00. Assumes Lido becomes the dominant staking infrastructure layer, fee-sharing is implemented, and the overall crypto market reaches new cycle highs.

    Bull target: $4.50. A full bull cycle with ETH at new highs and Lido positioned as the institutional staking standard. Still well below the 2021 peak of $7.30.

    Model confidence: 48%

    What to Watch

    Three things will define LDO’s trajectory in the months ahead.

    First, watch the $0.36 support level. A daily close below this on meaningful volume would suggest the breakout was a false start and the bear trend is intact.

    Second, watch stVault TVL growth. Lido publishes on-chain data for V3 deployments. Progress toward the 1 million ETH goal is a direct leading indicator for protocol growth and future fee potential.

    Third, watch governance proposals around fee sharing. Any credible proposal to distribute protocol fees to LDO holders would be a significant re-rating catalyst. The community has discussed this for years. V3’s new revenue streams may finally make it feasible.

    The Bottom Line

    LDO is emerging from its worst drawdown in three years. The technical breakout is confirmed. The fundamental story with V3 stVaults is the most interesting it has been since the protocol launched. The mcap-to-TVL ratio suggests significant undervaluation relative to peers.

    At the same time, LDO is down 94.7% from its all-time high, competition is real, and the governance token structure limits direct fee capture. This is not a simple story.

    The data currently favors a continued recovery toward $0.50 to $0.90 over the next six months, with upside to $1.50 if catalysts align. The bear case requires a broader DeFi selloff or a specific negative event for Lido. Neither can be ruled out.

    Watch the levels, track the stVault adoption numbers, and size accordingly.


    Disclaimer: This article is for informational and educational purposes only and should not be construed as financial, investment, or trading advice. Cryptocurrency markets are highly volatile, and past performance does not guarantee future results. The price predictions and analyses presented here are based on AI models, technical indicators, and available data at the time of writing. They are not guarantees. Always conduct your own research (DYOR) and consult with a qualified financial advisor before making any investment decisions. Pump Parade and its authors do not assume liability for financial losses incurred based on information provided in this article.

    About our AI predictions: Pump Parade’s price predictions are generated by machine learning models that analyze technical indicators, on-chain data, and market sentiment. These models have limitations and cannot account for black swan events, regulatory changes, or sudden market shifts. Prediction confidence scores reflect the model’s internal assessment, not guaranteed accuracy. Use AI predictions as one input among many in your research.
    Cardano (ADA) Price Prediction 2026: Can ADA Hit $1?

    0

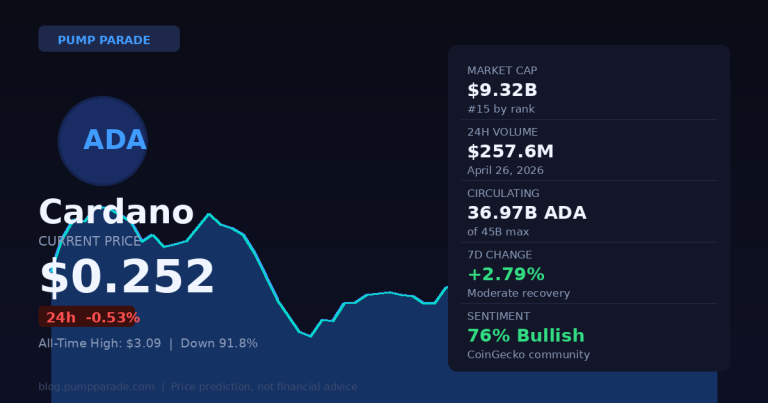
    Cardano (ADA) is trading at $0.252 as of April 26, 2026, down 91.8% from its all-time high of $3.09 set in September 2021. That is a brutal drawdown. But buried inside those numbers is a story that is starting to get interesting again.

    Two catalysts are converging right now. First, Cardano’s governance treasury just approved $71 million for the Leios scaling upgrade, targeting a 10-to-65-times increase in throughput by late 2026. Second, four separate spot ETF applications from Grayscale, VanEck, 21Shares, and Canary Capital are pending with the SEC. The earliest possible approval window opens August 9, 2026.

    Does that mean ADA is headed back to $1? Our hybrid AI model weighs the probability. Here is the full breakdown.

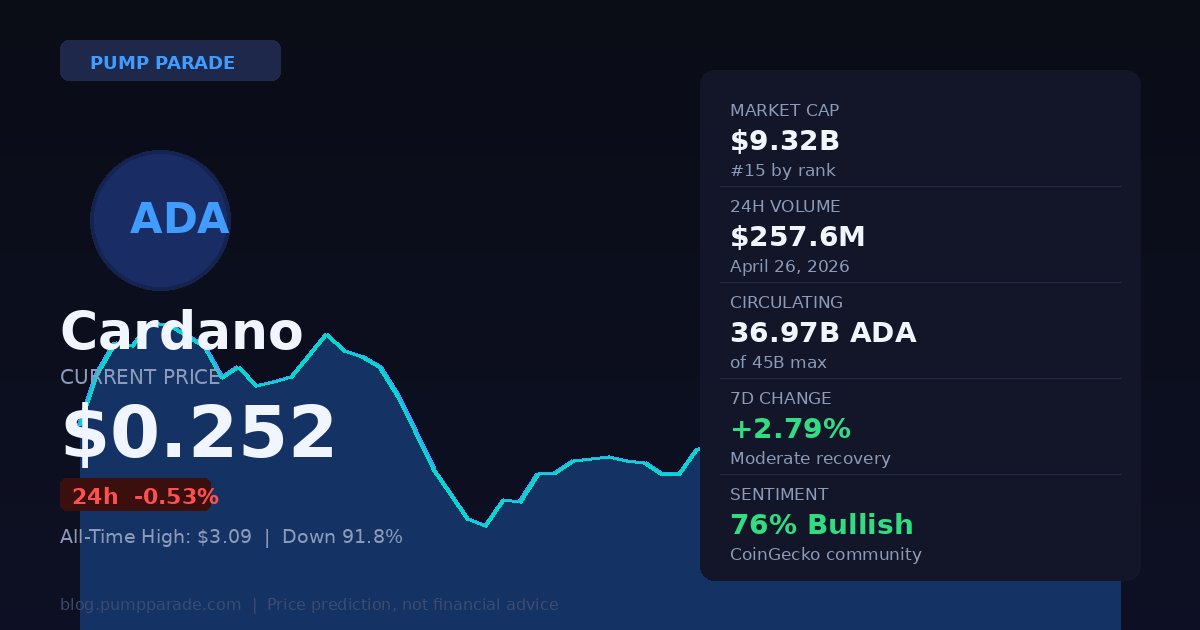
    Cardano ADA price prediction 2026 hero chart showing current price $0.252 and key metrics

    What Is Cardano?

    Cardano is a proof-of-stake blockchain platform founded in 2017 by Charles Hoskinson, one of Ethereum’s original co-founders. What sets it apart is its unusually rigorous development process. Every major feature goes through peer review by academic researchers before being deployed. The idea: build slower, but more securely.

    The network supports smart contracts and decentralized applications through its native programming language, Plutus. ADA, the platform’s token, is used for transaction fees, staking rewards, and on-chain governance votes. Cardano operates through three organizations: Input Output Global (IOG) handles technical development, the Cardano Foundation oversees adoption, and Emurgo supports business integration.

    Key metrics at time of writing:

    • Price: $0.252 (April 26, 2026)
    • Market cap: $9.32 billion, ranked #15 globally
    • 24h trading volume: $257.6 million
    • Circulating supply: 36.97 billion ADA of a 45 billion max
    • All-time high: $3.09 (September 2, 2021)
    • All-time low: $0.019 (March 2020)
    • Community sentiment: 76% bullish per CoinGecko

    What Is Driving ADA Right Now?

    The Leios Scaling Upgrade

    The biggest near-term catalyst for Cardano is the Leios upgrade. This is a new consensus mechanism designed to dramatically increase the network’s transaction capacity. The goal is 1,000 or more transactions per second, a 10-to-65-times improvement over the current baseline.

    Cardano’s governance treasury approved $71 million for Hydra and Leios development this month. The testnet is scheduled for June 2026. Mainnet deployment is targeted for late 2026.

    In plain terms: if Cardano delivers Leios on schedule, the network goes from being a technical curiosity to a genuinely competitive smart contract platform. That is the bull case in two sentences.

    The ETF Pipeline

    CME ADA futures went live on February 9, 2026. That matters because the SEC has historically required six months of CME futures trading before considering a spot ETF approval. That clock runs out on August 9, 2026.

    Four asset managers have ETF applications pending: Grayscale, VanEck, 21Shares, and Canary Capital. If even one gets approved in Q3 or Q4 2026, it opens a direct institutional on-ramp to ADA for traditional investors who do not want to manage a crypto wallet.

    The regulatory environment has been more crypto-friendly in 2026 than in previous years. That does not guarantee approval, but it does improve the odds compared to prior cycles.

    Technical Analysis

    ADA’s price action in 2026 tells a story of slow, grinding recovery from a punishing bear market. Here is what the chart is showing at current levels.

    Support levels: The key support zone sits between $0.235 and $0.248. ADA has tested this range three times in the past 30 days and held each time. A clean break below $0.235 would open the path toward $0.19.

    Resistance levels: The first meaningful resistance is at $0.28 to $0.30. Above that, the $0.35 to $0.38 range acted as support in late 2025 before the December selloff. Reclaiming $0.38 would be a significant technical milestone.

    Momentum: The RSI (Relative Strength Index) is sitting near 48, which is neutral with a slight bias toward the oversold side. The MACD (a momentum indicator that tracks trend direction and strength) is showing a modest bullish crossover on the daily chart, but without strong volume confirmation. The 50-day moving average remains above the 200-day moving average, suggesting the medium-term structure is still constructive.

    Volume: The 24h volume of $257.6 million is solid for ADA at this price level. During the 2021 bull market, ADA regularly traded $1 billion or more per day. A sustained return toward those volume levels would be a strong signal that institutional interest is returning.

    Our AI model gives the current technical setup a 55% probability of a bullish resolution over the next 90 days, versus 45% for a further leg down first. That is not strong conviction in either direction. It is a coin flip with a slight tilt upward.

    The Bull Case for ADA in 2026

    Here is what needs to go right for Cardano to have a strong 2026.

    Leios delivers on schedule. A successful June testnet and late-2026 mainnet deployment would be a significant de-risking event. Crypto markets tend to front-run major technical milestones. If Leios looks on track by August, ADA could see a sharp re-rating before the upgrade actually lands.

    A spot ETF gets approved. The August 2026 window is real. ETF approval would bring institutional money that has never touched ADA. Based on what happened with Bitcoin and Ethereum after their spot ETF approvals, a new institutional demand pool is a meaningful upside catalyst. Even anticipation of approval tends to move prices ahead of the actual event.

    Broader crypto market recovery. Bitcoin is trading at roughly $78,000 at the time of writing. If BTC makes another leg toward its $126,000 all-time high, altcoin liquidity typically follows. Historically, ADA has rallied 3-to-5 times harder than Bitcoin during altcoin seasons. A BTC move above $100,000 would likely lift ADA significantly.

    The bull case price target from our model: $0.65 by end of 2026, and $1.50 by end of 2027, if all three catalysts materialize.

    The Bear Case for ADA in 2026

    Now for the other side, and it deserves serious attention.

    Development has moved slowly for years. Cardano’s methodical, academic approach is a double-edged sword. The same care that makes it defensible also means it has taken longer than competitors to ship features. Solana launched DeFi, NFTs, and memecoin infrastructure years ahead of Cardano. Ethereum leads in total value locked by a massive margin. Cardano has been “almost ready” for a long time.

    Competition is fierce. Every Layer 1 blockchain is fighting for the same developers and users. Solana has momentum and developer mindshare. Ethereum has network effects and institutional credibility. Cardano’s DeFi ecosystem is a fraction of either. Even with Leios, Cardano is catching up to a moving target.

    The ETF is not guaranteed. The SEC has surprised markets before. Even with a more favorable regulatory environment, four applications do not mean four approvals. A delay into 2027 would remove one of the most important near-term catalysts from the timeline.

    Macro risk remains. ADA is 91.8% off its ATH, but that does not mean it cannot fall further. In a severe macro downturn, levels below $0.20 are possible. Down 91% is not a floor.

    The bear case target from our model: $0.15 to $0.19 by mid-2026, with a partial recovery to the $0.20 to $0.28 range by year end.

    Cardano (ADA) Price Prediction Summary

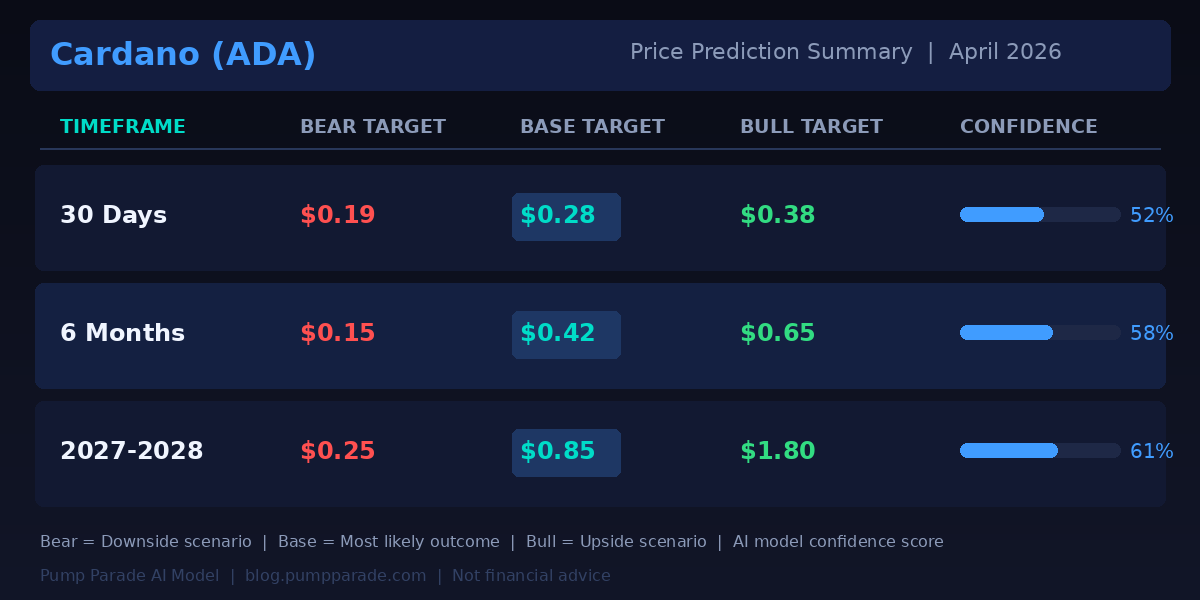
    Based on our hybrid AI model incorporating technical indicators, on-chain data, market sentiment, and fundamental catalysts, here are our price prediction ranges for ADA across three timeframes:

    Cardano ADA price prediction table 2026 showing bear base and bull targets for 30 days 6 months and 2027-2028

    Short-Term (30 Days)

    Bear: $0.19 | Base: $0.28 | Bull: $0.38 | Confidence: 52%

    The next 30 days hinge on whether ADA holds above the $0.235 support zone and whether Bitcoin maintains its current range. A breakout above $0.28 with volume would open the door to a near-term test of $0.35 to $0.38.

    Mid-Term (6 Months)

    Bear: $0.15 | Base: $0.42 | Bull: $0.65 | Confidence: 58%

    The 6-month window is where the ETF and Leios catalysts begin to matter. If the Leios testnet goes live in June and the SEC makes progress on ETF applications by August, expect the base case to shift toward the upper end of the range.

    Long-Term (2027-2028)

    Bear: $0.25 | Base: $0.85 | Bull: $1.80 | Confidence: 61%

    The long-term bull case depends on Cardano building a meaningful DeFi and application ecosystem on top of Leios. If the network demonstrates real usage and TVL growth after the upgrade, $1 is a realistic target by 2027. Getting back to ATH levels requires both a bull market and a fundamental re-rating of Cardano’s competitive position.

    Key Levels and Catalysts to Watch

    • $0.235 support: The line in the sand. A daily close below this opens the path to $0.19.
    • $0.30 resistance: First meaningful hurdle. A clean breakout here with volume is a bullish signal.
    • June 2026: Leios testnet launch. Watch for IOG progress updates and community response.
    • August 9, 2026: Earliest window for a spot ETF approval. SEC decision timelines matter here.
    • BTC above $90,000: Historically a trigger for altcoin outperformance. Watch BTC dominance.

    For a similar recovery setup analysis in the broader crypto market, see our AXS price prediction for 2026, which covers comparable dynamics for a beaten-down token with fundamental catalysts ahead.

    For real-time ADA price data, market cap, and volume, visit Cardano on CoinGecko.

    Our Take

    ADA is a coin in a genuinely interesting position. The fundamentals are improving. The technical picture is neutral. The catalysts are real. But the timeline is long, the competition is fierce, and Cardano has a history of taking longer than expected to deliver.

    If you believe in the Leios upgrade and think at least one spot ETF gets approved in 2026, ADA at $0.25 offers a reasonable long-term risk-reward at current levels. That is not the same as saying it goes up next month.

    Cardano tends to move later and slower than its competitors, then catch up quickly when sentiment shifts. Patience has always been the core thesis here. Whether that patience gets rewarded in 2026 depends on execution, not just vision.


    Disclaimer: This article is for informational and educational purposes only and should not be construed as financial, investment, or trading advice. Cryptocurrency markets are highly volatile, and past performance does not guarantee future results. The price predictions and analyses presented here are based on AI models, technical indicators, and available data at the time of writing. They are not guarantees. Always conduct your own research (DYOR) and consult with a qualified financial advisor before making any investment decisions. Pump Parade and its authors do not assume liability for financial losses incurred based on information provided in this article.

    About our AI predictions: Pump Parade’s price predictions are generated by machine learning models that analyze technical indicators, on-chain data, and market sentiment. These models have limitations and cannot account for black swan events, regulatory changes, or sudden market shifts. Prediction confidence scores reflect the model’s internal assessment, not guaranteed accuracy. Use AI predictions as one input among many in your research.
    Axie Infinity (AXS) Price Prediction 2026: Can AXS Recover?

    0
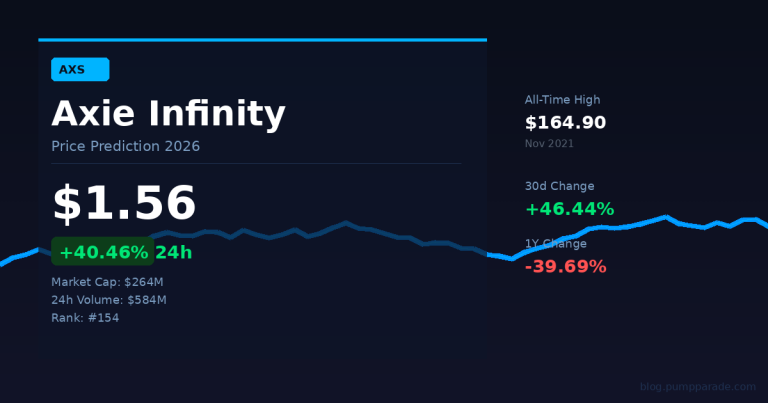
    Axie Infinity AXS price prediction 2026 hero image showing current price $1.56 and 40% 24h gain

    Axie Infinity (AXS) just posted one of the sharpest moves in crypto today. The token is up 40.46% in the last 24 hours, trading at $1.56 at time of writing. Trading volume has hit $584 million, more than twice the token’s entire market cap of $264 million. That kind of volume-to-cap ratio signals intense short-term interest. Whether it sustains depends on the fundamentals beneath the spike.

    AXS is the governance token for Axie Infinity, the play-to-earn game that dominated Web3 in 2021. The token hit an all-time high of $164.90 in November 2021. It now trades more than 99% below that level. The question for 2026 is whether GameFi, the intersection of gaming and decentralized finance, has enough momentum to bring AXS back. This article breaks down the data, the catalysts, and both sides of the trade.

    What Is Axie Infinity (AXS)?

    Axie Infinity is a blockchain-based game built on the Ronin Network, a sidechain designed specifically for gaming. Players collect, breed, and battle creatures called Axies. Each Axie is an NFT (non-fungible token), a unique digital asset stored on the blockchain.

    AXS is the governance token. Holders can vote on game development decisions and stake their tokens to earn rewards. At the peak of the play-to-earn craze in 2021, Axie generated more than $1.3 billion in monthly revenue. Players in Southeast Asia earned meaningful income from the game.

    That era ended. The Ronin bridge was hacked in March 2022, resulting in a loss of approximately $625 million in assets. It remains one of the largest DeFi exploits in history. AXS crashed from its highs. The team rebuilt the bridge with stronger security and launched Axie Infinity: Origins, a free-to-play card game variant designed to broaden the player base.

    As of April 2026, the project is still operating. The circulating supply stands at approximately 170 million AXS out of a maximum of 270 million. Market cap sits at $264 million, which ranks AXS at #154 globally according to CoinGecko.

    What Is Driving Today’s Price Spike?

    A 40% single-day move on $584 million in volume is not normal for a $264 million market cap token. The volume-to-market-cap ratio exceeds 2x, which points to aggressive speculative buying rather than organic accumulation.

    Several factors appear to be contributing. First, GameFi as a sector has been showing renewed interest in Q2 2026. Tokens tied to blockchain gaming have lagged broader crypto gains for several cycles. As Bitcoin stabilizes near $77,000, capital tends to rotate into higher-beta altcoins, including gaming tokens.

    Second, AXS has been building a base near multi-year lows. The 30-day change of +46.44% suggests this move started building before today’s spike. That pattern is consistent with accumulation followed by a momentum breakout.

    Third, the 1-hour chart at time of writing shows AXS pulling back approximately 9.6% from its intraday peak. That kind of intraday volatility is expected after a 40% surge. It does not negate the move, but it does signal that short-term traders are taking profits.

    Technical Analysis

    Let’s look at the chart structure.

    AXS spent most of early 2026 consolidating between $0.90 and $1.20. That range acted as a base. The current breakout above $1.50 represents a significant level test. If AXS holds above $1.50 on a daily close, that becomes a new support zone.

    The RSI (Relative Strength Index, a momentum indicator ranging from 0 to 100) has moved into overbought territory above 70 on the daily chart. That is not automatically bearish. In early-stage breakouts, RSI can stay elevated for days or weeks. But it does mean the risk of a short-term pullback is elevated.

    Volume is the most important data point right now. The $584 million daily volume on a $264 million market cap token is extraordinary. Volume preceding price moves tends to be more reliable than volume following them. Watch whether volume sustains above $150 million per day over the next week as a sign of continued interest.

    The next resistance levels sit at $2.00 (a round number and psychological level), then $2.50 (the 2025 local high), and $4.00 (a longer-term target if GameFi momentum builds). To the downside, $1.20 is the first major support, followed by $0.90 and then $0.65.

    Comparing AXS to other GameFi tokens that have recovered from major drawdowns, such as Bittensor (TAO), which navigated its own recovery path through 2026, the pattern shows that post-hack and post-bear-market recoveries can take two to three years to build momentum. AXS is now four years past the Ronin hack.

    The Bull Case

    The bull case for AXS in 2026 rests on three pillars.

    The first is GameFi sector recovery. Blockchain gaming attracted over $2.5 billion in venture funding between 2021 and 2023. Those games are now launching or maturing. A rising tide in the sector lifts established tokens with brand recognition. Axie Infinity remains the most widely recognized name in the space.

    The second is the valuation. At $264 million market cap, AXS is pricing in near-total failure. The project is still active, still has a player base, and still generates staking rewards. A recovery to even 2% of its all-time high market cap would put AXS above $5. A recovery to 5% would put it above $12.

    The third is the supply dynamic. With 170 million of a maximum 270 million AXS in circulation, the inflation rate is slowing. Stakers are locking up tokens, reducing the available float. If buying pressure returns while supply growth slows, the price mechanics favor upward movement.

    In a bull scenario, AXS could reach $4.00 by the end of 2026 and $8.00 or higher by 2027-2028 if GameFi becomes a major narrative in the next cycle.

    The Bear Case

    The risks here are real and should not be glossed over.

    The first risk is structural: the play-to-earn model is broken. The original economic design of Axie Infinity required new players to fund existing players’ earnings. That is a Ponzi structure. The team has tried to redesign the game economy, but trust in the model has not fully recovered.

    The second risk is competition. The blockchain gaming space in 2026 is more crowded than it was in 2021. Games with better graphics, stronger teams, and more sustainable tokenomics are competing for the same player base. AXS cannot rely on first-mover advantage indefinitely.

    The third risk is the overhang from the hack. The Ronin bridge exploit left a lasting mark on the project’s reputation. Some institutional investors and funds will not touch tokens with that history regardless of subsequent improvements.

    In a bear scenario, today’s spike fades without follow-through. AXS retests the $0.90 support level. If that breaks, the next major support is near $0.50. A broader crypto market downturn could accelerate that decline.

    AXS Price Predictions for 2026 and Beyond

    Our hybrid AI model analyzes technical indicators, on-chain data, volume patterns, and market sentiment to generate price scenarios. These are probabilities, not guarantees.

    Axie Infinity AXS price prediction table showing bear, base, and bull targets for short-term, mid-term, and long-term timeframes

    For the short term (next 30 days), the base case is $1.80, assuming today’s momentum holds and volume remains elevated. The bull case targets $2.50 on continued GameFi rotation. The bear case is $0.90 on a failed breakout and profit-taking selloff. Our model assigns a 52% probability to the base-to-bull range.

    For the mid-term (6 months), the base case is $2.20. That assumes no major negative catalyst and continued sector recovery. The bull case targets $4.00, which would require a broader GameFi narrative to emerge. The bear case is $0.70, which prices in project stagnation. Confidence here is 48% for the base-to-bull range.

    For the long term (2027-2028), the base case is $3.50. The bull case is $8.00, which would require AXS to recover roughly 5% of its all-time high market cap. The bear case is $0.50. The model assigns 42% probability to the base-to-bull range over this timeframe. Lower because two-year forecasts carry significantly more uncertainty.

    What to Watch

    If you are tracking AXS, here are the key signals to monitor.

    Watch the daily volume over the next five trading sessions. If volume sustains above $200 million per day, that is a positive sign. If it drops back below $50 million within three days, the spike was likely short-term speculation.

    Watch the $1.50 level as support. A daily close below $1.50 after today’s move would be a warning sign for the short-term bull case.

    Watch for any official announcements from the Axie Infinity team. New game modes, partnership announcements, or staking updates can serve as catalysts. The team has been active on development, and a major reveal could extend this move.

    Watch the broader GameFi sector. Tokens like SAND, MANA, and ILV trade in loose correlation with AXS. If the sector is moving as a group, the move is more likely to sustain. If AXS is moving in isolation, it may be purely speculative.

    Final Take

    AXS is a legitimate story at the right price. At $164, it was overvalued. At $1.56, the math starts to make more sense, but only if the project can demonstrate renewed relevance. Today’s 40% spike is interesting. Whether it is the start of a real recovery or another failed breakout is the central question for 2026.

    The data suggests momentum is real. The risks are also real. Position sizing and a clear stop-loss level matter more here than almost any other token in this market cap range.


    Disclaimer: This article is for informational and educational purposes only and should not be construed as financial, investment, or trading advice. Cryptocurrency markets are highly volatile, and past performance does not guarantee future results. The price predictions and analyses presented here are based on AI models, technical indicators, and available data at the time of writing. They are not guarantees. Always conduct your own research (DYOR) and consult with a qualified financial advisor before making any investment decisions. Pump Parade and its authors do not assume liability for financial losses incurred based on information provided in this article.

    About our AI predictions: Pump Parade’s price predictions are generated by machine learning models that analyze technical indicators, on-chain data, and market sentiment. These models have limitations and cannot account for black swan events, regulatory changes, or sudden market shifts. Prediction confidence scores reflect the model’s internal assessment, not guaranteed accuracy. Use AI predictions as one input among many in your research.
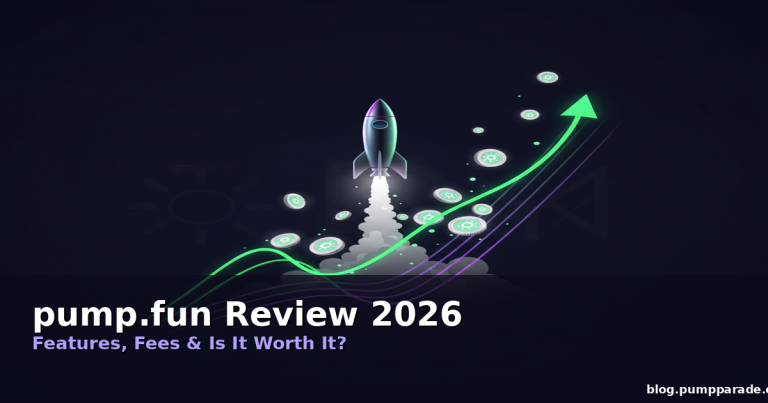
    pump.fun Review 2026: Fees, Features & Verdict

    0

    If you’ve spent any time in the Solana ecosystem over the past two years, you’ve almost certainly heard of pump.fun. The platform has become synonymous with memecoin culture on Solana, letting anyone create and trade tokens in seconds. But with over 11.9 million tokens launched and a controversial reputation, is pump.fun actually worth your time and money in 2026?

    In this review, we break down everything you need to know: how it works, what it costs, the risks involved, and whether it deserves a spot in your crypto toolkit.

    Quick Verdict / TL;DR

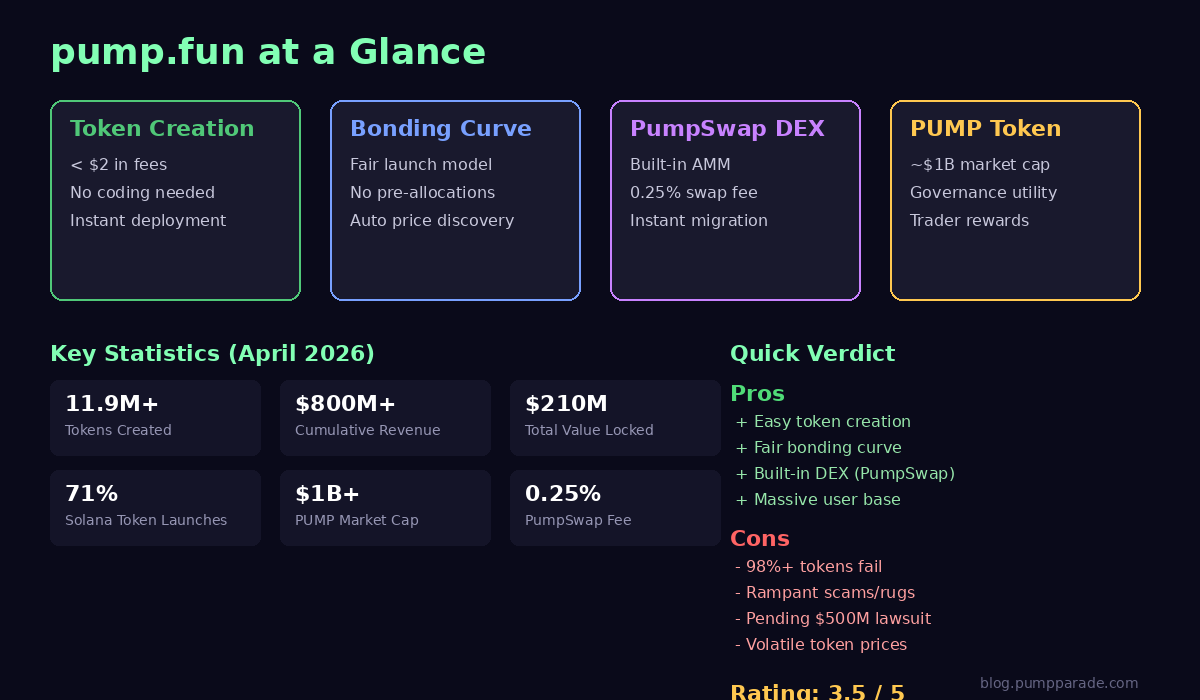
    Rating: 3.5 / 5

    pump.fun is the undisputed king of Solana token launchpads. Creating a token takes seconds and costs under $2, and the bonding curve model ensures fair launches without pre-allocations. The addition of PumpSwap as a native DEX makes the ecosystem self-contained and eliminates migration friction. However, the platform’s biggest weakness is also baked into its design: the vast majority of tokens launched here end up worthless, and scam activity remains rampant. If you know what you’re doing, pump.fun is a powerful tool. If you don’t, it can be an expensive lesson.

    pump.fun logo, the leading Solana memecoin launchpad

    What Is pump.fun?

    Launched in January 2024, pump.fun is a Solana-based platform that lets anyone create a new token in seconds by simply uploading an image, choosing a ticker, and picking a name. There’s no coding required, no complicated smart contract deployment, and no need for initial liquidity. The platform handles everything through an automated bonding curve that sets the token’s price based on supply and demand.

    Since launch, the platform has facilitated the creation of over 11.9 million tokens. At its peak, pump.fun accounted for roughly 71% of all daily token launches on Solana, making it the single largest source of new tokens in the ecosystem. The platform has generated more than $800 million in cumulative revenue, and its parent company raised approximately $1.3 billion through its PUMP token ICO in July 2025.

    pump.fun isn’t just a launchpad anymore. With the launch of PumpSwap in March 2025, it became a full trading ecosystem where tokens are created, traded, and graduated all under one roof.

    Features Deep Dive

    pump.fun features and key statistics infographic for 2026

    Token Creation

    Creating a token on pump.fun is remarkably straightforward. You upload an image (which becomes the token’s avatar), enter a name and ticker symbol, and hit create. The entire process takes under 30 seconds and costs less than $2 in SOL fees. There are no pre-mines, no team allocations, and no insider advantages built into the launch mechanism. Every participant, including the token creator, has to buy in at the same price on the bonding curve.

    This simplicity is both the platform’s greatest strength and its Achilles’ heel. The low barrier to entry means anyone can launch a token, but it also means the platform is flooded with low-effort projects and outright scams.

    Bonding Curve Mechanics

    Every token launched on pump.fun starts on a bonding curve, which is an automated pricing mechanism where the token’s price increases as more people buy in. Early buyers get lower prices, and the price rises along a predetermined curve as demand increases. This creates a built-in incentive for early participation while ensuring transparent, predictable pricing.

    When a token reaches a market cap of approximately $69,000 (previously $90,000, adjusted over time), it “graduates” from the bonding curve and migrates to PumpSwap for standard AMM trading. This graduation milestone is a key moment for any pump.fun token, as it signals enough organic demand to sustain trading on an open market.

    PumpSwap: The Native DEX

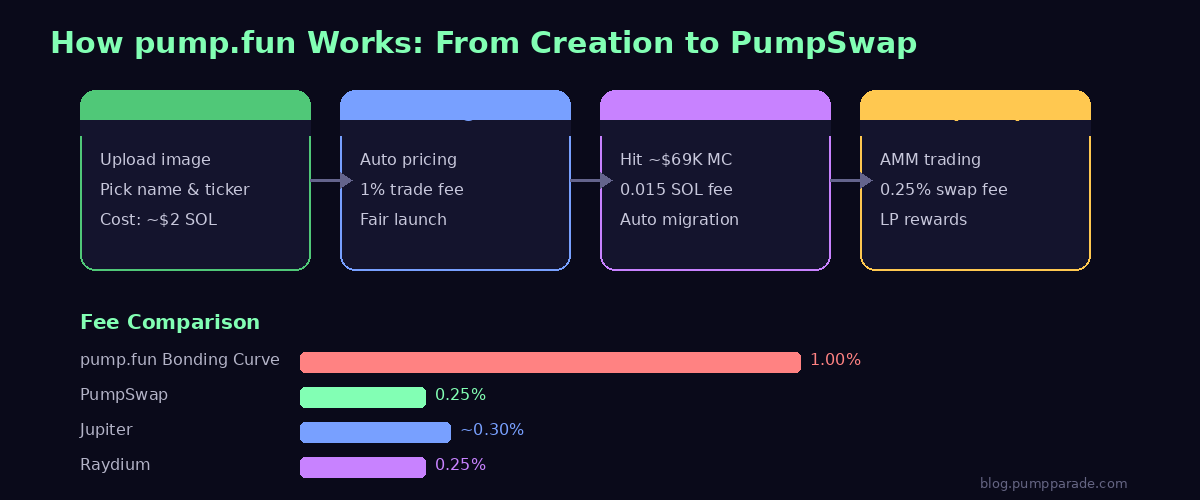
    How pump.fun works: token creation to PumpSwap flow diagram with fee comparison

    PumpSwap launched in March 2025 as pump.fun’s native decentralized exchange, replacing Raydium as the destination for graduated tokens. It operates on an automated market maker (AMM) model similar to Uniswap V2, using a constant-product formula (x * y = k) to facilitate swaps via liquidity pools.

    The migration from bonding curve to PumpSwap is instant and free for token creators. Each trade on PumpSwap incurs a 0.25% fee, split between liquidity providers (0.20%) and the protocol (0.05%). PumpSwap has quickly grown to become the second-largest AMM on Solana by volume, a testament to the sheer trading activity pump.fun generates.

    A notable feature is creator revenue sharing, which gives token creators a cut of trading fees on their tokens. This incentivizes creators to build lasting projects rather than quick pump-and-dump schemes, though the effectiveness of this incentive is debatable given the platform’s track record.

    Additional Features

    Beyond its core launchpad functionality, pump.fun offers several supplementary features. The platform includes a live feed of newly created tokens, a “Trending” section highlighting tokens with momentum, and filter tabs like “Movers,” “Mayhem,” “Live,” “New,” and “Market cap” to help users discover tokens. There’s also a built-in chat feature, voice chat rooms, and an “Agents” category for AI-related tokens. A mobile app is available for iOS and Android, and the platform actively encourages mobile usage for faster trading.

    Fees and Pricing

    pump.fun’s fee structure is straightforward but important to understand before you start trading:

    Action Fee Notes
    Token Creation ~$2 (in SOL) One-time fee to deploy a new token
    Buy/Sell on Bonding Curve 1% per transaction Charged in SOL on each trade
    Graduation Fee 0.015 SOL When token migrates to PumpSwap
    PumpSwap Trading 0.25% per swap Split: 0.20% to LPs, 0.05% to protocol

    The 1% bonding curve trading fee is higher than what you’d pay on most DEXs (Jupiter charges around 0.3%, and Raydium sits at 0.25%). However, once a token graduates to PumpSwap, the 0.25% fee is competitive with other Solana AMMs. Keep in mind that Solana network transaction fees are also minimal (usually fractions of a cent), so they won’t add much to your total cost.

    Pros and Cons

    Pros

    • Incredibly easy token creation – Launch a token in under 30 seconds with no coding knowledge. The lowest barrier to entry of any launchpad on the market.
    • Fair launch model – The bonding curve eliminates pre-mines and insider allocations. Everyone buys in at the same starting point, creating a level playing field.
    • Self-contained ecosystem – With PumpSwap, tokens never need to leave the pump.fun universe. Creation, trading, and graduation all happen under one roof.
    • Massive liquidity and user base – As the dominant Solana launchpad, pump.fun has more active traders and more volume than any competitor, which means better price discovery and tighter spreads on popular tokens.
    • Mobile app available – Trade on the go with a dedicated mobile experience, which is increasingly important for memecoin trading where speed matters.
    • Creator revenue sharing – Token creators earn a percentage of PumpSwap trading fees, incentivizing longer-term project development.

    Cons

    • Overwhelming majority of tokens fail – Research from Solidus Labs found that approximately 98.6% of tokens launched on pump.fun end up as scams or worthless. Only about 97,000 of 7+ million analyzed tokens maintained at least $1,000 in liquidity.
    • Rampant scam activity – Fake volume bots, bundled transactions, wallet manipulation, and coordinated pump-and-dump schemes are widespread. The low barrier to entry that makes the platform accessible also makes it a playground for bad actors.
    • Legal uncertainty – A $500 million lawsuit accuses pump.fun’s co-founders of operating an insider-driven system that favored privileged participants, with allegations of early access advantages and artificial price inflation.
    • Thin liquidity on most tokens – Outside of the top trending tokens, most pump.fun tokens have extremely shallow liquidity pools. This means high slippage and significant price impact even on modest trades.
    • Higher bonding curve fees – The 1% fee on bonding curve trades is notably higher than standard DEX swap fees, eating into profits on frequent trades.

    Security and Trust

    Security is arguably pump.fun’s weakest area, and it’s the primary reason the platform doesn’t score higher in this review.

    The platform’s open design means that anyone can create a token with zero vetting. While this is philosophically aligned with crypto’s permissionless ethos, it creates a breeding ground for fraud. A report from Solidus Labs found that roughly 98.6% of tokens launched on the platform turned into scams, with creators either draining funds or dumping tokens on buyers.

    Common scam tactics on pump.fun include fake volume generation (where bots simulate demand), bundled transactions that obscure large sell-offs, impersonation tokens that copy popular projects, and coordinated social media hype campaigns designed to attract unsuspecting buyers before a rug pull.

    On the legal front, pump.fun faces a $500 million lawsuit alleging that insiders had early access to newly launched tokens at minimal prices, artificially inflated values through bonding curves, and exited at the expense of retail users. The outcome of this case could have significant implications for the platform’s future operations.

    On the positive side, the bonding curve itself provides some structural protections. Since there are no pre-allocations and everyone (including creators) must buy in, it’s harder to execute traditional rug pulls where developers hold a large pre-mine. The transparency of on-chain data also means that savvy users can analyze wallet distributions and trading patterns before buying in.

    User Experience

    pump.fun’s interface is clean and intuitive. The dark-themed UI is easy on the eyes, and the main dashboard surfaces trending and newly created tokens prominently. Navigation is straightforward with a sidebar offering Home, Live, Support, Chat, Terminal, and More sections.

    Token creation is a standout UX achievement. The process is so simple that it could be completed by someone with zero crypto experience: upload an image, type a name, pick a ticker, and click create. The real-time bonding curve charts provide clear visual feedback on price action, and buying/selling tokens requires just a wallet connection and a few clicks.

    The search functionality works well for finding specific tokens, and the filter tabs (Movers, Mayhem, Live, New, Market cap, Agents, Oldest, Last trade) offer useful ways to slice and dice the token feed. The mobile app mirrors the web experience faithfully, which is important since memecoin trading often requires quick reactions.

    One UX weakness is the sheer volume of tokens. With thousands of new tokens launching daily, even the filters can feel overwhelming. There’s no robust way to separate legitimate projects from scams within the interface itself, and users are largely left to do their own research.

    PUMP Token

    pump.fun launched its native PUMP token through an ICO in July 2025 that raised roughly $1.3 billion ($600 million in a public sale that sold out in 12 minutes, plus $720 million in private sales). As of April 2026, PUMP trades at approximately $0.0019 with a market cap around $1 billion, ranking in the top 70 cryptocurrencies globally.

    The token has a total supply of approximately 1 trillion PUMP, with about 430 billion currently in circulation. Key upcoming catalysts include a PUMP token incentive program that would reward traders for platform activity, potential expansion to EVM-compatible chains, and a $3 million Pump Fund hackathon in 2026.

    Investing in the PUMP token is essentially a bet on the continued dominance of pump.fun as the leading memecoin launchpad. However, competition from platforms like LetsBonk.fun (which briefly captured over 55% market share in mid-2025) and Raydium’s own launchpad features means that dominance is not guaranteed.

    Competitors

    pump.fun operates in an increasingly competitive space. LetsBonk.fun emerged as a significant challenger in 2025, at one point capturing over 55% of the Solana memecoin launchpad market compared to pump.fun’s 27%. Believe (formerly LaunchCoin) has also gained traction as a more curated alternative. On EVM chains, platforms like trading bots such as Photon and BullX serve adjacent but different needs.

    pump.fun’s moat lies in its first-mover advantage, massive user base, and the PumpSwap ecosystem that keeps trading activity in-house. However, the platform’s struggles with scam prevention and legal challenges could create openings for competitors that emphasize safety and curation.

    Verdict

    Rating: 3.5 / 5

    pump.fun is a product that does exactly what it set out to do: make token creation and trading as frictionless as possible. On that front, it’s a resounding success. The platform’s UX is excellent, the bonding curve model is elegant, and PumpSwap rounds out the ecosystem nicely.

    But frictionless access cuts both ways. The platform’s openness has made it a haven for scams, with less than 2% of tokens maintaining meaningful value. The pending $500 million lawsuit adds regulatory uncertainty, and competition is heating up from both Solana-native and cross-chain alternatives.

    Who should use pump.fun: Experienced crypto traders who understand memecoin risks, can read on-chain data, and have a clear strategy for managing exposure. Developers looking for the fastest, cheapest way to launch a token on Solana.

    Who should avoid pump.fun: Beginners who might confuse easy access with easy money. Anyone who can’t afford to lose their entire investment on a single trade. Investors looking for fundamentally sound projects with long-term value.

    If you go in with eyes open and risk management in place, pump.fun is a powerful and unique platform. Just don’t mistake its simplicity for safety.

    FAQ

    Is pump.fun safe to use?

    The platform itself functions as intended, but the tokens traded on it carry extreme risk. An estimated 98.6% of tokens launched on pump.fun end up worthless or are outright scams. Always do your own research (DYOR), check wallet distributions, and never invest more than you can afford to lose.

    How much does it cost to create a token on pump.fun?

    Creating a token costs less than $2 in SOL fees. Trading on the bonding curve incurs a 1% fee per transaction, and PumpSwap charges 0.25% per swap after graduation.

    What is PumpSwap?

    PumpSwap is pump.fun’s native decentralized exchange (DEX) that launched in March 2025. When a token’s bonding curve reaches approximately $69,000 in market cap, it automatically graduates to PumpSwap for standard AMM trading. PumpSwap has grown to become the second-largest AMM on Solana by volume.

    What is the PUMP token?

    PUMP is pump.fun’s native governance and utility token, launched via an ICO in July 2025 that raised $1.3 billion. It trades at approximately $0.0019 with a market cap around $1 billion as of April 2026. An upcoming incentive program may reward traders with PUMP tokens for platform activity.

    Can I use pump.fun on mobile?

    Yes. pump.fun offers a dedicated mobile app for iOS and Android. The platform actively encourages mobile usage, displaying a banner on the web version stating “Trade faster. Pump is better on mobile.”

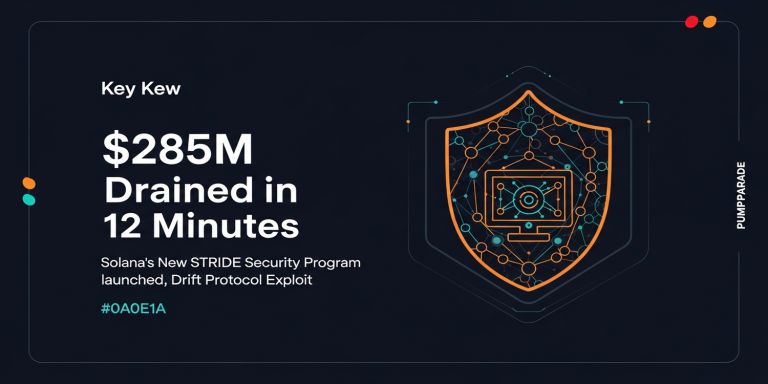
    Solana’s Answer to the $285M Drift Hack: Can STRIDE Actually Fix DeFi Security?

    0

    The Solana Foundation just replaced the traditional audit model with continuous, foundation-funded security monitoring. It’s the most ambitious DeFi security initiative of 2026 – but it has a blind spot.


    Six days after attackers drained $285 million from Drift Protocol in 12 minutes – the largest DeFi exploit of 2026 – the Solana Foundation unveiled something that goes far beyond the standard “we take security seriously” press release.

    STRIDE (Solana Trust, Resilience and Infrastructure for DeFi Enterprises) fundamentally rethinks how DeFi security works. Out: one-time audits that check the code once and move on. In: continuous, foundation-funded security evaluation with 24/7 threat monitoring and formal mathematical verification for the biggest protocols.

    The pitch is compelling. But there’s a harder question underneath it: would STRIDE have caught the Drift exploit – an attack that didn’t exploit the code at all?

    What Actually Happened at Drift

    Before evaluating the cure, we need to understand the disease.

    The Drift exploit wasn’t a smart contract bug. It was a six-month social engineering campaign, now attributed to DPRK-linked actors, that targeted the humans behind the protocol.

    The attackers spent months posing as a quantitative trading firm, building trust with Drift contributors. They exploited Solana’s “durable nonces” feature – a system that allows transactions to be signed now and executed later – to trick Security Council members into pre-signing dormant transactions. When triggered, those transactions silently transferred admin control to the attackers.

    Once they had admin access, they deployed CVT (CarbonVote Token), a fake asset created on March 12 with a total supply of 750 million tokens. They seeded a small Raydium liquidity pool, wash-traded CVT to anchor its price at ~$1, and deployed a price oracle they controlled to feed that artificial price to Drift’s vaults. Then they drained $285 million in 12 minutes.

    The result: Drift’s TVL collapsed from $550 million to sub-$250 million. The DRIFT token fell 45%. And the entire Solana DeFi ecosystem took a credibility hit – SOL DEX volumes are down 40% year-to-date.

    Enter STRIDE: How It Works

    STRIDE, built in partnership with Asymmetric Research, replaces the traditional “hire an auditor, get a report, publish a badge” model with a continuous security program funded by the Solana Foundation – not the protocols themselves.

    The framework evaluates protocols across eight security pillars, covering operational security, access controls, multisig configurations, and governance vulnerabilities. Here’s what changes based on protocol size:

    Protocol TVL What STRIDE Provides Funded By
    Any size Independent security assessment against 8 pillars; findings published publicly Solana Foundation
    $10M+ TVL 24/7 threat monitoring center; ongoing opsec evaluation; active threat flagging Solana Foundation grants
    $100M+ TVL All of the above + formal verification (mathematical proof that every code path functions as intended) Solana Foundation

    Three things make this structurally different from the status quo.

    It’s continuous, not one-time. Traditional audits are snapshots. The median time between a DeFi protocol passing an audit and getting exploited is 47 days. Code changes, integrations shift, market conditions create new economic attack vectors. STRIDE’s monitoring doesn’t stop after the report is filed.

    It’s foundation-funded, not protocol-paid. This removes the cost barrier that causes smaller protocols to skip or cheap out on audits. Protocols don’t pay for STRIDE – the Foundation does, calibrated by how much value each protocol secures.

    Findings are public. No more “we passed an audit” without showing what the auditors actually found. STRIDE assessments get published, creating accountability and letting users evaluate protocol risk directly.

    SIRN: The DeFi Emergency Response Network

    Alongside STRIDE, the Foundation launched SIRN – the Solana Incident Response Network. Think of it as a 911 system for DeFi.

    SIRN is a membership-based coalition of five elite security firms: Asymmetric Research, OtterSec, Neodyme, Squads, and ZeroShadow. They share threat intelligence and coordinate real-time responses to active attacks, providing the ecosystem with 24/7 crisis management.

    During the Drift exploit, it took hours for the community to fully understand what was happening. SIRN’s explicit promise is to compress that response window – detect, diagnose, and coordinate containment before an exploit bleeds out the full TVL.

    The Honest Assessment: Would STRIDE Have Prevented Drift?

    This is the question that separates a genuine evaluation from a press release rewrite. And the honest answer is: probably not entirely.

    What STRIDE could have caught:

    The eight-pillar assessment covers operational security and access controls – exactly the areas the Drift attackers exploited. A rigorous opsec review might have flagged the multisig configuration that allowed pre-signed durable nonce transactions to transfer admin control. The 24/7 monitoring center could have detected the anomalous oracle behavior when CVT’s manipulated price feed started draining vaults.

    What STRIDE almost certainly wouldn’t have caught:

    The core attack vector was social engineering – humans being deceived over six months. Formal verification checks every code path mathematically, but it can’t verify that the person signing a transaction isn’t being manipulated. No amount of continuous code monitoring catches a Security Council member who’s been socially engineered into pre-signing a malicious transaction.

    This is the fundamental limitation. DeFi security in 2026 isn’t primarily a code problem anymore. Q1 2026 saw $169 million lost across 34 hacks, and the most damaging attacks – Drift included – targeted the humans, not the smart contracts. As CoinDesk reported, the crypto community is being forced to rethink security entirely in the wake of DPRK’s intelligence-style operations.

    STRIDE is a meaningful upgrade to the code security layer. But the Drift exploit exposed a different layer entirely.

    How STRIDE Compares to Other Security Models

    STRIDE isn’t the only approach to chain-level security. Here’s how the major models compare:

    Model Chain Approach Funding Scope
    STRIDE Solana Continuous assessment + monitoring + formal verification Foundation-funded Code + opsec + governance
    Immunefi Bug Bounties Multi-chain (Ethereum-focused) Reactive bounties for discovered vulnerabilities Protocol-funded Code vulnerabilities only
    Ethereum Attackathon Ethereum Competitive audit events Ethereum Foundation Protocol-level code
    Cosmos Security Advisory Cosmos/IBC Advisory board + coordinated disclosures Community/Foundation Cross-chain bridge security

    Immunefi has paid out over $125 million in total bounties across all chains – proof that the reactive model works for finding code bugs. But bounties only pay out after someone finds a vulnerability. STRIDE’s continuous monitoring aims to find them before anyone exploits them.

    The question is whether foundation-funded security creates a different problem: moral hazard. If the Solana Foundation pays for your security, do protocols invest less in their own? STRIDE v0.1 doesn’t fully address this tension.

    The Recovery in Progress

    Meanwhile, Drift isn’t dead. On April 16, Tether announced a $147.5 million recovery package – up to $127.5 million from Tether itself, including a $100 million revenue-linked credit facility, plus ecosystem grants and market maker loans.

    The catch: recovery is linked to trading activity on the relaunched platform, not a one-time bailout. Drift is also switching its settlement asset from USDC to USDT as part of the deal, bringing its 128,000+ users onto Tether’s rails.

    DRIFT token jumped 20% on the announcement but still trades around $0.036 – down roughly 45% from pre-exploit levels. The recovery is real, but it’s going to be measured in months, not weeks.

    Bull Case for STRIDE

    This is the most comprehensive chain-level DeFi security program in crypto. No other L1 foundation funds continuous security evaluation, 24/7 monitoring, and formal verification across its entire protocol ecosystem. If it works, “Solana DeFi is foundation-secured” becomes a genuine competitive advantage.

    It removes the cost barrier. The protocols that get exploited aren’t always the ones that skipped audits – $2.3 billion was lost in 2025 from protocols that had audit reports. But foundation funding means even smaller protocols get real security coverage, not just a checkbox.

    The public findings create market pressure. When STRIDE assessments are published, users can make informed decisions about which protocols to trust. That transparency is worth more than any audit badge.

    Bear Case for STRIDE

    It’s reactive. STRIDE launched five days after a $285 million exploit, not before it. The Solana Foundation had the resources to build this earlier – Drift wasn’t the first major Solana DeFi hack. The $326 million Wormhole exploit happened in 2022.

    It wouldn’t have prevented the attack it was built to respond to. The Drift exploit was social engineering + oracle manipulation, not a code vulnerability. Formal verification and continuous code monitoring don’t catch humans being deceived. Until STRIDE addresses the operational and human security layer with the same rigor as the code layer, the biggest attack vectors remain open.

    Foundation dependency is a risk. What happens if Solana Foundation funding is reduced? Protocols that relied on STRIDE for security monitoring would need to fund it themselves or go without. Decentralization proponents will argue that chain-level security should be protocol-level responsibility, not foundation-subsidized.

    Solana DeFi is already losing ground. TVL has dropped from nearly $10 billion to around $6 billion. SOL DEX volumes are down 40% YTD. STRIDE addresses trust, but trust is only one factor – if users and capital keep migrating to Ethereum L2s, better security monitoring on a shrinking ecosystem has diminishing returns.

    What to Watch

    Three signals will tell us whether STRIDE is substance or PR:

    First STRIDE assessment results. Which protocols pass? Which fail? And do the findings reveal vulnerabilities that traditional audits missed? The credibility of the entire program depends on the first batch of public reports.

    First real-time SIRN activation. When the next exploit attempt happens – and it will – how fast does SIRN detect and respond? The Drift exploit took hours to fully diagnose. If SIRN compresses that to minutes, it’s a genuine breakthrough.

    TVL and volume recovery. Does Solana DeFi TVL stabilize or continue declining? If STRIDE rebuilds trust, capital should flow back. If it doesn’t, the market is telling us that security theater isn’t enough.

    STRIDE is the right idea built on an incomplete diagnosis. DeFi’s security problem in 2026 isn’t primarily about code – it’s about the humans who control the code. The Solana Foundation addressed the layer it could. The harder layer – the one where state-sponsored actors spend six months building trust before striking – remains open.

    That’s not a reason to dismiss STRIDE. It’s a reason to watch whether v0.2 closes the gap.


    Related: Render (RENDER) Price Prediction 2026: Can It Hit $5?

    Disclaimer: This article is for informational and educational purposes only and should not be construed as financial, investment, or trading advice. Cryptocurrency markets are highly volatile, and past performance does not guarantee future results. The analyses presented here are based on AI models, technical indicators, and available data at the time of writing – they are not guarantees. Always conduct your own research (DYOR) and consult with a qualified financial advisor before making any investment decisions. Pump Parade and its authors do not assume liability for financial losses incurred based on information provided in this article.

    Render (RENDER) Price Prediction 2026: Can It Hit $5?

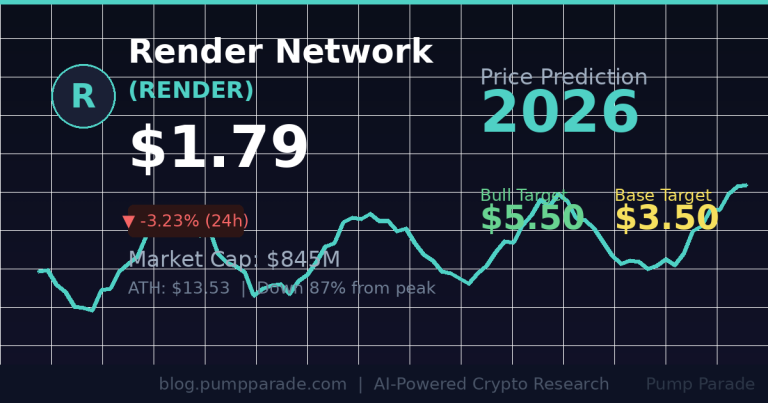
    Render RENDER price prediction 2026 hero image showing current price $1.79 and bull target $5.50

    Render (RENDER) is trading at $1.79 as of April 23, 2026. That is down 87% from its all-time high of $13.53. For an AI infrastructure token with a live network processing $210 million in daily GPU workloads, that gap is hard to ignore.

    Two weeks ago, RenderCon 2026 wrapped up in Hollywood. The event brought NVIDIA engineers, WME executives, and AI researchers together under one roof. The headline: Render Network just added 60,000 new GPUs through its approved Salad Network subnet. Every one of those jobs settles on-chain in RENDER tokens.

    So why is the price still sitting near two-year lows? And can it reach $5 before the year is out? Our AI model has an answer. Here is what the data says.

    What Is Render Network?

    Render Network is a decentralized GPU rendering platform. It connects creators who need compute power with node operators who have spare GPU capacity. Originally built for 3D artists and film studios, it has pivoted aggressively into AI inference and training workloads.

    The network runs on the Solana blockchain. RENDER is the native token used to pay for rendering jobs, reward node operators, and participate in governance. As of today, the circulating supply is 472.6 million RENDER with a market cap of approximately $845 million.

    The project has processed over $1 billion in cumulative GPU workloads. It counts NVIDIA, Autodesk, and major Hollywood VFX studios as partners and clients.

    Recent Catalysts: Why RENDER Is Worth Watching Now

    Three things happened in the last 30 days that changed the RENDER picture.

    1. RNP-023 Approved: 60,000 New GPUs Online

    The Render community voted to approve governance proposal RNP-023 in late March. This integrates Salad Network as Render’s third official subnet. Salad contributes roughly 60,000 daily active GPUs from idle consumer hardware worldwide. All payments within the subnet settle in RENDER tokens and feed into the network’s burn mechanism. More jobs burned means less circulating supply over time.

    2. RenderCon 2026: Hollywood, NVIDIA, and MCP

    RenderCon 2026 ran April 16-17 at Nya Studios in Hollywood. The event debuted live Model Context Protocol (MCP) integrations for Blender, OctaneRender, and the Dispersed AI compute subnet. In plain terms: AI agents can now access Render’s decentralized GPU network directly. That opens an entirely new demand channel beyond traditional 3D rendering.

    3. Record $210M in 24-Hour Workloads

    During RenderCon week, the network processed a record $210 million in compute jobs in a single 24-hour window. Daily active GPU counts are at all-time highs. The network is growing. The token price has not caught up yet.

    Technical Analysis: What the Chart Is Telling Us

    RENDER is in a long-term downtrend off its $13.53 ATH. However, several signs suggest accumulation at current levels.

    Key support levels: $1.75 (recent intraday low, held twice in the past week) and $1.40 (major structural support from Q3 2025).

    Key resistance levels: $2.16 is the first hurdle to clear. A close above that opens the path to $2.26, which analysts flagged as a critical retest level. Above $2.26, the next major resistance sits at $3.00.

    The RSI (Relative Strength Index) is hovering near 38, approaching oversold territory. That does not guarantee a bounce, but it does suggest sellers are losing momentum. The MACD (a momentum tracker) is flat, with no clear directional signal at this stage.

    The 50-day moving average sits at $2.08 and the 200-day at $3.42. RENDER needs to reclaim both to shift the trend. The current setup looks like late-stage consolidation, not breakdown. But macro pressure could change that quickly.

    The Bull Case for RENDER in 2026

    The bull case rests on three pillars: supply contraction, demand growth, and AI token rotation.

    Supply contraction via burns. Every GPU job on the Salad subnet burns RENDER tokens. As the network scales to hundreds of thousands of GPUs, burn pressure accelerates. If annualized job volume doubles from here, the deflationary math starts to look compelling.

    AI compute demand is structural. The AI model training and inference market is growing fast. Centralized cloud providers (AWS, Azure, GCP) are capacity-constrained and expensive. Render offers a cost-effective alternative with on-chain settlement. Enterprise clients care about cost, not narrative.

    AI token rotation. Capital rotates within the crypto AI sector. When big-cap AI tokens run up, smaller AI infrastructure plays often follow. For more context on how AI infrastructure tokens are trading this cycle, see our Bittensor (TAO) price prediction analysis.

    If these catalysts align and broader crypto sentiment stays constructive, RENDER reaching $5 by year-end is plausible. That would represent roughly 2.8x from current levels. Still well below its ATH.

    The Bear Case for RENDER in 2026

    The risks are real and worth taking seriously.

    Macro headwinds. If the broader crypto market enters a risk-off period, AI tokens typically sell off harder than blue chips. RENDER has already fallen 87% from its peak. A return to $1.00 or below is not impossible in a prolonged bear cycle.

    Competition is heating up. Akash Network, io.net, and Gensyn are all chasing the same decentralized GPU market. If a well-funded competitor captures enterprise share, Render’s pricing power erodes. The network effect advantage is real but not impenetrable.

    Token overhang. With 472 million tokens in circulation and no deflationary mechanism strong enough to absorb potential whale selling, large holders exiting could push the price significantly lower. Token concentration in early-stage AI projects is a known risk.

    Execution risk. The MCP integrations debuted at RenderCon as live demos. Turning demos into production-grade infrastructure for AI agents at scale is hard. Delays or technical failures would hit sentiment hard.

    AI Price Predictions by Timeframe

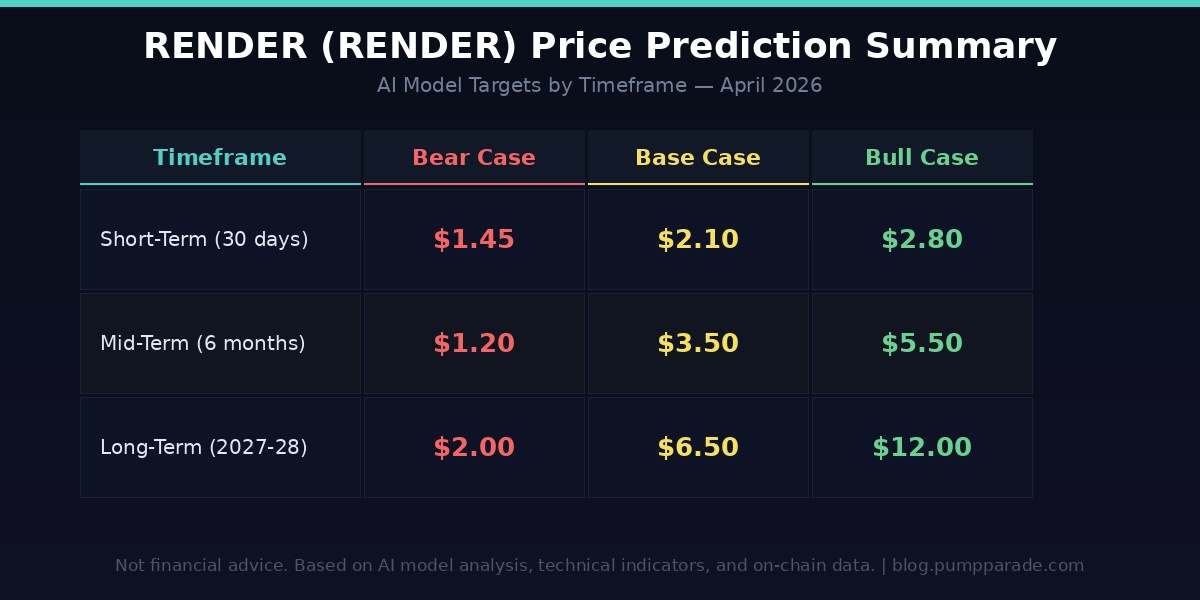
    Render RENDER price prediction summary table with bear, base, and bull targets across short-term, mid-term, and long-term timeframes

    Our hybrid AI model incorporates technical indicators, on-chain metrics, network activity data, and broader market sentiment. Here is the output across three timeframes.

    Short-Term: Next 30 Days

    Bear case: $1.45. If macro conditions deteriorate or BTC breaks key support, RENDER could retrace to the $1.40-$1.45 zone. This is the level where strong hands accumulated last cycle.

    Base case: $2.10. If the network continues processing record job volumes and the broader market stays neutral, RENDER works its way back toward the 50-day moving average at $2.08-$2.10. A relief rally, not a breakout.

    Bull case: $2.80. A broader AI token rotation combined with a RENDER-specific catalyst (such as a major enterprise partnership announcement) could push the price above $2.26 resistance in a fast move toward $2.80.

    Mid-Term: 6 Months Out

    Bear case: $1.20. A sustained crypto bear market with continued selling pressure and no new catalysts could push RENDER to new cycle lows.

    Base case: $3.50. Steady network growth, the ongoing burn from Salad subnet jobs, and improving market sentiment point to a gradual recovery toward the $3.00-$3.50 range by October 2026.

    Bull case: $5.50. Our AI model assigns roughly 18% probability to this outcome. It requires strong market conditions, meaningful on-chain revenue growth, and continued institutional interest in decentralized GPU infrastructure.

    Long-Term: 2027-2028

    Bear case: $2.00. If the AI compute narrative loses steam or Render fails to retain market share, the token stabilizes in the $2.00 range as a niche infrastructure play.

    Base case: $6.50. Assuming the decentralized GPU market grows as projected and Render maintains its position as the leading on-chain settlement layer, $6.50 by 2027 represents a realistic recovery toward prior cycle levels.

    Bull case: $12.00. If Render captures a meaningful slice of the enterprise AI inference market and the burn mechanism creates genuine supply scarcity, retesting the prior ATH range becomes possible. At $12, the market cap would be approximately $5.7 billion, comparable to mid-tier L1 blockchains today.

    What to Watch

    • Daily GPU job volume. If active GPUs on the Salad subnet keep growing past the 60,000 baseline, burn pressure increases. Watch the Render Network dashboard for weekly volume reports.
    • BTC dominance and macro. AI tokens tend to rally when BTC dominance falls and risk appetite returns. A BTC dominance reading below 55% would be a positive signal for RENDER.
    • The $2.16 resistance level. A daily close above $2.16 on meaningful volume would be the first confirmation of a trend reversal. Without that close, the downtrend is still intact.
    • Enterprise announcements. RenderCon 2026 highlighted partnerships in discussion. Any confirmed enterprise client for the AI inference pipeline would be a material catalyst.

    The Bottom Line

    RENDER is an AI infrastructure token with real network activity, a working burn mechanism, and credible partnerships. At $1.79, it trades at a fraction of its prior peak. The bear case is not trivial. Competition is real, macro risk is real, and the road from $1.79 to $5 requires a lot to go right.

    But the fundamentals are improving while the price has not yet reflected that. The Salad subnet, the MCP integrations, and the record compute volumes all happened in the last 30 days. The market is still catching up.

    Our AI model’s base case for six months out is $3.50, with a bull target of $5.50. Whether it gets there depends heavily on whether the AI narrative stays in focus and whether Render can convert its network growth into token demand at scale.

    This is a setup worth monitoring closely, not a trade to rush into.


    Disclaimer: This article is for informational and educational purposes only and should not be construed as financial, investment, or trading advice. Cryptocurrency markets are highly volatile, and past performance does not guarantee future results. The price predictions and analyses presented here are based on AI models, technical indicators, and available data at the time of writing. They are not guarantees. Always conduct your own research (DYOR) and consult with a qualified financial advisor before making any investment decisions. Pump Parade and its authors do not assume liability for financial losses incurred based on information provided in this article.

    About our AI predictions: Pump Parade’s price predictions are generated by machine learning models that analyze technical indicators, on-chain data, and market sentiment. These models have limitations and cannot account for black swan events, regulatory changes, or sudden market shifts. Use AI predictions as one input among many in your research.

    OFFICIAL TRUMP Price Prediction 2026: Gala Catalyst

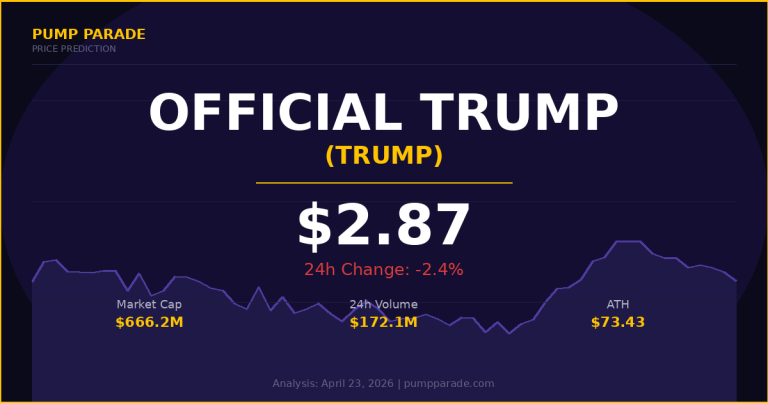
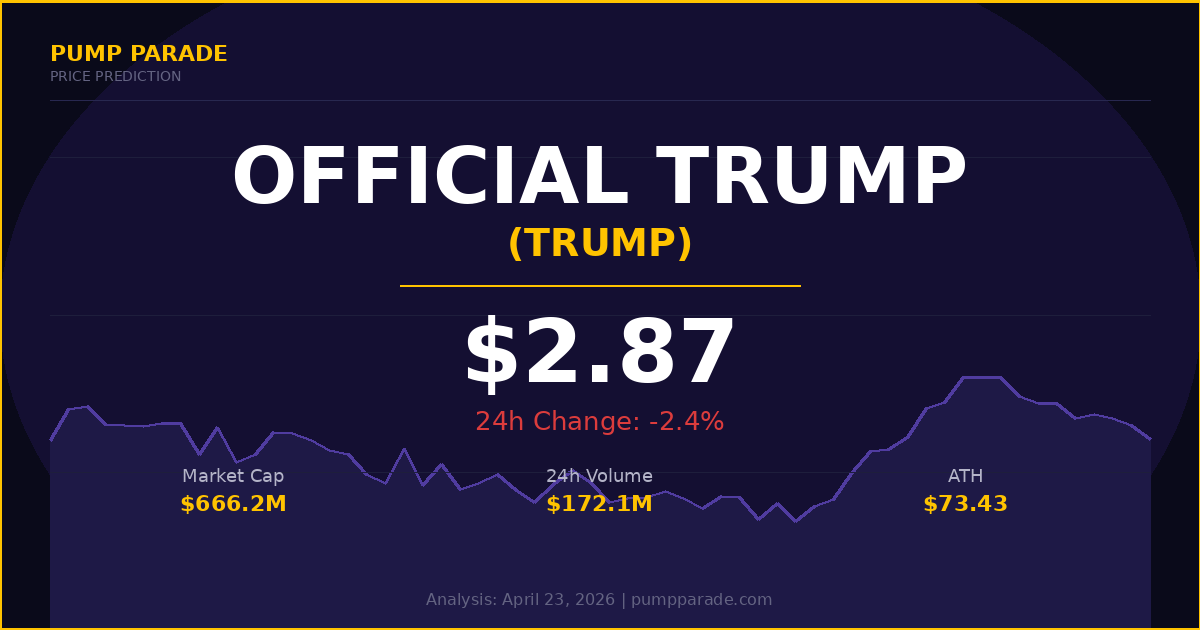
    OFFICIAL TRUMP (TRUMP) is trading at $2.87 as of April 23, 2026. Its 24-hour trading volume is $172.1 million. The token sits just 5% above its all-time low of $2.73, set in March 2026. Yet a major catalyst arrives in 48 hours: a private gala at Mar-a-Lago for the top 297 TRUMP token holders.

    The question is whether that event can reverse a long downtrend, or whether it signals a short-lived pop before the next leg lower. Our hybrid AI model analyzed on-chain data, price history, and macro context to find out.

    OFFICIAL TRUMP (TRUMP) Price Prediction 2026 hero image showing current price $2.87

    What Is OFFICIAL TRUMP?

    OFFICIAL TRUMP is a meme coin built on the Solana blockchain. It launched in January 2025, just days before Donald Trump’s presidential inauguration. Within 24 hours of launch, TRUMP reached an all-time high of $73.43. That made it one of the fastest launches in meme coin history.

    The token is managed by Fight Fight Fight LLC. CIC Digital, a Trump Organization affiliate, and Fight Fight Fight LLC together own 80% of the token supply. They also collect trading fees from activity on the market. That structure has drawn political scrutiny, which we will cover below.

    The primary utility of the token is access. Top holders get invitations to exclusive private events at Mar-a-Lago, Donald Trump’s Florida estate. The upcoming April 25 gala is the clearest example of this mechanic in action.

    Key metrics as of April 23, 2026:

    • Price: $2.87
    • Market cap: $666.2 million (#86 on CoinGecko)
    • 24h trading volume: $172.1 million
    • Circulating supply: 232.5 million TRUMP
    • Total supply: 1 billion TRUMP
    • All-time high: $73.43 (January 19, 2025)
    • All-time low: $2.73 (March 12, 2026)

    The Mar-a-Lago Gala: The Catalyst Driving Markets Right Now

    On April 25, 2026, the top 297 TRUMP token holders will attend a private gala in Palm Beach, Florida. The top 29 holders receive exclusive VIP access to President Trump directly.

    This is the second such event. The first gala was held in May 2025. Tron founder Justin Sun attended after spending approximately $25 million to secure a top-25 spot. He is currently ranked 5th in the holder leaderboard for this gala, with 74.3 million reward points. The top two spots each hold over 225 million points. The competition is real and expensive.

    The run-up to this gala already drove a dramatic price move. TRUMP surged roughly 60% from around $2.70 to above $4.00 before settling to current levels. Whale wallets withdrew millions in TRUMP from exchanges like Binance and Bybit, moving to self-custody. That signals holding intent ahead of the event snapshot.

    The gala creates a textbook short-term demand spike. Buyers who want access need to hold tokens, not sell them. Once the event passes, that holding pressure evaporates. What happens after depends on whether TRUMP can generate attention beyond the gala itself.

    Senate Scrutiny: The Risk Nobody Should Ignore

    On April 8, 2026, U.S. Senators Elizabeth Warren, Adam Schiff, and Richard Blumenthal sent a formal letter to Fight Fight Fight LLC. They requested documents and communications about the April 25 event. Their concern: large token buyers are effectively purchasing privileged access to the sitting president.

    The senators wrote that “Congress must take steps to prohibit and prevent these egregious conflicts of interest.” They requested a response by April 21, 2026. That deadline has passed.

    This is not routine regulatory noise. The Senate Banking Committee is directly investigating the gala structure. Any formal action, subpoena, or proposed legislation targeting the token or the event could hit TRUMP price hard and fast. This is the primary risk factor for short-term and medium-term holders.

    Technical Analysis: Oversold, But Not Yet Reversing

    TRUMP’s technical picture is mixed right now. Here is what the key indicators show.

    The 7-day RSI (Relative Strength Index, a momentum indicator from 0 to 100) sits around 21.87. A reading below 30 is generally considered oversold. That means sellers have dominated recent sessions and a technical bounce is possible. But oversold conditions can persist for weeks without a reversal catalyst.

    The 14-day RSI is approximately 30.45, just above the oversold threshold. The MACD (Moving Average Convergence Divergence, which tracks trend direction) shows a negative histogram reading. Bearish momentum remains in control on the daily timeframe.

    Key price levels to watch:

    • Support: $2.75 (the zone that reversed the March lows), $2.73 (all-time low floor)
    • Immediate resistance: $5.23
    • Secondary resistance zone: $5.68 to $7.02
    • Bull breakout target: $8.50 if price clears $7.00 on strong volume

    The token currently trades 96% below its January 2025 all-time high. A full recovery to $73 is not a realistic near-term scenario. But a move to $5 to $8 is technically supported if the gala sparks sustained buying and broader meme coin sentiment improves.

    Understanding how meme coins behave in event-driven cycles is key to navigating TRUMP price action. Our guide to finding Solana memecoins before they move covers the patterns worth watching here.

    The Bull Case for TRUMP in 2026

    Here is what needs to go right for TRUMP to trade higher.

    The gala delivers positive optics. If the April 25 event generates strong media coverage and Trump engages visibly with the crypto community, a fresh wave of buyers could push TRUMP above the $5.23 resistance level. Social media attention around a high-profile private event often triggers meme coin price pumps.

    Whale accumulation continues post-event. Large wallets have been moving TRUMP off exchanges ahead of the gala. If they continue holding after April 25, reduced exchange supply creates upward price pressure even with modest buying demand.

    Political cycle tailwinds sustain the narrative. TRUMP is tied to one of the most prominent political figures in the world. If the administration continues to engage with crypto publicly, the token benefits from narrative momentum. The broadly crypto-friendly policy backdrop provides a positive macro environment.

    The $2.75 support holds as a base. If TRUMP stabilizes above the March reversal zone post-gala, it sets up a medium-term base for a recovery toward $5 to $8 over the following months.

    The Bear Case for TRUMP in 2026

    Here is what could go wrong.

    Post-gala sell pressure hits hard. Every event creates a natural selling window. Once the snapshot is taken and the gala is over, the incentive to hold disappears. Holders who bought purely for access will likely sell. That creates immediate downward pressure.

    Senate investigation escalates. If Warren, Schiff, and Blumenthal pursue formal action, the regulatory overhang could suppress demand meaningfully. Any news about congressional hearings or legislation targeting the token structure could trigger a sharp sell-off.

    Token unlock pressure grows. With 1 billion total supply against 232.5 million in circulation, a large portion of TRUMP has not yet entered the market. Future token unlocks that add to circulating supply would dilute existing holders and create persistent selling pressure.

    Broader meme coin fatigue returns. The meme coin narrative cooled significantly after the February 2025 peak. If macro conditions deteriorate or Bitcoin breaks key support levels, meme coins typically fall harder than the broader market. TRUMP would not be immune.

    A close below $2.73, the all-time low, would be a significant bearish signal. It would indicate that even gala-driven demand could not hold the floor.

    AI Price Prediction Summary

    Our hybrid AI model analyzed TRUMP’s price history, volume patterns, on-chain metrics, the gala catalyst, and Senate risk to produce these scenario-based predictions.

    OFFICIAL TRUMP (TRUMP) price prediction table showing bear, base, and bull targets for 2026 and beyond

    Short-Term (30 Days)

    The next 30 days will be dominated by the gala effect. A bounce from oversold RSI levels is likely in the immediate short term. The bear scenario is a failure to hold $2.75 after the event, leading to a test of the $1.80 range. The base case is consolidation between $3.00 and $3.50 as gala hype is absorbed. The bull case is a clean break above $5.23 on strong post-event volume, targeting $5.50.

    Medium-Term (6 Months)

    The six-month outlook depends on whether new catalysts emerge. A third gala announcement, a new Trump crypto initiative, or a broader meme coin revival could push TRUMP toward $8 to $9. Without new catalysts, the base case is trading between $2.50 and $4.50. The bear case is regulatory pressure pushing price below the all-time low, toward $1.20.

    Long-Term (2027-2028)

    By 2027 and 2028, TRUMP’s path depends on political events and the continued relevance of Donald Trump as a brand anchor. Presidential election cycles in other countries and continued crypto policy engagement could support higher prices, with our bull case at $18.00. Regulatory intervention or narrative fatigue are the primary risks. The bear case sees the token at $0.60 as political cycles shift.

    What to Watch

    Here are the key events and price levels to monitor in the coming weeks.

    • April 25: The Mar-a-Lago gala. Watch post-event volume and price action in the 24 to 48 hours afterward. This is the most important data point for near-term direction.
    • $2.73: The all-time low. A daily close below this level would signal a new downleg and invalidate the short-term bull case.
    • $5.23: The nearest meaningful resistance. A clean break above this level on rising volume opens the path toward $7 to $9.
    • Senate response: Watch for any formal regulatory action from Congress targeting the token or the gala structure.
    • Exchange balances: Monitor whether whale wallets return TRUMP to exchanges after April 25. If outflows reverse to inflows, it signals distribution and near-term selling pressure.

    Conclusion

    OFFICIAL TRUMP is at an inflection point. The token sits near its all-time low, with oversold RSI readings and a high-profile catalyst arriving in less than 48 hours. That is a setup worth watching. But it also carries real downside risk if gala hype fades or the Senate investigation escalates.

    Our base case is a short-term bounce toward $3.50 driven by pre-gala demand, followed by consolidation. The bull case of $5.50 requires sustained attention and new catalysts beyond April 25. The bear case of $1.80 or lower requires either a regulatory shock or a breakdown below the $2.73 all-time low floor.

    According to CoinGecko, TRUMP commands a $666 million market cap with $172 million in daily trading volume. Those are not the numbers of a dead token. But this is a high-risk, high-volatility asset with a 96% drawdown from its peak. Position sizing matters here far more than directional conviction.


    Disclaimer: This article is for informational and educational purposes only and should not be construed as financial, investment, or trading advice. Cryptocurrency markets are highly volatile, and past performance does not guarantee future results. The price predictions and analyses presented here are based on AI models, technical indicators, and available data at the time of writing. They are not guarantees. Always conduct your own research (DYOR) and consult with a qualified financial advisor before making any investment decisions. Pump Parade and its authors do not assume liability for financial losses incurred based on information provided in this article.

    About our AI predictions: Pump Parade’s price predictions are generated by machine learning models that analyze technical indicators, on-chain data, and market sentiment. These models have limitations and cannot account for black swan events, regulatory changes, or sudden market shifts. Prediction confidence scores reflect the model’s internal assessment, not guaranteed accuracy. Use AI predictions as one input among many in your research.
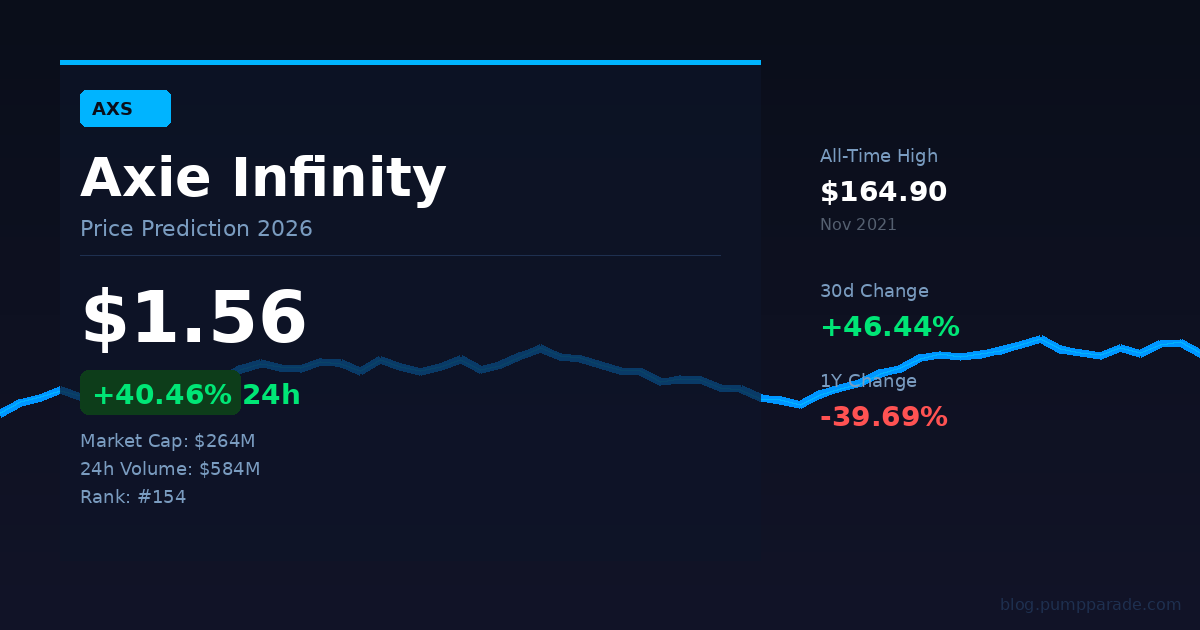
    Raydium vs Orca: Best Solana DEX 2026

    0

    Choosing the right decentralized exchange on Solana can make or break your trading experience. Raydium and Orca are two of the biggest names in the game, but they serve very different types of traders. Whether you’re chasing freshly launched memecoins or looking for the cleanest swap experience on blue-chip pairs, one of these two DEXs is probably your daily driver.

    In this head-to-head comparison, we’ll break down everything that matters: liquidity, fees, features, security, and user experience. By the end, you’ll know exactly which Solana DEX deserves your volume in 2026.

    Quick Verdict: Raydium vs Orca

    Raydium wins for memecoin traders, new token hunters, and power users who want the deepest liquidity and the widest token selection on Solana. With $1.4B+ in TVL and over 3,300 trading pairs, it’s the default liquidity venue for tokens graduating from pump.fun. Visit Raydium.

    Orca wins for DeFi-focused traders and liquidity providers who value capital efficiency, a clean interface, and the best execution on established pairs. Its Whirlpools concentrated liquidity system returns 100% of swap fees to LPs, making it the go-to for yield-conscious providers. Visit Orca.

    What Is Raydium?

    Raydium DEX logo

    Raydium launched in February 2021 and quickly became the backbone of Solana’s DEX ecosystem. It’s an automated market maker (AMM) that offers multiple pool types, including standard AMM pools, concentrated liquidity (CLMM) pools, and constant product pools. In July 2025, Raydium crossed $1 trillion in cumulative trading volume, a milestone that cemented its position as Solana’s dominant exchange.

    Today, Raydium holds roughly 20.8% of all DEX trading volume across all chains and consistently ranks as the #1 DEX on Solana by daily volume. It’s also the primary liquidity destination for tokens launched through pump.fun, which means almost every new memecoin on Solana sees its first real trading action on Raydium.

    Beyond swaps, Raydium offers perpetual futures trading with 0 bps maker fees and tiered 2 to 4.5 bps taker fees, plus the AcceleRaytor launchpad for new token launches.

    What Is Orca?

    Orca DEX logo

    Orca is a concentrated liquidity DEX that has carved out a reputation for clean design and capital efficiency on Solana. While it doesn’t match Raydium’s raw volume, Orca’s Whirlpools technology is widely regarded as one of the best concentrated liquidity implementations in DeFi.

    Whirlpools allow liquidity providers to deposit capital within custom price ranges rather than spreading it across the entire price curve. This approach can increase capital efficiency by 100x to 4,000x compared to traditional constant product AMMs. Each LP position is represented as an NFT, which can be composed with other DeFi protocols.

    With roughly $250M to $290M in TVL, Orca is the third-largest DEX on Solana by volume. It’s particularly strong on established pairs like SOL/USDC, where its concentrated liquidity pools often deliver better execution than competitors. If you’re already exploring the Solana ecosystem, check out our Solana (SOL) Price Prediction 2026 for more context on the chain’s trajectory.

    Fees Compared

    Fees are where things get interesting. Both exchanges use tiered fee structures that depend on the pool type and pair volatility, but there are key differences in how those fees are distributed.

    Raydium charges swap fees ranging from 0.01% to 1% depending on the pool type (CLMM pools can go as low as 0.01%). Of those fees, 84% goes to liquidity providers and 12% funds RAY staking incentives. For perpetual trading, makers pay 0 bps while takers pay 2 to 4.5 bps depending on their tier.

    Orca charges fees ranging from 0.01% to 0.3% depending on the pool tier. The big difference? 100% of swap fees go directly to liquidity providers. There’s no protocol cut from swap fees, which makes Orca more attractive for LPs looking to maximize yield on their positions.

    For most swaps on common pairs, both exchanges will cost you roughly the same in fees. The real difference is in fee distribution: if you’re providing liquidity, Orca’s 100% LP share is a meaningful advantage. If you’re just swapping, the difference is negligible.

    Features Deep Dive

    Raydium Features

    • Three pool types: Standard AMM, Concentrated Liquidity (CLMM), and Constant Product pools give traders and LPs maximum flexibility
    • Perpetual futures: Trade perps with leverage directly on the platform, with competitive maker/taker fees
    • AcceleRaytor launchpad: Participate in new token launches and IDOs
    • Farm rewards: Earn additional RAY token rewards on top of trading fees for select pools
    • 3,300+ trading pairs: The widest token selection of any Solana DEX, including nearly every memecoin that launches
    • pump.fun integration: Tokens graduating from pump.fun automatically get Raydium liquidity pools

    Orca Features

    • Whirlpools: Best-in-class concentrated liquidity with customizable price ranges and fee tiers
    • NFT LP positions: Each liquidity position is an NFT, composable across DeFi
    • Fair Price Indicator: Built-in price comparison tool that helps you avoid bad trades
    • Custom fee tiers: Pool creators can set fee tiers that match the volatility profile of their pair
    • Clean, beginner-friendly UI: Orca’s interface is consistently praised as the most approachable on Solana

    If you’re into fast-paced trading and want tools like bots, take a look at our comparison of Photon vs BullX for the best Solana trading bots in 2026.

    Pros and Cons

    Raydium Pros

    • Deepest liquidity on Solana with $1.4B+ TVL
    • Widest token selection (3,300+ pairs including fresh memecoins)
    • Perpetual futures trading with competitive fees
    • Primary liquidity venue for pump.fun token launches
    • Farm rewards provide additional yield for LPs

    Raydium Cons

    • Only 84% of fees go to LPs (12% to protocol)
    • Interface is more complex and less beginner-friendly
    • Standard AMM pools are less capital efficient
    • No built-in swap aggregation

    Orca Pros

    • 100% of swap fees returned to liquidity providers
    • Best-in-class Whirlpools concentrated liquidity (100-4,000x capital efficiency)
    • Clean, intuitive interface that beginners can navigate easily
    • Excellent execution on blue-chip pairs (SOL/USDC, etc.)
    • NFT LP positions composable with other DeFi protocols

    Orca Cons

    • Significantly lower TVL (~$250-290M vs $1.4B+)
    • Fewer token pairs (mostly established tokens, limited memecoin coverage)
    • No perpetual trading or launchpad features
    • Concentrated liquidity requires active position management
    • No DCA or limit order functionality built in

    Comparison Table

    Raydium vs Orca comparison table showing fees, TVL, features, and ratings side by side
    Raydium vs Orca: Key metrics compared at a glance
    Feature Raydium Orca
    TVL $1.4B+ $250-290M
    Solana Rank by Volume #1 #3
    Swap Fees 0.01%-1% 0.01%-0.3%
    LP Fee Share 84% 100%
    Pool Types AMM + CLMM + Constant Product Whirlpools (Concentrated Liquidity)
    Perp Trading Yes No
    Launchpad AcceleRaytor No
    Token Pairs 3,300+ 500+
    Security Audits Cyberscope + Immunefi bounty Kudelski + Neodyme audits
    Best For Memecoins, new tokens, power users Blue-chip pairs, LPs, beginners

    Security and Trust

    Raydium has been audited by Cyberscope and maintains a $505K bug bounty program on Immunefi. The protocol has processed over $1 trillion in cumulative volume without a major smart contract exploit, which is a strong track record in DeFi. The team has also rolled out enhanced security measures throughout 2025 and 2026 as TVL grew.

    Orca has undergone multiple security audits from Kudelski Security and Neodyme, two well-respected firms in the Solana security space. The protocol also maintains an active bug bounty program. Orca’s Whirlpools contracts have been live since 2022 and have handled billions in volume without incident.

    Both protocols are non-custodial, meaning your funds stay in your wallet until you execute a swap. Neither requires KYC. That said, concentrated liquidity pools on both platforms introduce additional complexity (tick mechanics, price range logic) that expands the potential attack surface compared to simpler AMM designs.

    For secure wallet options to connect to either DEX, read our Phantom vs Backpack wallet comparison.

    User Experience

    Raydium’s interface is functional but dense. It packs a lot of information onto the screen: pool stats, fee tiers, LP positions, farm rewards, and perps trading all share space. For experienced DeFi users, this is great because everything is accessible without clicking through multiple pages. For newcomers, it can feel overwhelming. There’s no mobile app, but the web interface works on mobile browsers.

    Orca’s interface is the opposite: clean, minimal, and focused. The swap experience is straightforward, with a Fair Price Indicator that shows how your trade compares to market price. The Whirlpools LP interface clearly visualizes your price range and current position. Orca consistently gets praise from the community for having the best UX of any Solana DEX. Like Raydium, it’s web-only with mobile browser support.

    If you value simplicity and spend most of your time swapping established tokens, Orca’s UX is noticeably better. If you need access to every new token and advanced features like perps, you’ll end up on Raydium regardless of the learning curve.

    Verdict: Which Solana DEX Should You Use?

    The answer depends on what kind of trader you are:

    Choose Raydium if: You trade memecoins, hunt new token launches, want perp trading, or need access to the widest possible token selection on Solana. Raydium’s dominance in volume and liquidity depth makes it the unavoidable hub for anything new or speculative on the network. It’s also the better choice if you’re already using tools like Photon or other trading bots that route through Raydium pools.

    Choose Orca if: You primarily trade established pairs (SOL/USDC, SOL/USDT), want the cleanest trading experience, or plan to provide liquidity and want to keep 100% of your earned fees. Orca’s Whirlpools technology delivers superior capital efficiency, and the interface is genuinely a pleasure to use.

    The best approach? Use both. Most active Solana traders use Jupiter as their swap aggregator (check out our Jupiter Exchange Review 2026), which automatically routes trades through both Raydium and Orca to find the best price. For direct DEX interaction, keep Raydium bookmarked for new tokens and Orca for LP positions.

    Overall winner: Raydium, by a narrow margin. Its combination of deepest liquidity, widest token selection, and additional features like perp trading make it the more complete platform. But Orca remains the better choice for specific use cases, particularly LP yield optimization and everyday swapping.

    FAQ

    Is Raydium or Orca cheaper for swapping?

    Both are very similar in cost. Raydium’s CLMM pools start at 0.01%, and Orca’s Whirlpools range from 0.01% to 0.3%. For most common pairs, you’ll pay roughly the same. The real cost difference comes from slippage, where Raydium’s deeper liquidity often means less price impact on large trades.

    Which DEX is better for providing liquidity?

    Orca has the edge for LPs because it returns 100% of swap fees to liquidity providers (Raydium keeps 16%). Orca’s Whirlpools also offer cleaner concentrated liquidity management. However, Raydium offers additional farm rewards on select pools that can offset the fee difference.

    Can I trade memecoins on Orca?

    Orca supports some popular memecoins, but its selection is much smaller than Raydium’s 3,300+ pairs. If you’re hunting newly launched tokens or pump.fun graduates, Raydium is your only realistic option among these two DEXs.

    Do I need a specific wallet for Raydium or Orca?

    Both DEXs work with all major Solana wallets, including Phantom, Backpack, and Solflare. Simply connect your wallet and start trading. No KYC or account creation required.

    Should I just use Jupiter instead?

    Jupiter is a swap aggregator that routes trades through both Raydium and Orca (among other DEXs) to find the best price. For simple swaps, Jupiter is often the smartest choice. But if you want to provide liquidity, use perp trading, or access Raydium’s launchpad features, you’ll need to interact with the DEXs directly.

    TRON (TRX) Price Prediction 2026: Can TRX Hit $0.50?

    0

    TRON (TRX) is trading at $0.3146 today, April 21, 2026. That might not sound exciting at first glance. But context changes everything.

    While Bitcoin dropped 24% in Q1 2026, TRX gained 9%. The TRON network now settles $86.6 billion in stablecoins, second only to Ethereum. Daily transactions hit 11 million, with 373 million user accounts on the network. Then in April, Canary Capital filed for a staked TRX ETF with the SEC, and the agency officially acknowledged the filing.

    The question for the rest of 2026 is straightforward: does TRX finally break out of its range, or does it keep grinding sideways while louder tokens steal the spotlight? Let’s look at the data.

    TRON TRX price prediction 2026 hero image showing current price $0.3146 and key metrics

    What Is TRON?

    TRON is a Layer 1 blockchain founded by Justin Sun in 2017. Its original pitch was a decentralized entertainment platform. In 2026, its identity is something completely different: TRON is the world’s dominant stablecoin settlement layer.

    The network processes an average of 11 million daily transactions at near-zero fees. That makes it the go-to infrastructure for USDT transfers globally. TRON holds $85 billion of USDT, representing 46% of all USDT in circulation and 27% of the entire stablecoin market.

    Key metrics at a glance:

    • Current price: $0.3146 (April 21, 2026)
    • 24-hour trading volume: $1.02 billion
    • Daily transactions: 11 million
    • Total user accounts: 373 million
    • Stablecoin TVL: $86.6 billion
    • Q1 2026 performance: +9% (vs. BTC at -24%)

    Key Catalysts Driving TRX in 2026

    1. Canary Capital Files a Staked TRX ETF

    In April 2026, Canary Capital filed an S-1 registration with the SEC for the Canary Staked TRX ETF. The fund would hold and stake TRX, passing roughly 4.5% annual yield to investors. The SEC has officially acknowledged the filing.

    This makes TRX one of only a handful of tokens with a spot ETF filing. For context, Bitcoin’s ETF approval in January 2024 preceded a significant multi-month rally driven by institutional inflows. The TRX ETF timeline remains uncertain, but the filing alone signals institutional legitimacy that the market is beginning to price in.

    2. Zero Hash Unlocks Institutional Access

    On March 31, 2026, TRON integrated with Zero Hash, a regulated compliance infrastructure provider. Regulated enterprises can now access TRX and TRC-20 USDT for custody, trading, liquidity, and settlement in select jurisdictions.

    This removes a key barrier for institutional adoption. Previously, regulated firms had limited compliant pathways to access TRON-based assets. Now they have direct access through a licensed partner. That matters more than it sounds in the current regulatory environment.

    3. SEC Settlement Brings Legal Clarity

    In March 2026, the SEC reached a settlement with TRON and founder Justin Sun. The outcome brought clearer legal standing for TRX in the US market. This was a meaningful shift after years of regulatory uncertainty surrounding both the project and its founder.

    Institutional capital typically follows legal clarity. The settlement, the Zero Hash integration, and the ETF filing form a coherent institutional adoption narrative. Each piece reinforces the others.

    4. Stablecoin Volumes Hit Record Highs

    Q1 2026 saw adjusted stablecoin volume across all chains exceed $4 trillion for the first time. TRON led all chains in year-to-date stablecoin inflows with $6.1 billion added through April, according to Finbold. The GENIUS Act, US stablecoin legislation passed in 2025, is accelerating institutional adoption of stablecoin infrastructure globally.

    For more context on this surge, our deep dive covers the full picture: $28 Trillion in 90 Days: Inside Stablecoins’ Record Q1 and the Bot Economy Driving It. TRX sits at the center of that story as the top stablecoin chain by inflows.

    5. GreatVoyage Upgrade Targets AI Applications

    In February 2026, TRON completed the GreatVoyage-v4.8.1 (Democritus) protocol upgrade. The upgrade improved compatibility with AI applications, broadening TRON’s potential use cases beyond pure stablecoin settlement. Given current market appetite for AI infrastructure tokens, this opens a new narrative for TRX beyond its core utility.

    Technical Analysis: Where Is TRX Headed?

    TRX has been trading within an ascending channel since early March 2026. The move started from a low of $0.2780 and reached a high of $0.3250 before pulling back to current levels near $0.3146.

    Current technical readings:

    • Key support: $0.31 (channel lower boundary), $0.295 (secondary support)
    • Key resistance: $0.3182 to $0.3229 (SAR and Supertrend convergence zone), $0.335 (channel upper boundary)
    • RSI: 42.71, approaching oversold territory on the 30-minute chart. That signals limited downside in the near term.
    • 50-day moving average: Below current price and rising. That is a bullish structural signal.
    • VWAP: Slightly above current price ($0.3147 to $0.3159), meaning TRX is trading right at its fair value reference point.

    The chart pattern is consolidation near support, not a breakdown. TRX is holding above the channel base. A bounce from current levels would target the $0.32 to $0.335 resistance cluster. A break above $0.335 opens the door to a test of $0.38.

    The bear case on the technicals is a break below $0.31. That would invalidate the ascending channel structure and target $0.295 as the next meaningful support.

    Bull Case and Bear Case

    The Bull Case

    The bull thesis for TRX rests on three pillars: institutional access, stablecoin dominance, and regulatory clarity.

    If the Canary Capital ETF moves toward approval, institutional flows into TRX could be substantial. Zero Hash opens the door for regulated enterprises to allocate directly to TRX. Stablecoin usage on TRON is growing at its fastest pace in years, driven by the GENIUS Act and global demand for dollar-denominated settlement. A break above $0.335 could lead to a run toward $0.50 by year-end if ETF momentum builds and stablecoin demand holds.

    The Bear Case

    TRX has struggled to hold gains above the $0.30 to $0.32 range for extended periods. The ETF filing does not guarantee approval. Justin Sun remains a reputationally divisive figure in crypto, which could limit institutional appetite despite the settlement. If Bitcoin weakens further and broader risk appetite drops, TRX could see a retest of the $0.25 range. The ascending channel structure is also fragile: one bad week could break it.

    TRON TRX price prediction 2026 2027 2028 summary table showing bear base and bull targets

    TRX Price Predictions: 2026, 2027, and 2028

    Our AI model analyzed TRON’s technical setup, stablecoin fundamentals, ETF catalyst potential, and broader macro conditions. Here are the price targets across three scenarios and three timeframes.

    Short-Term (30 Days)

    The immediate range is tight. TRX is consolidating near $0.31 support with RSI approaching oversold. A bounce leads toward $0.335 to $0.38. A breakdown puts $0.28 to $0.295 in play. The base case is a grind back toward the resistance cluster.

    • Bear target: $0.28
    • Base target: $0.335
    • Bull target: $0.38

    Mid-Term (6 Months)

    Over the next six months, the ETF narrative will either gain traction or stall. If the SEC moves toward approval, institutional interest could push TRX into new multi-year high territory. If macro conditions deteriorate or the ETF is rejected, the base case narrows significantly.

    • Bear target: $0.25
    • Base target: $0.42
    • Bull target: $0.58

    Long-Term (2027 to 2028)

    The long-term bull case for TRX is structural. If TRON maintains its stablecoin dominance and the ETF receives approval, the token’s role as global settlement infrastructure would need to be reflected in price. The bear case assumes a loss of stablecoin market share to Ethereum or a newer chain.

    • Bear target: $0.22
    • Base target: $0.65
    • Bull target: $1.20

    What to Watch

    Three things will drive TRX price over the next 90 days:

    ETF timeline: Any SEC commentary on the Canary Capital filing, positive or negative, will move price. Watch for a formal review period or comment window from the SEC.

    Stablecoin supply growth: If TRON’s USDT supply continues to grow past $87B to $90B, that signals sustained institutional demand for the network. It also strengthens the fundamental case for TRX appreciation.

    The $0.31 support level: This is the channel base. If TRX loses $0.31 on a daily close, the ascending channel breaks. That would be a meaningful change in near-term structure. If it holds, the range trade continues with $0.335 as the target.

    TRX is not a meme. It is not a narrative play. It is infrastructure. And infrastructure tokens tend to move later in cycles, when real usage catches up with price. The question is whether the ETF catalyst and institutional access tools are enough to pull TRX forward ahead of that broader cycle.

    Risk Disclaimer

    Disclaimer: This article is for informational and educational purposes only and should not be construed as financial, investment, or trading advice. Cryptocurrency markets are highly volatile, and past performance does not guarantee future results. The price predictions and analyses presented here are based on AI models, technical indicators, and available data at the time of writing. They are not guarantees. Always conduct your own research (DYOR) and consult with a qualified financial advisor before making any investment decisions. Pump Parade and its authors do not assume liability for financial losses incurred based on information provided in this article.

    About our AI predictions: Pump Parade’s price predictions are generated by machine learning models that analyze technical indicators, on-chain data, and market sentiment. These models have limitations and cannot account for black swan events, regulatory changes, or sudden market shifts. Prediction confidence scores reflect the model’s internal assessment, not guaranteed accuracy. Use AI predictions as one input among many in your research.
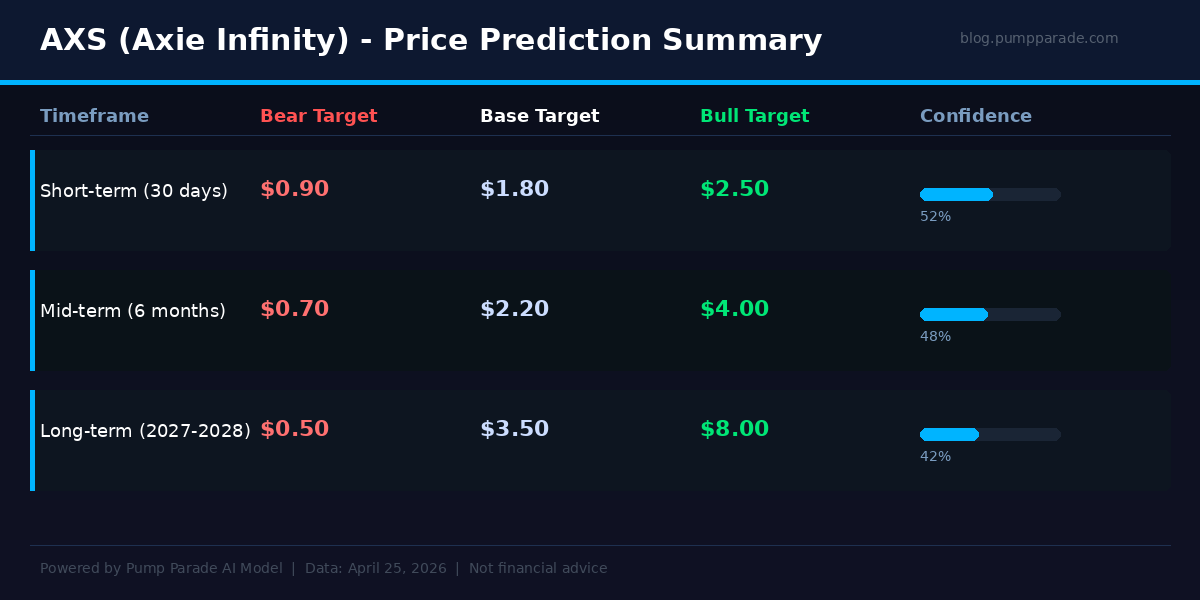
    Jito (JTO) Price Prediction 2026

    0
    Jito JTO price prediction 2026 hero image showing current price $0.3234 and key stats

    Jito (JTO) is trading at $0.3234 as of April 20, 2026. That is a 48% recovery from the all-time low of $0.2181 hit in February. But it is still down more than 94% from the December 2023 all-time high of $6.01.

    The gap between where JTO is and where it has been is enormous. The question is whether the catalysts arriving in April 2026 are enough to start closing it. There are three worth examining closely: a new institutional partnership in South Korea, a fee governance vote that could send cash flows directly to the DAO treasury, and growing AI agent activity boosting the MEV revenue that makes JitoSOL one of Solana’s most attractive yield assets.

    This article breaks down the data, the bull case, the bear case, and what our AI model currently targets across three time horizons.

    What Is Jito? A Quick Primer

    Jito is a liquid staking and maximum extractable value (MEV) protocol built on Solana. When you stake SOL through Jito, you receive JitoSOL in return. JitoSOL maintains liquidity while earning two yield streams simultaneously: standard Solana staking rewards and a portion of MEV captured by Jito’s block engine.

    That dual-yield structure is Jito’s core competitive advantage. JitoSOL currently yields approximately 7.2 to 7.8% APY, compared to 5.9 to 6.6% for native Solana staking. The difference is MEV. Jito’s block engine processes validator tips and bundles for about 80% of Solana’s stake-weighted validators, giving the protocol unmatched MEV capture at the infrastructure level.

    As of April 2026, DeFiLlama shows Jito’s liquid staking TVL at $2.92 billion, with roughly 14.5 million SOL staked. That makes Jito the largest liquid staking protocol on Solana by a wide margin.

    The JTO token is Jito’s governance token. Holders vote on fee structures, delegation strategy, treasury management, and protocol upgrades. Governance votes have historically not had a direct price catalyst. That is changing with JIP-24.

    April 2026 Catalysts

    1. The KODA Partnership (April 13)

    Jito Foundation signed a memorandum of understanding with KODA, a regulated digital asset custodian in South Korea. The deal targets institutional investors by creating compliant custody and staking pathways for JitoSOL.

    South Korea is one of the most active crypto retail and institutional markets globally. If the KODA integration moves past MoU into live product, it opens Jito to a new institutional demand pool that has had no regulated on-ramp to Solana liquid staking until now.

    This is not a guaranteed price driver. MoUs often stall. But it signals that Jito is actively building the compliance infrastructure needed for institutional scale, and it is arriving at a time when South Korean regulators are actively creating frameworks for crypto products.

    2. JIP-24 and the Fee Accrual Mechanism

    JIP-24 is a governance proposal that would route 100% of Block Engine and BAM (Block Auction Mechanism) fees directly to the Jito DAO treasury. Based on current network activity, that could generate up to $15 million annually in real cash flows.

    Treasury cash flows create optionality: buybacks, staking rewards, grants, or reserves. More importantly, they give JTO a fundamentals-based valuation floor. At $149M market cap with $15M annual revenue flowing to the DAO, that is roughly a 10x price-to-revenue ratio. For a protocol controlling $2.92B in TVL, that is a compelling setup if the vote passes.

    3. AI Agents and MEV Growth

    One underappreciated catalyst: AI trading agents are generating significantly more on-chain activity on Solana. More transactions mean more MEV opportunities for Jito’s block engine. On April 16, MEXC identified JTO as one of five altcoins outperforming Bitcoin in April, citing specifically that AI agent volume is boosting MEV revenue for JitoSOL holders.

    If Solana’s AI agent ecosystem continues to grow, the fundamental case for JitoSOL yield improves. Higher yield attracts more TVL. More TVL means more protocol revenue. More protocol revenue supports a higher JTO valuation.

    Technical Analysis

    JTO’s technical picture is improving, though it is early. Here is what the data shows at time of writing.

    Price: $0.3234
    24h change: +3.8%
    7-day performance: +17% (whale accumulation visible on-chain)
    All-time low: $0.2181 (Feb 6, 2026)
    Recovery from ATL: +48.2%

    RSI: Approximately 61. This means momentum is building, but the token is not overbought. There is room for bulls to push further before hitting typical reversal territory above 70.

    Key resistance levels: The immediate ceiling is around $0.3376. A clean break above that targets the $0.38 to $0.40 zone, where open interest spiked 21% in the past week. Beyond that, $0.50 becomes the next meaningful resistance.

    Key support levels: $0.27 to $0.28 is the first meaningful support. Below that, $0.21 to $0.22 sits near the February lows. A break below $0.21 would be a bearish structural failure.

    On-chain data shows early-stage whale accumulation. Open interest jumped 21% to $14.26 million last week, signaling fresh capital entering the market rather than short-term rotation.

    The Bull Case

    The bull case for JTO rests on three interconnected pillars.

    First, Solana itself is recovering. SOL is currently at $85, up from lows near $50 in early 2026. A continued Solana recovery drives more liquid staking demand, more TVL, and higher MEV revenue for Jito. JTO historically moves at a multiplier to SOL during Solana bull phases.

    Second, institutional adoption is starting to materialize. The KODA deal, the Blockworks IR platform partnership (April 16), and JIP-24 treasury mechanics are all signals that Jito is maturing from a retail DeFi product into institutional infrastructure. Institutional adoption compresses discount-to-TVL ratios over time.

    Third, the AI agent narrative is accelerating Solana’s on-chain volume. Jito’s infrastructure sits at the base layer of that activity. It is one of the few protocols that benefits mechanically from higher transaction count, regardless of which specific applications are generating volume.

    In a bull scenario, JTO could reach $0.80 to $1.00 within six months if SOL breaks above $120 and JIP-24 passes with strong participation.

    The Bear Case

    The bear case is real and should not be dismissed.

    JTO is still 94.6% below its all-time high. Recovering that kind of drawdown requires a sustained bull market, growing TVL, AND improving fundamentals, all at the same time. That is a lot to ask.

    Token unlock pressure remains a concern. The April 7 unlock of 11.31 million JTO was relatively small at $2.97M. But the total supply is 1 billion JTO, with only 461 million currently circulating. Future unlocks will continue adding sell pressure to the market for months ahead.

    JTO is also tightly correlated to SOL. If Solana faces another network outage, regulatory headwind, or broader market correction, JTO will fall harder than SOL. The leverage cuts both ways.

    Finally, competition in Solana liquid staking is real. Marinade Finance, Sanctum, and other protocols are all competing for the same TVL. Jito’s MEV advantage is genuine, but not permanent if rivals develop comparable infrastructure.

    In a bear scenario, a macro correction sending SOL back toward $50 to $60 could push JTO back to the $0.19 to $0.22 range, retesting February lows.

    Jito (JTO) Price Predictions 2026

    Jito JTO price prediction table showing bear, base, and bull targets for 30 days, 6 months, and 2027-2028

    Our hybrid AI model analyzes technical indicators, on-chain metrics, governance signals, and macro context. Here are the current price targets across three time horizons.

    Short-Term (30 Days)

    The immediate catalyst is the $0.3376 resistance level. A clean break above it, supported by continued whale accumulation and SOL holding above $80, targets $0.38 to $0.46 in the base and bull scenarios. The bear case assumes a macro pullback pushing JTO back to $0.24.

    Medium-Term (6 Months)

    The six-month picture depends heavily on JIP-24 passing and the KODA partnership converting from MoU to live product. If both happen, institutional demand entering through regulated South Korean channels could push JTO toward $0.55 to $0.82. The bear case, where macro conditions deteriorate and SOL falls, targets $0.19.

    Long-Term (2027-2028)

    In the long term, our model assigns a base case of $1.20 for JTO, predicated on Solana maintaining its position as the leading high-throughput blockchain and Jito capturing continued institutional staking flows. The bull case of $2.50 requires a full crypto bull market with institutional ETF exposure to Solana. The bear case of $0.30 assumes Jito loses market share to competitors or Solana faces a structural challenge.

    For context on how Solana ecosystem DeFi tokens tend to behave in recovery cycles, see our Sui (SUI) price prediction for 2026, which covers similar dynamics in a competing Layer 1 ecosystem.

    What to Watch

    Three signals matter most for JTO over the next 90 days.

    SOL price trajectory. If SOL breaks above $100 and holds, it is structurally positive for every Solana DeFi token, especially one capturing MEV at the validator layer.

    JIP-24 governance vote result. A passed vote with strong participation would be a direct fundamental catalyst, creating the first clear cash-flow-to-token-holder mechanism in Jito’s history.

    KODA adoption metrics. Watch for any announcements about JitoSOL product launches in Korea. Institutional TVL growth would show up on DeFiLlama and would be an unusually clean data signal in a space full of noise.

    Final Take

    JTO is a fundamentally credible protocol trading at a significant discount to both its historical peak and its TVL. The $2.92B in assets under management, combined with $15M in potential annual treasury revenue from JIP-24, gives it more economic substance than most governance tokens at this market cap.

    The risks are real: SOL dependency, token unlock overhang, and the sheer scale of the drawdown from ATH. But the combination of institutional catalysts, improving on-chain metrics, and a mechanical MEV revenue story makes JTO one of the more interesting setups in the Solana ecosystem right now.

    This is not a prediction that JTO recovers to $6.00. It is a probability-weighted case that $0.32 is a more attractive entry than it looks, conditional on Solana’s ecosystem continuing to develop.


    Disclaimer: This article is for informational and educational purposes only and should not be construed as financial, investment, or trading advice. Cryptocurrency markets are highly volatile, and past performance does not guarantee future results. The price predictions and analyses presented here are based on AI models, technical indicators, and available data at the time of writing. They are not guarantees. Always conduct your own research (DYOR) and consult with a qualified financial advisor before making any investment decisions. Pump Parade and its authors do not assume liability for financial losses incurred based on information provided in this article.

    About our AI predictions: Pump Parade’s price predictions are generated by machine learning models that analyze technical indicators, on-chain data, and market sentiment. These models have limitations and cannot account for black swan events, regulatory changes, or sudden market shifts. Prediction confidence scores reflect the model’s internal assessment, not guaranteed accuracy. Use AI predictions as one input among many in your research.