

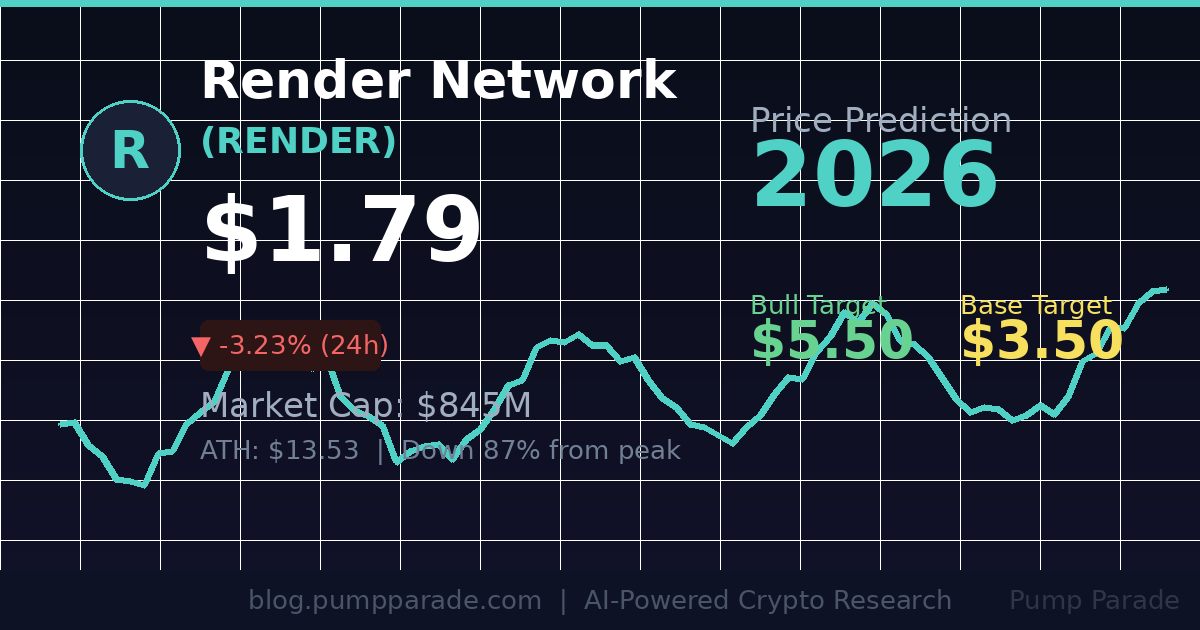
Render (RENDER) is trading at $1.79 as of April 23, 2026. That is down 87% from its all-time high of $13.53. For an AI infrastructure token with a live network processing $210 million in daily GPU workloads, that gap is hard to ignore.
Two weeks ago, RenderCon 2026 wrapped up in Hollywood. The event brought NVIDIA engineers, WME executives, and AI researchers together under one roof. The headline: Render Network just added 60,000 new GPUs through its approved Salad Network subnet. Every one of those jobs settles on-chain in RENDER tokens.
So why is the price still sitting near two-year lows? And can it reach $5 before the year is out? Our AI model has an answer. Here is what the data says.
What Is Render Network?
Render Network is a decentralized GPU rendering platform. It connects creators who need compute power with node operators who have spare GPU capacity. Originally built for 3D artists and film studios, it has pivoted aggressively into AI inference and training workloads.
The network runs on the Solana blockchain. RENDER is the native token used to pay for rendering jobs, reward node operators, and participate in governance. As of today, the circulating supply is 472.6 million RENDER with a market cap of approximately $845 million.
The project has processed over $1 billion in cumulative GPU workloads. It counts NVIDIA, Autodesk, and major Hollywood VFX studios as partners and clients.
Recent Catalysts: Why RENDER Is Worth Watching Now
Three things happened in the last 30 days that changed the RENDER picture.
1. RNP-023 Approved: 60,000 New GPUs Online
The Render community voted to approve governance proposal RNP-023 in late March. This integrates Salad Network as Render’s third official subnet. Salad contributes roughly 60,000 daily active GPUs from idle consumer hardware worldwide. All payments within the subnet settle in RENDER tokens and feed into the network’s burn mechanism. More jobs burned means less circulating supply over time.
2. RenderCon 2026: Hollywood, NVIDIA, and MCP
RenderCon 2026 ran April 16-17 at Nya Studios in Hollywood. The event debuted live Model Context Protocol (MCP) integrations for Blender, OctaneRender, and the Dispersed AI compute subnet. In plain terms: AI agents can now access Render’s decentralized GPU network directly. That opens an entirely new demand channel beyond traditional 3D rendering.
3. Record $210M in 24-Hour Workloads
During RenderCon week, the network processed a record $210 million in compute jobs in a single 24-hour window. Daily active GPU counts are at all-time highs. The network is growing. The token price has not caught up yet.
Technical Analysis: What the Chart Is Telling Us
RENDER is in a long-term downtrend off its $13.53 ATH. However, several signs suggest accumulation at current levels.
Key support levels: $1.75 (recent intraday low, held twice in the past week) and $1.40 (major structural support from Q3 2025).
Key resistance levels: $2.16 is the first hurdle to clear. A close above that opens the path to $2.26, which analysts flagged as a critical retest level. Above $2.26, the next major resistance sits at $3.00.
The RSI (Relative Strength Index) is hovering near 38, approaching oversold territory. That does not guarantee a bounce, but it does suggest sellers are losing momentum. The MACD (a momentum tracker) is flat, with no clear directional signal at this stage.
The 50-day moving average sits at $2.08 and the 200-day at $3.42. RENDER needs to reclaim both to shift the trend. The current setup looks like late-stage consolidation, not breakdown. But macro pressure could change that quickly.
The Bull Case for RENDER in 2026
The bull case rests on three pillars: supply contraction, demand growth, and AI token rotation.
Supply contraction via burns. Every GPU job on the Salad subnet burns RENDER tokens. As the network scales to hundreds of thousands of GPUs, burn pressure accelerates. If annualized job volume doubles from here, the deflationary math starts to look compelling.
AI compute demand is structural. The AI model training and inference market is growing fast. Centralized cloud providers (AWS, Azure, GCP) are capacity-constrained and expensive. Render offers a cost-effective alternative with on-chain settlement. Enterprise clients care about cost, not narrative.
AI token rotation. Capital rotates within the crypto AI sector. When big-cap AI tokens run up, smaller AI infrastructure plays often follow. For more context on how AI infrastructure tokens are trading this cycle, see our Bittensor (TAO) price prediction analysis.
If these catalysts align and broader crypto sentiment stays constructive, RENDER reaching $5 by year-end is plausible. That would represent roughly 2.8x from current levels. Still well below its ATH.
The Bear Case for RENDER in 2026
The risks are real and worth taking seriously.
Macro headwinds. If the broader crypto market enters a risk-off period, AI tokens typically sell off harder than blue chips. RENDER has already fallen 87% from its peak. A return to $1.00 or below is not impossible in a prolonged bear cycle.
Competition is heating up. Akash Network, io.net, and Gensyn are all chasing the same decentralized GPU market. If a well-funded competitor captures enterprise share, Render’s pricing power erodes. The network effect advantage is real but not impenetrable.
Token overhang. With 472 million tokens in circulation and no deflationary mechanism strong enough to absorb potential whale selling, large holders exiting could push the price significantly lower. Token concentration in early-stage AI projects is a known risk.
Execution risk. The MCP integrations debuted at RenderCon as live demos. Turning demos into production-grade infrastructure for AI agents at scale is hard. Delays or technical failures would hit sentiment hard.
AI Price Predictions by Timeframe
Our hybrid AI model incorporates technical indicators, on-chain metrics, network activity data, and broader market sentiment. Here is the output across three timeframes.
Short-Term: Next 30 Days
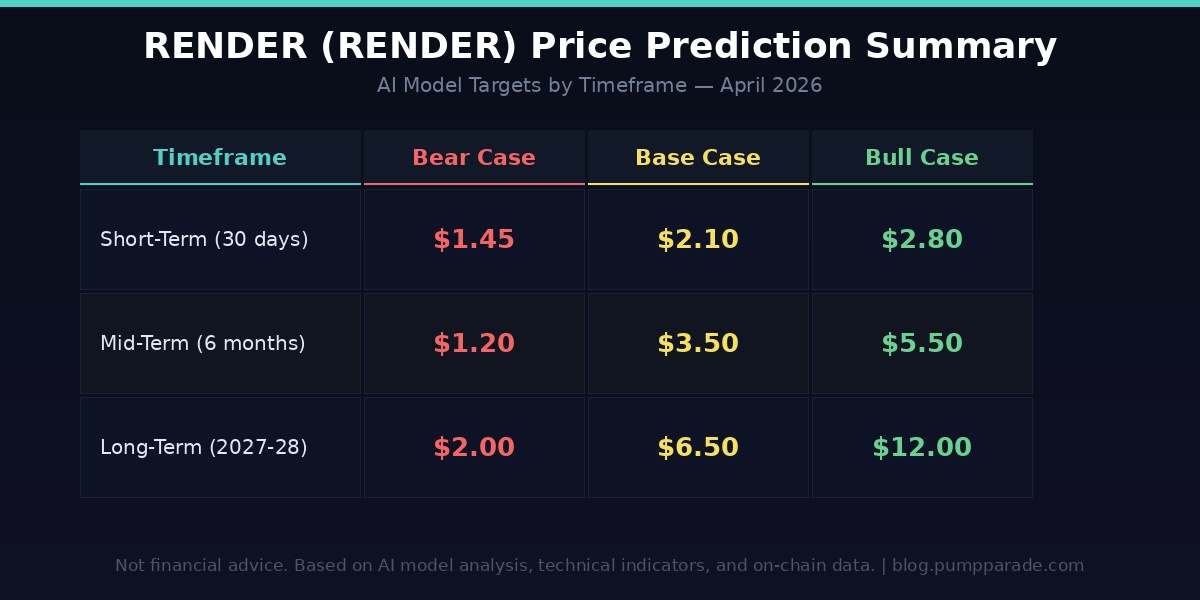
Bear case: $1.45. If macro conditions deteriorate or BTC breaks key support, RENDER could retrace to the $1.40-$1.45 zone. This is the level where strong hands accumulated last cycle.
Base case: $2.10. If the network continues processing record job volumes and the broader market stays neutral, RENDER works its way back toward the 50-day moving average at $2.08-$2.10. A relief rally, not a breakout.
Bull case: $2.80. A broader AI token rotation combined with a RENDER-specific catalyst (such as a major enterprise partnership announcement) could push the price above $2.26 resistance in a fast move toward $2.80.
Mid-Term: 6 Months Out
Bear case: $1.20. A sustained crypto bear market with continued selling pressure and no new catalysts could push RENDER to new cycle lows.
Base case: $3.50. Steady network growth, the ongoing burn from Salad subnet jobs, and improving market sentiment point to a gradual recovery toward the $3.00-$3.50 range by October 2026.
Bull case: $5.50. Our AI model assigns roughly 18% probability to this outcome. It requires strong market conditions, meaningful on-chain revenue growth, and continued institutional interest in decentralized GPU infrastructure.
Long-Term: 2027-2028
Bear case: $2.00. If the AI compute narrative loses steam or Render fails to retain market share, the token stabilizes in the $2.00 range as a niche infrastructure play.
Base case: $6.50. Assuming the decentralized GPU market grows as projected and Render maintains its position as the leading on-chain settlement layer, $6.50 by 2027 represents a realistic recovery toward prior cycle levels.
Bull case: $12.00. If Render captures a meaningful slice of the enterprise AI inference market and the burn mechanism creates genuine supply scarcity, retesting the prior ATH range becomes possible. At $12, the market cap would be approximately $5.7 billion, comparable to mid-tier L1 blockchains today.
What to Watch
- Daily GPU job volume. If active GPUs on the Salad subnet keep growing past the 60,000 baseline, burn pressure increases. Watch the Render Network dashboard for weekly volume reports.
- BTC dominance and macro. AI tokens tend to rally when BTC dominance falls and risk appetite returns. A BTC dominance reading below 55% would be a positive signal for RENDER.
- The $2.16 resistance level. A daily close above $2.16 on meaningful volume would be the first confirmation of a trend reversal. Without that close, the downtrend is still intact.
- Enterprise announcements. RenderCon 2026 highlighted partnerships in discussion. Any confirmed enterprise client for the AI inference pipeline would be a material catalyst.
The Bottom Line
RENDER is an AI infrastructure token with real network activity, a working burn mechanism, and credible partnerships. At $1.79, it trades at a fraction of its prior peak. The bear case is not trivial. Competition is real, macro risk is real, and the road from $1.79 to $5 requires a lot to go right.
But the fundamentals are improving while the price has not yet reflected that. The Salad subnet, the MCP integrations, and the record compute volumes all happened in the last 30 days. The market is still catching up.
Our AI model’s base case for six months out is $3.50, with a bull target of $5.50. Whether it gets there depends heavily on whether the AI narrative stays in focus and whether Render can convert its network growth into token demand at scale.
This is a setup worth monitoring closely, not a trade to rush into.
Disclaimer: This article is for informational and educational purposes only and should not be construed as financial, investment, or trading advice. Cryptocurrency markets are highly volatile, and past performance does not guarantee future results. The price predictions and analyses presented here are based on AI models, technical indicators, and available data at the time of writing. They are not guarantees. Always conduct your own research (DYOR) and consult with a qualified financial advisor before making any investment decisions. Pump Parade and its authors do not assume liability for financial losses incurred based on information provided in this article.
About our AI predictions: Pump Parade’s price predictions are generated by machine learning models that analyze technical indicators, on-chain data, and market sentiment. These models have limitations and cannot account for black swan events, regulatory changes, or sudden market shifts. Use AI predictions as one input among many in your research.
