More
    Home Blog Page 20

    XRP (XRP) Price Prediction 2026: Can It Hit $5?

    0

    XRP is trading at $1.42 today, May 7, 2026. That puts it sitting right on its 200-day moving average, which is the line traders watch most closely to separate bull markets from bear markets. It has held. Barely.

    Here is why that matters right now: today is not a normal Thursday for XRP. GraniteShares is launching its 3x leveraged XRP ETFs on NASDAQ this morning. That makes today the first time U.S. retail traders can get regulated, 3x exposure to XRP through a standard brokerage account. That is a big structural shift. And it arrives while the CLARITY Act, which would formally classify XRP as a digital commodity under federal law, faces its last Senate window before the Memorial Day recess on May 21.

    May is the most catalyst-packed month XRP has seen all year. The question is whether the market actually prices those catalysts in, or whether the current neutral setup holds it range-bound.

    Our hybrid AI model has been running the numbers. Here is what it found.
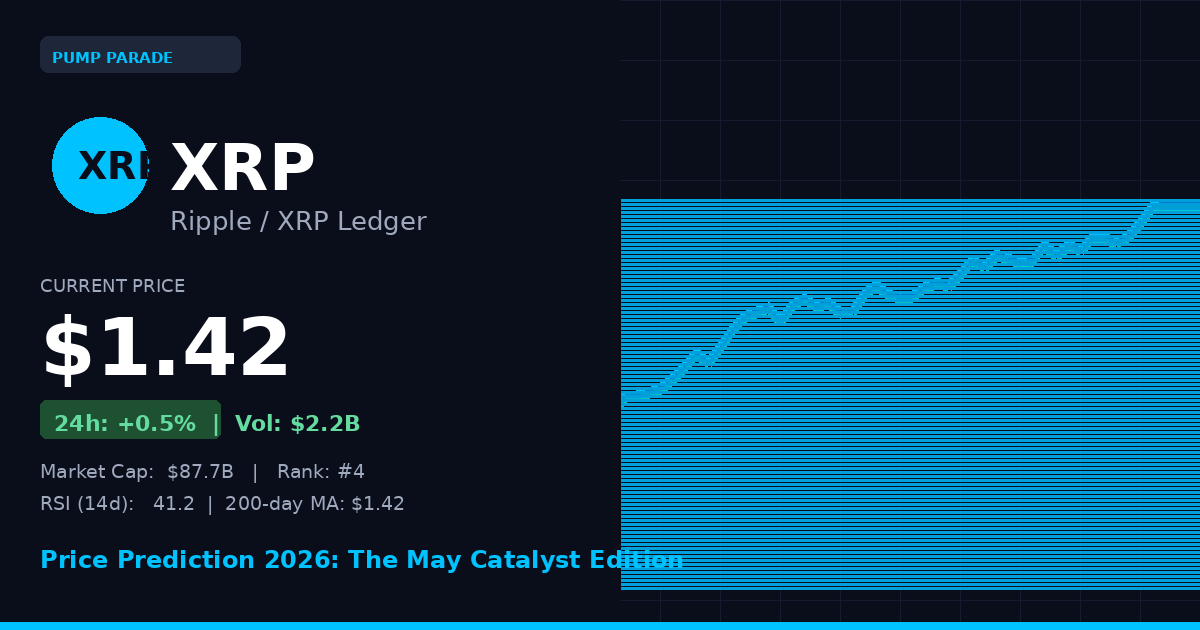
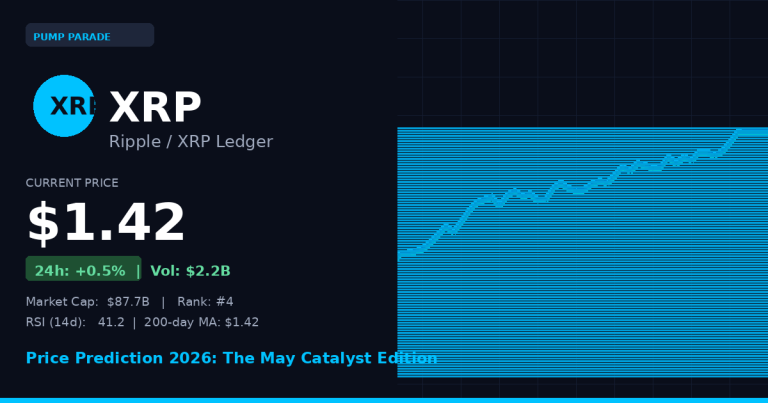
    XRP price prediction 2026 hero image showing current price $1.42 with technical data

    What Is XRP?

    XRP is the native token of the XRP Ledger (XRPL), an open-source blockchain built by Ripple Labs. The network was designed from the ground up for fast, low-cost cross-border payments. A transaction on XRPL settles in 3 to 5 seconds and costs a fraction of a cent.

    Unlike Bitcoin or Ethereum, XRP does not use proof-of-work or proof-of-stake mining. Instead, it uses a federated consensus mechanism. A network of trusted validators agrees on the state of the ledger every few seconds. This makes it energy-efficient and fast, but critics argue it is more centralized.

    Ripple holds a large portion of XRP in escrow and releases it gradually. That has been a source of controversy for years, alongside the multi-year SEC lawsuit that alleged XRP was an unregistered security. That case settled in 2025, clearing the regulatory cloud that had kept U.S. institutions on the sidelines.

    Key metrics as of May 7, 2026:

    • Price: $1.42
    • Market cap: $87.7 billion (ranked #4 globally)
    • 24-hour trading volume: $2.2 billion
    • Circulating supply: approximately 61.8 billion XRP

    Technical Analysis

    The chart tells a story of consolidation after a big run. XRP surged over 400% from its 2025 lows, riding the wave of SEC settlement news and the broader crypto rally. It peaked near $3.40 earlier this year. Since then, it has pulled back and is now compressing near a key technical level.

    Key Support and Resistance

    The 200-day moving average sits at $1.42, essentially where XRP is trading right now. This level is critical. Every time XRP has traded above its 200-day MA in past cycles, extended rallies followed. Every time it lost it, the downtrend lasted months.

    Immediate support sits at $1.35 to $1.38. Below that, the next meaningful floor is around $1.20. On the upside, $1.65 is the first resistance to clear, followed by a cup-and-handle pattern target at $1.80. A break above $2.10 would shift the technical picture meaningfully bullish.

    Momentum Indicators

    The 14-day RSI (Relative Strength Index) reads 41.2. RSI measures momentum on a scale of 0 to 100. Below 30 is oversold, above 70 is overbought. At 41.2, XRP is in neutral territory, leaning slightly bearish. There is no momentum build in either direction right now.

    The MACD (Moving Average Convergence Divergence), which tracks trend direction and strength, is slightly negative. That means short-term momentum still favors sellers over buyers. Volume has been average, which is consistent with a market waiting for a catalyst rather than acting on one.

    The setup is a classic coiled spring. Tight range, neutral indicators, a big catalyst on the calendar. The breakout direction will matter a lot.

    The Bull Case for XRP in 2026

    The bull case here is unusually concrete. It is not built on speculation. It is built on a specific event calendar.

    1. Leveraged ETFs launch today. GraniteShares is listing 3x long and 3x short XRP ETFs on NASDAQ today. This has been delayed five times since April 2. Each delay built more pent-up demand. Once live, these products give retail and institutional traders leveraged XRP exposure without touching a crypto exchange. Historically, new access vehicles drive volume and price discovery upward in the near term.

    2. The CLARITY Act could pass before May 21. The Digital Asset Market Clarity (CLARITY) Act would formally classify XRP as a digital commodity under CFTC jurisdiction. That removes the remaining regulatory uncertainty for U.S. banks and asset managers. If it clears the Senate Banking Committee before the Memorial Day recess, XRP gets its biggest fundamental catalyst of the year. The cup-and-handle technical target of $1.80 becomes a near-term minimum in that scenario.

    3. Ripple Prime is expanding XRP’s utility. Ripple Prime, the company’s institutional payments arm, recently added XRP as accepted collateral. That increases real-world XRP demand from financial counterparties. It is not hype. It is flow.

    4. Spot ETF inflows are building quietly. Spot XRP ETFs recorded $82 million in net inflows during April 2026. That is modest compared to Bitcoin ETF inflows, but the trend is accelerating month over month. Institutional adoption is happening, just slowly.

    If all catalysts land, the bull path puts XRP at $2.10 by early June and $4.00 or higher by the end of 2026.

    The Bear Case for XRP in 2026

    The bear case deserves equal attention. Several risks could keep XRP pinned or push it lower.

    1. The CLARITY Act could stall. If the Senate does not schedule a committee vote before May 21, the bill gets shelved until fall at the earliest. That removes XRP’s biggest regulatory tailwind for the entire year. The market would likely price in that disappointment quickly.

    2. Ripple’s supply overhang is real. Ripple releases 1 billion XRP from escrow each month. While they do not sell all of it, the overhang suppresses price appreciation compared to tokens with fixed supply. Long-term bulls need to model this into any price target.

    3. Bitcoin correlation risk. XRP moves with Bitcoin at roughly 0.75 correlation over 90-day windows. If Bitcoin breaks below the $78,000 support level, XRP will follow lower regardless of its own catalysts. Macro risk is not XRP-specific.

    4. The leveraged ETF launch could produce a sell-the-news reaction. Markets often front-run anticipated catalysts, then sell when the event arrives. If today’s ETF launch was already priced in, the price could fade rather than rally.

    The bear scenario puts XRP back at $1.20 or lower if the CLARITY Act fails and Bitcoin weakens into summer. At $1.10, XRP would be testing multi-month lows and the bullish thesis would need rebuilding.

    For broader context on how regulatory clarity is reshaping the entire payments token landscape, our stablecoin analysis covers the policy battle playing out across digital dollar infrastructure.

    XRP Price Predictions by Timeframe

    Our hybrid AI model analyzes RSI, MACD, on-chain flows, sentiment data, and the catalyst calendar to generate price probability ranges. Here are the outputs for XRP as of May 7, 2026.
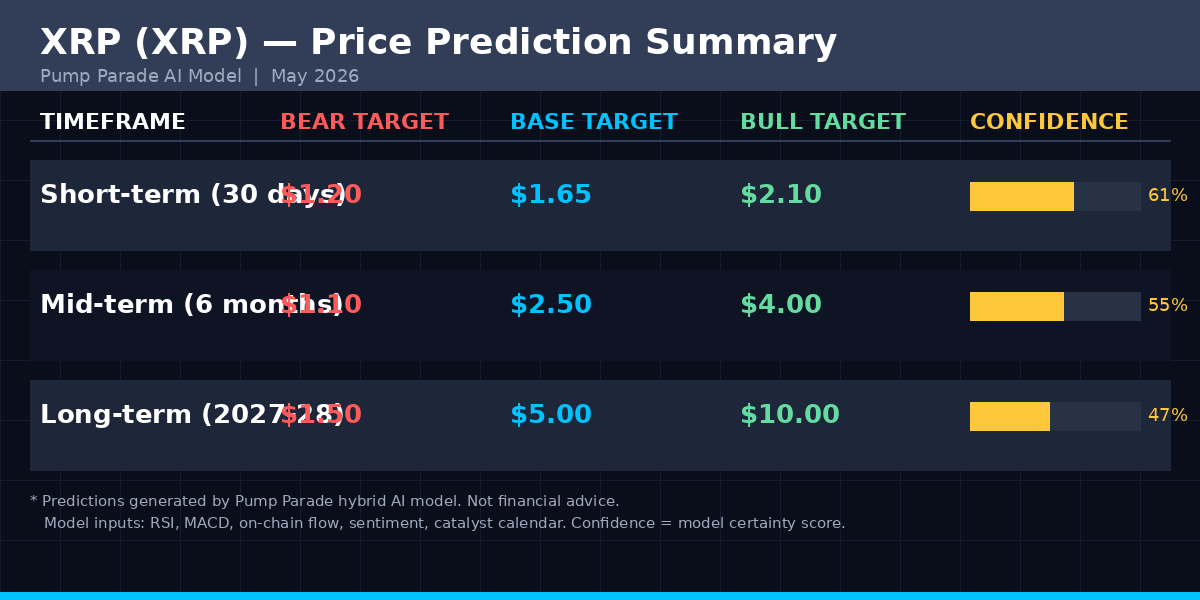
    XRP price prediction table 2026 showing bear base and bull targets across short, mid, and long-term timeframes

    Short-Term (30 Days, June 2026)

    The model assigns a 61% confidence score to the base case. The key binary event is the CLARITY Act vote window closing on May 21. If the bill advances, the base target is $1.65, with a bull path to $2.10. If the bill stalls, the bear scenario targets $1.20.

    Mid-Term (6 Months, November 2026)

    The six-month window captures the full regulatory resolution cycle and Q3 Bitcoin seasonality. The base case puts XRP at $2.50 by late 2026, assuming regulatory clarity and continued ETF inflows. The bull case reaches $4.00 if institutional adoption accelerates. The bear scenario, which assumes stalled legislation and a broader crypto correction, targets $1.10. Model confidence: 55%.

    Long-Term (2027 to 2028)

    Over a two-year horizon, the model’s confidence score drops to 47%. Long time horizons in crypto introduce too many variables for high certainty. The base case puts XRP at $5.00 by end of 2027, driven by global payment network expansion and deeper institutional integration. The bull case reaches $10.00 if XRP captures meaningful market share in bank-to-bank settlement. The bear case, which assumes regulatory backlash or Ripple supply pressure dominates, puts XRP back near $1.50.

    For reference, XRP’s all-time high was $3.84, set in January 2018. A move to $5.00 would be new all-time high territory. That requires sustained institutional demand, not just retail momentum. The data suggests the infrastructure for that demand is being built right now. Whether it arrives on schedule is the central uncertainty.

    What to Watch This Month

    These are the specific triggers to monitor in May 2026:

    • May 7: GraniteShares 3x XRP ETF goes live on NASDAQ. Watch volume and price reaction in the first 48 hours.
    • May 15: Jerome Powell exits as Fed Chair. A more crypto-friendly successor could boost all risk assets, XRP included.
    • May 21: CLARITY Act Senate deadline. A calendar date from Scott signals the bill is advancing. No date means it is shelved.
    • $1.35 support: If XRP loses this level on daily close, risk increases significantly. Watch for volume spike on any break.
    • $1.80 resistance: A clean close above $1.80 on high volume would confirm the cup-and-handle breakout and open the path toward $2.10.

    The data from CoinGecko’s XRP market page is worth bookmarking for live price, volume, and market cap tracking as these events unfold.


    Disclaimer: This article is for informational and educational purposes only and should not be construed as financial, investment, or trading advice. Cryptocurrency markets are highly volatile, and past performance does not guarantee future results. The price predictions and analyses presented here are based on AI models, technical indicators, and available data at the time of writing. They are not guarantees. Always conduct your own research and consult with a qualified financial advisor before making any investment decisions. Pump Parade and its authors do not assume liability for financial losses incurred based on information provided in this article.

    About our AI predictions: Pump Parade’s price predictions are generated by machine learning models that analyze technical indicators, on-chain data, and market sentiment. These models have limitations and cannot account for black swan events, regulatory changes, or sudden market shifts. Prediction confidence scores reflect the model’s internal assessment, not guaranteed accuracy.


    Marinade vs Jito: Best Solana Liquid Staking 2026

    0

    If you are holding SOL and not staking it, you are leaving roughly 5 to 6% in annualized rewards on the table every year. Native staking is great, but it locks your SOL for an unstaking epoch and gives you nothing to do with it in DeFi. That is why liquid staking has eaten the majority of staked SOL on the network, and two protocols dominate the conversation: Jito and Marinade.

    The two are not the same product. Jito is the largest Solana liquid staking token by a wide margin, with deep MEV-tip pass-through and a polished governance market in JTO. Marinade is the original liquid staking protocol on Solana, with a longer audit history, three live staking products and a validator marketplace that delegators can shape directly. So which one should you actually park your SOL in for 2026?

    This review compares them across TVL, APY, fees, security, validator policy, MEV, governance, DeFi integrations and user experience, with live data from DeFiLlama, CoinGecko and the protocols themselves.

    Quick Verdict (TL;DR)

    • Want the highest passive APY with minimal thinking? Use JitoSOL. As of May 2026 it is paying around 5.76% APY, mostly because MEV tips are baked into the price of the token rather than skimmed off the top.
    • Want full control over which validators secure your stake, plus the deepest audit trail? Use Marinade. mSOL pays around 5.16% APY and Marinade Native gives you direct delegation with no smart contract risk at all.
    • Holding SOL on a hardware wallet and not touching DeFi? Marinade Native is the cleanest answer. JitoSOL only makes sense if you plan to use it as collateral somewhere.
    • Liquidity matters more than yield? JitoSOL wins, with roughly 3x the on-chain TVL and broader integrations across Kamino, Drift, Orca and Jupiter routes.

    Both protocols are battle-tested. There is no obvious wrong answer here; it really comes down to what you optimize for.

    Marinade vs Jito Solana liquid staking comparison hero image

    Marinade mSOL token logoJitoSOL liquid staking token logo

    Marinade and Jito: Two Different Schools of Liquid Staking

    Both protocols solve the same core problem: SOL holders want staking rewards without locking up their assets. You deposit SOL, you receive a liquid receipt token (mSOL or JitoSOL), and that token automatically appreciates against SOL as staking rewards accrue. You can sell, swap, lend or use it as collateral at any time.

    Where they differ is in how the protocol allocates your SOL across validators and what it does with the extra revenue.

    Marinade: validator marketplace and three staking flavors

    Marinade launched in 2021 as the first liquid staking protocol on Solana. Today it actually offers three products under one roof:

    • Marinade Liquid Staking (mSOL): deposit SOL, receive mSOL, the receipt token used across Solana DeFi.
    • Marinade Native: stake SOL directly to a basket of validators selected by Marinade’s algorithm. No smart contract is involved, so the surface area for protocol risk is essentially zero.
    • Marinade Select: an institutional-grade product that lets large depositors curate their own delegation strategy with custom validator sets.

    Combined Marinade TVL across these three products sits around $588M as of May 2026, with about $274M in mSOL alone. The defining feature is the Stake Auction Marketplace: validators bid for delegations, MNDE governance shapes the rules, and the algorithm rebalances stake based on commission, performance and decentralization scores. That makes Marinade the most “Solana-decentralization-friendly” choice on the market.

    Jito: MEV-enhanced staking with the largest TVL

    Jito takes a different approach. It runs a modified Solana validator client that captures MEV (maximum extractable value) from off-chain auctions and routes those tips back to JitoSOL holders. JitoSOL launched in late 2022 and has grown into the largest liquid staking token on Solana, with around $846M TVL in the LST product itself and another $17M in the newer Jito Restaking product (per DeFiLlama).

    The Jito Network also operates a parallel governance and revenue-share economy through the JTO token, which has a market cap of roughly $179M today. Jito’s pitch is simple: by staking through JitoSOL, you do not just earn vanilla staking rewards, you also collect a share of MEV that other validators are quietly capturing for themselves anyway.

    Marinade Finance Solana staking open graph banner

    TVL and Adoption: Jito Has Pulled Ahead

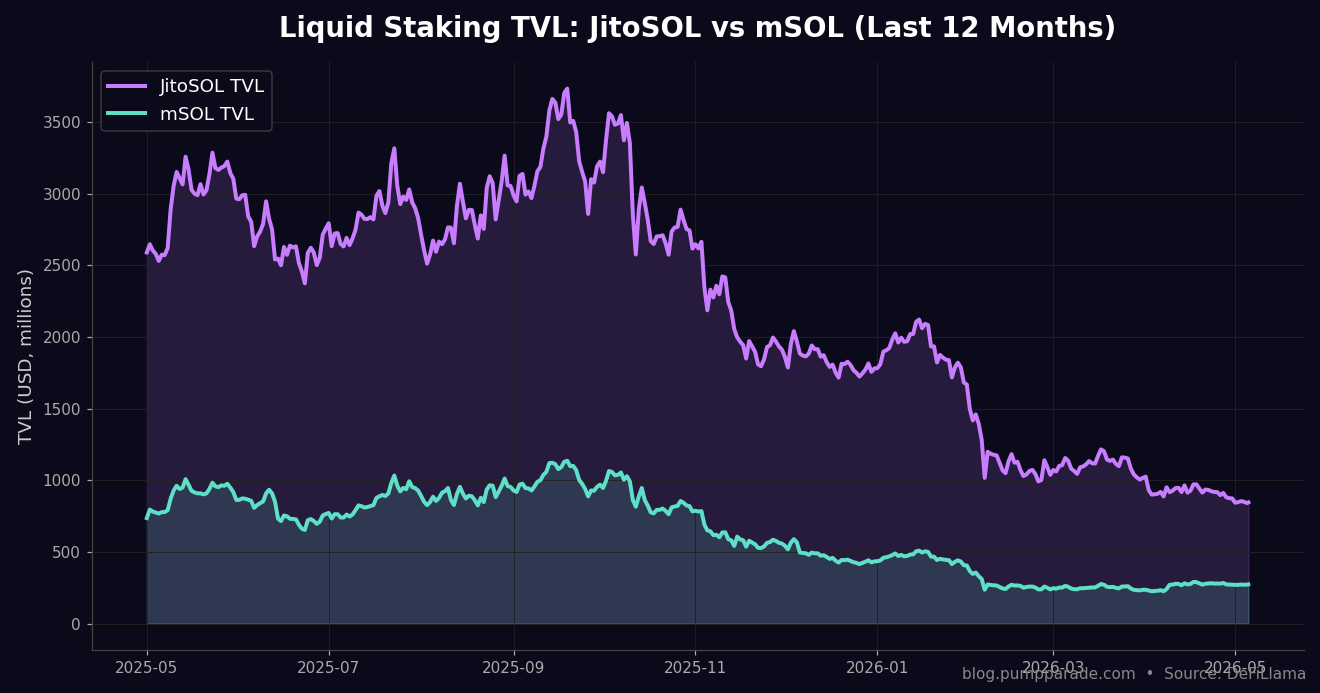
    Twelve months ago, Marinade and Jito were closer competitors on TVL. Today, Jito is clearly in the lead:

    • Jito Liquid Staking TVL: ~$846M
    • Marinade Liquid Staking TVL: ~$274M
    • Marinade Native TVL: ~$238M
    • Marinade Select TVL: ~$76M

    The chart below tracks the last twelve months of liquid staking TVL for both protocols. Note that both have come down meaningfully from their late-2025 highs, which reflects SOL’s price action more than any flight from the protocols. The relative gap, however, has widened in Jito’s favor.

    JitoSOL vs mSOL TVL chart over last 12 months from DeFiLlama

    Jito’s TVL lead matters for two practical reasons. First, JitoSOL has more liquidity in DEX routes, so you can size in and out of larger positions with less slippage. Second, more lending markets accept JitoSOL as collateral with higher loan-to-value ratios, simply because the underlying market is deeper.

    APY and Fee Breakdown

    This is where Jito’s MEV pitch shows up in the numbers.

    Protocol Live APY (May 2026) Headline Fee MEV Included?
    Jito (JitoSOL) 5.76% ~4% of staking rewards (validator commission averaged across the Jito set) Yes, MEV tips routed to stakers via the price of JitoSOL
    Marinade Liquid (mSOL) 5.16% ~6% of staking rewards (split between validator commission and a small protocol fee) Limited; some Marinade validators run Jito-Solana client, but it is not a uniform pass-through
    Marinade Native ~6.0% gross before validator commission 0% protocol fee, validator commission only Depends on validator

    A 60 basis point gap between JitoSOL and mSOL might not sound like much, but on $100,000 of staked SOL it is roughly $600 per year, every year. Compounded over multiple years, that is real money. The catch is that Jito’s APY is more variable than Marinade’s because MEV revenue oscillates with on-chain activity. In a quiet market, JitoSOL can underperform; in heavy trading weeks, it can pull ahead by 100 to 150 bps.

    If you want the simplest fee story, Marinade Native wins outright: there is no protocol fee at all, only the validator commission, because there is no smart contract sitting between you and the validator.

    Security & Audits

    Both protocols have a long uptime track record on Solana mainnet, no known exploits, and reputable auditors. Marinade has a slight edge on audit depth and history.

    • Marinade audits: Neodyme, Ackee Blockchain and Kudelski Security. Reports are linked publicly from the marinade.finance site.
    • Jito audits: based on the Solana SPL stake-pool program (which itself has a long audit history) plus a Neodyme review of the Jito-specific MEV extraction layer.

    Marinade Native sidesteps the question entirely because no custom smart contract is involved. Your stake account is created directly with the chosen validator, identical in architecture to staking through a wallet. This is the lowest-risk option in the entire comparison.

    JitoSOL relies on the SPL stake pool program plus Jito’s own MEV plumbing. The MEV layer is well audited, but it is more code surface than vanilla SPL pools, which is something to be aware of. Neither protocol has been hacked or paused since launch.

    Validator Selection & Decentralization

    This is the most ideologically loaded part of the comparison.

    Marinade’s stake auction marketplace

    Marinade runs a continuous auction in which validators submit bids and the protocol allocates stake based on a transparent formula that includes commission, vote performance, geographic distribution, and what the validator pays back into the marketplace. MNDE governance can adjust the weights. The result is one of the more egalitarian stake distributions on Solana, and a meaningful chunk of stake flows to small and mid-sized validators who would otherwise struggle to get delegations.

    Jito’s curated validator set

    Jito takes a more centralized approach to validator selection. To be in the JitoSOL stake pool, validators must run the Jito-Solana client and meet performance thresholds. The set is curated rather than auctioned. This produces consistently high MEV capture, but it also concentrates stake among a smaller number of professional operators. Whether you see this as a feature or a tradeoff depends on what you care about.

    For solo home stakers and decentralization purists, Marinade is the friendlier home. For yield maximalists who want every basis point of MEV, Jito is the cleaner answer.

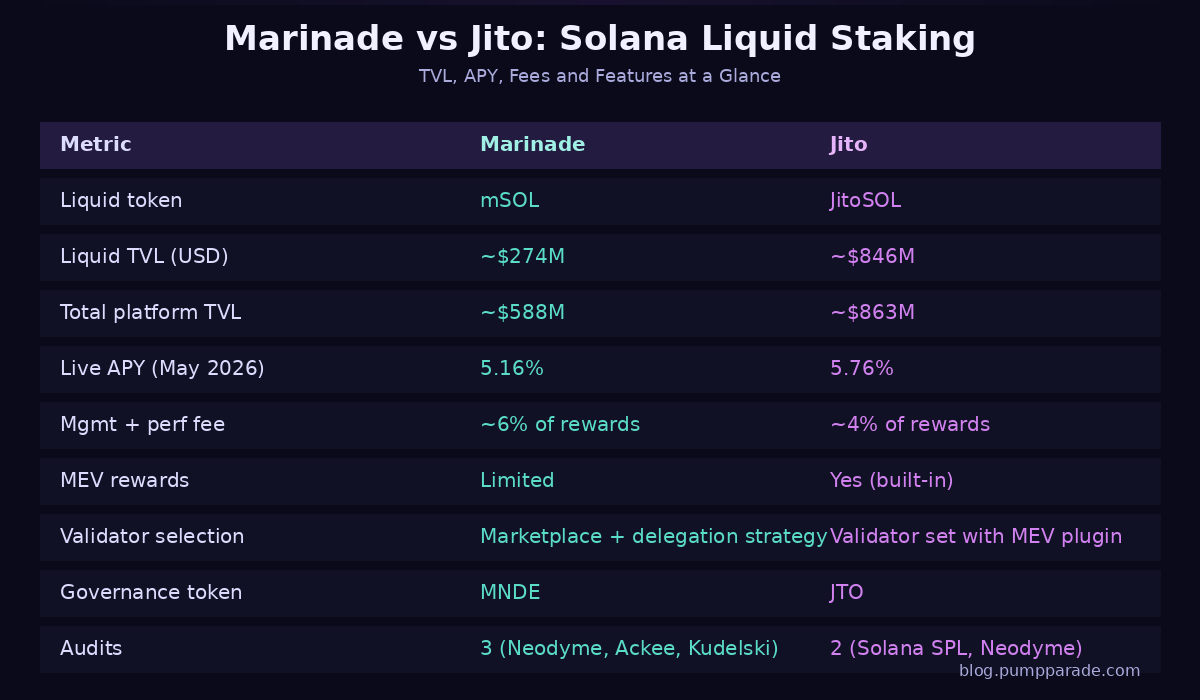
    Side-by-Side Feature Comparison

    Marinade vs Jito Solana liquid staking comparison table TVL APY fees

    DeFi Integrations and Liquidity

    One of the only reasons to hold a liquid staking token rather than stake natively is that you can do something with it. Both tokens are widely supported, but the depth differs.

    • JitoSOL: deeply integrated as collateral on Kamino (see our Kamino Finance review) and marginfi, primary base asset on Drift’s perp markets, listed on every major Solana DEX with multi-million-dollar Jupiter routes, and accepted by a long list of yield aggregators. JitoSOL/SOL spot pairs on Orca and Raydium are some of the deepest LST pools on the network.
    • mSOL: also supported on Kamino, Drift, marginfi and Jupiter, but with thinner liquidity. mSOL/SOL pools exist but tend to have higher slippage on size. mSOL is still a perfectly fine collateral asset; it just is not the default that JitoSOL has become.

    For DeFi power users, JitoSOL is the more practical token to hold because every protocol you are likely to touch already supports it natively. For a long-only HODLer, the difference is mostly invisible.

    User Experience

    Both web apps are clean, fast, and straightforward to use.

    The Marinade staking dashboard walks you through choosing between Native and Liquid in plain language. You connect a wallet, pick an amount, and confirm one transaction. Withdrawals from Marinade Liquid are instant via the on-chain liquidity pool (with a small fee) or epoch-based for free. Marinade Native unstakes follow standard Solana epoch timing.

    The Jito staking page is essentially a one-click flow: connect wallet, deposit SOL, mint JitoSOL. Unstaking back to SOL goes through the standard SPL stake pool unstake flow, which takes one to two epochs (roughly two to four days). For instant exits, you swap JitoSOL to SOL on a DEX at whatever the current peg is, which is usually within a few basis points of fair value.

    Mobile support on both is good through wallet apps like Phantom, Backpack and Solflare. Neither has a dedicated native mobile app, but they both render cleanly in the in-wallet browser.

    Pros and Cons

    Jito Pros

    • Highest live APY in the comparison thanks to MEV pass-through
    • Largest TVL and deepest DEX liquidity
    • Default LST collateral on Kamino, Drift and other Solana money markets
    • Strong JTO governance economy and revenue share

    Jito Cons

    • More centralized validator set
    • APY is more volatile because MEV revenue varies week to week
    • Slightly more code surface than vanilla SPL stake pools

    Marinade Pros

    • Three flavors (Liquid, Native, Select) to fit different risk profiles
    • Marinade Native has zero smart contract risk
    • Most decentralization-friendly validator marketplace on Solana
    • Longer audit history with three independent firms

    Marinade Cons

    • Lower APY than Jito by roughly 50 to 60 bps
    • Thinner mSOL liquidity in DEX pools
    • MNDE governance token has weaker valuation and lower trading volume than JTO

    Verdicts by Use Case

    Best for passive yield only: JitoSOL. Higher APY, less to think about, set and forget.

    Best for hardware wallet HODLers: Marinade Native. No smart contract sits between you and your validator, and the APY is competitive with mSOL.

    Best for active DeFi users: JitoSOL. It is supported as collateral or yield primitive everywhere you want to deploy.

    Best for decentralization advocates: Marinade. The auction-driven validator marketplace pushes stake toward smaller operators in a way Jito’s curated set does not.

    Best for institutions and treasuries: Marinade Select. Custom validator sets, no protocol fee on Native, and direct delegation control. Jito Restaking is also a credible option for treasuries that want extra yield from securing partner protocols, though it is newer and a separate product.

    Looking for a deeper Solana staking strategy? See our Jupiter Exchange review for the cleanest way to swap between LSTs, and our Raydium vs Orca breakdown for where mSOL/SOL and JitoSOL/SOL liquidity actually lives.

    FAQ

    Is JitoSOL safer than mSOL? Both are safe in the sense that neither has been hacked. Marinade has a longer and more diverse audit trail across three firms; Jito has fewer audits but a clean track record and a simpler core stake-pool architecture. Marinade Native is the lowest-risk option of all because it does not use a smart contract.

    Can I use JitoSOL or mSOL as collateral? Yes. Both are accepted on Kamino, Drift and marginfi. JitoSOL typically has higher LTV ratios and deeper available borrow liquidity.

    Will I lose value when I unstake? Not in normal market conditions. The price of JitoSOL and mSOL versus SOL trends upward as rewards accrue, and any short-term peg deviation on a DEX is usually a few basis points at most. The instant-unstake liquidity pool on Marinade does charge a small fee for immediate exits.

    What about MEV centralization concerns? Jito’s MEV auction is more transparent than the alternative of validators capturing MEV privately. Critics argue that it concentrates power in the Jito-Solana client; supporters argue that it democratizes MEV by routing it back to stakers. Both views have merit.

    Can I hold both? Absolutely. Many Solana users split between JitoSOL for DeFi collateral and Marinade Native for cold-stored SOL that they do not plan to touch. There is no rule that says you have to pick one.

    Final Take

    If you want the highest yield with the deepest DeFi integration, Jito is the obvious answer in 2026, and the TVL gap is not closing any time soon. If you care about decentralization, audit depth, or want true zero-smart-contract-risk staking, Marinade, especially Marinade Native, is the protocol that better aligns with those priorities.

    Either way, the worst option is leaving your SOL idle.

    This article is for educational purposes only and is not investment advice. Always do your own research before staking or interacting with any DeFi protocol.

    Bonk (BONK) Price Prediction 2026: Burn Catalyst Ahead

    Bonk BONK price prediction 2026 hero graphic showing current price and market data

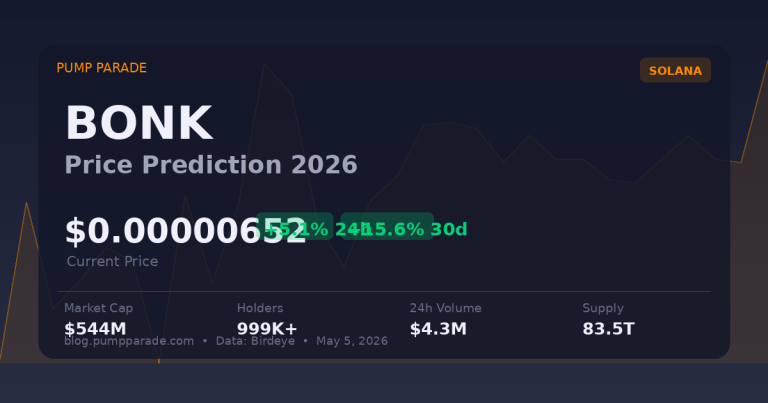
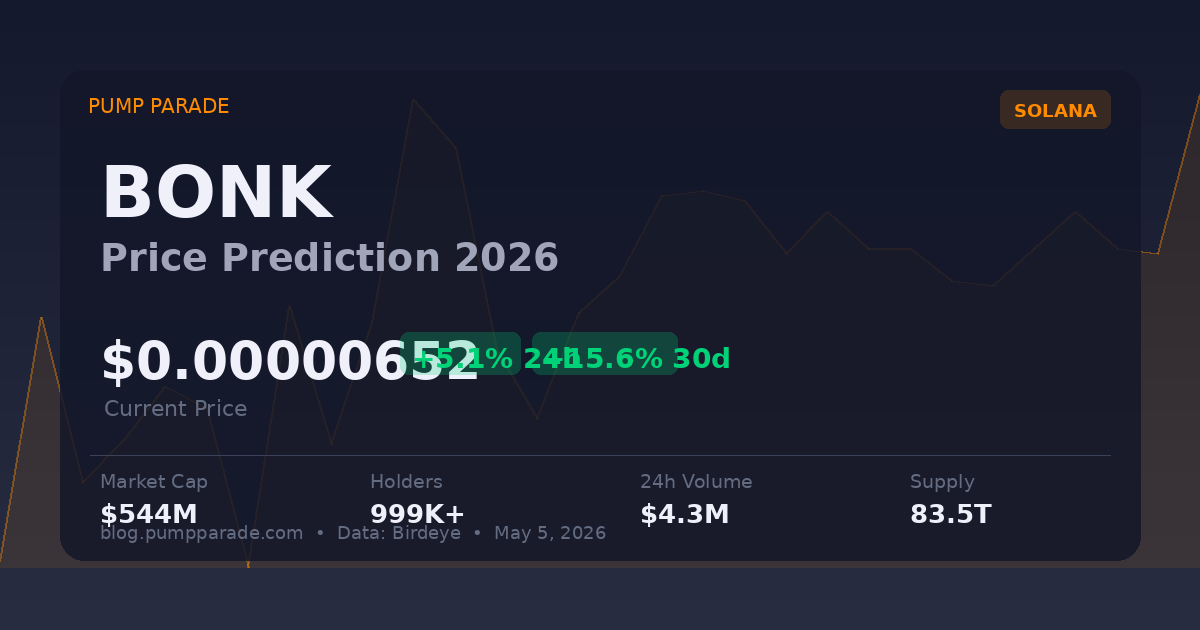
    Bonk (BONK) is trading at $0.00000652 as of May 5, 2026. That is a 5.1% gain in the past 24 hours and a 15.6% rise over the last 30 days. More striking: on-chain data shows a 105% spike in 24-hour trading volume and a 96% surge in unique wallets over the last eight hours.

    The reason traders are paying attention right now is simple. BONK is sitting at 999,429 holders. When that number hits one million, a community-driven smart contract will automatically burn one trillion BONK tokens. At the current pace, that milestone is days away.

    This article breaks down what the data says, what could push BONK higher, what could drag it lower, and where our AI model puts the price targets across three timeframes.

    What Is Bonk?

    Bonk is the original community memecoin on Solana. It launched in December 2022 as a direct-distribution token, airdropped to Solana NFT holders and developers at a time when the ecosystem was reeling from the FTX collapse. That origin story gave it real grassroots credibility.

    Today, BONK has grown well beyond a simple memecoin. Its market cap sits at roughly $544 million. The project powers a trading terminal called BONKtrade, a token launchpad called LetsBONK.fun, and a growing ecosystem of BONK-paired DeFi products. With 999,429 holders and a circulating supply of 83.5 trillion tokens, it is one of the most widely distributed assets on Solana.

    If you are researching how to find and evaluate Solana memecoins before they move, our guide on Solana Memecoins: How to Find Massive Crypto Moonshots walks through the full framework.

    Current Price and Market Context

    BONK hit a 30-day high of $0.00000675 on April 17 before pulling back into a tight consolidation range between $0.0000061 and $0.0000064. Over the past week, price has been grinding higher with each successive low slightly above the last.

    Key levels to watch:

    • Support 1: $0.0000062 (recent consolidation base)
    • Support 2: $0.0000056 (30-day low, strong demand zone)
    • Resistance 1: $0.0000068 (30-day high from April 17)
    • Resistance 2: $0.0000100 (psychological round number)

    Trading volume on Solana reached $4.3 million in the last 24 hours, according to Birdeye on-chain data. That is a 105% increase from the previous period. Unique wallets trading BONK jumped 96% in just eight hours. That kind of wallet activity does not happen on its own. Something is driving fresh participation.

    Key Catalysts in 2026

    The 1 Million Holder Burn

    This is the single most important near-term catalyst. The BONK community set a milestone: when the holder count reaches one million, one trillion BONK tokens will be automatically burned. At 999,429 holders today, the trigger is imminent.

    One trillion BONK represents roughly 1.3% of the circulating supply. That is a meaningful supply reduction. Past token burn events in crypto have historically preceded short-term price spikes. The market often prices in the anticipation before the burn, then consolidates afterward. Both phases can see elevated volatility.

    LetsBONK.fun Surpasses Pump.fun

    BONK’s official token launchpad, LetsBONK.fun, recently overtook Pump.fun in daily trading volume, recording a 126% volume increase in a single session. This matters because 50% of all LetsBONK.fun revenue goes directly to buying and burning BONK tokens. Every new memecoin launched on that platform creates organic buy pressure on BONK. The launchpad is now a structural demand driver, not just a narrative.

    Leveraged ETF Filing by Tuttle Capital

    Tuttle Capital Management has filed with the SEC for leveraged ETF products tied to BONK. This follows a broader trend of traditional finance wrapping speculative crypto assets into regulated vehicles. A leveraged BONK ETF would bring the token to a new class of retail and institutional investors who cannot or will not hold spot crypto. Approval is not guaranteed. But the filing alone signals that BONK has crossed a threshold of market legitimacy that most memecoins never reach.

    BONKtrade Ecosystem Expansion

    BONKtrade, the project’s on-chain trading terminal, has expanded into gold trading paired with BONK. This is part of a broader effort to move BONK from a pure memecoin to a utility-backed asset with genuine ecosystem demand. More paired products mean more reasons to hold BONK, which reduces sell pressure over time.

    Technical Analysis

    The 30-day price chart shows a clear higher-low structure. BONK bottomed at $0.0000056 in early April and has been making higher lows since then. That pattern is the foundation of an uptrend.

    The RSI (Relative Strength Index, a momentum indicator that runs from 0 to 100) is sitting in the mid-50s. That means momentum is building but the token is not yet in overbought territory. There is room to run before a natural cooldown.

    The key breakout level is $0.0000068. A daily close above that would clear the April high and open the path toward $0.0000100. A failure there would likely result in a retest of the $0.0000062 support zone.

    Volume trend is the strongest technical signal right now. The 105% volume surge on increasing price suggests buyers are in control, not sellers liquidating.

    Bull Case

    The bull case rests on three things converging: the 1M holder burn triggers, LetsBONK.fun volume continues growing, and broader Solana memecoin season resumes.

    If the burn milestone hits in the next few days and drives a wave of media coverage, BONK could break above $0.0000068 and push toward its ATH range near $0.0000460. In a strong altcoin market, Solana memecoins have historically seen 5x to 10x moves during high-momentum periods. BONK has the liquidity, the community, and the utility infrastructure to be the primary beneficiary of that cycle.

    The ETF filing adds a longer-term upside lever. If Tuttle Capital’s leveraged BONK ETF receives SEC approval in late 2026 or 2027, the demand shock would likely be significant.

    Bear Case

    The bear case is also real, and serious traders should not ignore it.

    First, BONK is still a memecoin. Its price correlates heavily with market sentiment. If Bitcoin retraces sharply from the $80K-$85K range it is currently testing, Solana ecosystem tokens typically fall harder and faster than large caps. BONK could quickly give back its gains and revisit the $0.0000056 support or lower.

    Second, the burn milestone is already partially priced in. Markets often buy the rumor and sell the news. If the 1M holder burn happens and fails to produce a sustained rally, profit-taking could bring the price back to consolidation levels.

    Third, token launchpad competition is intensifying. If Pump.fun reclaims volume leadership from LetsBONK.fun, the structural buy pressure on BONK weakens. Any disruption to the 50%-revenue-to-burn mechanism would reduce organic demand.

    AI Price Prediction Summary

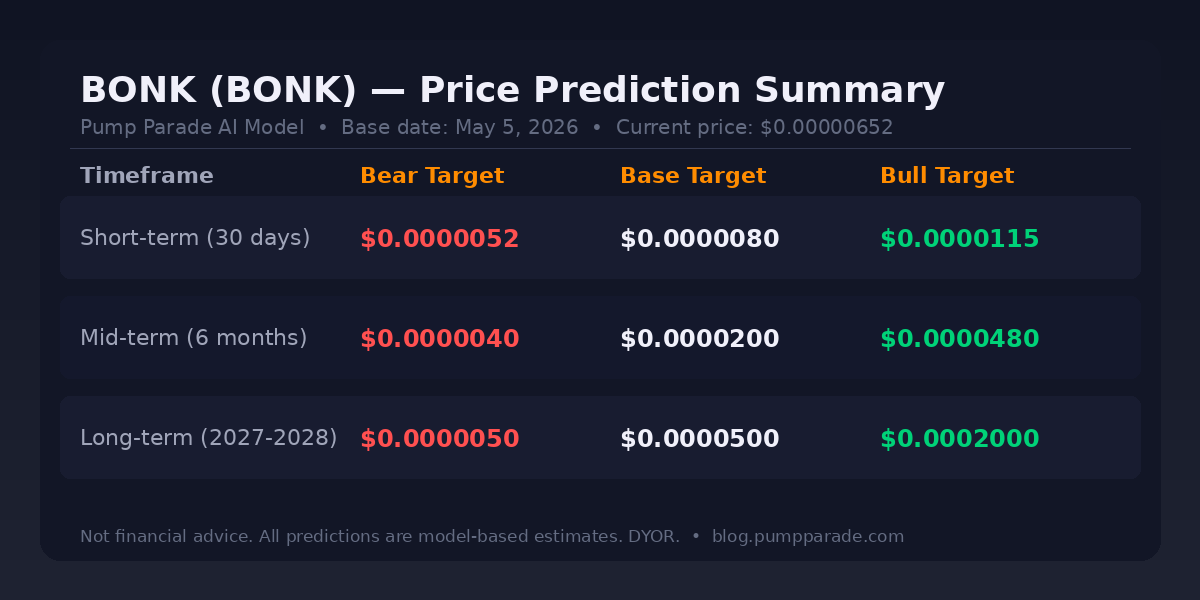
    Our hybrid AI model combines technical indicators, on-chain wallet data, volume trend analysis, and market sentiment signals. Here are the price targets for three timeframes, each with bear, base, and bull scenarios.

    Bonk BONK price prediction table 2026 showing bear base and bull targets across three timeframes

    Short-Term (30 Days)

    Bear: $0.0000052 (-20%). A broader market pullback or post-burn sell-off could push price back to the April low range.

    Base: $0.0000080 (+23%). The burn milestone triggers a moderate rally. Price consolidates above the April high.

    Bull: $0.0000115 (+76%). Burn catalyst plus ETF headlines drive a momentum breakout toward the next psychological resistance.

    Mid-Term (6 Months, November 2026)

    Bear: $0.0000040 (-39%). Altcoin cycle does not materialize. LetsBONK.fun loses volume to competitors. BONK drifts lower.

    Base: $0.0000200 (+207%). Solana memecoin season resumes. BONK ecosystem volume grows. Price approaches the mid-range of the 2024-2025 cycle.

    Bull: $0.0000480 (+636%). ETF approval or strong altcoin cycle pushes BONK to prior ATH territory. Maximum scenario assumes sustained institutional inflow.

    Long-Term (2027-2028)

    Bear: $0.0000050 (-23%). Memecoin category loses relevance in a utility-focused market. BONK settles below current levels.

    Base: $0.0000500 (+667%). BONK cements itself as the dominant Solana cultural asset. Ecosystem utility drives sustained demand.

    Bull: $0.0002000 (+2,967%). New crypto supercycle with major ETF inflows, sustained LetsBONK.fun dominance, and broad Solana adoption. Speculative scenario.

    What to Watch

    The single most important event to monitor is the 1 million holder count. Track it in real time on Birdeye or Bonkcoin.com. When it hits, expect volatility in both directions.

    Beyond that, watch LetsBONK.fun daily volume relative to Pump.fun. If LetsBONK.fun maintains or grows its lead, the structural buy pressure on BONK stays intact.

    For the ETF angle, follow SEC filings for Tuttle Capital’s BONK-related products. Any movement toward approval would be a significant price catalyst.

    Finally, keep an eye on SOL’s price action. BONK and SOL are tightly correlated. A SOL breakout above $90 tends to pull the entire Solana ecosystem higher, with memecoins typically leading the move.

    Conclusion

    BONK is not a random pump. The data behind this move is real: a massive volume surge, accelerating wallet growth, and a community-driven burn event that is days away from triggering. The structural demand through LetsBONK.fun is a genuine utility development that most memecoins never build.

    That said, the risks are real too. This is a memecoin in a volatile market. The burn could be priced in. The broader market could roll over. Position sizing matters more than token selection.

    If the 1M milestone triggers as expected, BONK becomes one of the more interesting setups in the Solana ecosystem for the near term. The base case of $0.0000080 by June looks achievable. The path to the ATH range near $0.000046 is longer but not unreasonable in a strong cycle.

    Watch the levels. Watch the holder count. And as always, size accordingly.


    Disclaimer: This article is for informational and educational purposes only and should not be construed as financial, investment, or trading advice. Cryptocurrency markets are highly volatile, and past performance does not guarantee future results. The price predictions and analyses presented here are based on AI models, technical indicators, and available data at the time of writing. They are not guarantees. Always conduct your own research (DYOR) and consult with a qualified financial advisor before making any investment decisions. Pump Parade and its authors do not assume liability for financial losses incurred based on information provided in this article.

    About our AI predictions: Pump Parade’s price predictions are generated by machine learning models that analyze technical indicators, on-chain data, and market sentiment. These models have limitations and cannot account for black swan events, regulatory changes, or sudden market shifts. Prediction confidence scores reflect the model’s internal assessment, not guaranteed accuracy.

    Pepe (PEPE) Price Prediction 2026

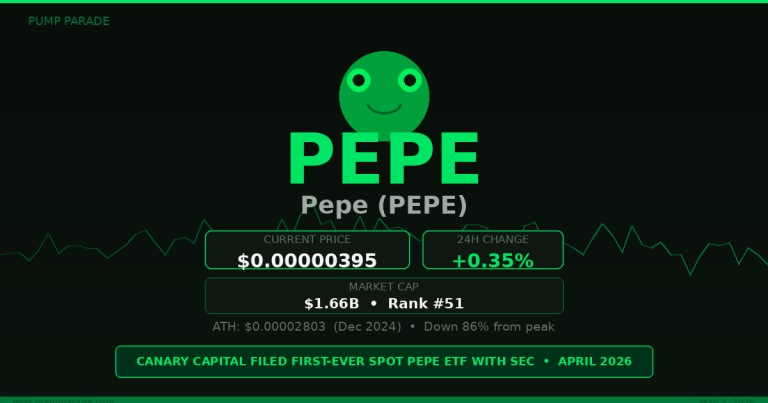
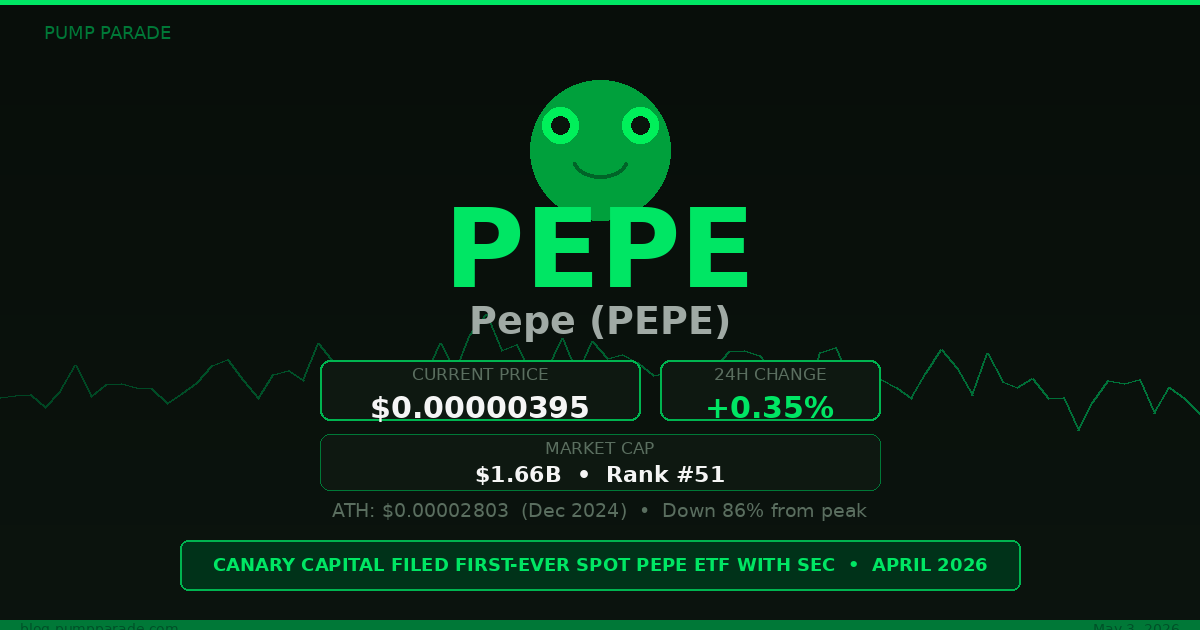
    PEPE is trading at $0.00000395 as of May 3, 2026. The coin is down 86% from its all-time high of $0.00002803, set back in December 2024. But something changed last month.

    On April 8, 2026, Canary Capital filed an S-1 registration with the US Securities and Exchange Commission. The goal: the first-ever regulated spot ETF tracking PEPE’s price. The filing put PEPE back on institutional radar. And quietly, unique holder addresses have risen by 37,000 since mid-April, reaching approximately 551,500.

    Is this genuine re-accumulation, or just ETF buzz with no follow-through? Our AI model digs into the data and presents both the bull case and the bear case.

    PEPE Price Prediction 2026 hero image showing current price $0.00000395 and Canary Capital ETF catalyst

    What Is PEPE?

    PEPE launched in April 2023 as a community meme token on the Ethereum blockchain. It is inspired by the iconic Pepe the Frog internet meme. The token has no utility beyond speculation and community culture.

    That sounds like a weakness. But PEPE has proven something rare in the memecoin world: staying power. Most memecoins collapse within weeks of launch. PEPE has maintained a market cap above $1 billion for well over a year.

    Today PEPE ranks #51 by market cap according to CoinGecko. Its circulating supply is permanently fixed at 420.69 trillion tokens. There is no inflation risk, the contract is immutable, and liquidity is locked.

    Key Metrics (May 3, 2026)

    • Current price: $0.00000395
    • Market cap: $1.66 billion
    • 24-hour volume: $184.7 million
    • All-time high: $0.00002803 (December 9, 2024)
    • Distance from ATH: -86%
    • Unique holders: approximately 551,500
    • 30-day performance: +13.7%

    The ETF Catalyst

    The biggest news for PEPE in 2026 came on April 8. Canary Capital filed an S-1 registration statement with the US Securities and Exchange Commission. The application seeks to launch a regulated US spot ETF that tracks PEPE’s price directly.

    This is not a small story. Spot ETFs give institutional and retail investors exposure to an asset without holding it directly. Bitcoin spot ETFs launched in January 2024 and attracted over $50 billion in net inflows within their first year. That institutional access changed BTC’s supply dynamics permanently.

    A PEPE spot ETF would be the first meme coin ETF in US history. The SEC review window runs up to 240 days from the filing date. A decision could arrive as early as late 2026. The filing alone has not sent PEPE’s price dramatically higher. But it has introduced a new narrative floor.

    If approved, this becomes a category-defining event. If rejected or delayed, the narrative deflates. That tension sits at the heart of PEPE’s mid-term outlook.

    Technical Analysis

    PEPE’s recent price action shows cautious recovery. The coin gained 13.7% over the past 30 days and 5.9% over the past 14 days. That is not a strong momentum move, but it is a healthier pattern than the steady decline that lasted through Q1 2026.

    Key support sits at $0.0000035. This level held during multiple tests in April. A breakdown below it with sustained selling volume would open the path toward $0.0000028.

    Resistance sits at $0.0000048. This is the local high from before the current consolidation phase. A clean break above it would target the $0.0000065 to $0.0000080 range next.

    The Relative Strength Index (RSI) is reading in the neutral zone, roughly 45 to 50. That signals the market is waiting rather than trending. The MACD is showing faint positive momentum on the daily timeframe. It is not a strong signal yet, but it is a clear improvement from the deeply negative readings seen in March 2026.

    Volume is healthy. Daily trading volume of $184.7 million confirms genuine liquidity. Many memecoin rallies collapse because volume evaporates after the initial pump. That is not the current situation with PEPE.

    The Bull Case for PEPE in 2026

    The bull case rests on three distinct legs.

    1. ETF Approval Would Be a Watershed Event

    A successful Canary Capital filing would introduce a new class of investor to PEPE. Pension funds, family offices, and retail brokerage customers who cannot or will not self-custody an ERC-20 token would suddenly have access. Even capturing 0.5% of what Bitcoin ETFs attracted in year one would represent roughly $250 million in new demand for a $1.66 billion asset.

    2. The Holder Base Is Growing Quietly

    The 37,000 new unique addresses since mid-April suggest organic accumulation. This is not a spike driven by a single viral moment. It is slow and steady. Historically, rising holder counts in established large-cap memecoins tend to precede, not follow, price rallies. This pattern resembles what DOGE showed in early 2021 before its main run.

    3. Bitcoin Macro Tailwinds

    Bitcoin is consolidating near $78,000. If BTC breaks above $90,000 and triggers a broader altcoin season, memecoins historically outperform. During Bitcoin’s late 2024 bull run, PEPE gained over 600% in roughly 90 days. A repeat of that kind of move is not guaranteed, but the template exists.

    In a strong bull scenario, PEPE could recover toward the $0.0000150 to $0.0000250 range by mid-to-late 2027.

    The Bear Case for PEPE

    No honest analysis skips the downside risks. Here are the four that matter most.

    1. No Utility Means Pure Sentiment Dependency

    PEPE’s price is entirely a function of sentiment. There is no protocol revenue, no staking yield, no product demand. If the crypto market turns risk-off for any sustained period, memecoins tend to fall 50 to 80% faster than Bitcoin or Ethereum.

    2. Whale Concentration Is a Real Risk

    Roughly 33% of PEPE’s total supply sits in just 15 wallets. If even one large holder begins distributing their position, the price impact can be swift and severe. On-chain data is the early warning system here. Watching top wallet behavior on Arkham or Etherscan is worth the effort.

    3. ETF Rejection Would Hurt

    The SEC has historically been skeptical of meme coin products. An outright rejection of the Canary Capital filing, or a prolonged delay with negative commentary, would strip away the institutional narrative. The price could fall back toward the $0.0000025 to $0.0000030 range quickly.

    4. The Bottom Might Not Be In

    Down 86% from ATH is significant. But crypto has a long history of assets that fell 90%+ from all-time highs. If Bitcoin retests the $60,000 range, PEPE could set new lows. The risk of further downside is real and should not be dismissed.

    For context on the broader risks in speculative crypto assets, our guide on how most Pump.fun traders lose money is worth reading before sizing any memecoin position.

    AI Price Prediction Summary

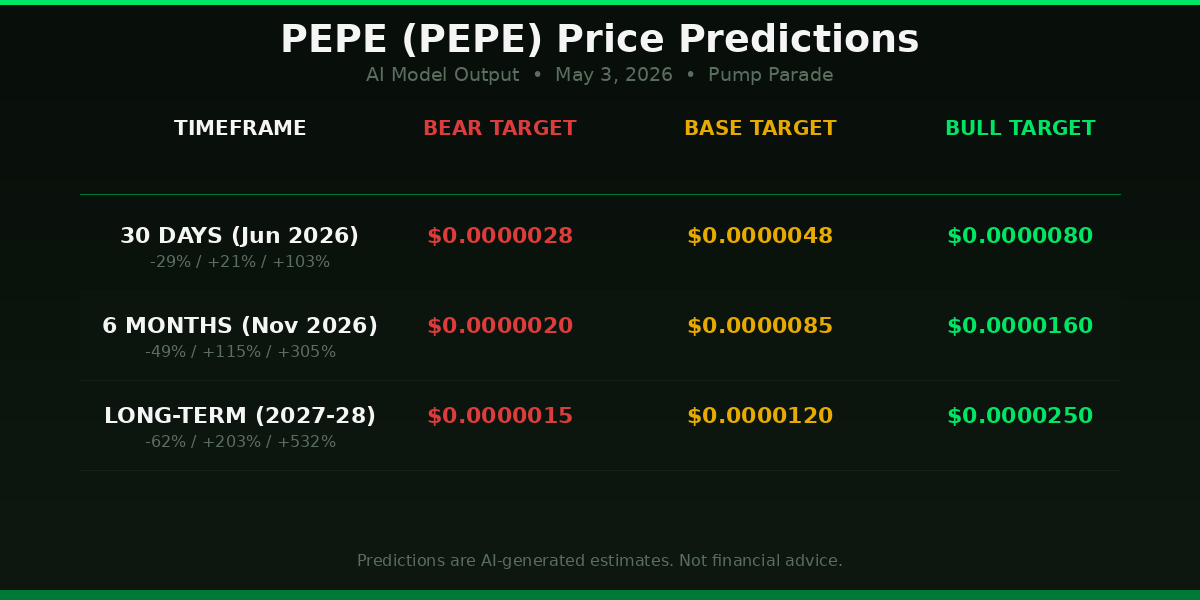
    PEPE price prediction table showing bear, base and bull targets for 30 days, 6 months and long-term 2027-2028

    Our hybrid AI model analyzes on-chain data, technical indicators, market sentiment, and historical memecoin patterns. Here is what it outputs for PEPE at current prices.

    Short-Term (30 Days, by June 2026)

    • Bear case: $0.0000028 (-29%)
    • Base case: $0.0000048 (+21%)
    • Bull case: $0.0000080 (+103%)

    The base case assumes continuation of the current gradual recovery. The bull case requires Bitcoin to break above $85,000 with positive ETF news flow.

    Mid-Term (6 Months, by November 2026)

    • Bear case: $0.0000020 (-49%)
    • Base case: $0.0000085 (+115%)
    • Bull case: $0.0000160 (+305%)

    The mid-term base case assumes no ETF approval yet, but sustained BTC strength and continued holder growth. The bull case factors in a positive ETF development.

    Long-Term (2027-2028)

    • Bear case: $0.0000015 (-62%)
    • Base case: $0.0000120 (+203%)
    • Bull case: $0.0000250 (+532%)

    The long-term bull case assumes ETF approval, a major crypto bull cycle, and PEPE maintaining its status as the leading Ethereum-based meme coin.

    Model confidence for the base case is 51% at the 30-day horizon, declining to 38% at the 2-year horizon. Memecoin predictions carry inherently high uncertainty. Use these figures as one data point, not a trading plan.

    What to Watch

    Three things matter most over the next six months for PEPE investors.

    SEC communications on the Canary Capital filing. Any acknowledgment letter, amendment request, or comment period extension signals the process is active. Watch the SEC EDGAR system for updates. An accelerated review timeline would be bullish. Extended delays or formal objections would be bearish.

    Bitcoin’s price action around $80,000 to $90,000. PEPE’s trajectory is tightly correlated to BTC sentiment. A sustained Bitcoin move above $85,000 with strong ETF inflows would likely catalyze a broader memecoin rally. A Bitcoin breakdown below $70,000 would apply downward pressure to PEPE quickly.

    On-chain whale behavior. Tracking the top 15 PEPE wallets on Etherscan or Arkham gives early warning of large holder intent. Accumulation from whales is bullish. Distribution is not.

    The Bottom Line

    PEPE sits at a crossroads. The ETF filing is real, the holder growth is encouraging, and the 30-day recovery shows the worst may be behind it. But this is still a meme coin with no utility, sitting 86% below its all-time high, with a 240-day regulatory clock ticking.

    The risk-reward is asymmetric in both directions. That makes position sizing the most important decision here. The data supports cautious optimism. It does not support reckless conviction.

    Watch the SEC. Watch Bitcoin. Watch the whales. The story is still being written.


    Disclaimer: This article is for informational and educational purposes only and should not be construed as financial, investment, or trading advice. Cryptocurrency markets are highly volatile, and past performance does not guarantee future results. The price predictions and analyses presented here are based on AI models, technical indicators, and available data at the time of writing. They are not guarantees. Always conduct your own research and consult with a qualified financial advisor before making any investment decisions. Pump Parade and its authors do not assume liability for financial losses incurred based on information provided in this article.

    Chainlink (LINK) Price Prediction 2026: Can LINK Hit $20?

    0
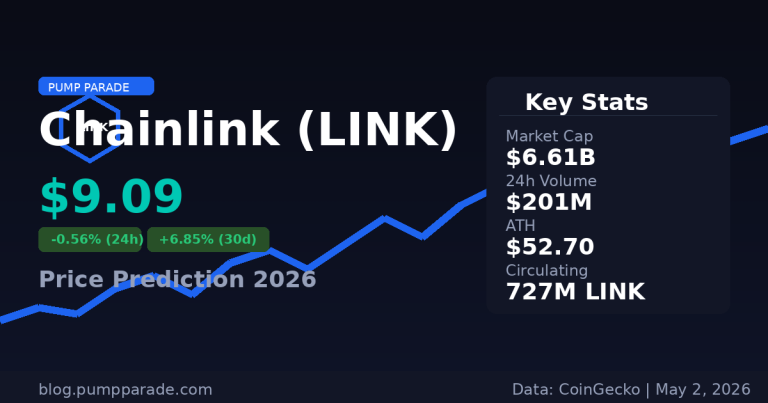
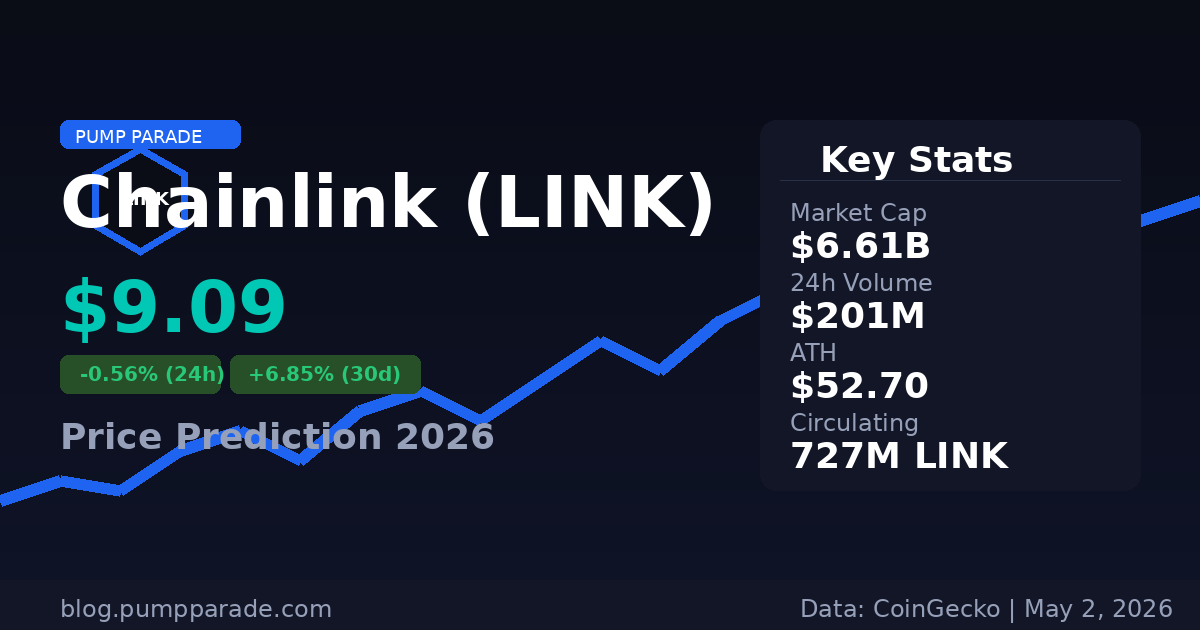
    Chainlink LINK price prediction 2026 hero image showing current price at $9.09

    Chainlink (LINK) is trading at $9.09 as of May 2, 2026. That is down about 83% from its all-time high of $52.70 set in May 2021. For a protocol that powers more than $20 trillion in data value across hundreds of smart contract ecosystems, that price gap is striking.

    But here is what the headlines miss: on-chain activity is quietly surging. Weekly Cross-Chain Interoperability Protocol (CCIP) volume just hit $1.3 billion, up 260% from a month ago. A record 970,430 LINK tokens left exchanges last week, the largest single-day outflow of 2026. Whales are accumulating while retail ignores it.

    This article breaks down what is driving LINK right now, where the price could go over the next 12 months, and the key risks that could derail the recovery. No hype. Just the data.

    What Is Chainlink?

    Chainlink is the dominant oracle network in crypto. Smart contracts on blockchains cannot access real-world data by themselves. They cannot pull a stock price, check the weather, or verify a payment. Chainlink bridges that gap.

    The network operates through a decentralized pool of node operators. These nodes fetch off-chain data and deliver it to on-chain smart contracts. LINK is the token that pays for that service and secures the network through staking.

    As of May 2026, Chainlink secures data for DeFi protocols, real-world asset (RWA) tokenization platforms, insurance contracts, and cross-chain bridges. Its CCIP protocol has become the leading standard for moving assets and messages across different blockchains securely.

    Key metrics at time of writing, according to CoinGecko:

    • Price: $9.09
    • Market cap: $6.61 billion
    • 24h volume: $201 million
    • Circulating supply: 727 million LINK (of 1 billion total)
    • ATH: $52.70 (May 2021)

    Current Market Context

    LINK is up 6.85% over the last 30 days but down 3.57% over the last 7. That short-term softness reflects the broader crypto market, which has been consolidating since early April.

    The 30-day gain is meaningful, though. It happened against a backdrop of muted sentiment. Bitcoin has been rangebound between $76,000 and $82,000. Most altcoins have struggled. LINK holding and grinding higher in that environment suggests real demand underneath.

    The whale outflow data supports this. When large holders pull tokens off exchanges, it typically signals intent to hold, not sell. The 970,430 LINK outflow on April 29 was the largest of 2026. Historically, similar exchange outflow events have preceded meaningful LINK price moves over the following 6 to 8 weeks.

    Technical Analysis

    Looking at the daily chart, LINK is holding above the $8.80 support level that has been defended three times since March. The 200-day moving average sits at approximately $8.40. LINK is trading above it, which is a baseline positive signal.

    The RSI (Relative Strength Index, a momentum gauge that runs from 0 to 100) is sitting near 47. That is neutral territory. Not oversold enough to signal a big bounce, not overbought either. The absence of extreme readings is actually healthy for a longer-term thesis.

    Key levels to watch:

    • Support: $8.80 (immediate), $8.40 (200-day MA), $7.50 (strong floor)
    • Resistance: $10.50 (recent ceiling), $12.00 (August 2025 high), $15.00 (major structural resistance)

    A clean daily close above $10.50 would be the first clear breakout signal. Until that level is cleared, LINK remains in a range-bound recovery phase.

    Key Catalysts for 2026

    CCIP Growth. Chainlink’s Cross-Chain Interoperability Protocol is becoming the backbone of cross-chain DeFi. Weekly CCIP volume crossing $1.3 billion is not a trivial number. As more protocols integrate CCIP for secure asset transfers, demand for LINK as the settlement and security layer increases.

    Real-World Asset Tokenization. RWA tokenization is one of the biggest crypto narratives of 2026. Tokenized Treasury bills, private credit, and real estate are all growing rapidly. Chainlink’s Proof of Reserve and data feed products are the oracle layer most of these platforms rely on. More RWA volume means more Chainlink revenue and more LINK staking demand.

    Grayscale LINK Trust. The Grayscale Chainlink Trust (GLNK) launched in December 2025, giving institutional investors regulated access to LINK for the first time. Cumulative inflows have already surpassed $111.5 million. This opens the LINK market to fund managers and family offices that cannot hold crypto directly.

    Staking v1 Maturity. Chainlink’s staking program allows LINK holders to earn yield by securing the network. As staking rewards become more visible and the locked LINK supply grows, circulating supply effectively tightens. Less selling pressure from staked holders supports the price floor.

    The broader ecosystem context matters too. Ethereum’s DeFi resurgence directly benefits Chainlink since the majority of Chainlink oracle calls still originate from Ethereum mainnet and its layer-2 networks. For more context on the Ethereum outlook, see our Ethereum (ETH) price prediction for 2026.

    The Bull Case

    Our hybrid AI model assigns a 58% probability of LINK reaching the $16 to $24 range by end of 2026, based on current technical structure and catalyst trajectory.

    The bull case rests on three pillars. First, CCIP volume continues to compound as more cross-chain bridges and DeFi protocols adopt the standard. Each new integration adds baseline demand for LINK. Second, the RWA narrative accelerates, pulling institutional capital into Chainlink-powered infrastructure. Third, a broader altcoin recovery in Q3 or Q4 2026 carries LINK back toward its 2025 highs near $25.

    Historically, LINK has outperformed in mid-to-late bull cycle phases. In 2020-2021, it went from $2 to $52 in roughly 18 months. The current setup, with accumulation occurring at depressed prices and fundamentals genuinely improving, rhymes with that pattern.

    Bull case price targets:

    • 3 months: $14 to $16
    • 6 months: $20 to $24
    • End of 2026: $28 to $35 if market conditions are favorable

    The Bear Case

    The bear case is real and worth taking seriously.

    LINK has been in a multi-year downtrend against Bitcoin (BTC). Relative to the market leader, it has consistently underperformed since 2021. That ratio needs to recover for LINK to post meaningful USD gains in a flat or declining BTC environment.

    Competition is also growing. Pyth Network, a newer oracle provider built on Solana, has captured significant market share on faster chains. If Pyth or other alternatives continue eating into Chainlink’s dominance in high-speed DeFi, the growth story becomes harder to tell.

    Macro risk remains. If Bitcoin breaks below $70,000 and the broader market enters a prolonged correction, LINK historically drops harder than BTC in risk-off environments. The $7.50 support level would be the critical line in the sand. A weekly close below it would likely send LINK toward $6.

    Bear case price targets:

    • 3 months: $7.00 to $7.50
    • 6 months: $5.50 to $6.50
    • If major breakdown: $4.50 (2024 lows)

    Chainlink (LINK) Price Predictions by Timeframe

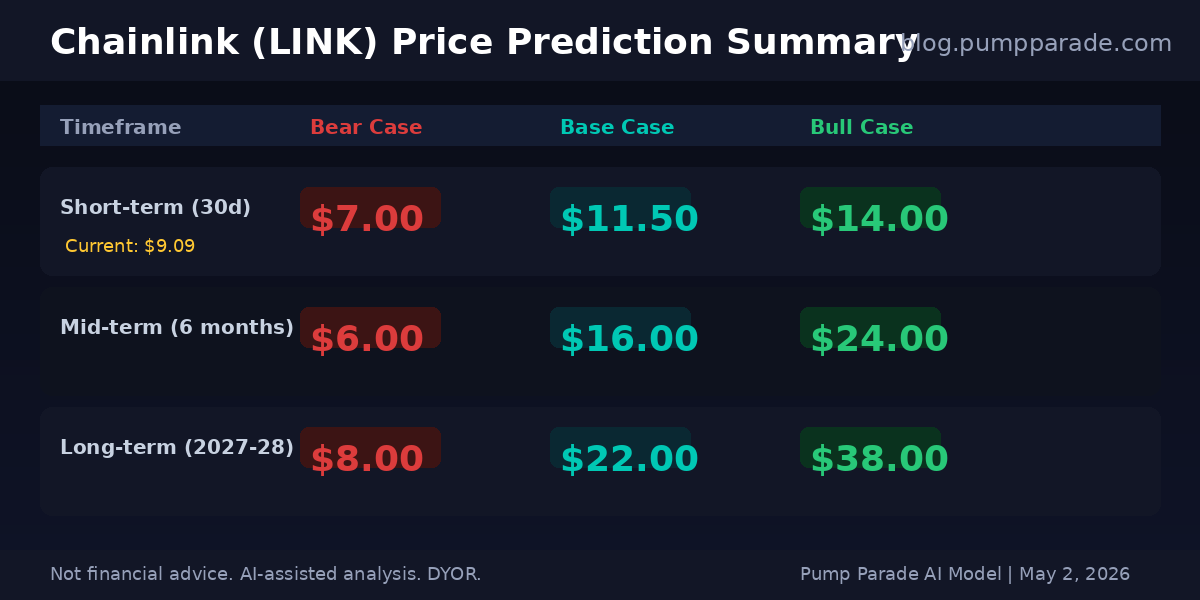
    Chainlink LINK price prediction summary table showing bear, base, and bull case targets for 2026 and 2027

    Based on our AI model’s analysis of technical indicators, on-chain data, exchange flows, and macro conditions, here are our price prediction ranges for LINK:

    Short-term (30 days, by June 2026): Bear $7.00 | Base $11.50 | Bull $14.00

    The next 30 days are about whether LINK can clear the $10.50 resistance level. A macro risk-off move would push it back toward $7 to $8. A positive crypto market environment could see a quick run toward $13 to $14.

    Mid-term (6 months, by November 2026): Bear $6.00 | Base $16.00 | Bull $24.00

    The base case assumes CCIP growth continues, the Grayscale product attracts further institutional inflows, and BTC holds above $75,000. In that scenario, LINK gradually reclaims historical support levels and rebuilds toward $15 to $18. The bull case requires a genuine alt season where capital rotates out of BTC and ETH into mid-cap infrastructure tokens.

    Long-term (2027-2028): Bear $8.00 | Base $22.00 | Bull $38.00

    The long-term thesis depends on whether RWA tokenization becomes a trillion-dollar market. If it does, Chainlink is positioned to be the oracle infrastructure standard for that market. A $22 base case represents roughly a 140% gain from current levels and still implies LINK is at about 42% of its 2021 ATH.

    What to Watch

    If you are tracking LINK, here are the signals that matter most:

    • Weekly CCIP volume: If it sustains above $1 billion and trends toward $2 billion, the fundamental case strengthens.
    • Exchange flows: Continued outflows signal accumulation. Sudden large inflows to exchanges are a warning sign.
    • BTC price action: A clean BTC break above $85,000 would likely trigger an altcoin rotation that benefits LINK.
    • $10.50 resistance: A confirmed daily close above this level would be the first technical breakout confirmation.
    • GLNK inflow data: Grayscale Trust inflows accelerating would signal growing institutional conviction.

    Disclaimer: This article is for informational and educational purposes only and should not be construed as financial, investment, or trading advice. Cryptocurrency markets are highly volatile, and past performance does not guarantee future results. The price predictions and analyses presented here are based on AI models, technical indicators, and available data at the time of writing. They are not guarantees. Always conduct your own research (DYOR) and consult with a qualified financial advisor before making any investment decisions. Pump Parade and its authors do not assume liability for financial losses incurred based on information provided in this article.

    About our AI predictions: Pump Parade’s price predictions are generated by machine learning models that analyze technical indicators, on-chain data, and market sentiment. These models have limitations and cannot account for black swan events, regulatory changes, or sudden market shifts. Use AI predictions as one input among many in your research.

    Orca (ORCA) Price Prediction 2026: Can It Hit $5?

    0

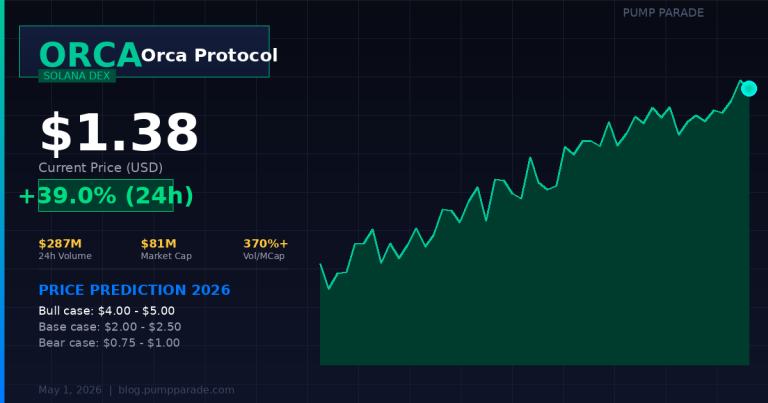
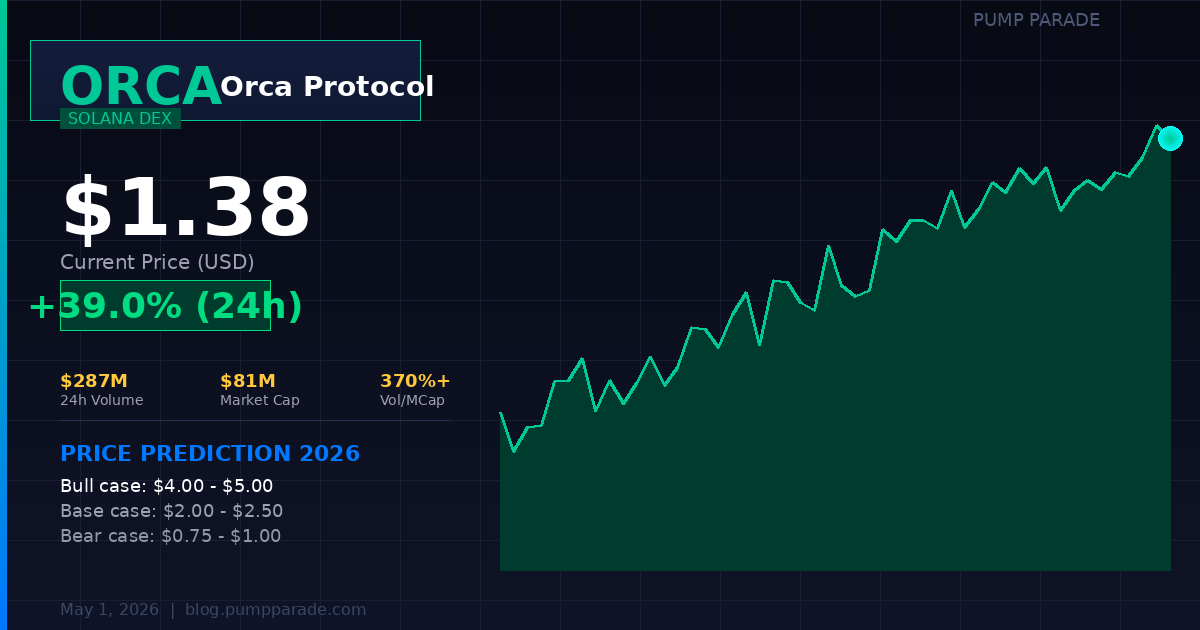
    Orca (ORCA) is up 39% in the last 24 hours. Volume hit $287 million today against a market cap of just $81 million. That is a volume-to-market-cap ratio above 350% : one of the highest readings among established Solana DeFi tokens right now.

    This is not random noise. A combination of governance-driven buybacks, Solana ecosystem momentum, and a trust surge following a rival DEX hack has put ORCA back in traders’ sights. Our AI model has updated its targets. Here is what the data shows.

    Orca ORCA price prediction 2026 hero image showing current price $1.38 and 39% gain

    What Is Orca? A Quick Overview

    Orca is a decentralized exchange (DEX) built on Solana. It uses a concentrated liquidity model called “Whirlpools,” letting liquidity providers (LPs) earn more fees by targeting specific price ranges. Think of it like placing your capital exactly where the market is most active, rather than spreading it across all possible prices.

    The ORCA token governs the protocol. Holders can stake ORCA to receive xORCA, which earns a share of protocol fee revenue. That mechanic is now at the center of the current price action.

    Key metrics as of May 1, 2026:

    • Price: $1.38
    • 24h Change: +39%
    • 24h Volume: $287 million
    • Market Cap: ~$81 million
    • Circulating Supply: ~58 million ORCA

    What Is Driving ORCA Higher Today?

    Governance: More Fees Flowing to ORCA Stakers

    In January 2026, Orca’s Governance Council approved a key change. The share of protocol fee revenue used to buy ORCA for xORCA stakers increased from 20% to 40%. That means more buying pressure on ORCA every time someone swaps on the DEX. That change is already live.

    An earlier governance vote in August 2025 authorized the Orca DAO to use roughly 55,000 SOL from its treasury for ORCA buybacks over 24 months. Combined with 30% of ongoing protocol fees, this created a sustained mechanical buyer in the market.

    These are not promises. They are executed governance votes. The buying is already happening.

    Rival DEX Hack: Orca Is the Trust Beneficiary

    In early April 2026, a rival Solana DEX suffered a major exploit. $285 million in user funds were affected. Orca’s CEO quickly confirmed that user funds on Orca were fully safe.

    When a competitor goes down, liquidity migrates. Volume on Orca has surged as traders move their capital to protocols with confirmed security track records. Higher volume means more fee revenue. More fee revenue means more ORCA buybacks. The flywheel is spinning.

    Solana DEX Volumes Are at Multi-Year Highs

    Orca’s volume surge is not happening in isolation. The entire Solana DeFi ecosystem is seeing elevated trading activity in 2026. Solana’s transaction throughput improvements have lowered friction for traders. More swaps equal more fees. More fees equal more buybacks. ORCA is positioned to capture this tailwind better than almost any other Solana DeFi token right now.

    If you want a deeper look at how Orca stacks up against its biggest competitor, read our Raydium vs Orca comparison for 2026.

    Technical Analysis: Reading the Chart

    Before today’s surge, ORCA was trading in a $0.85 to $1.05 range. The RSI (Relative Strength Index) was sitting near 40 to 50. That is neutral territory, not overbought. It meant the token had room to run.

    The 39% move today has likely pushed RSI toward overbought levels (above 70). Short-term, a pullback or consolidation would be healthy and expected. The question is where that consolidation lands.

    Key support levels:

    • $1.00: Psychological round number, also a previous resistance level that could flip to support.
    • $0.85: The base of the pre-surge consolidation range. A breakdown here would be concerning.

    Key resistance levels:

    • $1.80: The next major resistance zone based on prior price history.
    • $2.50: A significant ceiling from the 2025 cycle. Breaking above here would signal a genuine trend change.
    • $4.00 to $5.00: The bull case target range. Requires sustained Solana ecosystem growth and continued buyback execution.

    The MACD (a momentum indicator showing trend direction) is turning positive on the daily chart for the first time in several weeks. That supports the idea that this move has momentum behind it, not just intraday noise.

    For current price data and charts, see Orca on CoinGecko.

    The Bull Case for ORCA in 2026

    The bull case rests on three pillars.

    First, buyback mechanics compound over time. With 40% of protocol fees buying ORCA and a 55,000 SOL treasury backing 24 months of buybacks, the protocol creates steady upward pressure on a relatively small float. If Solana DEX volume holds at current levels, the math on token scarcity becomes very interesting by Q3 2026.

    Second, Orca is gaining market share. The rival DEX hack has redirected liquidity. If Orca captures even a fraction of that displaced volume permanently, its fee revenue jumps. Higher fees mean faster buybacks.

    Third, Solana’s ecosystem is still expanding. Institutional interest in Solana is growing. ETF discussions, RWA (real-world asset) tokenization, and stablecoin settlement are all increasing on-chain volume. Orca is one of the primary liquidity venues for all of it.

    In this scenario, ORCA reaching $4.00 to $5.00 by year-end is plausible. It would still leave the token well below its all-time high, and the tokenomics would support the move.

    The Bear Case: What Could Go Wrong

    The bear case is just as real. Here are the risks.

    Post-surge fatigue. A 39% single-day move often leads to short-term profit-taking. If buyers do not step in at $1.00 support, a reversal toward $0.85 is the most likely near-term scenario.

    Governance execution risk. Buybacks sound great on paper. But treasury management, timing, and market conditions all affect the real impact. If Solana’s price drops sharply, the SOL-denominated treasury buys fewer ORCA in dollar terms.

    Competition from Raydium and Jupiter. Orca is not the only DEX on Solana. Raydium and Jupiter both compete aggressively for liquidity and volume. A shift in DEX incentives could redirect volume away from Orca.

    Macro risk. Crypto markets remain correlated to risk appetite. A macro shock (rising rates, equity selloff, regulatory crackdown) could erase the current rally regardless of Orca’s fundamentals.

    If support at $0.85 breaks, the bear scenario puts ORCA back in the $0.60 to $0.70 range.

    ORCA Price Predictions: 2026 and Beyond

    Our hybrid AI model weighs technical indicators, on-chain fee data, governance mechanics, and broader market conditions to generate the following targets. These are ranges, not guarantees. The confidence scores reflect the model’s internal probability weighting.

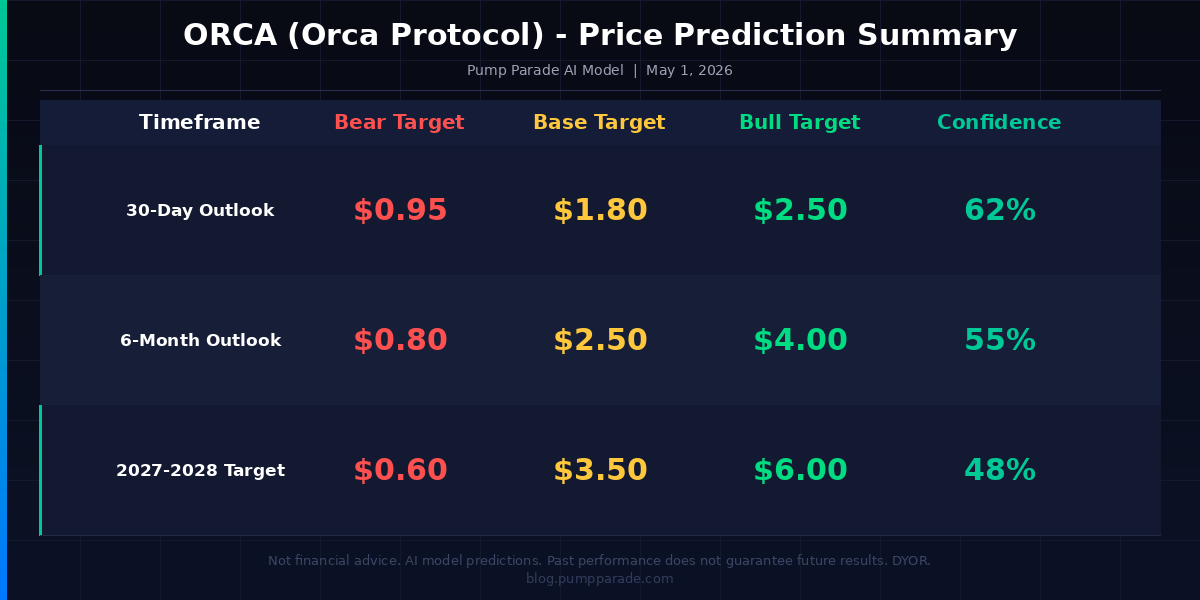
    Orca ORCA price prediction table showing bear base and bull targets for 30 days 6 months and 2027-2028

    30-Day Outlook (June 2026)

    The short-term picture is mixed. ORCA just made a large single-day move. Some consolidation is expected. If the $1.00 level holds and volume remains elevated, a move toward $1.80 is the base case. A rejection at $1.50 resistance and a pullback to $0.95 is the bear case. Model confidence: 62%.

    • Bear: $0.95
    • Base: $1.80
    • Bull: $2.50

    6-Month Outlook (November 2026)

    By late 2026, the buyback program will have been running for six months at the increased 40% fee-share rate. If Solana DEX volumes hold at current levels, that creates meaningful supply compression on a small float. The base case of $2.50 assumes flat market conditions. The bull case of $4.00 requires Solana ecosystem growth and broader crypto market strength. Model confidence: 55%.

    • Bear: $0.80
    • Base: $2.50
    • Bull: $4.00

    Long-Term Outlook (2027 to 2028)

    Over a 2 to 3 year horizon, the thesis depends on whether Orca can maintain its position as a top Solana DEX while executing on its tokenomics model. If it does, and if the broader Solana ecosystem continues to grow, ORCA has a credible path to the $3.50 to $6.00 range. Model confidence drops here because longer-term crypto forecasts carry higher uncertainty. Model confidence: 48%.

    • Bear: $0.60
    • Base: $3.50
    • Bull: $6.00

    What to Watch in the Next 30 Days

    Here is the framework for monitoring ORCA over the near term. No one can predict crypto markets. But tracking these signals will tell you whether the bull case or bear case is gaining ground.

    • Volume vs. price divergence: If volume drops sharply while price holds, momentum is fading. Watch for volume confirmation on any push above $1.80.
    • $1.00 support: This is the key line. A daily close below $1.00 is a signal to reassess.
    • Governance updates: The Orca forums (forums.orca.so) are public. New governance proposals can move the token fast, as we saw this week.
    • Solana ecosystem volume: ORCA’s fee revenue tracks Solana DEX volume. If total Solana DEX volumes drop, that reduces the buyback rate.
    • Bitcoin correlation: Like most altcoins, ORCA tends to follow BTC direction in macro moves. A BTC breakdown would pressure ORCA regardless of project-specific factors.

    Disclaimer: This article is for informational and educational purposes only and should not be construed as financial, investment, or trading advice. Cryptocurrency markets are highly volatile, and past performance does not guarantee future results. The price predictions and analyses presented here are based on AI models, technical indicators, and available data at the time of writing. They are not guarantees. Always conduct your own research and consult with a qualified financial advisor before making any investment decisions. Pump Parade and its authors do not assume liability for financial losses incurred based on information provided in this article.

    About our AI predictions: Pump Parade’s price predictions are generated by machine learning models that analyze technical indicators, on-chain data, and market sentiment. These models have limitations and cannot account for black swan events, regulatory changes, or sudden market shifts. Prediction confidence scores reflect the model’s internal assessment, not guaranteed accuracy. Use AI predictions as one input among many in your research.

    Solflare Review 2026: Fees, Features & Verdict

    0
    Solflare Review 2026 hero image
    Solflare Review 2026: fees, features and verdict.

    Phantom and Backpack get most of the spotlight in the Solana wallet conversation, but ask any long time SOL staker which wallet they actually keep their bag in and the answer is often Solflare. It is the wallet that quietly powers a huge slice of Solana staking, ships every staking control most users will ever need, and now bundles a hardware wallet, a debit card, and a polished mobile app. So in 2026, is Solflare still the power user pick, or has the field caught up? Here is the full review.

    TL;DR: Quick Verdict

    Solflare is the strongest non custodial wallet on Solana for users who care about staking, validator selection, and hardware grade security on a budget. It is free to use, the in app swap is cheap thanks to a Jupiter routed engine, and the new Solflare Shield card is a clever middle ground between hot and cold storage. It is not the slickest social wallet on the network and its multi chain support still leans Solana first, EVM second, but for anyone serious about earning yield on their SOL while keeping their keys, it is hard to beat.

    Rating: 4.5 / 5

    Best for: long term SOL holders, validator stakers, NFT collectors, and anyone who wants Ledger or NFC hardware backing without leaving the wallet UI.

    Skip if: your portfolio is mostly EVM and you live in DeFi protocols on Ethereum or L2s.

    Visit Solflare ›

    What is Solflare?

    Solflare is a non custodial, Solana first wallet built and maintained by the Solrise team. It launched in 2020 as one of the earliest staking focused Solana wallets and has since grown into a full ecosystem product line: a browser extension, a web wallet, native iOS and Android apps, a hardware integration with Ledger, the new Solflare Shield NFC card, and a Solflare Card debit product for fiat spending.

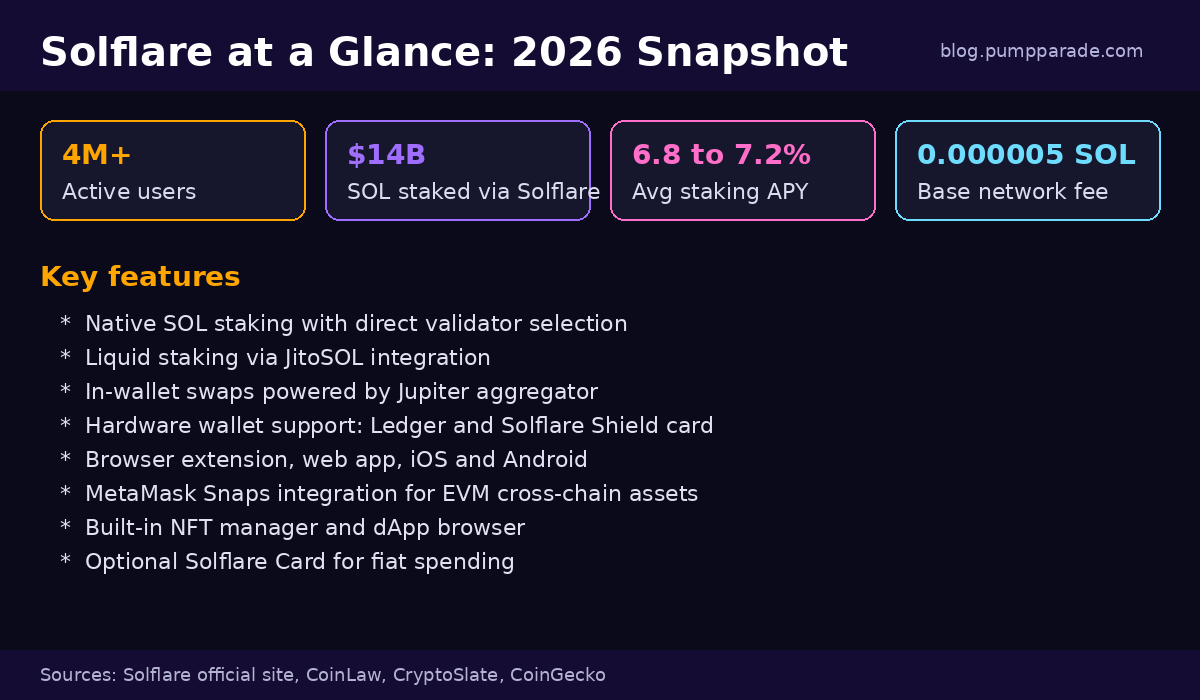
    By the numbers, Solflare reports more than 4 million active users and over $14 billion in SOL staked through the wallet as of January 2026. Those figures, paired with audits from Kudelski Security and a steady release cadence, make it one of the most credible non custodial options in the Solana ecosystem.

    Solflare is also one of the wallets specifically integrated into the Solana Saga and Solana Mobile Seeker phones, which is why you will often see it bundled in mobile first onboarding flows.

    Solflare wallet official Solana branding image
    Solflare official share image. Source: solflare.com

    Features Deep Dive

    Native and liquid SOL staking

    Staking is the feature that put Solflare on the map and it is still the most polished part of the product. You can stake directly to any active validator on the network, see real time APY estimates, and split your stake across multiple validators from a single dashboard. Standard unstake follows the normal Solana cooldown, but Solflare also offers an instant unstake option that taps a liquidity pool to give you SOL back the same epoch for a small fee. For users who want yield without the lockup, the wallet plugs straight into JitoSOL liquid staking, so you can earn MEV boosted rewards and still trade your stake.

    Average APYs in early 2026 sit between 6.8% and 7.2%, in line with the broader Solana staking range, with rewards auto compounded into your validator stake.

    Swaps and trading

    Solflare routes its in wallet swap through the Jupiter aggregator, which means you usually get the same price you would get on jup.ag itself, with the convenience of staying inside the wallet. There is a configurable slippage tolerance, MEV protection toggle, and a quote refresh that updates every few seconds. For most everyday SOL, USDC, JUP, JTO, or PYTH swaps the impact is tiny, although illiquid memecoins still suffer the same slippage you would see on any DEX.

    NFTs and collectibles

    Solflare has a clean NFT manager with rarity data, collection grouping, and a quick listing flow into the major Solana NFT marketplaces. It supports compressed NFTs, which is a must in 2026 given how much of Solana NFT volume is now compressed. You can also burn unwanted spam NFTs to reclaim a small amount of SOL in rent.

    Hardware wallet support

    Two routes here. The classic option is Ledger, with full sign and stake support over USB or Bluetooth on mobile. The 2026 addition is the Solflare Shield card, an NFC enabled, battery free hardware card. You tap it on the back of your phone to sign transactions, which keeps the private key off the phone but keeps the user experience as fast as a hot wallet. It is one of the more interesting hardware launches of the year and works well for users who want better security than a pure software wallet without carrying a Ledger Nano around.

    Multi chain via MetaMask Snaps

    Solflare is still Solana first, but the team has shipped a MetaMask Snaps integration that lets you manage Ethereum and other EVM chain assets from inside the wallet. Bridges are exposed in app, so you can move assets across without leaving Solflare. It is not as broad as a true multi chain wallet, but it covers the 80 percent case for crypto users who occasionally touch ETH or an L2.

    Solflare Card

    The Solflare Card is a Visa debit card backed by your SOL or USDC balance. It works anywhere Visa is accepted, with no monthly fees and competitive currency conversion when you spend in USD. Spending in non USD currencies adds a foreign exchange markup that pushes the effective fee higher, so it is best treated as a USD focused card for travel and online checkout.

    Solflare wallet 2026 feature snapshot: 4M+ users, $14B in staked SOL, 6.8 to 7.2 percent APY
    Solflare snapshot for 2026. Data: Solflare, CoinLaw, CryptoSlate.

    Fees and Pricing

    Solflare itself is free. The wallet, the apps, and the staking dashboard cost nothing to download or use. What you pay falls into three buckets:

    1. Network fees. Standard Solana base fees of 0.000005 SOL per transaction, which at the current SOL price is a fraction of a cent. Priority fees apply on congested mints and trending memecoin trades.

    2. Swap fees. The in wallet swap takes a small platform fee on top of the Jupiter routing fee, typically in the 0.5% range depending on the pair. For high liquidity pairs you will rarely notice it. For long tail tokens, you should always compare against jup.ag directly before signing.

    3. Optional product fees. Instant unstake charges a liquidity based fee that varies with utilization. The Solflare Card adds an FX markup on non USD spending. Fiat on ramps inside the wallet are powered by third party providers like MoonPay and Banxa, and those carry their own 1% to 4% spread depending on payment method.

    Compared to Phantom, fees are roughly equivalent on swaps and identical on network costs. The biggest cost differences show up in instant unstake and fiat on ramps, both of which depend on third party providers and can vary day to day.

    Pros and Cons

    Pros

    • Best in class staking flow with direct validator selection and liquid staking via JitoSOL
    • Free to use with no upfront or monthly fees
    • Hardware wallet support including the new Shield NFC card
    • Jupiter routed swaps for competitive pricing
    • Strong security record, Kudelski audits, and 4 million plus active users
    • Native iOS, Android, web, and extension parity
    • MetaMask Snaps integration extends usage to EVM chains
    • Optional Solflare Card for spending without leaving the ecosystem

    Cons

    • Multi chain experience is still Solana first, lighter on EVM than dedicated multi chain wallets
    • Instant unstake fee can spike during high redemption demand
    • UI is functional and dense, not as flashy as Phantom or Backpack
    • FX markup on Solflare Card spending in non USD currencies
    • Customer support is mostly community driven via Discord and X

    Security and Trust

    Solflare has been audited by Kudelski Security, with the audit reports linked from its official documentation. The team is publicly known, the code is partially open source, and the wallet has not had a major compromise on its core software in the years it has been live. As with any non custodial wallet, the largest attack surface is still the user: phishing, malicious dApps, and seed phrase leaks remain the most common ways funds get drained on Solana.

    The Shield card is a meaningful security upgrade because it removes the private key from the phone entirely. For users who want true cold storage, the Ledger integration is the right call, with offline signing and PIN protection. The wallet also exposes a transaction simulation step before signing, which catches a number of common drainer patterns by showing you what tokens are about to leave your account.

    One thing to know: the Solflare Card is a partner product issued through a regulated card issuer, not Solflare itself, so it has its own KYC and terms. Read those before relying on it for primary spending.

    User Experience

    Solflare prioritizes capability over polish. The interface is clean and modern, but it shows you more options than most consumer wallets do. For a power user that is a feature, since you can pick the validator, set custom slippage, control priority fees, and toggle MEV protection without diving into a settings menu. For a brand new user it can feel slightly busier than Phantom.

    The mobile app is the surprise winner of this review cycle. The 2026 redesign cleaned up the staking and swap flows, added Face ID and biometric unlock, and introduced a much faster transaction queue when network congestion spikes. dApp connection via WalletConnect and Solana Mobile Stack is reliable, and the deep linking into the iOS and Android browsers actually works the first time, which is not always true of competitor wallets.

    The browser extension is solid and lightweight. It supports multiple accounts, hardware accounts, and watch only addresses, and it lets you simulate any pending transaction with a single click before approving.

    Solflare vs Phantom vs Backpack

    If you have read our Phantom vs Backpack comparison, here is where Solflare slots into the picture. Phantom wins on UX polish and brand awareness, Backpack wins on cross app account abstraction and exchange integration, Solflare wins on staking depth and hardware support. The honest answer in 2026 is that most active Solana users have at least two of these installed: a daily driver for fast on chain interactions and a second wallet for staking, NFT collections, or hardware backed signing. Solflare is the most defensible second wallet, and for staking heavy users it is often the daily driver.

    Verdict and Rating

    Solflare in 2026 is a serious, mature wallet that has aged well. The staking experience is still the gold standard on Solana, the addition of the Shield card is a real innovation, and the mobile redesign closes most of the UX gap to Phantom. Where it lags is multi chain breadth and visual polish, neither of which matter much if Solana is your primary chain.

    Final rating: 4.5 / 5

    If you are a long term SOL holder, a validator staker, an NFT collector, or anyone who wants hardware grade signing without leaving the wallet UI, Solflare is the right pick. If you are mostly an EVM user dipping into Solana, a dedicated multi chain wallet is probably a better fit and you can keep Solflare as a side wallet for staking only.

    Try Solflare ›

    FAQ

    Is Solflare safe to use?

    Yes. Solflare is non custodial, has been audited by Kudelski Security, and supports Ledger and the Solflare Shield NFC card for hardware backed signing. As with any wallet, the biggest risk is user error: phishing links, fake airdrops, and seed phrase exposure. Always verify URLs and never share your seed phrase.

    Does Solflare charge fees?

    The wallet itself is free. You pay standard Solana network fees of 0.000005 SOL per transaction, a small platform fee on swaps that adds to the Jupiter routing fee, an instant unstake fee if you skip the cooldown, and an FX markup on Solflare Card spending in non USD currencies.

    What is the difference between Solflare and Phantom?

    Phantom is broader and more polished, with a stronger UX and better cross chain support out of the box. Solflare is deeper on staking, with direct validator selection, instant unstake, and JitoSOL liquid staking baked in. Power users often run both.

    Can I stake SOL on Solflare?

    Yes, this is one of Solflare’s flagship features. You can pick any active validator, split your stake, see live APY estimates, and either wait out the standard unstake cooldown or pay a small fee for instant unstake. Liquid staking via JitoSOL is also one tap away.

    Does Solflare support hardware wallets?

    Yes. Ledger Nano S Plus and Nano X are supported over USB and Bluetooth. The Solflare Shield card is an NFC hardware option that signs by tapping the card to your phone and is available directly from the Solflare team.

    Is Solflare available on mobile?

    Yes. There are native iOS and Android apps with full feature parity to the web and extension, plus deep integrations with the Solana Mobile Seeker phone.

    This article is for informational purposes only and is not financial advice. Cryptocurrency is volatile and you can lose money. Always do your own research.

    Polkadot (DOT) Price Prediction 2026: Bounce or Breakdown?

    0

    Polkadot (DOT) is trading at $1.22 as of April 30, 2026. Fifteen days ago, it touched $1.15. That was a new all-time low. The question traders are asking right now: is this a bottom, or a pause before another leg down?

    Here is why the answer matters more than usual. On March 14, 2026, Polkadot completed its biggest tokenomics overhaul since launch. Annual issuance was cut by 53.6%. A hard supply cap of 2.1 billion DOT was set. This is the closest thing to a “halving” the Polkadot ecosystem has seen. And yet the price is still sitting near all-time lows.

    Something has to give. In this article, we break down both paths using real market data and our AI model.

    Polkadot DOT price prediction 2026 hero banner showing current price $1.22 and key catalysts

    Polkadot: What You Need to Know First

    Polkadot is a Layer 0 blockchain network. It connects specialized blockchains called parachains into one shared security model. The goal is interoperability. Rather than building everything on one chain, developers can create custom chains and plug them into the Polkadot relay chain.

    Founded by Ethereum co-founder Gavin Wood, Polkadot was one of the most anticipated launches of the 2020 bull cycle. DOT reached a peak of $54.98 in November 2021. Since then, it has lost about 97.8% of its value in USD terms. That is a brutal drawdown by any measure.

    Key metrics as of April 30, 2026:

    • Current price: $1.22
    • All-time low: $1.15 (April 15, 2026)
    • All-time high: $54.98 (November 2021)
    • Market cap: $2.04 billion (rank: #42)
    • 24-hour volume: $148.7 million
    • Circulating supply: 1.68 billion DOT
    • Max supply: 2.1 billion DOT (hard cap, set March 2026)

    For broader context on how layer-1 ecosystems are performing, see our Ethereum (ETH) Price Prediction 2026 analysis.

    What Just Changed: Two Big Catalysts in Six Weeks

    1. The Polkadot Halving (March 14, 2026)

    This is the most important structural change in Polkadot’s history. On March 14, Polkadot governance passed two referendums that slashed annual token issuance by 53.6%. Annual new supply dropped from roughly 120 million DOT to about 56.88 million DOT per year.

    The supply was previously uncapped. That is no longer true. The hard cap is now set at 2.1 billion DOT. This mirrors the mechanics of Bitcoin’s halving cycle. Inflation drops immediately from roughly 10% to 3.11%. It then falls by 13.14% of remaining issuance every two years. By the early 2030s, inflation will be below 1%.

    In theory, this is deeply bullish. Lower supply growth means each existing DOT becomes relatively more scarce over time. In practice, the market has not priced this in yet. DOT actually fell to its all-time low the month after the halving. That disconnect is worth noting.

    2. The Hyperbridge Exploit (April 13, 2026)

    Two weeks before DOT hit its all-time low, a hacker exploited a vulnerability in the Hyperbridge gateway contract on Ethereum. The attacker forged a cross-chain message, gained admin access to the bridged DOT token contract, and minted approximately 1 billion tokens.

    The revised total realized loss is approximately $2.5 million. That number is relatively small. The attacker could not extract the full notional value because the bridged DOT pool on Ethereum did not have enough liquidity to absorb 1 billion tokens.

    Critically, Polkadot confirmed that native DOT on the Polkadot relay chain was not affected. The exploit was limited to DOT bridged through Hyperbridge to Ethereum. Still, the incident shook market confidence and contributed to the price dropping to $1.15.

    For current on-chain data and price history, see Polkadot’s CoinGecko page.

    Technical Analysis: Where DOT Stands Now

    DOT is in a long-term downtrend. The 200-day moving average sits well above the current price. The 50-day moving average is also sloping downward. That is a bearish technical picture on the higher timeframes.

    However, a few signals suggest a potential short-term shift:

    • ATL bounce: DOT hit $1.15 on April 15 and has recovered about 6% since. Buyers appeared at that level.
    • RSI (Relative Strength Index): On the weekly chart, RSI is in deeply oversold territory. Readings this low have historically preceded multi-week relief rallies, even within larger downtrends.
    • Volume: The 24-hour volume of $148.7M is moderate relative to the market cap. It does not yet show the kind of capitulation spike that typically marks a genuine bottom.
    • Key resistance: The first meaningful resistance sits at $1.40, which was support during the March sell-off. Above that, $1.80 becomes the next target.
    • Key support: The $1.15 ATL is the line in the sand. A confirmed break below it would signal continued downside with no historical support levels to reference.

    In plain terms: DOT is technically damaged, but it is sitting at a level where a bounce is plausible. It is not a clean setup in either direction yet.

    The Bull Case for DOT in 2026

    The bull case rests on three overlapping catalysts. Any one of them could move DOT significantly. All three together could be transformational.

    The halving effect takes time to show up. Bitcoin’s halving cycle shows that supply reductions typically take 6 to 12 months to show up in price. The Polkadot halving happened in March. If the same dynamic plays out, the second half of 2026 is when the reduced supply pressure becomes most visible.

    JAM (Join-Accumulate Machine) is arriving in 2026. JAM is the next major upgrade to Polkadot’s architecture. It is sometimes called Polkadot 3.0. Q3 and Q4 2026 are targeted for critical testing and early deployment phases. Forty-three independent teams are competing for a 10 million DOT prize pool for protocol conformance. That level of developer competition signals genuine technical momentum.

    The price-to-fundamentals gap is extreme. At $1.22, DOT is trading at 97.8% below its all-time high. The project is still actively developing, has a $2 billion market cap, and just implemented the most significant tokenomics upgrade in its history. Contrarian buyers see this as a deeply undervalued asset with a clear catalytic roadmap.

    In this scenario, our AI model assigns the following targets:

    • Short-term (30 days): Recovery to $1.40-$1.80 as the ATL bounce holds and buyers return
    • Mid-term (6 months): $2.50-$3.50 as the halving supply reduction starts to matter and JAM enters testnet phase
    • Long-term (2027-2028): $4.50-$12.00 if a broader bull market coincides with full JAM deployment

    The Bear Case for DOT in 2026

    Here is the uncomfortable reality: DOT has been losing ground for over four years. There are legitimate reasons why.

    The competitive landscape has shifted. Ethereum L2s have absorbed much of the interoperability narrative that Polkadot once owned. Solana has captured developer mindshare for high-throughput use cases. Polkadot has not broken into the mainstream of DeFi or memecoin culture. The parachain model, while technically sophisticated, has not yet driven the kind of user activity that drives token demand.

    The Hyperbridge exploit raised questions. Even though native DOT was unaffected, cross-chain security is now a visible risk factor. Any further bridge incidents would likely accelerate selling.

    Macro conditions remain uncertain. The broader crypto market has been choppy in 2026. If Bitcoin enters a sustained decline, altcoins with weaker momentum tend to fall harder. DOT has underperformed BTC and ETH significantly over the past year.

    No confirmed floor yet. The ATL at $1.15 was set just 15 days ago. That is too recent to confirm as a structural support level. If selling pressure returns, there is no historical price floor below $1.15 to reference.

    In the bear scenario:

    • Short-term (30 days): Retest of $1.15 ATL, possible breakdown toward $1.00-$1.05
    • Mid-term (6 months): $0.85 if JAM faces delays and macro conditions deteriorate
    • Long-term (2027-2028): $1.50 recovery floor in a slow-grind scenario without a major bull market

    AI Price Prediction Summary

    Our hybrid AI model analyzes technical indicators, on-chain metrics, supply dynamics, and sentiment signals. Here is what it is showing for DOT across three time horizons:

    Polkadot DOT price prediction table 2026 showing bear base and bull targets across timeframes

    The model assigns a 52% probability to the base case range over the next six months. The key swing factor is whether the JAM upgrade launches on schedule in Q3. A confirmed Q3 mainnet milestone would likely push DOT into the $2.50-$3.50 zone. A delay would reinforce the bear case.

    The model also flags that the DOT halving has not yet been priced in. Based on historical patterns from comparable supply-reduction events in other proof-of-stake networks, the peak impact on price tends to arrive 6 to 9 months after the event. That puts the window at September to December 2026.

    What to Watch

    These are the specific signals that will determine which scenario plays out:

    • $1.15 support: This is the ATL. A confirmed weekly close below $1.15 is the clearest bear signal. Watch this level above all others.
    • $1.40 resistance: A clean break and hold above $1.40 would be the first technical confirmation of a trend reversal. Bulls need this level to flip to support.
    • JAM testnet milestones (Q3 2026): Official announcements from Polkadot Foundation on JAM Toaster and Tart testnet progress are key catalysts. Watch the official Polkadot blog and governance channels.
    • Bitcoin correlation: DOT tracks BTC closely in risk-off periods. A sustained BTC rally above $95,000 would likely lift the altcoin market and benefit DOT disproportionately.
    • Bridge security: Any further cross-chain security incidents will weigh on DOT. Monitor Hyperbridge’s post-mortem actions and any new bridge audits.

    The Bottom Line

    Polkadot is at an inflection point. The tokenomics are genuinely improved. The JAM upgrade is the most technically ambitious upgrade in the project’s history. The price is near its all-time low. That combination is either a compelling value setup or a value trap, depending on execution.

    The data points toward a cautious bull case for the second half of 2026. But the bear risks are real, and the $1.15 support level is untested enough to deserve serious respect. This is not a “buy and forget” situation. It requires active monitoring of the catalysts outlined above.

    As always: size positions accordingly, and do not bet more than you can afford to lose on a single asset with this level of drawdown history.


    Disclaimer: This article is for informational and educational purposes only and should not be construed as financial, investment, or trading advice. Cryptocurrency markets are highly volatile, and past performance does not guarantee future results. The price predictions and analyses presented here are based on AI models, technical indicators, and available data at the time of writing. They are not guarantees. Always conduct your own research and consult with a qualified financial advisor before making any investment decisions. Pump Parade and its authors do not assume liability for financial losses incurred based on information provided in this article.

    About our AI predictions: Pump Parade’s price predictions are generated by machine learning models that analyze technical indicators, on-chain data, and market sentiment. These models have limitations and cannot account for black swan events, regulatory changes, or sudden market shifts. Prediction confidence scores reflect the model’s internal assessment, not guaranteed accuracy. Use AI predictions as one input among many in your research.

    Bybit vs OKX: Best Crypto Exchange 2026

    0

    Picking between two top-tier crypto exchanges in 2026 is no longer a question of who has the better logo. Both Bybit and OKX sit at the very top of the global volume tables, both publish monthly proof-of-reserves, and both have spent the last twelve months pouring resources into copy trading, on-chain wallets, and tokenized assets. So which one actually deserves your USDT?

    This Bybit vs OKX comparison breaks down fees, features, security and user experience in detail, then declares a winner for each kind of trader. If you only have thirty seconds, jump to the verdict box below. If you want the receipts, keep reading.

    Bybit vs OKX comparison cover for 2026 best crypto exchange article

    Quick Verdict: Which Exchange Wins in 2026?

    Bybit wins on simplicity, perpetual futures liquidity, and a slightly cleaner trading UI. If you live in BTC and ETH perps and you want a no-fluff derivatives terminal, Bybit is hard to beat.

    OKX wins on breadth. It has a deeper options book, a better Web3 wallet, an integrated DEX aggregator, an active NFT marketplace, and a much more aggressive push into regulated markets after Intercontinental Exchange (ICE) took a board seat at a $25 billion valuation in March 2026. If you want one app for CeFi, DeFi and tokenized real-world assets, OKX is the more complete platform.

    Overall verdict: OKX is the better all-rounder for 2026. Bybit is the better pure-play derivatives venue. Most active traders will end up with both.

    Bybit Overview: The Derivatives Specialist

    Bybit launched in 2018 in the British Virgin Islands and rebuilt itself around perpetual futures during the 2020 derivatives boom. By the end of 2025 it was the second-largest exchange globally with roughly 9.5% market share and around $1.5 trillion in annual volume, according to CoinGecko data. As of April 2026, Bybit reports more than 70 million registered users and a 24-hour spot-plus-derivatives volume that regularly clears $54 billion.

    The platform is anchored by USDT and USDC perpetual contracts, but Bybit has also built out spot, options, copy trading, launchpad, P2P, and a respectable Web3 wallet. The brand is sponsorship-heavy (you have probably seen the logo on a Formula 1 car), and the UI is built for traders who want fewer clicks between a deposit and a position.

    It is worth being upfront about the elephant in the room: in February 2025, Bybit suffered a $1.5 billion ETH cold wallet exploit, the largest exchange hack in crypto history. The team made all users whole within hours by tapping a combination of reserves, a bridge loan, and post-mortem treasury operations. Twelve months later, market share has fully recovered and proof-of-reserves coverage is back above 100%. It is still a part of the story you should know.

    OKX Overview: The Web3 All-Rounder

    OKX (formerly OKEx) was founded in 2017 in the Seychelles and has since become the closest thing crypto has to a one-stop platform. As of early 2026 OKX serves over 50 million users, holds roughly 16% of centralized exchange spot volume, and runs a derivatives book that averages $42 billion in daily volume according to its Q1 2026 metrics.

    What separates OKX from the rest of the top 5 is the depth of its non-trading stack. The OKX Wallet is a non-custodial, multi-chain wallet supporting more than 100 blockchains, with a built-in DEX aggregator (X Routing), an NFT marketplace, and a dApp browser. The exchange also runs a staking marketplace, structured products, and a “Jumpstart” launchpad. In March 2026, ICE (the parent of the New York Stock Exchange) took a strategic stake at a $25 billion valuation and announced a joint plan to bring tokenized NYSE-listed equities to OKX users.

    OKX also has a cleaner regulatory record than most: it has never been hacked, holds a CertiK “AA” security score, and publishes monthly Proof-of-Reserves audits via Hacken. It did settle a $500 million U.S. compliance case in 2024, but that has since cleared the way for an aggressive U.S. relaunch with new fee tiers introduced in February 2026.

    Bybit vs OKX: Side-by-Side Comparison

    Bybit vs OKX side by side comparison table showing fees features and security

    Both exchanges are functionally world-class, but the small differences in fee structure and product breadth add up if you trade actively. Below is a closer look at where each one pulls ahead.

    Trading Fees: Where Every Basis Point Matters

    If you trade size, fees are the single biggest cost line you can control.

    Spot trading. Bybit charges 0.10% maker and 0.10% taker at the base tier, dropping to 0.06% / 0.08% at VIP 1 and as low as 0.01% / 0.03% at the top tiers. OKX is slightly cheaper out of the gate at 0.08% maker / 0.10% taker, with VIP rates dropping faster than Bybit at moderate volume. If you do less than $1 million a month in spot, the practical difference is a couple of basis points per round trip.

    Perpetual futures. This is where Bybit has historically held an edge. Base fees are 0.02% maker / 0.055% taker on Bybit versus 0.02% maker / 0.05% taker on OKX. OKX nominally has the lower taker fee at base tier, but Bybit’s VIP discounts kick in earlier on perpetual volume and frequent-trader rebates close the gap.

    Options. OKX is the clear winner. Standard tier options fees are 0.03% maker / 0.03% taker on OKX versus 0.02% maker / 0.03% taker on Bybit, but OKX’s order books are 3 to 5 times deeper on BTC and ETH options, which matters far more than the half-basis-point fee delta.

    Withdrawal fees. Both are free to deposit. Bybit uses fixed per-asset withdrawal fees, OKX scales by network. For USDT on TRC20, OKX charges 2.6 USDT versus a comparable 2 USDT on Bybit. For BTC on the native chain, OKX is 0.0004 BTC versus 0.0001 BTC on Bybit. Bybit is consistently a touch cheaper on withdrawals.

    Features Deep Dive

    Copy Trading

    Both exchanges offer copy trading and both treat it as a flagship product. OKX has the larger network at over 8,000 lead traders and a “Smart Sync” feature that automatically matches your position size to the leader. Bybit has fewer leads but its copy trading covers spot and derivatives natively in one terminal, which is genuinely rare. Slight edge: OKX for selection, Bybit for unified execution.

    Trading Bots

    OKX ships 12 pre-built strategies (Grid, DCA, Arbitrage, Recurring Buy, Smart Portfolio and more) and exposes a clean visual builder. Bybit offers Spot and Futures Grid bots and is rapidly catching up, but for a beginner who wants ready-made strategies, OKX is more turn-key.

    Web3 and DeFi

    This is OKX’s biggest moat. The OKX Wallet supports 100+ chains, runs a DEX aggregator that routes across 400+ DEXs, and integrates with an NFT marketplace and dApp browser. Bybit’s Web3 wallet exists, but it is shallower and feels bolted on. If you actually live on-chain, OKX is in a different league.

    Asset Coverage

    OKX lists 350+ cryptocurrencies and 500+ trading pairs. Bybit lists roughly 700 spot pairs and is faster to list memecoins and Solana ecosystem tokens. For early-stage Solana plays, Bybit usually gets there first.

    Earn and Yield

    OKX offers multi-token staking, structured products, and crypto-backed loans. Bybit has Bybit Earn with Flexible and Fixed savings but no native crypto loans product as of April 2026. Edge: OKX, especially for users who want everything inside one app.

    Security and Trust

    Both exchanges meet the modern bar: cold storage for the bulk of user funds, monthly Hacken-audited Proof-of-Reserves, two-factor authentication, withdrawal whitelists, and anti-phishing codes. Both publish reserve coverage above 100% on BTC, ETH, USDT and USDC.

    OKX has the cleaner historical record. It has never been hacked, holds CertiK’s “AA” rating (the highest possible), and stores more than 95% of user assets in geo-distributed offline wallets.

    Bybit’s February 2025 cold wallet exploit cost the exchange $1.5 billion in ETH, but the response (full reimbursement within 72 hours, transparent post-mortem, and a security overhaul that segregated cold and warm signing infrastructure) is widely considered best-in-class incident handling. As of April 2026, Bybit’s reserves are back over 100% and external auditors have cleared the new architecture. The hack matters historically; it is not a reason to avoid the exchange today.

    For data sources, you can verify reserve coverage via CoinGecko trust scores or directly through the published Hacken proof-of-reserves audits.

    User Experience

    Bybit’s interface is famously clean. New users land on a focused Spot/Derivatives toggle, the order entry panel hides advanced options behind a single click, and the mobile app is one of the smoothest in the industry. If you have never used a crypto exchange before, Bybit is the easier first day.

    OKX is denser. The trading interface is configurable, but the sheer surface area (Spot, Margin, Futures, Options, Convert, Earn, Bots, Copy Trade, Jumpstart, Wallet, NFT, DEX) means there is more to learn. For experienced users who want everything in one place, this is a feature, not a bug. For everyone else, expect a steeper learning curve.

    Both apps support biometric login, dark mode, and customizable layouts. Both push notifications work reliably. Bybit edges ahead on raw simplicity; OKX wins on flexibility.

    Who Wins for Each Trader Type?

    Bybit vs OKX winner by use case beginners derivatives copy trading Web3 compliance

    The honest answer to “which is better” depends entirely on what you want to do. The graphic above sums up the practical winners. In short: Bybit is the cleaner derivatives terminal, OKX is the more complete crypto platform.

    Pros and Cons

    Bybit

    Pros: Industry-leading perpetual futures liquidity, very low futures maker fees, exceptionally clean UI for new users, fast memecoin and Solana ecosystem listings, free spot trading via Alpha trading promotions, strong copy trading with unified spot and derivatives execution.

    Cons: Smaller options book than OKX, weaker Web3 wallet, no crypto-backed loans, history of the February 2025 hack (now resolved), restricted in several jurisdictions including the U.S.

    OKX

    Pros: Best-in-class Web3 stack with multi-chain wallet and DEX aggregator, deepest options order books outside Deribit, never hacked, CertiK AA rating, ICE-backed institutional credibility, full U.S. fee framework launched February 2026, broadest product surface (Earn, Bots, Loans, NFT, Jumpstart).

    Cons: Steeper UI for beginners, slightly higher BTC and USDT withdrawal fees, fewer fast-track memecoin listings than Bybit, $500 million U.S. compliance settlement on its record (now resolved).

    Final Verdict and Use-Case Recommendations

    If you want a single answer, OKX takes the 2026 crown as the better all-around exchange. The Web3 stack, options depth, and ICE-driven institutional roadmap simply give OKX more places to grow with you as your portfolio matures. The integrated wallet alone replaces three or four standalone tools.

    However, if you trade BTC and ETH perpetuals as your primary activity, Bybit is still the platform of choice. Lower futures fees at moderate volume, a faster UI for high-frequency entries, and unified copy trading make it a sharper tool for derivatives specialists.

    The smartest play for serious 2026 traders is to use both: Bybit for derivatives flow and OKX for spot, options, Web3 and yield. Custody is split, jurisdictional risk is hedged, and you get the best of both fee schedules.

    Ratings (April 2026): Bybit 4.5 / 5, OKX 4.7 / 5.

    FAQ

    Is OKX safer than Bybit in 2026?

    By historical record, yes. OKX has never been hacked and holds the highest CertiK security rating. Bybit recovered fully from its February 2025 cold wallet incident, and current reserve coverage is above 100%, but the historical scoreboard still favors OKX.

    Which exchange has lower fees, Bybit or OKX?

    For spot trading at the base tier, OKX is fractionally cheaper (0.08% / 0.10% vs 0.10% / 0.10%). For perpetual futures, OKX edges out at base tier (0.05% taker vs 0.055%), but Bybit’s VIP discounts kick in earlier and most active traders end up paying less on Bybit perps.

    Can I use Bybit or OKX in the United States?

    OKX launched a fully regulated U.S. platform in February 2026 with a dedicated fee framework. Bybit remains restricted for U.S. residents as of April 2026. If you are based in the U.S., OKX is currently the only one of the two you can use legally.

    Does either exchange support copy trading?

    Both do. OKX has more lead traders (8,000+) and a “Smart Sync” auto-matching feature. Bybit has a smaller leaderboard but is the only major exchange where copy trading covers both spot and derivatives in a single product.

    Which is better for beginners?

    Bybit. The UI is cleaner, the onboarding is shorter, and the mobile app is more focused. OKX is more powerful but has a much bigger feature surface to learn.

    For broader market context on Solana products and DeFi venues, see our deep dives on the best Solana DEXs of 2026 and the pump.fun launchpad review.

    Disclaimer: This article is for educational and informational purposes only. It is not financial advice. Cryptocurrency trading carries significant risk, including the potential loss of your entire investment. Always do your own research before using any platform.

    ApeCoin (APE) Price Prediction 2026: After 90% Surge

    ApeCoin (APE) just made one of the biggest single-day moves in its history. On April 24, 2026, the token surged nearly 90%. It went from around $0.10 to $0.19 in hours. As of April 28, APE is trading at $0.142, pulling back slightly from the peak but still up sharply on the week.

    The catalyst was a perfect storm. Yuga Labs named Michael Figge as its new CEO, right on the Bored Ape Yacht Club’s fifth anniversary. A whale placed a $1 million leveraged bet on APE just before the move. The combination sent trading volume spiking 2,130% in a single day, to nearly $300 million.

    That kind of move raises one obvious question: was this a genuine turning point, or just a short-term pump? Here is what the data says.

    ApeCoin APE price prediction 2026 hero graphic showing current price of $0.142

    What Is ApeCoin?

    ApeCoin is the governance and utility token for the APE ecosystem. It was launched in March 2022 by Yuga Labs, the company behind Bored Ape Yacht Club (BAYC) NFTs. Yuga Labs also created popular NFT collections like CryptoPunks and Mutant Ape Yacht Club.

    APE is used for governance votes, purchasing in-game assets, and participating in the APE ecosystem. The project runs on its own layer-2 chain, ApeChain, which launched in late 2024 to support gaming, DeFi, and NFT applications.

    Key metrics at time of writing:

    • Current price: $0.142
    • Market cap: approximately $164 million
    • Circulating supply: 1.15 billion APE
    • 24-hour volume: approximately $70 million
    • All-time high: $26.70 (April 2022)

    You can track live APE price data on CoinGecko.

    The April 2026 Catalyst: What Actually Happened

    The APE surge on April 24 had three overlapping triggers.

    First, Yuga Labs announced Michael Figge as CEO. Figge’s appointment is the most concrete leadership signal the company has sent in over a year. It came on BAYC’s fifth anniversary, which amplified media coverage and social momentum significantly.

    Second, a large whale made a bold directional bet. A newly created wallet sold 75 ETH and opened a 5x leveraged long on 9.19 million APE, worth over $1 million, via Hyperliquid. This bet came just before the price started moving. Whether it was front-running or coincidence, it acted as a signal to the broader market.

    Third, sentiment was already recovering. In mid-2025, the ApeCoin community voted 99.66% in favor of dissolving the DAO and handing control to ApeCo, a centralized entity led by Yuga Labs. While controversial, it ended years of slow, noisy governance. Faster decision-making is now possible.

    These three factors converged on a day with high market liquidity. The result was a 90% move.

    Technical Analysis: What the Chart Is Saying

    APE’s surge broke it above three significant resistance levels in a single session. The RSI (Relative Strength Index) hit heavily overbought territory above 80 on April 24. It has since cooled to around 58, which is a healthier reading. Not overbought, not oversold.

    The key support level to watch now is $0.12. That is where APE spent most of March and early April 2026. If this level holds, the recent move has a foundation to build on. If it breaks, APE could revisit the $0.08 range.

    Resistance sits at $0.19 to $0.22, which is the zone from the April 24 spike high. A clean break above $0.22 on strong volume would be a bullish signal. The MACD (Moving Average Convergence Divergence) is showing a fresh bullish crossover for the first time since January 2026. That adds some weight to the short-term case.

    Our hybrid AI model currently assigns a 55% probability that APE holds above $0.12 over the next 30 days, and a 38% probability of reaching $0.20 or higher in that same window.

    The Bull Case for APE

    Here is what needs to go right for APE to maintain and extend these gains.

    New leadership with a clear mandate. Michael Figge entering as CEO signals that Yuga Labs is in execution mode. If ApeChain sees real product launches, gaming integrations, and DeFi activity under his tenure, that creates genuine demand for APE beyond speculation.

    ApeChain adoption has room to grow. Total Value Locked (TVL) on ApeChain dropped over 80% from its peak. That is a low base. Any meaningful recovery in on-chain activity directly supports APE token demand through transaction fees and ecosystem usage.

    NFT market recovery. APE is deeply tied to the fortunes of BAYC and the broader NFT ecosystem. Crypto markets have been recovering through Q1 2026. If blue-chip NFT floors follow, APE benefits directly.

    Low market cap, high upside leverage. At $164 million market cap, APE does not need much capital inflow to move the price materially. In a bull market environment, this can work strongly in its favor.

    If these factors align, our model puts a bull case target at $0.65 within six months, representing roughly 4x from current levels.

    The Bear Case for APE

    There are real reasons to be cautious here.

    Most of the move may already be priced in. A 90% single-day move driven partly by a leveraged whale bet is not the same as organic, sustained buying. If Figge fails to deliver visible progress in the next 90 days, sellers will return quickly.

    Token unlock pressure is ongoing. A large portion of APE’s supply was scheduled for unlock through 2026. That creates persistent sell pressure unless demand grows to absorb it. Token unlock schedules have historically suppressed recoveries for many layer-2 and ecosystem tokens.

    ApeChain has not proven product-market fit. TVL down 80% from peak is a real number. Daily active addresses remain in a narrow range near 10,000. For comparison, leading DeFi protocols see millions of transactions. The gap between potential and reality is still large.

    NFT markets remain volatile. Even if Yuga Labs improves execution, NFT demand is closely correlated with overall crypto sentiment. A macro downturn could hit BAYC floors and APE simultaneously.

    In a bear scenario, our model targets $0.09 to $0.12 over the next 30 days if $0.12 support fails to hold.

    For a comparison with other NFT-adjacent tokens navigating similar recovery setups, see our Pudgy Penguins (PENGU) Price Prediction 2026 analysis.

    APE Price Prediction Summary

    Here is our AI model’s price prediction framework for APE across three timeframes. These are scenario-based targets, not guarantees.

    ApeCoin APE price prediction table showing bear base and bull targets for short term mid term and long term

    Short-term (30 days): The key question is whether $0.12 holds as support. If it does, a retest of $0.18 to $0.20 is reasonable. If macro conditions soften or no new Yuga Labs announcements follow, APE could slide back to $0.09.

    Mid-term (6 months): Much depends on ApeChain traction. Base case is $0.38, representing steady accumulation on positive news. Bull case of $0.65 requires real ecosystem growth. Bear case of $0.12 assumes news fades and supply pressure wins.

    Long-term (2027-2028): This is the highest-uncertainty window. If ApeChain becomes a meaningful gaming and NFT platform, APE at $0.60 to $1.25 is plausible. If adoption stalls, APE may drift and be outcompeted by more active ecosystems. Bear case remains $0.18 with minimal catalyst.

    What to Watch

    Here are the key signals to monitor over the next 90 days.

    • Michael Figge’s first public roadmap announcement. New CEOs usually communicate priorities within 60 to 90 days. Any concrete product commitments will move the price.
    • ApeChain TVL trend. Watch for a reversal from the 80% decline. Even modest growth back toward $50M TVL would be a positive signal.
    • $0.12 support level. This is the line in the sand for short-term holders. A weekly close below $0.12 changes the picture materially.
    • BAYC floor price. APE and BAYC NFT prices are correlated. A floor price recovery above 10 ETH would be a positive signal for APE demand.
    • Broader crypto market conditions. Bitcoin holding above $65,000 provides the macro environment APE needs to attract speculative capital.

    Our Take

    The April 24 surge is real, but it came fast and partly from a single large leveraged trade. That combination often leads to a cooling-off period. The $0.12 to $0.14 zone is where APE needs to prove itself over the next few weeks.

    The leadership change at Yuga Labs is the most substantive positive catalyst APE has had in years. But catalysts alone do not sustain prices. Execution does. If Figge delivers product milestones and ApeChain starts growing again, the longer-term case becomes interesting. If it is business as usual with new branding, the move will fade.

    Short-term: cautiously neutral. Medium-term: worth watching closely. Long-term: high risk, meaningful upside only if execution improves.

    Disclaimer: This article is for informational and educational purposes only and should not be construed as financial, investment, or trading advice. Cryptocurrency markets are highly volatile, and past performance does not guarantee future results. The price predictions and analyses presented here are based on AI models, technical indicators, and available data at the time of writing. They are not guarantees. Always conduct your own research (DYOR) and consult with a qualified financial advisor before making any investment decisions. Pump Parade and its authors do not assume liability for financial losses incurred based on information provided in this article.

    About our AI predictions: Pump Parade’s price predictions are generated by machine learning models that analyze technical indicators, on-chain data, and market sentiment. These models have limitations and cannot account for black swan events, regulatory changes, or sudden market shifts. Use AI predictions as one input among many in your research.