More
    Home Blog Page 22

    Hyperliquid (HYPE) Price Prediction 2026: Can It Hit $150?

    0
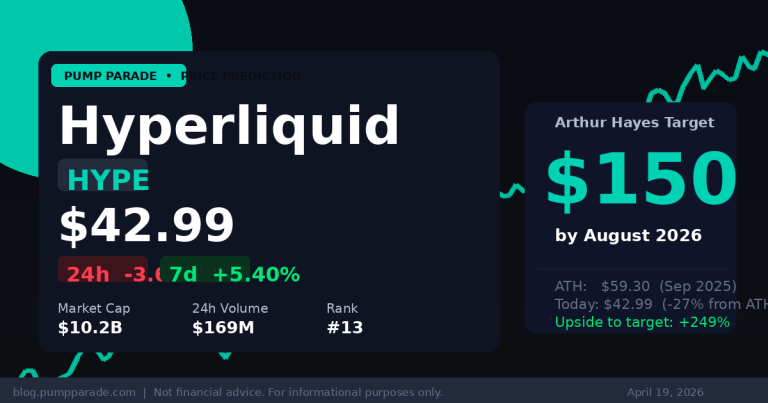
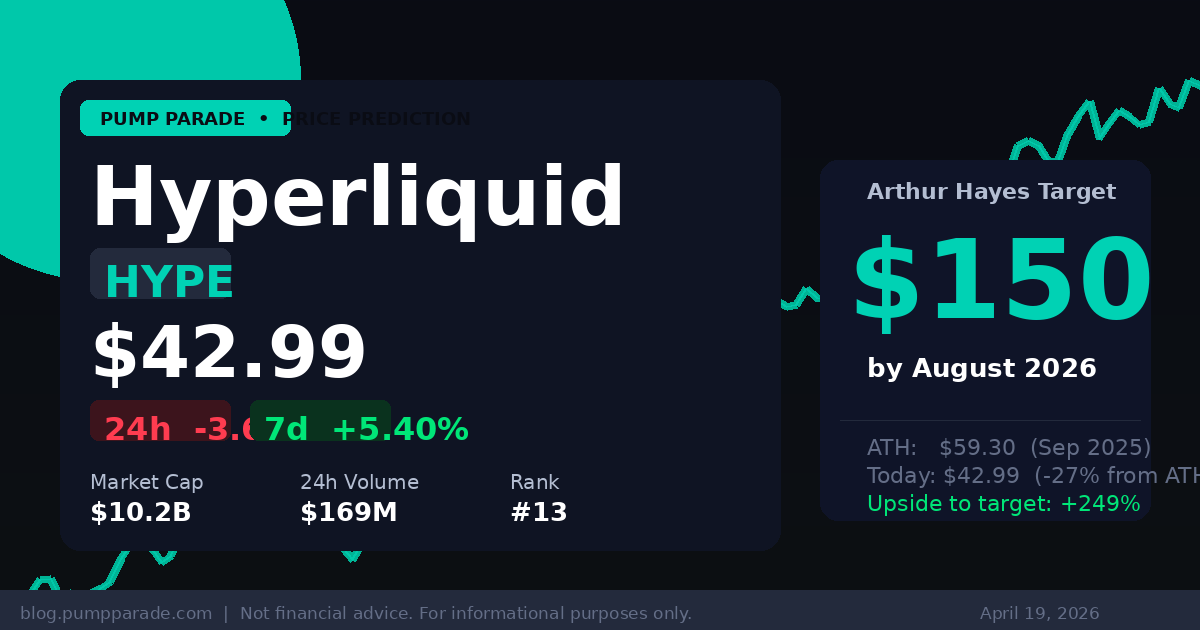
    Hyperliquid HYPE price prediction 2026 hero image showing current price and Arthur Hayes $150 target

    Hyperliquid (HYPE) is trading at $42.99 as of April 19, 2026. That puts it 27% below its all-time high of $59.30 from September 2025. But the token is far from forgotten. BitMEX co-founder Arthur Hayes has publicly predicted HYPE will reach $150 by August 2026. That would be a 249% gain from today’s price.

    Is that realistic? Let’s look at the data, the catalysts, and the risks before drawing any conclusions.

    What Is Hyperliquid?

    Hyperliquid is a decentralized perpetuals exchange built on its own layer-1 blockchain. It offers on-chain order books, sub-second trade finality, and zero gas fees for traders. Think of it as a fully decentralized version of a centralized exchange like Binance or Bybit. The key difference: Hyperliquid runs entirely on-chain. There is no central authority controlling the matching engine.

    The HYPE token powers the protocol. It is used for fee discounts, governance, and a buyback mechanism that burns tokens as trading volume grows. According to CoinGecko, HYPE has a circulating supply of roughly 238 million tokens and a market cap of $10.2 billion, ranking it #13 among all cryptocurrencies.

    Current Market Position

    Here are the key numbers at time of writing:

    • Current price: $42.99
    • 24-hour change: -3.63%
    • 7-day change: +5.40%
    • 30-day change: +7.74%
    • Market cap: $10.2 billion
    • 24-hour trading volume: $169 million
    • All-time high: $59.30 (September 18, 2025)
    • All-time low: $3.81

    Hyperliquid currently holds approximately 44% market share in the decentralized perpetuals sector. Its nearest competitor has open interest of $899 million. Hyperliquid’s open interest sits at $5.15 billion. The gap is significant.

    Key Catalysts for 2026

    Arthur Hayes Goes Public With a $150 Target

    Arthur Hayes is one of the most closely watched names in crypto. The BitMEX co-founder is not known for quiet predictions. In March 2026, he publicly stated that HYPE would reach $150 by August 2026. He also put money behind the call. Hayes purchased 26,022 HYPE tokens for approximately $1.1 million, bringing his total holdings to 247,334 tokens.

    His thesis centers on HIP-4. That is Hyperliquid’s upcoming binary options trading upgrade. Hayes argues that binary options create a high-turnover trading environment. More turnover means more protocol fee revenue. More fee revenue accelerates the token buyback mechanism. That creates sustained buy pressure on HYPE.

    HIP-4 Binary Options Trading

    HIP-4 is currently in testnet. It introduces binary options markets directly on Hyperliquid’s infrastructure. Traders can take yes/no positions on price outcomes. It is a product type with massive retail appeal. The feature is expected to launch on mainnet in two phases. First, curated canonical markets. Second, permissionless builder deployment for any market creator.

    No mainnet date has been officially confirmed. But the testnet phase is live. The closer HIP-4 gets to mainnet, the more likely it is to act as a price catalyst for HYPE.

    CFTC Moves Toward Onshoring DEXs

    On April 17, 2026, the U.S. Commodity Futures Trading Commission announced plans to bring decentralized exchanges like Hyperliquid under its regulatory jurisdiction. This is a double-edged development. In the short term, regulatory scrutiny can cause volatility. In the longer term, formal CFTC oversight could open Hyperliquid’s markets to American institutional traders. That is a large and currently underserved market.

    Deflationary Buyback Mechanism

    As trading volume on Hyperliquid grows, a portion of protocol fees goes toward buying and burning HYPE tokens. This is structurally similar to Ethereum’s EIP-1559 burn mechanism. With daily volume running at $8 to $12 billion, the buyback creates constant demand-side pressure. If HIP-4 drives volume higher, the burn rate accelerates.

    Technical Analysis

    HYPE is currently trading in the $42 to $45 range. Key support sits at $40. That level has held through two separate tests over the past 30 days. Below $40, the next significant support zone is around $35 to $36.

    On the upside, HYPE faces its first meaningful resistance at $50. That is a round number with prior consolidation activity. Beyond $50, the path toward the all-time high at $59.30 opens up. A clean break above $59 would put HYPE in price discovery, with no overhead supply acting as resistance.

    The 7-day chart shows steady accumulation. The 30-day trend is positive at +7.74%. The overall picture is one of a token that has found a floor and is building a base. It is not running hot. This is a measured setup, not a parabolic one.

    Our AI model assigns a 58% probability that HYPE retests its all-time high of $59.30 within the next 90 days. That probability rises to 72% if HIP-4 mainnet launches before June 2026.

    The Bull Case

    The bull thesis for HYPE rests on three pillars.

    First, protocol dominance. Hyperliquid’s $5.15 billion in open interest dwarfs competitors. It has built a network effect that is hard to dislodge. Traders go where the liquidity is, and right now that is Hyperliquid.

    Second, the HIP-4 volume multiplier. Binary options are high-frequency, high-turnover products. If they attract even a fraction of retail demand from traditional prediction markets, the volume impact could be large. More volume means more buybacks means structurally higher HYPE prices.

    Third, institutional access expansion. CFTC oversight, if handled well, could unlock U.S. institutional capital. That is not priced into HYPE at current levels.

    Bull price targets: $65 in 30 days, $120 in 6 months, $150 to $200 by end of 2027.

    The Bear Case

    The bear case is also real. Here is what could go wrong.

    Regulatory risk: CFTC oversight cuts both ways. If the regulator imposes restrictive requirements, it could limit Hyperliquid’s user base. Geoblocking U.S. users to avoid compliance costs would hurt volume.

    HIP-4 delay risk: The mainnet timeline is unconfirmed. If launch is pushed back to late 2026 or 2027, the catalyst-driven rally may not materialize on Hayes’s August timeline.

    Macro risk: The broader crypto market is still dealing with a Fear and Greed Index at 9 out of 100. In a broad-market selloff, even strong-fundamental tokens get dragged down. If Bitcoin breaks below major support, HYPE could test the $28 to $32 range.

    Competition risk: Decentralized perpetuals is not a winner-take-all market. A well-funded competitor could erode Hyperliquid’s market share. It has happened before in DeFi.

    Bear price targets: $32 in 30 days, $28 over 6 months if macro deteriorates sharply.

    For more context on how macro conditions are shaping the broader market, see our Bitcoin (BTC) Price Prediction for 2028 analysis, which covers the key drivers that tend to move the entire crypto market.

    AI Price Prediction Summary
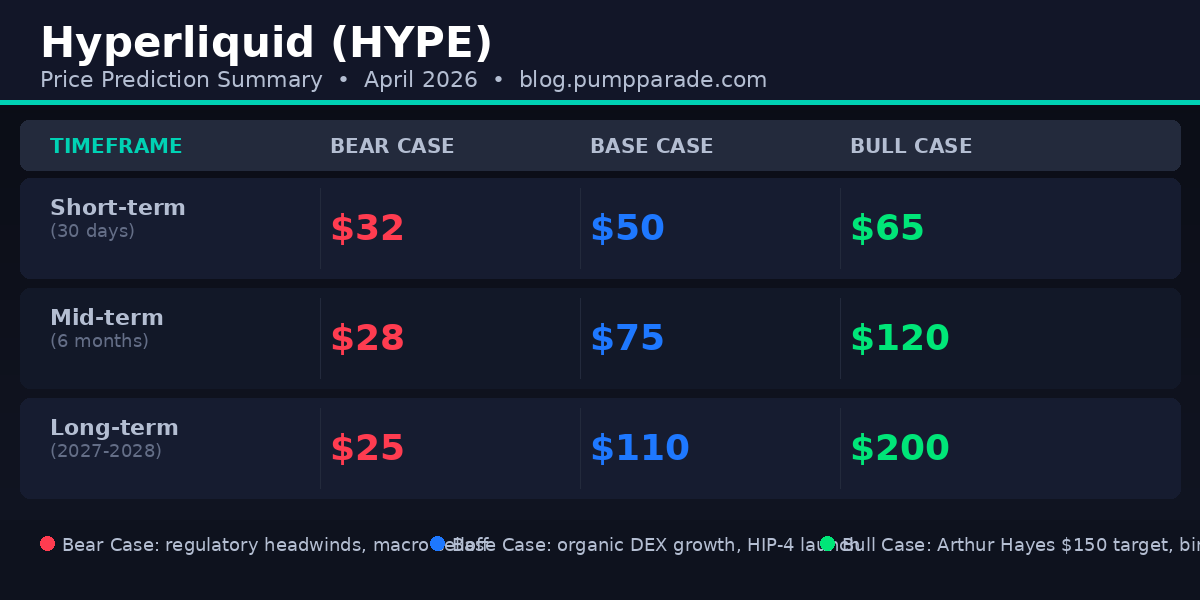
    Hyperliquid HYPE price prediction table showing bear, base, and bull case targets for 30 days, 6 months, and 2027-2028

    Our hybrid AI model synthesizes technical indicators, on-chain data, and market sentiment to produce the following price targets. These are probability-weighted scenarios, not guarantees.

    Short-Term (30 Days)

    • Bear case: $32 (macro selloff, support breaks)
    • Base case: $50 (continued accumulation, approach ATH resistance)
    • Bull case: $65 (HIP-4 mainnet announcement, momentum spike)

    Mid-Term (6 Months)

    • Bear case: $28 (regulatory clampdown, volume decline)
    • Base case: $75 (ATH broken, HIP-4 live, steady volume growth)
    • Bull case: $120 (binary options volume surge, institutional access opens)

    Long-Term (2027 to 2028)

    • Bear case: $25 (competition erodes market share, DeFi rotation)
    • Base case: $110 (dominant DEX protocol with diversified product suite)
    • Bull case: $200 (market cap approaches $50B, sector-defining protocol)

    The model’s confidence score for reaching $65 or above within 6 months is 61%, contingent on HIP-4 mainnet launch before Q3 2026.

    What to Watch

    Three things are worth monitoring closely:

    1. HIP-4 mainnet date: Any official announcement will likely trigger a sharp move. Watch Hyperliquid’s official channels and on-chain governance activity.
    2. The $50 resistance level: A weekly close above $50 would shift the technical picture decisively bullish. A rejection at $50 could mean more sideways action through Q2.
    3. Regulatory developments: CFTC public comment periods and any formal rule proposals will be market-moving events. Positive framing from regulators is a tailwind. Punitive rules are a headwind.

    Final Take

    Hyperliquid is a genuine protocol with real product-market fit. It is the dominant on-chain derivatives venue, and its token reflects that dominance with a $10.2 billion market cap. The HIP-4 binary options upgrade is a real catalyst with a credible volume thesis behind it.

    Arthur Hayes calling $150 is bold. Getting there from $43 requires a 249% move in roughly four months. That is aggressive by any measure. But the structural case for HYPE is stronger than most tokens in the top 15.

    The base case of $75 by end of 2026 seems achievable if the macro environment stabilizes and HIP-4 ships on schedule. The bear case of $28 to $32 is the scenario where macro falls apart or the regulatory situation turns hostile.

    This is a protocol worth watching carefully. The next 90 days will likely tell us whether Hayes’s target is bold analysis or wishful thinking.


    Disclaimer: This article is for informational and educational purposes only and should not be construed as financial, investment, or trading advice. Cryptocurrency markets are highly volatile, and past performance does not guarantee future results. The price predictions and analyses presented here are based on AI models, technical indicators, and available data at the time of writing. They are not guarantees. Always conduct your own research (DYOR) and consult with a qualified financial advisor before making any investment decisions. Pump Parade and its authors do not assume liability for financial losses incurred based on information provided in this article.

    About our AI predictions: Pump Parade’s price predictions are generated by machine learning models that analyze technical indicators, on-chain data, and market sentiment. These models have limitations and cannot account for black swan events, regulatory changes, or sudden market shifts. Prediction confidence scores reflect the model’s internal assessment, not guaranteed accuracy. Use AI predictions as one input among many in your research.


    $28 Trillion in 90 Days: Inside Stablecoins’ Record Q1 and the Bot Economy Driving It

    Stablecoins Q1 2026 - $28 Trillion and the Bot Economy

    The stablecoin market just posted its biggest quarter ever. But the real story isn’t the volume – it’s who’s generating it.

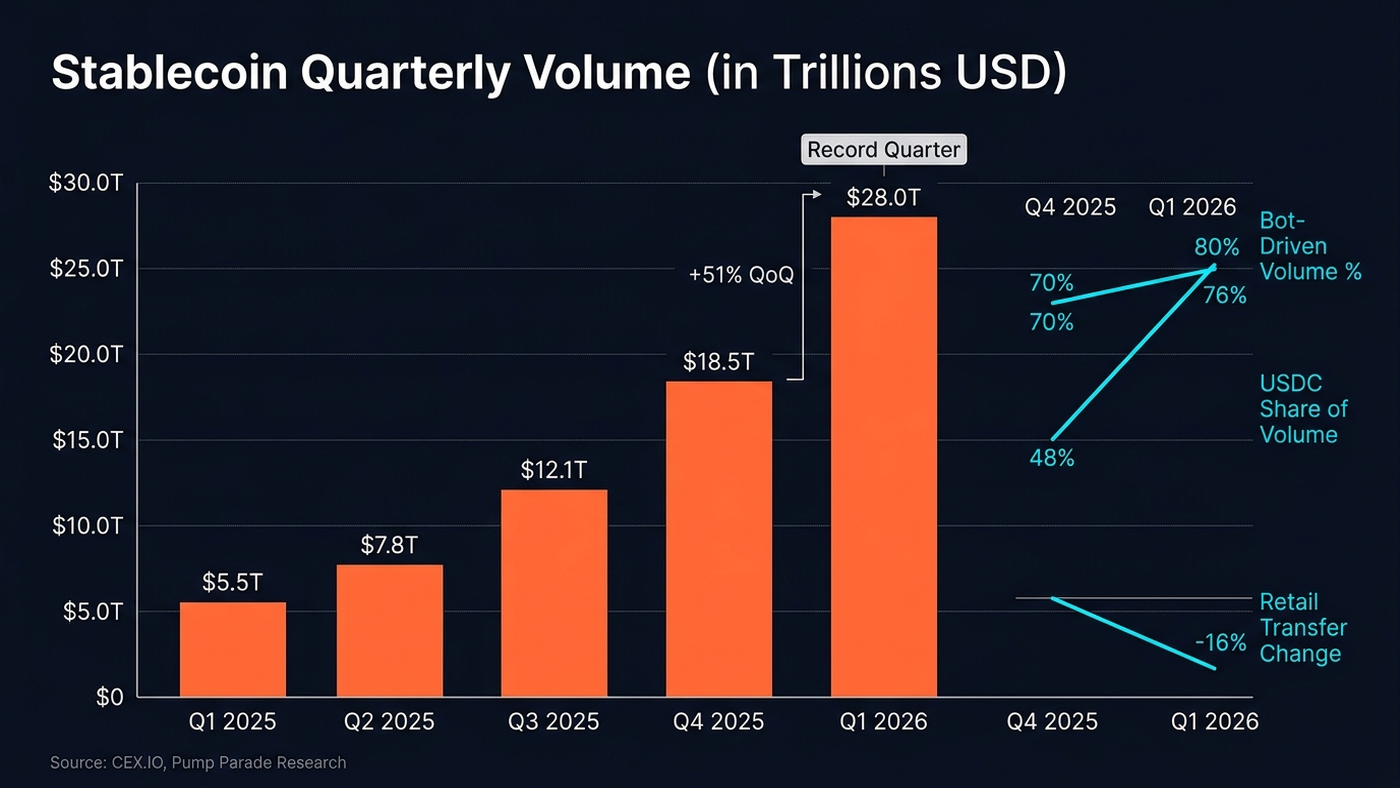
    Twenty-eight trillion dollars. That’s how much value moved through stablecoins in the first quarter of 2026 – a 51% jump from Q4 2025 and more than the GDP of every country on Earth except the United States and China. In a single quarter, stablecoins processed nearly double Visa’s entire annual transaction volume.

    And yet, here’s the number that should actually stop you: 76% of that volume was generated by bots.

    Not people sending money. Not remittance users in Lagos or traders in Seoul. Bots – arbitrage algorithms, MEV extractors, automated settlement engines, and DeFi yield optimizers running 24/7 across Ethereum, Tron, and Solana. Meanwhile, retail stablecoin transfers dropped 16% in Q1, the steepest decline on record. The stablecoin economy is booming. The human stablecoin economy is shrinking.

    This isn’t a scandal. It’s a structural transformation – and it changes what “stablecoin adoption” actually means.

    The Quarter in Context

    Stablecoin transaction volume hit $28 trillion in Q1 2026, according to CEX.IO’s quarterly report. For context, total stablecoin volume for all of 2025 was $33 trillion. We’re on pace to nearly quadruple that in 2026.

    Total stablecoin supply crossed $315 billion by the end of Q1 and has since pushed past $320 billion as of mid-April 2026. Stablecoin trading volume accounted for 75% of all crypto trading volume in Q1 – the highest share ever recorded.

    The growth isn’t spread evenly. USDC had a breakout quarter. USDT didn’t.

    USDC vs USDT Q1 2026 Comparison

    USDC’s share of stablecoin financial operations surged from 48% to 58% in a single quarter. It now handles 80% of total transaction volume despite having less than half of USDT’s market cap. For the first time since 2019, USDC overtook USDT in organic (adjusted) transaction volume, capturing roughly 63% of organic volume on an annualized basis, per Analytics Insight.

    USDT’s organic volume, meanwhile, declined 17% – one of its steepest drops on record.

    The volume-versus-market-cap divergence is the story here. USDT remains dominant in raw supply. But USDC is becoming the default rails for institutional settlement and automated infrastructure.

    The Bot Economy Nobody’s Talking About

    Here’s where the data gets interesting – and uncomfortable.

    Approximately 76% of all stablecoin transaction volume in Q1 2026 was bot-driven, up from 70% in Q4 2025 and the highest level since Q2 2024. For USDC specifically, the number is even starker: 85% of its volume comes from automated systems.

    Ethereum recorded its highest-ever level of bot-driven stablecoin activity at 72%. Tron hit 54%. Both were all-time highs.

    What are these bots actually doing?

    They’re not wash trading or manipulating prices (though some inevitably are). The majority of bot-driven stablecoin volume falls into a few categories: arbitrage across DEX pools and CEX order books, MEV (Maximal Extractable Value) extraction on Ethereum, automated DeFi yield optimization and vault rebalancing, institutional settlement and treasury management, and increasingly, AI agent wallet transactions – autonomous software agents using stablecoins to pay for compute, data, and services.

    This is infrastructure activity. The same way high-frequency trading dominates traditional equity markets (estimates suggest 50-70% of US stock volume is algorithmic), stablecoins are becoming the settlement layer for an increasingly automated financial system.

    The uncomfortable implication: when someone cites “$28 trillion in stablecoin volume” as proof of mainstream adoption, they need an asterisk. The volume is real. The growth is real. But the majority of it represents machine-to-machine transactions, not person-to-person payments.

    Retail is moving in the opposite direction. Retail-sized stablecoin transfers fell 16% in Q1 2026 – the largest decline on record, per CEX.IO’s data. Fewer individual humans are transacting with stablecoins even as total volume hits record highs. The gap between infrastructure adoption and consumer adoption is widening, not closing.

    USDC vs. USDT: They’re Becoming Different Products

    The volume flip tells a bigger story than which stablecoin is “winning.” USDC and USDT are diverging into functionally different products serving different markets.

    USDC is becoming institutional plumbing. Its dominance in bot-driven volume (85%), its regulatory positioning under the incoming GENIUS Act framework (Circle is a US-regulated entity), and its growing use in automated settlement make it the default for institutional and programmatic use cases. When banks, trading firms, and DeFi protocols need a stablecoin that won’t create regulatory headaches, they reach for USDC.

    USDT remains the retail and emerging-market standard. Its $185 billion market cap – more than double USDC’s – reflects its dominance in retail trading pairs on centralized exchanges and its role in cross-border remittances, particularly across Asia, Africa, and Latin America. In markets where regulatory clarity matters less than availability and liquidity, USDT is still king.

    The regulatory landscape is accelerating this split. The GENIUS Act – which saw new proposed rules from both the FDIC and Treasury in April 2026 – establishes a federal framework for “permitted payment stablecoin issuers” with strict reserve, redemption, and AML requirements. The FDIC’s April 7 proposal requires stablecoin redemption within two business days and mandates custodial safekeeping standards. Circle, already US-regulated, is positioned to comply seamlessly. Tether, incorporated in the British Virgin Islands, faces a different calculation.

    Meanwhile in the EU, MiCA enforcement has already pushed USDT off European exchanges. As both frameworks tighten through 2026, the USDC-for-institutions, USDT-for-retail split will likely deepen.

    Where the Stablecoins Live

    The chain distribution of stablecoin supply adds another layer to this story.

    Stablecoin Quarterly Volume Q1 2025 to Q1 2026

    Ethereum still holds the majority of stablecoin supply – roughly $180 billion – but it’s bleeding outflows. In February 2026, Ethereum recorded its largest net stablecoin outflow on record, losing over $2 billion. Tron, by contrast, added $1.6 billion in the same month, driven almost entirely by USDT.

    Solana quietly emerged as the second-largest net gainer, adding an estimated $700-900 million in stablecoin supply in February – though the Drift Protocol exploit in April ($285 million drained) may cool institutional confidence in Solana DeFi near-term.

    The chain story mirrors the USDC/USDT split: Ethereum and its L2s (particularly Base) are becoming USDC’s domain. Tron is USDT territory. Solana is contested ground.

    The Bull Case and the Bear Case

    The bull case is structural.

    $28 trillion in quarterly volume isn’t speculation – it’s infrastructure adoption. Stablecoins now process more value per quarter than Visa handles in an entire year (Visa’s fiscal year 2025 volume was approximately $16.7 trillion). The GENIUS Act and MiCA are bringing regulatory clarity that will attract bank-issued stablecoins and institutional capital. Bot-driven volume isn’t fake – it’s the foundation of a programmable financial system. And the shift is accelerating: stablecoin supply grew $8 billion in Q1 alone, pushing past $315 billion.

    The conviction version: stablecoins are becoming the settlement layer of digital finance, and Q1 2026 is the quarter the data made that undeniable.

    The bear case is compositional.

    When 76% of volume is automated and retail transfers are declining at record pace, “adoption” doesn’t mean what most people think it means. If bot activity contracts – whether from regulatory crackdowns on MEV, a DeFi volume decline, or reduced arbitrage opportunities in a less volatile market – the headline volume numbers could drop dramatically. High automation also concentrates value extraction in sophisticated operators, not everyday users. The stablecoin economy is growing, but the benefits are accruing disproportionately to infrastructure players, not the retail users that adoption narratives typically promise.

    And there’s a fragility risk: USDC’s 80% volume share means a single regulatory action against Circle – or a technical failure on Ethereum – could disrupt the majority of stablecoin settlement.

    The Takeaway

    The $28 trillion quarter is real, and it matters. Stablecoins are no longer an experiment – they’re processing more value than most traditional financial networks. But the composition of that volume should change how we talk about stablecoin adoption.

    When three-quarters of the volume is bots and retail activity is declining, the stablecoin revolution is real – it’s just not the one that was advertised. It’s an infrastructure revolution, not a payments revolution. At least, not yet.

    The traders, builders, and holders who understand the difference between headline volume and organic adoption will be better positioned as both the GENIUS Act and MiCA reshape the rules this summer.

    Stablecoins aren’t replacing banks. They’re becoming the plumbing that banks, bots, and protocols all run on. That’s arguably more important – even if it’s less exciting to tweet about.

    Related: USDC Just Passed USDT in Volume. Now Regulators Are Picking Sides.


    Disclaimer: This article is for informational and educational purposes only and should not be construed as financial, investment, or trading advice. Cryptocurrency markets are highly volatile, and past performance does not guarantee future results. The analyses presented here are based on AI models, technical indicators, and available data at the time of writing – they are not guarantees. Always conduct your own research (DYOR) and consult with a qualified financial advisor before making any investment decisions. Pump Parade and its authors do not assume liability for financial losses incurred based on information provided in this article.


    Research Sources


    Pump Parade is an AI-powered crypto research platform. We combine real-time price predictions, technical analysis tools, and editorial content to help traders make smarter, data-backed decisions.

    Try our tools: pumpparade.com | Follow us: @PumpParade

    Ethereum (ETH) Price Prediction 2026: Can ETH Hit $3K?

    0
    Ethereum ETH price prediction 2026 hero image showing current price $2,330

    Ethereum (ETH) is trading at $2,330 as of April 19, 2026. That is down sharply from the highs it touched after the Pectra upgrade activated in May 2025. The weekly RSI (Relative Strength Index) sits near 30. Historically, that level has marked Ethereum’s cyclical price floors.

    So here is the real question: is ETH in a deep accumulation phase, or is this a prolonged breakdown? The data points in two directions. That is exactly why this is worth analyzing right now.

    In this article, we break down the current market setup, the technical picture, the key catalysts, and what our AI model assigns as price targets across three timeframes. We also cover the bear case, because ignoring downside risk is how traders get hurt.

    What Is Ethereum?

    Ethereum is the world’s second-largest cryptocurrency by market capitalization. It is a programmable blockchain that hosts decentralized applications, smart contracts, DeFi protocols, NFTs, and stablecoins.

    Think of it as the internet’s settlement layer for digital finance. Bitcoin stores value. Ethereum runs programs. That distinction is why Ethereum’s total addressable market is so large.

    According to CoinMarketCap, ETH has a circulating supply of approximately 120 million coins and a current market cap of around $280.7 billion. That makes it the most valuable smart contract platform by a significant margin.

    Current Price and Market Context

    ETH closed the week of April 14-19 at $2,330, up 5.5% over seven days but down roughly 55% from its 2025 all-time high zone. The 24-hour trading volume is approximately $19.25 billion.

    Here is the context that matters. Ethereum ran aggressively after the Pectra upgrade went live on May 7, 2025. It posted a 20% weekly gain, its largest in over four years. Since then, the market has digested that move. Price has settled into a wide consolidation range between $2,100 and $2,400.

    That range has held for over two months. A decisive break above $2,400 or below $2,100 would define the next leg.

    The Pectra Upgrade: Why It Still Matters

    Pectra was Ethereum’s most significant protocol upgrade since the Merge in 2022. It combined two coordinated hard forks: Prague on the execution layer and Electra on the consensus layer.

    Three changes stand out for long-term ETH valuation:

    • Maximum stake raised from 32 ETH to 2,048 ETH. Institutions no longer need to manage hundreds of separate validators. This dramatically reduces staking friction for large capital allocators.
    • Validator activation time cut from 13 hours to 13 minutes. New ETH entering the staking system deploys faster. This improves capital efficiency across the ecosystem.
    • EIP-7702 enables smart account functionality. Standard wallets can now temporarily act as smart contracts. Users can pay gas fees in stablecoins instead of ETH. This is a meaningful step toward mainstream usability.

    Standard Chartered cited these changes as the primary driver behind their updated price target of $15,000 for ETH by 2027. That is not a fringe prediction. It comes from one of the world’s largest banks.

    Looking ahead, the PeerDAS upgrade is scheduled for later in 2026. PeerDAS will dramatically increase data availability bandwidth for Layer 2 rollups. More L2 activity means more ETH burned, and more burned ETH means deflationary pressure on the supply.

    Technical Analysis

    Let us look at what the chart is actually saying.

    The 14-day RSI sits at approximately 39. That is above oversold territory (below 30) but clearly weak. Momentum has not turned bullish yet.

    The weekly RSI is more interesting. It is hovering near 30. In every Ethereum market cycle since 2018, a weekly RSI at or below 30 has coincided with a price floor, not a further collapse. That does not guarantee a bottom here. It does suggest the risk-reward for patient accumulators is historically favorable.

    Key levels to watch:

    • Immediate resistance: $2,230 (recent trading high). A sustained close above this level opens the door to $2,600.
    • Key support: $2,056. A weekly close below this level would shift the short-term trend from neutral to bearish.
    • Major support: $1,800 to $1,900. This is the next structural floor if the $2,056 level fails.

    The 50-day moving average is sitting above the current price, acting as overhead resistance near $2,450. ETH would need to reclaim and hold above that level to signal a proper trend reversal.

    Compare this to our Bitcoin (BTC) price prediction for 2026, where BTC faces a similar consolidation pattern. When BTC breaks its range, Ethereum historically follows, often with amplified magnitude.

    The Bull Case for Ethereum in 2026

    Here is what has to go right for ETH to push significantly higher.

    First, the PeerDAS upgrade delivers as expected. If L2 activity surges post-PeerDAS, ETH burn rates could accelerate. A deflationary supply shock combined with growing staking demand would tighten circulating supply significantly.

    Second, staked ETH ETF products gain traction. Several asset managers filed for spot ETH ETF products with staking yield in late 2025. If those products reach the market in 2026, they would pull significant ETH off exchanges and into long-term lockup.

    Third, BTC leads a broad market rally. ETH has historically multiplied BTC’s gains by a factor of 1.5x to 3x during bull phases. If BTC reclaims $90K-$100K, Ethereum at $5,000 to $6,000 is a reasonable base case, not an optimistic stretch.

    Our AI model assigns a 65% probability of ETH reaching $3,200 within 30 days if it can break and hold above $2,400 on strong volume.

    The Bear Case: What Could Go Wrong

    Crypto is full of confident predictions that aged poorly. Here is the honest risk picture.

    Ethereum has lost significant market share to Solana and other high-performance chains over the past 18 months. If L2 fragmentation continues and ETH burn rates stay low, the deflationary narrative weakens.

    Macro conditions remain uncertain. If the broader risk asset environment deteriorates, ETH could revisit the $1,800 to $1,900 support zone. A break below $1,800 would invalidate the current accumulation thesis entirely.

    There is also competition risk. New Layer 1 blockchains are shipping faster upgrades with fewer coordination headaches. Ethereum’s governance process is methodical but slow. That creates windows for competitors to capture developer mindshare.

    Bearish scenario: if key support at $2,056 fails on a weekly close, the next technical target is $1,900. A macro shock could push it to $1,600 in a worst-case scenario.

    AI Price Prediction Summary

    Our hybrid AI model combines technical indicators, on-chain data, historical cycle analysis, and sentiment signals. Here are the outputs for three timeframes as of April 19, 2026.

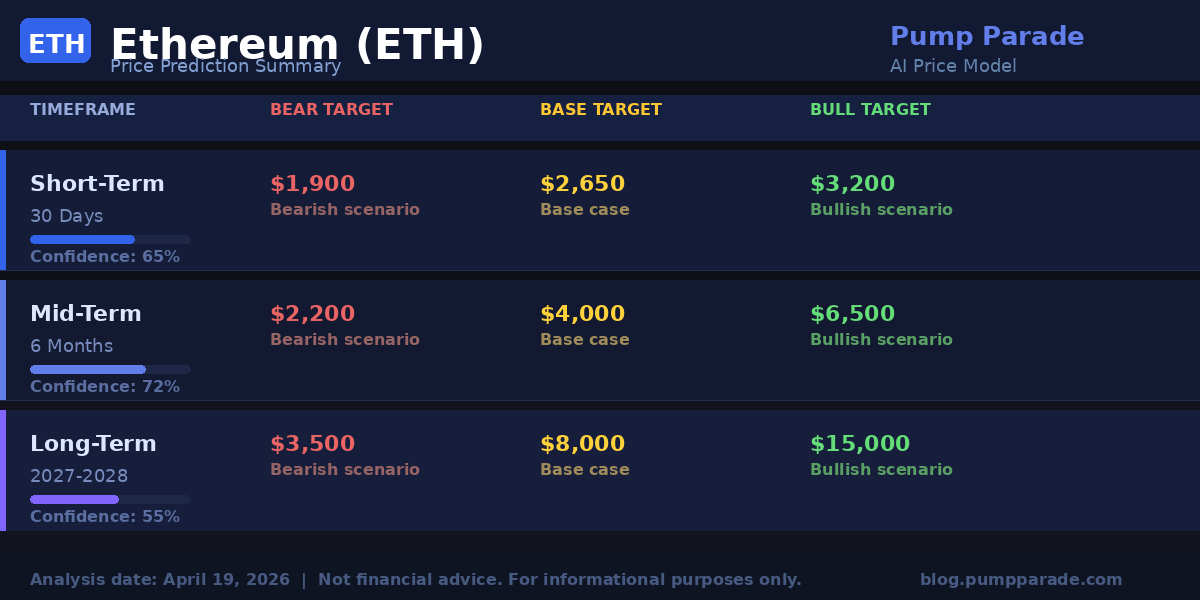
    Ethereum ETH price prediction targets table showing bear, base, and bull scenarios for 30 days, 6 months, and 2027-2028

    Short-Term (30 Days)

    Bear target: $1,900. Base target: $2,650. Bull target: $3,200. Confidence score: 65%. The short-term outcome depends heavily on whether ETH can break above $2,230 resistance on meaningful volume.

    Mid-Term (6 Months)

    Bear target: $2,200. Base target: $4,000. Bull target: $6,500. Confidence score: 72%. A successful PeerDAS upgrade and continued institutional staking inflows support the base case move toward $4,000 by Q4 2026.

    Long-Term (2027-2028)

    Bear target: $3,500. Base target: $8,000. Bull target: $15,000. Confidence score: 55%. The $15,000 bull target aligns with Standard Chartered’s official forecast. It requires staked ETF adoption, sustained L2 growth, and a favorable macro environment. Lower confidence scores at longer timeframes reflect genuine uncertainty, not pessimism.

    What to Watch

    These are the signals that will tell you whether the bull or bear case is materializing:

    • Weekly close above $2,230: This would be the first real signal of trend reversal from the current consolidation range.
    • ETH staking rate: If the percentage of circulating ETH staked continues to rise past 30%, supply pressure builds in ETH’s favor.
    • PeerDAS activation timeline: Watch for official Ethereum Foundation announcements. A confirmed late-2026 activation date would be a positive catalyst.
    • BTC price action: If BTC breaks above $80K-$85K with conviction, ETH will likely follow with an amplified move.
    • Staked ETH ETF filings: Any SEC approvals or denials in 2026 will move the market quickly.

    Conclusion: Patience Has a Price Target

    Ethereum at $2,330 is not an obvious trade. The technical picture is weak in the short term. The weekly RSI near 30 is historically constructive, but it is not a guarantee.

    What is clear is this: the fundamental case for ETH in 2026 is stronger than the price currently implies. Pectra is live. PeerDAS is coming. Institutional staking is growing. Standard Chartered’s $15,000 target is an outlier, but $5,000 to $8,000 by 2027 is not.

    The risk-reward here favors watching the key levels closely. A break above $2,230 with volume is your signal. A weekly close below $2,056 is your stop signal.

    Position sizing and patience are the smart plays right now, not chasing.


    Disclaimer: This article is for informational and educational purposes only and should not be construed as financial, investment, or trading advice. Cryptocurrency markets are highly volatile, and past performance does not guarantee future results. The price predictions and analyses presented here are based on AI models, technical indicators, and available data at the time of writing. They are not guarantees. Always conduct your own research and consult with a qualified financial advisor before making any investment decisions. Pump Parade and its authors do not assume liability for financial losses incurred based on information provided in this article.

    About our AI predictions: Pump Parade’s price predictions are generated by machine learning models that analyze technical indicators, on-chain data, and market sentiment. These models have limitations and cannot account for black swan events, regulatory changes, or sudden market shifts. Use AI predictions as one input among many in your research.

    Peanut the Squirrel (PNUT) Price Prediction 2026

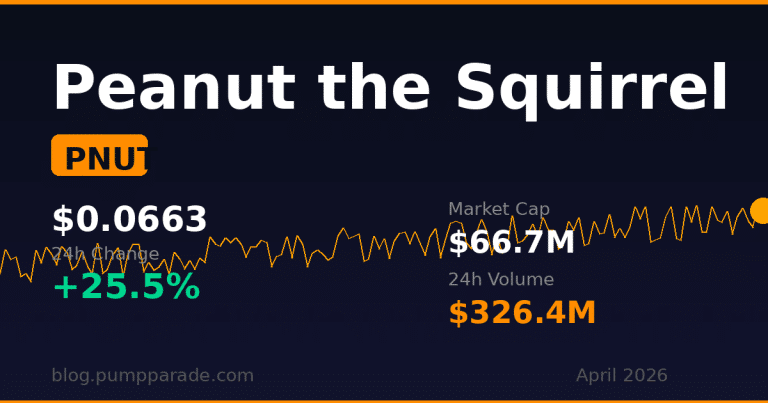
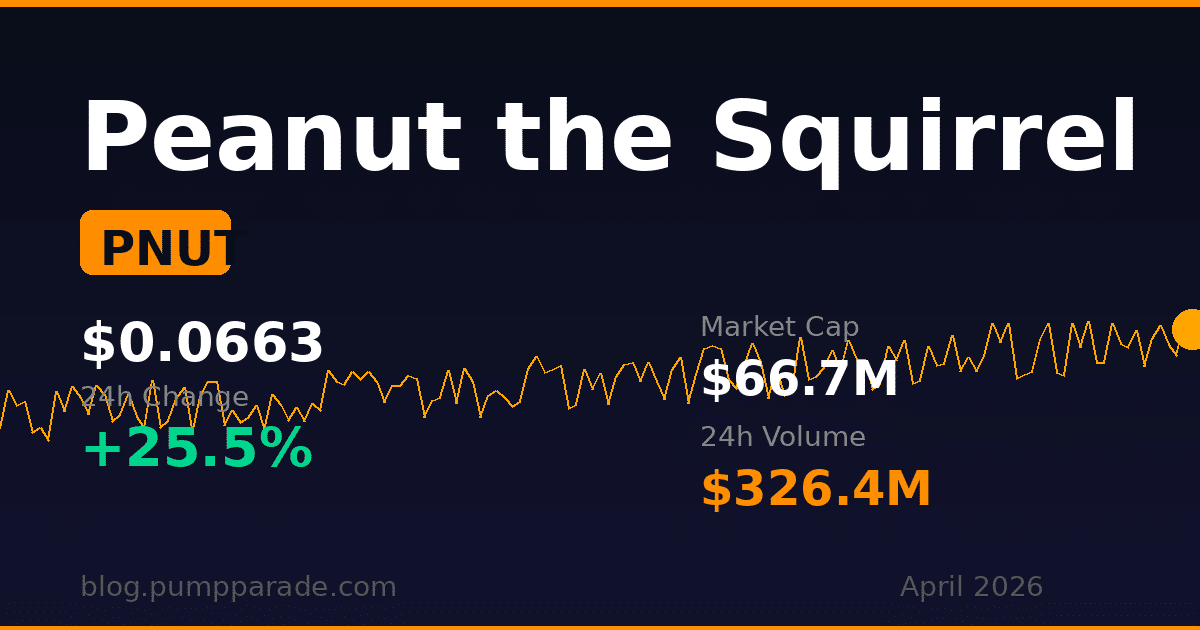
    Peanut the Squirrel (PNUT) is back in the spotlight. The Solana-based memecoin is trading at $0.0663 as of April 17, 2026, up 25.5% in the past 24 hours and 57% over the last 7 days. That kind of momentum in a market where most tokens are flat is hard to ignore.

    It is still 97% below its all-time high of $2.44, set in November 2024. But the volume tells a different story: CoinGecko reports over $326 million in 24-hour trading volume, a 285% jump from the day before. That is not noise. That is a market waking up.

    So what is driving it? And more importantly: can PNUT hold this momentum, or is this a dead-cat bounce? Our AI model ran the numbers. Here is what the data says.

    Peanut the Squirrel PNUT price prediction 2026 hero image showing current price $0.0663 and 24h change of 25.5%

    What Is Peanut the Squirrel (PNUT)?

    PNUT launched in November 2024 on Pump.fun, the Solana-based memecoin launchpad. The backstory is one of crypto’s more unusual origin stories.

    Peanut was a pet squirrel in New York state. His owner had raised him from a baby. When wildlife officials seized him and euthanized him, the story went viral. The internet was furious. An anonymous developer launched PNUT on Pump.fun within hours.

    What followed was a textbook memecoin surge. PNUT hit $2.44 in its first week of trading, giving it a peak market cap above $2 billion. Then it faded like most memecoins do, dropping 97% over the next 16 months.

    Now it is stirring again. With nearly 1 billion tokens in circulating supply and a current market cap of $66.7 million, PNUT sits at rank #390 on CoinGecko. Small enough to move fast. Large enough to be taken seriously on Solana DEXes.

    PNUT Technical Analysis

    Let us look at the chart before we get to the predictions.

    PNUT’s Relative Strength Index (RSI) sits at approximately 63 as of this writing. The RSI measures momentum on a scale from 0 to 100. Readings above 70 signal overbought conditions. At 63, PNUT has room to run before hitting overbought territory, but it is getting close.

    Key support levels to watch:

    • $0.050: The recent breakout level. PNUT crossed this in the last 48 hours on strong volume. If it holds above here, the technical picture stays bullish.
    • $0.038: Deeper support from the late March range. A pullback to this level would represent a 43% retracement but would not necessarily invalidate the uptrend.

    Key resistance levels overhead:

    • $0.090: First major ceiling. PNUT has not touched this level since January 2026.
    • $0.130: The next resistance zone, where sellers were active during the February 2025 mini-rally.
    • $0.200: A psychological level and historically significant resistance from the post-ATH decline.

    The 24-hour volume spike of 285% is significant. Volume-driven breakouts above key resistance tend to have more staying power than low-volume moves. This is an encouraging signal, not a guarantee.

    Our hybrid AI model, which combines on-chain metrics, RSI, MACD, volume analysis, and market sentiment data, assigns a 61% probability that PNUT continues higher over the next 30 days from current levels. That is a lean toward bullish, not a confident prediction. The remaining 39% probability favors a pullback or sideways consolidation.

    Bull Case for PNUT

    Here is what needs to happen for PNUT to significantly outperform from here.

    Solana ecosystem momentum. Solana has seen a sustained increase in DeFi activity and memecoin trading volume through early 2026. When Solana is in full bull mode, smaller tokens in its ecosystem benefit from increased liquidity and attention. PNUT is one of the best-known Solana memecoins. If you are browsing Solana DEXes looking for something to trade, PNUT comes up. That brand recognition matters.

    The viral backstory still resonates. Not many memecoins have a genuine emotional hook. The Peanut story triggered real outrage and media coverage. Stories that produce emotional reactions tend to get rediscovered during bull markets. A single viral post or news cycle could reignite mainstream interest in PNUT fast.

    Exchange listings. PNUT is already listed on Binance, which broadens its reach beyond Solana-native traders. Additional tier-1 exchange exposure would grow the available buyer pool meaningfully.

    Strong support holding at $0.050. The fact that PNUT is holding above the breakout level with elevated volume is technically constructive. If it consolidates rather than immediately reversing, the bull case strengthens considerably.

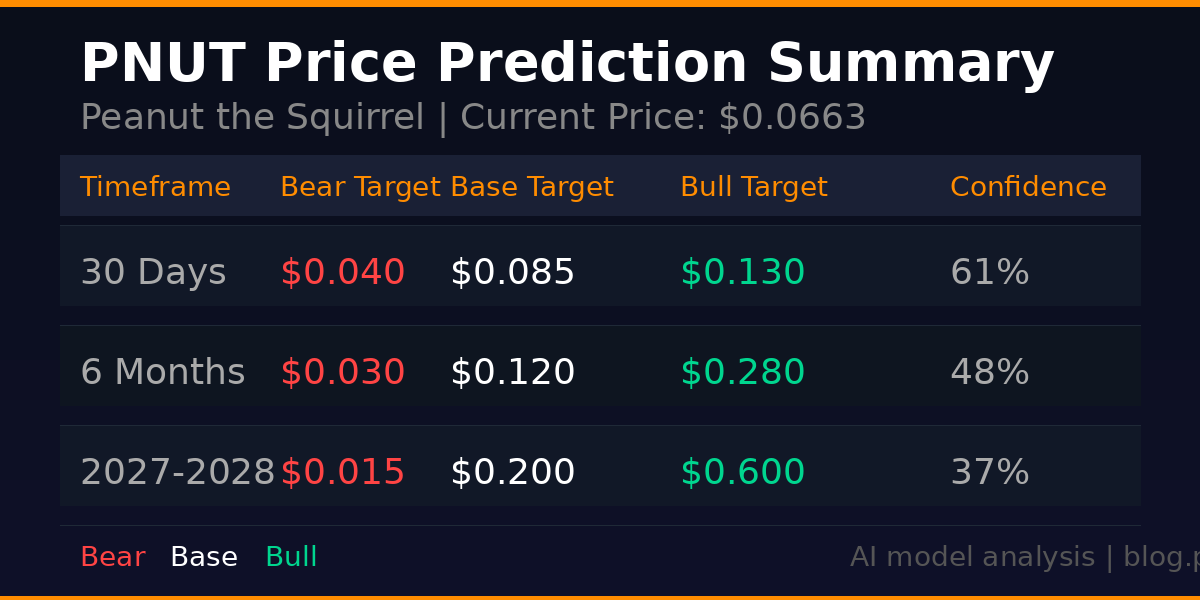
    Bull price targets: 30 days: $0.130 | 6 months: $0.280 | 2027-2028: $0.600

    Bear Case for PNUT

    The bear case is straightforward, and it deserves equal weight.

    It is a memecoin. PNUT has no utility, no protocol revenue, no staking mechanism, and no roadmap in any traditional sense. Its value is entirely driven by narrative and momentum. Those can evaporate quickly.

    97% below all-time high. Yes, PNUT is up 57% this week. But traders who bought anywhere between $0.15 and $2.44 are still deeply underwater. That is a large pool of potential sellers who will look to exit on any significant bounce. Overhead supply is real and it matters.

    Memecoin cycle fatigue. The market has churned through hundreds of memecoins since the 2024 cycle peak. Attention is fragmented. PNUT competes with newer, fresher narratives every week. Being the squirrel coin may not be enough to sustain interest through the rest of 2026.

    Overbought risk approaching. An RSI moving toward 70 on a sharp rally in a low-liquidity asset is a caution flag. Short-term traders who bought the dip will look for exits. If buyers do not absorb that selling pressure, the bounce can reverse fast.

    Bear price targets: 30 days: $0.040 | 6 months: $0.030 | 2027-2028: $0.015

    PNUT Price Predictions by Timeframe

    Our AI model synthesizes technical indicators, on-chain volume data, sentiment analysis, and historical memecoin cycle patterns. Here are the price targets across three timeframes, each with a bear, base, and bull scenario.

    PNUT Peanut the Squirrel price prediction table 2026 showing bear base bull targets for 30 days 6 months and 2027-2028

    Short-Term: 30 Days (May 2026)

    If PNUT holds above the $0.050 support and the broader Solana memecoin market stays active, the base case points to $0.085. A continuation of the current rally pushes the bull target to $0.130. If volume dries up and sellers take control, a pullback to $0.040 is the realistic bear scenario.

    Mid-Term: 6 Months (October 2026)

    Six-month predictions for memecoins carry wide uncertainty. In the base case, PNUT sustains moderate community engagement and trades around $0.120. The bull case requires a viral catalyst, new exchange listings, or a broader Solana memecoin season driving PNUT toward $0.280. The bear case, where narrative fades and sellers dominate, puts PNUT back near $0.030.

    Long-Term: 2027-2028

    Long-range predictions for memecoins are inherently speculative. If the next market cycle is as explosive as 2024 and PNUT retains its name recognition, a $0.600 bull target is plausible but not probable. The base case assumes PNUT becomes a fixture in the Solana memecoin landscape at around $0.200. The bear case is that PNUT fades into irrelevance as newer coins take the cultural moment, dropping below $0.015.

    If you want a framework for navigating Solana memecoins more broadly, this guide on how to find Solana memecoin moonshots covers the signals worth tracking before entering any position.

    What to Watch

    For anyone monitoring PNUT over the next few weeks, here are the key signals:

    • Volume sustainability: A single day of high volume means less than three consecutive days of elevated volume. Watch whether the $300M-plus daily volume persists or fades back to baseline.
    • The $0.050 level: If PNUT pulls back and holds above this level with decent volume, that is a healthy consolidation. If it breaks below on heavy selling, the bounce may be over.
    • Solana network activity: PNUT moves with Solana ecosystem sentiment. Track SOL price and overall DEX volume as leading indicators.
    • Social search trends: Memecoin rallies often correlate with spikes in search interest. A jump in Google search volume for PNUT coin or Peanut squirrel crypto would be a positive signal for continuation.
    • The $0.090 test: If PNUT approaches the $0.090 resistance level, that is the critical moment. A clean break above it on strong volume would change the technical picture meaningfully to the upside.

    Disclaimer: This article is for informational and educational purposes only and should not be construed as financial, investment, or trading advice. Cryptocurrency markets are highly volatile, and past performance does not guarantee future results. The price predictions and analyses presented here are based on AI models, technical indicators, and available data at the time of writing. They are not guarantees. Always conduct your own research and consult with a qualified financial advisor before making any investment decisions. Pump Parade and its authors do not assume liability for financial losses incurred based on information provided in this article.

    About our AI predictions: Pump Parade price predictions are generated by machine learning models that analyze technical indicators, on-chain data, and market sentiment. These models have limitations and cannot account for black swan events, regulatory changes, or sudden market shifts. Use AI predictions as one input among many in your research.

    Kamino Finance Review 2026: Fees, Features & Verdict

    0

    If you’ve been in the Solana DeFi space for more than five minutes, you’ve probably seen Kamino Finance mentioned in every other conversation about lending, leverage, and yield. With nearly $2.8 billion in total market size and over a billion dollars in active borrows, Kamino has quietly become the backbone of Solana’s lending infrastructure.

    But does the protocol actually deliver on its promises? Is it safe? And more importantly, is it the right place for your capital in 2026?

    We spent weeks digging through every feature, testing the UI, and analyzing the numbers. Here’s our full, no-fluff review.

    Quick Verdict: 8.5/10

    Bottom line: Kamino Finance is the most complete DeFi lending and leverage platform on Solana. It combines automated lending, leveraged yield strategies, and a growing set of real-world asset markets into a single protocol. The interface is clean, the security track record is spotless, and the yields are competitive. The main downsides are the Solana-only limitation and a learning curve for the leverage products. If you’re a Solana DeFi user looking for a one-stop shop for lending and leverage, Kamino is the clear frontrunner.

    Kamino Finance Review 2026 - Features, Fees and Verdict
    Kamino Finance: Solana’s leading DeFi lending and leverage protocol

    What Is Kamino Finance?

    Kamino Finance is a decentralized finance protocol built natively on Solana. Launched in September 2022, it started as an automated liquidity management platform and has since evolved into Solana’s largest lending and leverage venue. The protocol is developed by a team led by CEO Gonzalo Parejo and CTO Rodrigo Perenha (a former Mercado Libre engineer), backed by institutional investors including Flourish Ventures.

    At its core, Kamino does three things: it lets you lend assets to earn yield, borrow against your holdings, and amplify your returns through leveraged strategies. What sets it apart from simpler lending protocols is its “Multiply” product, which automates complex looping strategies that would normally require multiple manual transactions.

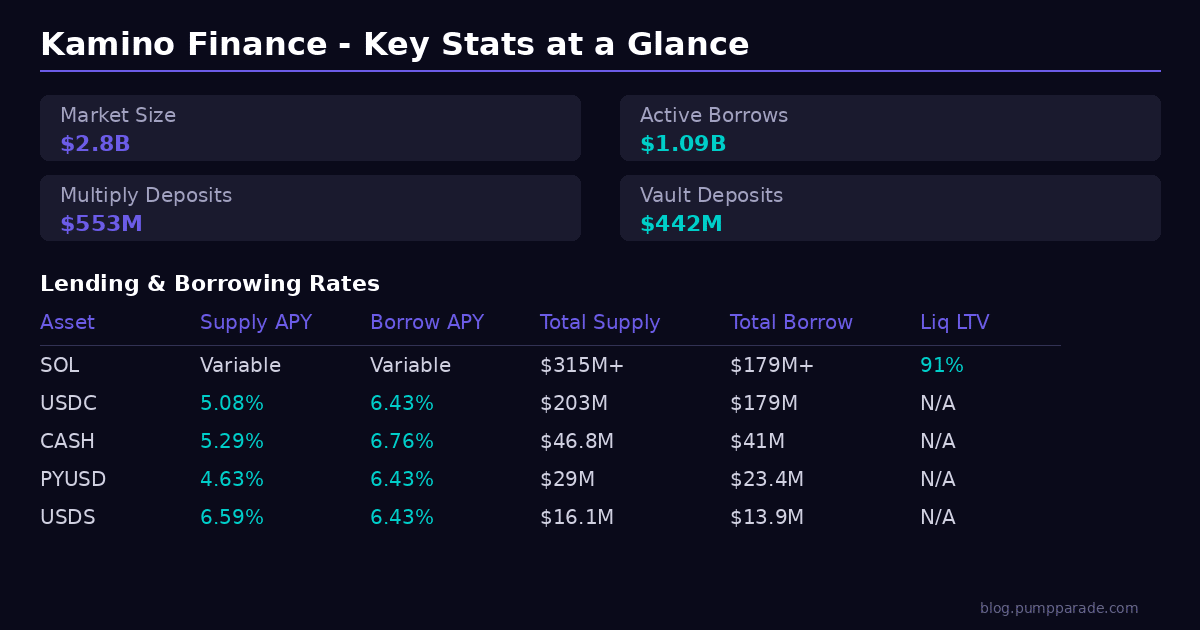
    The numbers speak for themselves. As of April 2026, Kamino’s total market size sits at $2.8 billion with $1.09 billion in active borrows. That makes it the largest lending protocol on Solana and one of the top lending platforms globally by TVL, according to DeFiLlama data.

    Core Features Deep Dive

    K-Lend: Lending and Borrowing

    The bread and butter of Kamino is K-Lend, its peer-to-pool lending system. If you’ve used Aave or Compound before, the concept is familiar: deposit assets to earn interest, or use your deposits as collateral to borrow other assets. What makes K-Lend interesting is its architecture.

    The protocol uses a tier-based risk management system that categorizes assets into Isolated Debt, Isolated Collateral, and General tiers. This means volatile memecoins don’t share the same risk pool as blue-chip assets like SOL and USDC. It’s a thoughtful design choice that protects lenders while still allowing the protocol to list newer, riskier assets.

    Current lending rates are competitive. USDC suppliers earn around 5.08% APY, while borrowers pay approximately 6.43%. Stablecoin rates like CASH and PYUSD hover in similar ranges. For SOL-denominated positions, rates are variable and depend on utilization. The protocol also supports 26 different markets spanning SOL, liquid staking tokens (LSTs), BTC, RWA tokens, xStocks, and even memecoins.

    One standout feature is “scam wick protection,” which prevents liquidations during sudden, artificial price spikes. If you’ve ever been liquidated by a flash crash that recovered seconds later, you’ll appreciate this safeguard.

    Kamino Finance Lend Dashboard showing market size and vault deposits
    The Kamino Lend dashboard showing $2.8B market size and available vaults

    Multiply: Leveraged Yield

    Multiply is where Kamino really differentiates itself. This feature lets you amplify your exposure to yield-bearing assets through automated looping. In plain English: you deposit an asset, the protocol borrows against it, redeposits the borrowed funds, and repeats the loop to multiply your yield exposure.

    The results can be impressive. As of this writing, the eUSX Loop offers a maximum APY of 31.83%, while PRIME loops reach 11.87% and stable loops like USDG sit around 4.67%. Total deposits in Multiply currently exceed $553 million with $433 million in active borrows.

    Leverage goes up to 8.3x on certain positions thanks to K-Lend’s eMode mechanism, which allows higher loan-to-value ratios for correlated asset pairs. The entry and exit process uses flash loans (with a tiny 0.001% fee) to automate what would otherwise require dozens of manual transactions.

    A word of caution: leverage amplifies both gains and losses. If the underlying yield drops below your borrow rate, your position goes negative. And in volatile markets, liquidation risk is real. This isn’t a set-and-forget product for beginners.

    Kamino Finance Multiply page showing leveraged yield strategies
    Kamino Multiply offers leveraged yield loops with APYs up to 31.83%

    Earn Vaults

    For users who want exposure to Kamino’s yield opportunities without managing positions manually, Earn Vaults provide a simpler entry point. These are curated portfolios managed by expert partners, organized into risk tiers: Conservative, Balanced, and Aggressive.

    Top-performing vaults include the Sentora PYUSD vault at 6.19% APY with $286 million in TVL, and the RockawayX RWA USDC vault at 4.91%. With 23 vaults available, there’s a range of risk/return profiles to choose from. Each vault clearly labels its strategy and accepted collateral types, making it straightforward to understand what you’re getting into.

    Real-World Asset (RWA) Integration

    One of Kamino’s most forward-looking moves has been its push into real-world assets. In December 2025, the protocol began accepting SEC-registered tokenized equities from Superstate as collateral. By March 2026, it had partnered with Anchorage Digital for institutional custody and reached over $1 billion in RWA lending volume.

    The Borrow page now includes dedicated RWA and xStocks filters, letting users borrow against tokenized versions of traditional financial assets. This institutional angle positions Kamino uniquely among Solana DeFi protocols and signals a roadmap aimed at bridging traditional finance and crypto.

    Fees Breakdown

    Kamino’s fee structure is transparent and competitive for the DeFi space. Here’s what you’ll pay across the platform’s main products.

    For lending and borrowing, the primary cost is the interest rate spread between supply and borrow APY. USDC lenders earn roughly 5.08% while borrowers pay 6.43%, creating about a 1.35% spread for the protocol. Similar spreads apply across other stablecoins. There are no explicit deposit or withdrawal fees for lending.

    On the Multiply side, each entry and exit uses a flash loan mechanism that charges 0.001% per transaction. Given that these automate what could be 10+ manual transactions, the cost is negligible. Origination fees and potential liquidation fees also apply to borrowed positions, though these are standard across DeFi lending.

    Transaction costs on Solana itself remain minimal, typically under $0.01 per transaction. Compared to Ethereum-based lending protocols where gas fees can eat into yields, this is a significant advantage for smaller position sizes.

    Kamino Finance key stats and lending rates overview
    Kamino Finance key statistics and current lending rates

    Pros and Cons

    What We Like

    All-in-one DeFi hub. Instead of bouncing between separate lending, leverage, and liquidity protocols, Kamino packages everything into one interface. This reduces counterparty risk and simplifies your DeFi workflow considerably.

    Spotless security record. Since launching in September 2022, Kamino has suffered zero security breaches or bad debt events. The protocol has completed four formal security audits (including verification by Certora and Osec) and maintains a $1.5 million bug bounty program. In a space where exploits are common, this track record stands out.

    Capital efficiency. The eMode mechanism and Multiply product let advanced users extract significantly more yield from their capital than simple lending alone. LP positions can be used as collateral without exiting, and concentrated liquidity management reduces slippage.

    Institutional credibility. The Anchorage Digital partnership, RWA integration, and Superstate collaboration signal that Kamino is building for institutional adoption, not just retail DeFi users. This could drive significant TVL growth over time.

    Clean, functional UI. The interface is well-organized, with clear labeling of risk tiers, APY breakdowns, and market statistics. Filtering by asset category (SOL, LSTs, RWA, Memes) makes navigation intuitive even with 26+ markets.

    What Could Be Better

    Solana-only. Kamino currently operates exclusively on Solana. While this is a strength for Solana ecosystem users, it limits access for users on Ethereum, Arbitrum, or other chains. Multi-chain expansion is on the roadmap but not yet delivered.

    Leverage complexity. The Multiply product, while powerful, requires a solid understanding of leverage mechanics, liquidation thresholds, and yield dynamics. Beginners could easily over-leverage without understanding the risks.

    KMNO token performance. The KMNO governance token is currently trading around $0.02, approximately 92% below its all-time high of $0.25. While this doesn’t directly affect protocol functionality, it raises questions about tokenomics and future incentive sustainability.

    Network dependency. As a Solana-native protocol, Kamino’s availability is tied to Solana network uptime. While Solana’s reliability has improved significantly, historical outages remain a concern for users relying on time-sensitive leverage positions.

    Security and Trust

    Security is arguably Kamino’s strongest selling point. The protocol has undergone four formal security audits: three by Certora (using mathematical formal verification) and one by Osec (a six-month comprehensive review). All audits confirmed zero critical vulnerabilities in the lending and vault systems.

    Beyond audits, Kamino runs an advanced fuzzing campaign with Ackee Blockchain that tests millions of instruction sequences for edge cases. The protocol also integrated Chainlink Data Streams for low-latency, tamper-resistant price feeds, reducing oracle manipulation risk.

    The $1.5 million bug bounty program and 24/7 in-house security monitoring add additional layers of protection. With $2.8 billion in assets under management and zero incidents in over three years of operation, Kamino has built one of the strongest security track records in DeFi. For context, that’s a longer clean streak than most Ethereum lending protocols can claim.

    User Experience

    Kamino’s interface strikes a good balance between information density and usability. The top navigation cleanly separates the core products: Swap, Lend, Borrow, Multiply, Liquidity, and Portfolio. Each section loads quickly (a Solana advantage) and presents data in well-organized tables with sortable columns.

    For lending, the Earn Vaults page highlights top-performing vaults with APY, deposits, risk tier, and collateral count at a glance. The Borrow page includes smart filtering by asset category (SOL, xStocks, BTC, LSTs, RWA, Memes), which is helpful given the growing number of markets.

    The Multiply page could use better educational content for new users. While there’s a “How it works” link, the concept of looping and leverage isn’t immediately intuitive. Advanced users will feel at home, but first-time DeFi users might find the learning curve steep.

    Mobile support is still in development, which is a gap. However, the web interface is responsive enough to be usable on mobile browsers in a pinch. Wallet connection supports all major Solana wallets including Phantom and Backpack.

    KMNO Token

    Kamino’s native token, KMNO, serves as the protocol’s governance token. With a maximum supply of 10 billion tokens and roughly 4.3 billion in circulation, the token trades at approximately $0.02 with a market cap of around $87 million.

    KMNO holders can participate in on-chain governance votes that control protocol parameters, incentive programs, and strategic direction. Staking KMNO also provides reward boosts on the platform. The token’s governance framework includes an elected Risk Council that manages dynamic risk parameters across lending markets.

    The elephant in the room is the price. KMNO is down roughly 92% from its all-time high of $0.25, reflecting broader market conditions and token unlock pressure (core contributors have a 12-month lockup followed by 24-month linear vesting). Whether the token represents a value opportunity or a red flag depends largely on your conviction in Kamino’s growth trajectory and the broader Solana ecosystem.

    How Kamino Compares

    In the Solana DeFi landscape, Kamino’s closest competitors are marginfi and Drift Protocol. Kamino leads in TVL and product breadth. While marginfi focuses primarily on lending/borrowing and Drift emphasizes perpetual trading, Kamino combines lending, leverage, and liquidity management under one roof.

    Compared to Ethereum-based protocols like Aave, Kamino offers similar functionality with dramatically lower transaction costs. However, Aave benefits from multi-chain deployment and deeper liquidity in certain markets. For Solana-native users, Kamino is the clear choice. For multi-chain DeFi users, the Solana-only limitation is worth considering.

    If you’re active in the Solana trading ecosystem and use tools like Photon or BullX for trading, Kamino can complement your workflow by putting idle capital to work between trades. And if you’re using Jupiter for swaps, Kamino integrates seamlessly as part of the broader Solana DeFi stack.

    Verdict: 8.5/10

    Kamino Finance has earned its position as Solana’s leading DeFi lending protocol. The combination of a comprehensive product suite, institutional-grade security, competitive yields, and a clean interface makes it the strongest all-in-one DeFi platform on Solana in 2026.

    Best for: Intermediate to advanced DeFi users on Solana who want lending, leverage, and yield optimization in a single protocol. Also excellent for users interested in RWA exposure through DeFi.

    Not ideal for: Complete DeFi beginners who might be overwhelmed by leverage mechanics, or multi-chain users who need cross-chain functionality today.

    If you’re already operating on Solana and want to put your capital to work, Kamino Finance deserves a serious look. Just remember: with leverage products, always start small and understand the liquidation risks before sizing up.

    Frequently Asked Questions

    Is Kamino Finance safe to use?

    Kamino has one of the strongest security track records in DeFi. The protocol has completed four formal security audits with zero critical vulnerabilities found, maintains a $1.5 million bug bounty program, and has had zero security breaches since launching in September 2022. That said, all DeFi protocols carry inherent smart contract risk, so never deposit more than you can afford to lose.

    What is the minimum deposit to use Kamino?

    There’s no official minimum deposit requirement. However, since Kamino operates on Solana where transaction fees are under $0.01, even small deposits are practical. For Multiply (leverage) positions, you’ll want enough capital that the yield generated meaningfully exceeds the borrow cost.

    How does Kamino Multiply work?

    Multiply automates a “looping” strategy. You deposit an asset, the protocol borrows against it, redeposits the borrowed funds to earn additional yield, and repeats this process multiple times. The result is amplified exposure to the underlying yield. This process uses flash loans to execute all loops in a single transaction, keeping the user experience simple despite the complexity underneath.

    Can I use Kamino on mobile?

    Kamino doesn’t have a dedicated mobile app yet, though mobile UI development has been announced as a priority. The web interface is responsive enough to work on mobile browsers, and you can connect via mobile wallets like Phantom. A full mobile experience is expected in the near future.

    What is the KMNO token used for?

    KMNO is Kamino’s governance token. Holders can vote on protocol parameters, incentive allocations, and strategic decisions through on-chain governance. Staking KMNO also provides reward boosts on the platform. The token currently trades around $0.02 with a maximum supply of 10 billion.

    Dogecoin (DOGE) Price Prediction 2026: Can DOGE Hit $1?

    0

    DOGE at a Crossroads: What the Data Says

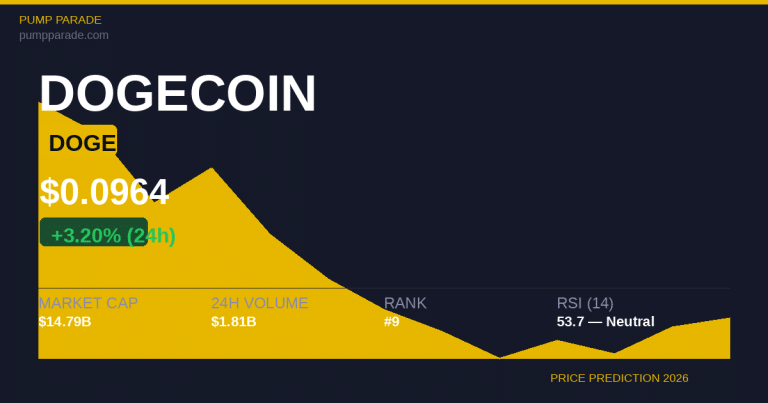
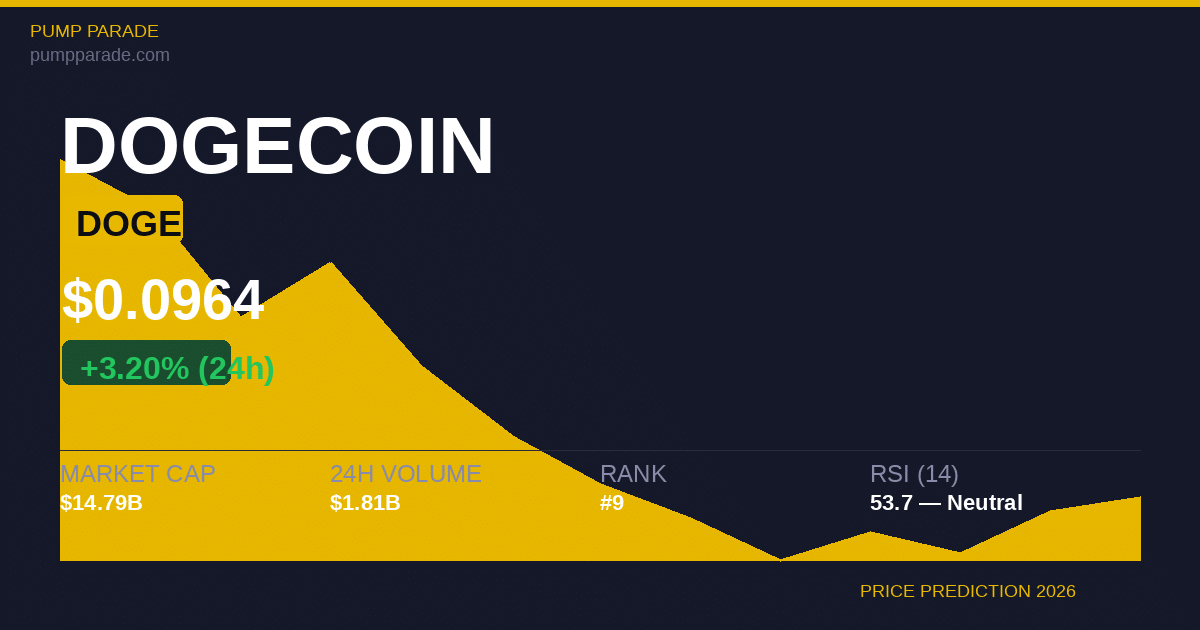
    Dogecoin (DOGE) is trading at $0.096 today, April 16, 2026. That is up 3.2% in the last 24 hours. But zoom out, and the picture gets more interesting. DOGE is down roughly 87% from its all-time high of $0.73, set back in May 2021. Market cap sits at $14.79 billion, with 24-hour trading volume of $1.81 billion.

    So why are analysts watching DOGE right now? Three words: catalysts are stacking. A GitHub proposal to slash block rewards by 90%, confirmed X Money integration, three live spot ETFs, and the SEC’s classification of DOGE as a digital commodity have all landed in the past few months. This is not the same Dogecoin story from 2021. Let’s break down what that means for price.

    Dogecoin DOGE price prediction 2026 hero image showing current price $0.096

    What Is Dogecoin? A Quick Refresher

    Dogecoin launched in 2013 as a lighthearted fork of Litecoin, built around the Shiba Inu “doge” meme. What started as a joke became one of the most recognized crypto brands in the world.

    Unlike Bitcoin, DOGE has no supply cap. New coins are minted continuously. Annual issuance currently runs at roughly 5 billion DOGE per year. That steady inflation has historically suppressed price appreciation. It is also one of the key issues a new GitHub proposal aims to fix.

    Today, Dogecoin ranks #9 by market cap among all cryptocurrencies, per CoinGecko. It has over 153 billion DOGE in circulation. The Dogecoin Foundation remains active, with developer activity reportedly up 300% year over year.

    Key Catalysts Driving the 2026 Narrative

    1. The 90% Block Reward Cut Proposal

    This is the biggest structural catalyst in Dogecoin’s history. A formal proposal on GitHub suggests reducing the block reward from 10,000 DOGE to 1,000 DOGE per block. That would cut annual new supply from roughly 5 billion coins to 500 million. A 90% issuance reduction.

    To be clear: this is a proposal, not a done deal. It requires a hard fork and broad consensus from miners, developers, and exchanges. But the conversation has started, and that matters. Historically, assets transitioning to lower-inflation models see meaningful re-ratings once supply dynamics shift.

    2. X Money Integration

    X (formerly Twitter) has confirmed that Dogecoin serves as a native clearing layer for micro-transactions and peer-to-peer tipping within X Money. Elon Musk’s involvement with both X and DOGE has always been a double-edged sword. But confirmed platform integration is different from a tweet. It creates real utility and transaction demand.

    3. Spot ETFs and Regulatory Clarity

    Three spot Dogecoin ETFs are now live. The SEC also classified DOGE as a digital commodity in March 2026. That regulatory designation matters. It signals legitimacy to institutional capital that previously sat on the sidelines.

    4. The “Such App” Wallet

    The Dogecoin Foundation is building “Such App,” a self-custodial wallet for DOGE scheduled for H1 2026. A native wallet with strong UX could meaningfully lower the barrier to holding DOGE outside of exchanges.

    Technical Analysis: Where DOGE Stands Right Now

    The technical picture for DOGE is neutral-to-cautious in the short term.

    DOGE is trading below both its 50-day SMA ($0.101) and 200-day SMA ($0.122). Both moving averages are trending downward. That is not a bullish structure. It means buyers have not yet reclaimed momentum.

    The RSI (Relative Strength Index) sits at 53.7. That is neutral territory. It is not oversold, which removes the “deep value bounce” argument. But it is also not overbought, meaning there is room to run if momentum builds.

    Key levels to watch:

    • Immediate support: $0.087 to $0.091. Buyers have defended this zone in recent weeks.
    • First resistance: $0.095 to $0.100. A clean break above $0.10 would be a meaningful signal.
    • Next major resistance: $0.120 to $0.125, aligned with the 200-day SMA.

    The MACD is showing early signs of flattening after a bearish cross. That suggests the sell momentum from late March is fading. Not yet bullish, but the downtrend is losing steam.

    The Bull Case for DOGE in 2026

    Here is the scenario where DOGE outperforms expectations this year.

    If the block reward cut proposal gains traction, sentiment around DOGE’s inflation problem shifts fast. Crypto markets re-rate on narrative. A credible path to 90% lower issuance is the kind of catalyst that moves markets before the change even happens.

    Add the X Money tipping mechanism going live at scale. If X’s hundreds of millions of users start tipping in DOGE, that creates organic demand from a pool that has never touched crypto. This is not on-chain speculation. It is consumer-facing utility.

    Layer in the spot ETF inflows. If even a fraction of the institutional demand that hit Bitcoin and Ethereum ETFs redirects toward DOGE, the supply-demand math changes quickly.

    In this bull scenario, a return to the $0.15 to $0.20 range by Q4 2026 is plausible. That would represent roughly 55% to 110% upside from today’s price. A more aggressive move toward $0.30 is possible if Bitcoin pushes past $90K and altcoins rotate broadly.

    The Bear Case for DOGE in 2026

    The bear case is equally real, and it starts with inflation.

    Until the block reward cut is actually implemented, 5 billion new DOGE per year keeps hitting the market. That is constant sell pressure. Long-time holders who bought in 2021 are deeply underwater. Distribution risk is real.

    The CLARITY Act, which would provide a clearer regulatory framework for digital assets including DOGE, remains stalled in the Senate as of April 2026. Regulatory uncertainty can suppress institutional capital even when spot ETFs exist.

    DOGE also competes with a crowded memecoin field. PEPE, WIF, BONK, and dozens of newer tokens compete for the same speculative capital. DOGE’s brand is strong, but it does not have a monopoly on meme-driven upside anymore.

    In a risk-off scenario where Bitcoin pulls back below $65K, DOGE could retest the $0.065 to $0.075 range. That would represent a 30% to 35% drawdown from current levels. Investors who have watched past cycles know that kind of move is routine, not exceptional.

    DOGE Price Predictions by Timeframe

    Our hybrid AI model weighs technical indicators, on-chain data, sentiment signals, and macro context to generate the following scenarios. These are probability-weighted outcomes based on available data, not guarantees.

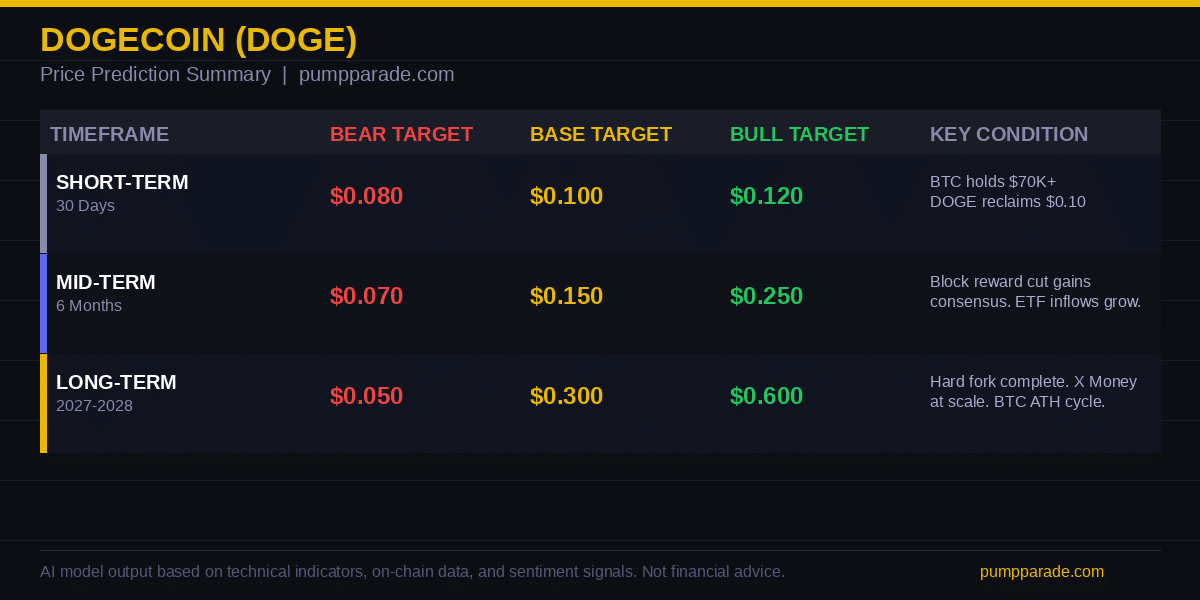
    Dogecoin DOGE price prediction table 2026 showing bear base bull targets by timeframe

    Short-Term: 30-Day Outlook (to mid-May 2026)

    DOGE needs to reclaim $0.10 to build any upside momentum. If it does, a move toward $0.113 is feasible. If it fails at $0.10 resistance and macro conditions soften, a pullback toward the $0.080 to $0.087 support range is the more likely short-term outcome.

    • Bear target: $0.080
    • Base target: $0.100
    • Bull target: $0.120

    Mid-Term: 6-Month Outlook (to October 2026)

    By mid-year, the block reward proposal will either have built consensus or faded. X Money tipping will either show real volume or not. Those two binary outcomes will likely determine where DOGE trades by October.

    • Bear target: $0.070
    • Base target: $0.150
    • Bull target: $0.250

    Long-Term: 2027-2028

    If the supply cut gets implemented and Bitcoin enters a new ATH cycle in 2027, DOGE could see its most significant re-rating since 2021. The $0.30 to $0.50 range becomes plausible in that environment. A return to $1 would require exceptional conditions: massive X Money adoption, hard fork completion, and sustained bull market tailwinds all aligning simultaneously.

    • Bear target: $0.050
    • Base target: $0.300
    • Bull target: $0.600

    What to Watch in the Coming Months

    Three things will likely determine which scenario plays out.

    First, watch the GitHub proposal closely. If major mining pools and exchanges signal support, the narrative shift could begin before any code is merged. Community consensus moves the price before the hard fork happens.

    Second, watch Bitcoin. DOGE has historically traded with a strong correlation to BTC. If Bitcoin breaks cleanly above $80K, altcoins tend to follow. DOGE would be a primary beneficiary of that rotation. For deeper context on the broader market, see our Bitcoin (BTC) price prediction for 2026.

    Third, watch X Money volume metrics. If X tipping drives real, measurable DOGE transaction volume, that is a fundamentally different story than a press release. Real on-chain activity is what moves price sustainably.

    Final Take

    Dogecoin is at an inflection point. The catalysts are real and meaningful. The supply cut proposal, X Money integration, spot ETF flows, and regulatory clarity all point in the same direction. But catalysts are not outcomes. They are possibilities.

    The data puts DOGE in a neutral zone right now. Not cheap enough to be a screaming buy. Not expensive enough to be a clear short. The next 60 days, particularly the block reward proposal’s progress and Bitcoin’s trajectory, will likely set the direction for the rest of 2026.

    If you are watching DOGE, watch $0.10 on the upside and $0.087 on the downside. Those two levels will tell you a lot about where this goes next.


    Disclaimer: This article is for informational and educational purposes only and should not be construed as financial, investment, or trading advice. Cryptocurrency markets are highly volatile, and past performance does not guarantee future results. The price predictions and analyses presented here are based on AI models, technical indicators, and available data at the time of writing. They are not guarantees. Always conduct your own research (DYOR) and consult with a qualified financial advisor before making any investment decisions. Pump Parade and its authors do not assume liability for financial losses incurred based on information provided in this article.

    Sui (SUI) Price Prediction 2026: Can SUI Hit $3?

    0

    SUI at $0.93: Down 83% From Its Peak, But a Major Catalyst Is Coming

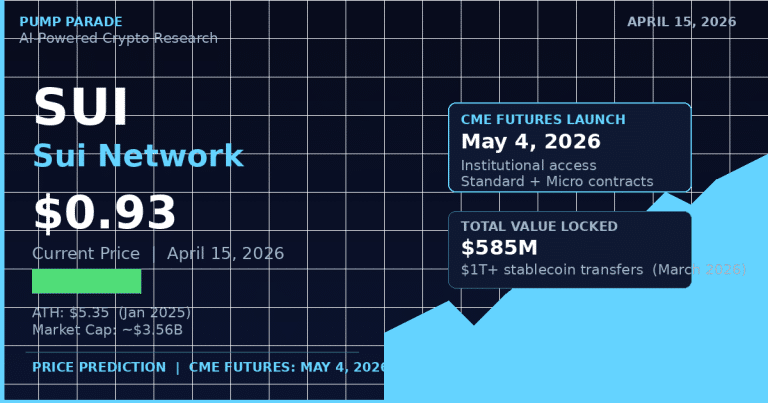
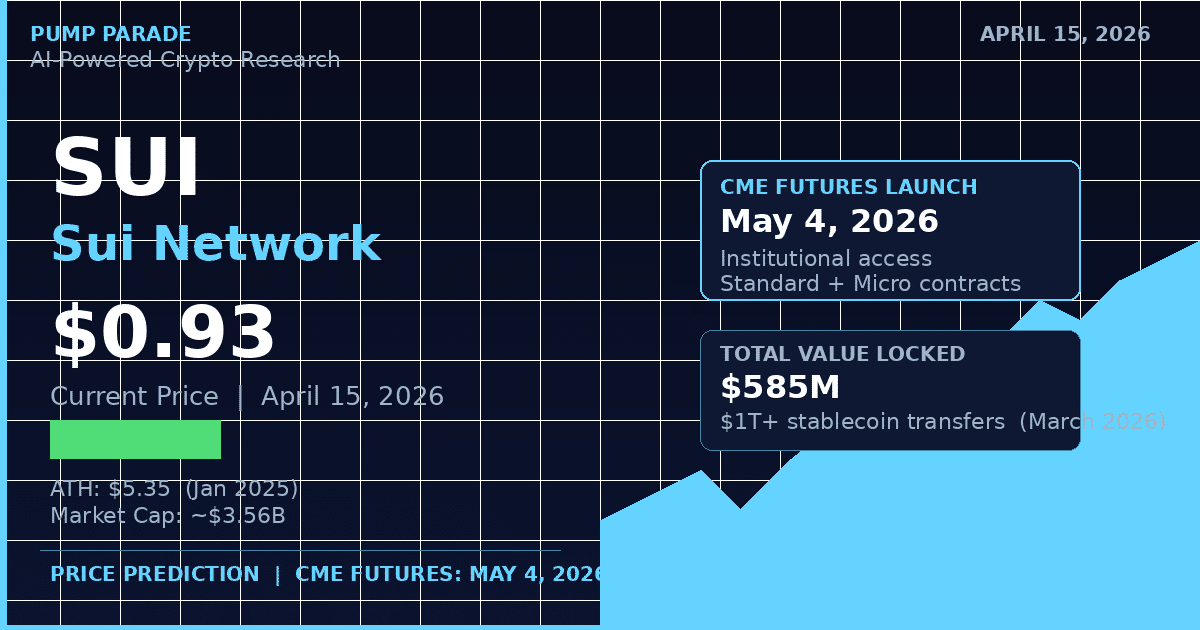
    Sui (SUI) is trading at $0.93 as of April 15, 2026. That’s a long way down from its all-time high of $5.35, hit in January 2025. The drop has been brutal. But there’s a reason traders are starting to pay attention again.

    On May 4, 2026, CME Group launches regulated SUI futures. That’s less than three weeks away. The last two times CME launched futures for a major crypto asset, Bitcoin in December 2017 and Ethereum in February 2021, price action shifted meaningfully in the months that followed. For SUI, the question is whether history repeats.

    In this analysis, we break down SUI’s current market position, the key catalysts building beneath the surface, and what our AI model says about where the price goes from here. Bull case, bear case, and everything in between.

    Sui (SUI) Price Prediction 2026 - Current price $0.93 with CME futures launching May 4

    What Is Sui? A Quick Rundown

    Sui is a Layer-1 blockchain built by Mysten Labs, a team of former Meta engineers who worked on the Diem blockchain project. The network launched its mainnet in May 2023 and has since grown into one of the more credible Ethereum and Solana challengers in the market.

    Sui’s technical edge comes from its object-centric data model and the Move programming language. In plain terms, this architecture allows the network to process simple transactions in parallel rather than sequentially, which leads to much faster throughput than traditional blockchains.

    Key metrics as of April 15, 2026:

    • Market cap: approximately $3.56 billion (ranked around #22 globally)
    • Total Value Locked (TVL): $585 million
    • Circulating supply: approximately 3.83 billion SUI
    • Stablecoin transfer volume in March 2026: over $1 trillion processed on-chain

    That last number deserves emphasis. A trillion dollars in stablecoin transfers in a single month puts Sui in rarefied company. For context, that’s the kind of throughput number that institutional infrastructure teams pay attention to.

    Recent Developments: More Than Just a Futures Launch

    The CME futures announcement is the loudest recent signal, but it’s not the only one. Sui has had a notable stretch of ecosystem development in early 2026.

    CME Futures Launch: May 4, 2026

    CME Group confirmed it will offer both standard (50,000 SUI) and micro (5,000 SUI) cash-settled futures contracts. The dual contract structure is designed to bring in both institutional traders looking for size and smaller funds or prop desks that want more flexibility.

    What does this mean for price? The historical pattern with CME crypto launches is a “sell the news” dip followed by a sustained re-rating as institutional access and liquidity improve. Neither outcome is guaranteed for SUI, but the precedent is worth knowing.

    Native Stablecoins and Protocol Integrations

    Two major stablecoin launches happened on Sui in early 2026. Sui Dollar launched in March, and suiUSDe (Ethena’s synthetic dollar) launched in February. Both deepen the DeFi liquidity layer on the network, which is a prerequisite for sustained protocol growth.

    Sui also integrated Uniswap and Curve in the first quarter of 2026. These are not small names. Getting the two most battle-tested AMMs in DeFi history to deploy on your chain signals institutional-grade DeFi infrastructure is arriving.

    Revolut Staking

    Revolut, the European fintech with 45 million users, added SUI staking at 1.93% APY. This is not a price catalyst in the traditional sense, but it increases SUI’s exposure to a mainstream retail audience that would not otherwise interact with a Layer-1 blockchain directly.

    Technical Analysis: Key Levels to Watch

    SUI’s chart is in a recovery attempt after a steep downtrend that began in January 2025. Here is where the levels sit right now.

    Resistance

    • $0.96: Immediate overhead resistance. The price has tested this level twice in April and failed to hold above it.
    • $1.00: The major psychological barrier. A clean close above $1.00 would likely trigger a wave of short covering and retail re-engagement.
    • $1.35: The next significant resistance zone, dating back to Q3 2025 consolidation.

    Support

    • $0.90: The near-term floor. This level has held on two recent retests.
    • $0.83: Secondary support. A drop here would represent approximately an 11% pullback from current levels and would test whether longer-term buyers step in.
    • $0.70: The key invalidation level for any short-term bull thesis. A breakdown below here signals that the current recovery attempt has failed.

    Momentum Indicators

    SUI is up 6.4% over the past seven days, outperforming most large-cap altcoins in the same window. The price has reclaimed its 7-day and 14-day moving averages, which is a constructive signal after months of trending below them.

    The Money Flow Index (MFI) has been trending upward, suggesting net capital inflows rather than outflows. The chart structure remains technically bearish on higher timeframes, but the short-term data points are shifting.

    Our hybrid AI model assigns a 58% probability that SUI trades above $1.00 within the next 30 days, contingent on a broader market that holds above key support. The confidence score is moderate, reflecting genuine uncertainty in the macro environment.

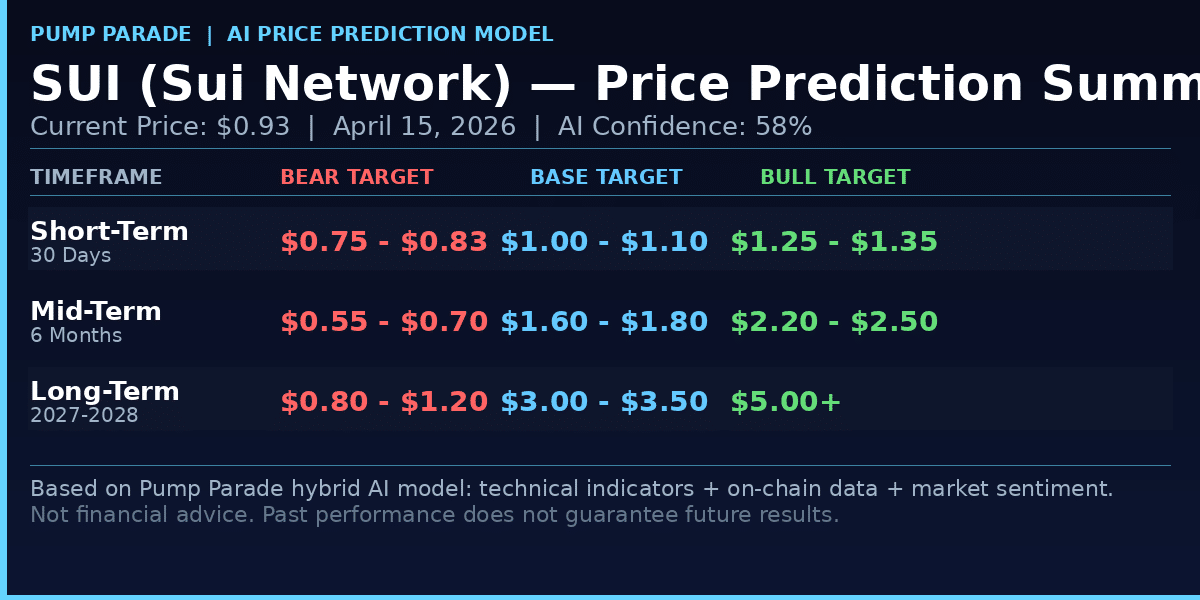
    Sui (SUI) Price Prediction 2026 summary table - Bear, Base, and Bull targets for 30 days, 6 months, and 2027-2028

    The Bull Case for SUI in 2026

    The bull case is built on three layers: institutional access, ecosystem growth, and historical CME patterns.

    The CME futures launch on May 4 opens SUI to a class of institutional traders who cannot hold spot crypto directly. Asset managers, pension funds, and hedge funds that operate under mandates requiring regulated derivatives exposure now have a vehicle. The inflow doesn’t happen overnight, but the pipeline opens.

    The ecosystem metrics support the narrative. A $585 million TVL base, a trillion dollars in March stablecoin transfers, and the integration of Uniswap and Curve all point to a network that is being used, not just speculated on. That kind of on-chain activity creates organic demand for SUI as gas and staking collateral.

    If SUI can clear $1.00 convincingly before or shortly after the futures launch, the next technical target is $1.35 and then $1.80. In a sustained bull scenario where broader market conditions remain constructive and CME volumes exceed expectations, $2.50 by the end of 2026 is within the range of realistic outcomes.

    Longer term, looking toward 2027 and 2028, the bull case rests on SUI establishing itself as one of two or three dominant non-EVM Layer-1 chains. If the network captures even 10% of Ethereum’s current TVL, the token would need to trade significantly above current levels to support that valuation.

    The Bear Case: What Could Go Wrong

    Balanced analysis means taking the downside seriously, and the downside for SUI is real.

    The chart structure is still bearish on higher timeframes. SUI is down over 83% from its all-time high and has not yet produced a confirmed higher high on the weekly chart. That means every bounce so far has been a lower high within a downtrend.

    The CME launch could be a “sell the news” event. When Bitcoin futures launched on CME in December 2017, Bitcoin peaked within days and entered a prolonged bear market. That’s the bear analogy. The bull analogy is Ethereum’s February 2021 CME launch, which preceded a multi-month rally. Both are valid historical references. The outcome depends heavily on macro conditions and broader market appetite at the time.

    Competitive pressure is the longer-term risk. Sui competes with Solana, Ethereum, Aptos, and an increasingly crowded Layer-1 landscape. Solana has first-mover advantage and significantly higher liquidity. Ethereum has network effects that dwarf any competitor. Sui needs to continue converting on-chain activity into token demand, and that’s not guaranteed.

    If SUI loses $0.83 support and the broader market deteriorates, a retest of the $0.60 to $0.70 range is plausible. A full macro breakdown could push the price toward $0.45, which was a key accumulation zone in mid-2025.

    SUI Price Predictions: Short, Mid, and Long Term

    Our hybrid AI model runs technical indicators, on-chain data, and macro sentiment across three timeframes. Here is where it lands, along with bear and bull scenario ranges.

    For context on our methodology: Pump Parade uses a multi-signal approach that blends momentum indicators, on-chain volume metrics, and market sentiment analysis. These are probability-weighted scenarios, not guarantees.

    Short-Term: Next 30 Days

    The base case is $1.00 to $1.10 by mid-May 2026, driven by pre-CME momentum and improving sentiment. The bear case is a pullback to $0.75 to $0.83 if the broader market weakens heading into the futures launch. The bull case is a clean break above $1.00 that triggers short covering and runs to $1.25 to $1.35.

    Mid-Term: 6 Months (October 2026)

    The base case is $1.60 to $1.80 by October, assuming CME volumes are healthy and DeFi TVL continues growing. The bear case is $0.55 to $0.70 if the market rolls over and Layer-1 narratives lose momentum. The bull case is $2.20 to $2.50 if SUI becomes a focal point of the next institutional adoption cycle.

    Long-Term: 2027 to 2028

    The base case is $3.00 to $3.50 by end of 2027, reflecting a scenario where Sui has established clear product-market fit for institutional DeFi and stablecoin infrastructure. The bear case is $0.80 to $1.20 in a prolonged sideways or bear market. The bull case is $5.00 or above, approaching the previous all-time high, if SUI captures meaningful market share from Ethereum’s DeFi ecosystem.

    For a deeper look at SUI’s longer-term trajectory, see our SUI Price Prediction through 2035.

    Key Catalysts and Levels to Monitor

    If you’re tracking SUI over the next 30 to 90 days, here’s the framework:

    • May 4, 2026: CME futures launch. Watch the price action in the 72 hours before and after. A sustained hold above $1.00 post-launch is the key signal.
    • $0.96 to $1.00: The make-or-break resistance band. A weekly close above $1.00 changes the technical picture materially.
    • TVL growth: Watch whether TVL sustains above $600 million. A consistent upward trend supports the bull case. A drop below $500 million signals ecosystem stagnation.
    • CME open interest: After May 4, CME’s reported weekly SUI open interest will be a proxy for institutional conviction. Rising open interest alongside rising price is the setup bulls want to see.
    • $0.83 support: The level that invalidates the near-term recovery. A daily close below $0.83 before May 4 likely breaks the pre-CME momentum narrative.

    For real-time SUI price data and market stats, you can track current prices on CoinGecko.

    The Bottom Line

    SUI at $0.93 is a token at a crossroads. The macro picture is mixed, the chart is still recovering, and competition in the Layer-1 space is fierce. But the fundamental story is stronger than the price suggests. Over $1 trillion in stablecoin transfers in March 2026, Uniswap and Curve now live on the network, a native stablecoin ecosystem developing, and institutional futures access arriving in less than three weeks.

    The CME launch is not a guaranteed price event. But it is a genuine structural change in who can access SUI exposure. That kind of shift tends to matter over months, not days.

    For traders monitoring the space: the $0.90 support and the $1.00 resistance are the two levels that will tell you most of what you need to know in the near term. A clean break above $1.00 before or after May 4 changes the conversation significantly.


    Disclaimer: This article is for informational and educational purposes only and should not be construed as financial, investment, or trading advice. Cryptocurrency markets are highly volatile, and past performance does not guarantee future results. The price predictions and analyses presented here are based on AI models, technical indicators, and available data at the time of writing. They are not guarantees. Always conduct your own research (DYOR) and consult with a qualified financial advisor before making any investment decisions. Pump Parade and its authors do not assume liability for financial losses incurred based on information provided in this article.

    About our AI predictions: Pump Parade’s price predictions are generated by machine learning models that analyze technical indicators, on-chain data, and market sentiment. These models have limitations and cannot account for black swan events, regulatory changes, or sudden market shifts. Prediction confidence scores reflect the model’s internal assessment, not guaranteed accuracy. Use AI predictions as one input among many in your research.
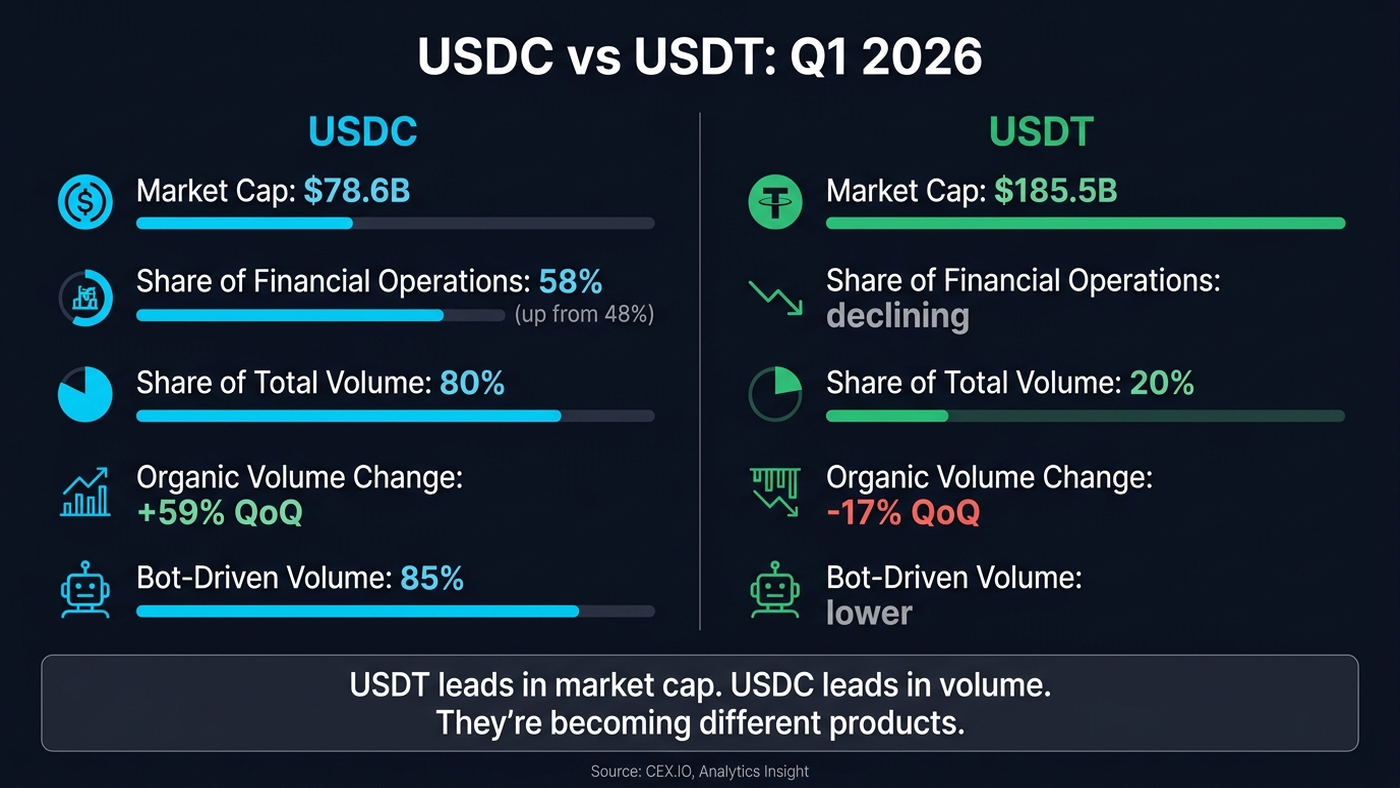
    Pudgy Penguins (PENGU) Price Prediction 2026

    Pudgy Penguins’ PENGU token is up 8% in the last 24 hours, trading at $0.00713 as of April 14, 2026. Volume on the Solana network has surged 112% in a single day. That is not a random pump. Three major catalysts dropped in the last three weeks: a free-to-play browser game on Amazon, a Visa-powered debit card available in 170+ countries, and integration into a physical retail loyalty program spanning 3,200 stores.

    This is one of the few projects in crypto that bridges on-chain activity with mainstream consumer brands. Whether that story translates into a sustained price recovery is the real question. Here is what the data suggests, and where it falls short.

    Pudgy Penguins PENGU Price Prediction 2026 - current price $0.00713, up 8% today, FDV $547M

    What Is Pudgy Penguins (PENGU)?

    Pudgy Penguins started as a collection of 8,888 NFTs on Ethereum in 2021. The project has since evolved into a consumer IP brand. In December 2024, the team launched the PENGU token on Solana and distributed it as an airdrop to NFT holders and active community members.

    Today, PENGU sits at a fully diluted valuation of roughly $547 million, with over 534,000 on-chain holders. Daily trades on Solana alone topped 36,000 in the past 24 hours.

    What separates Pudgy Penguins from most NFT-turned-token projects is the offline business. Pudgy Toys are sold in over 3,200 retail locations across North America and Europe, including Walmart and Target. The brand generated an estimated $28 to $32 million in retail sales in 2025. That is real revenue attached to a crypto token. Most memecoins cannot say the same.

    Key Catalysts Driving PENGU Right Now

    Pudgy World: The Club Penguin Moment

    On March 23, 2026, Pudgy Penguins launched Pudgy World, a free-to-play browser game available on Amazon. The game lets players explore a fictional frozen world called The Berg through 12 towns, quests, and mini-games. The design deliberately minimizes visible crypto elements to attract mainstream players.

    CoinDesk called it the project’s “Club Penguin moment.” The PENGU token rose about 9% in the days following launch. More importantly, the game creates ongoing utility for the token through rewards and avatar customization, giving holders a reason to stay engaged beyond speculation.

    The Pengu Visa Card

    On March 24, 2026, Pudgy Penguins and payment infrastructure company KAST launched the Pengu Card: a Visa debit card available in over 170 countries. It integrates with Apple Pay and Google Wallet, letting users spend crypto and stablecoins at over 150 million merchants worldwide.

    The Gold tier offers up to 12% combined rewards. This is a direct consumer-facing product tied to the token, a rarity in the NFT space.

    Physical Retail Loyalty Integration

    Also in March 2026, the team announced PENGU integration into the Pudgy Toys loyalty program. This connects physical toy purchases to token rewards, creating an on-ramp for retail shoppers who have never used crypto.

    The current impact is limited: around 14,000 wallet addresses are enrolled. But the infrastructure is in place. If toy sales keep growing, wallet enrollment could scale quickly.

    Technical Analysis: What the Chart Says

    PENGU is currently trading at $0.00713. To understand where that sits, context matters: the token peaked near $0.074 in late 2024 and has spent most of 2025 and early 2026 in recovery mode. At current levels, it is still roughly 90% below its all-time high.

    Here are the key technical levels to watch:

    • Immediate support: $0.0060, the level that held during the market sell-off earlier this month
    • First resistance: $0.0090, a level PENGU has tested and failed three times this quarter
    • Second resistance: $0.0141, the 50-day moving average and a key Fibonacci retracement level
    • Third resistance: $0.0171 and $0.0196, upper range targets if breakout momentum holds

    The RSI (Relative Strength Index, a momentum indicator on a scale of 0 to 100) sits at approximately 55. That is not overbought, meaning there is room to run before a technical pullback becomes likely. The MACD (Moving Average Convergence Divergence, which tracks trend direction and strength) is showing a bullish crossover for the first time since January 2026.

    The 24-hour volume spike of 112% accompanying today’s 8% move is meaningful. Volume-led price moves tend to be more durable than low-volume spikes. Watch the $0.0090 resistance level closely. A clean break above it on sustained volume would be a meaningful technical signal.

    Our hybrid AI model currently assigns a 61% probability that PENGU closes above $0.0090 within the next 30 days, based on current on-chain momentum and technical structure.

    The Bull Case for PENGU

    The bull case rests on three things: consumer brand growth, token utility, and macro crypto tailwinds.

    First, Pudgy Penguins has actual revenue. Toy sales do not care about crypto sentiment. If the brand keeps expanding retail distribution and the loyalty program gains traction, it creates a fundamental demand floor that pure memecoins lack.

    Second, the product flywheel is real. Pudgy World drives engagement. The Visa card drives spending. The loyalty program drives token demand from outside the crypto ecosystem. Each product reinforces the others.

    Third, if broader crypto markets recover through 2026 (which historical post-halving cycles suggest is probable), NFT-backed tokens with strong community and brand IP tend to outperform generic memecoins in bull markets. PENGU at $0.0071 is still a 90% discount from its peak.

    Price target in a bull scenario: $0.016 in 30 days, $0.035 over 6 months, and $0.065 to $0.080 in 2027-2028 if the product narrative takes hold.

    The Bear Case for PENGU

    The bear case is equally real, and it deserves honest treatment.

    PENGU has over 7 billion tokens in total supply. Even at current prices, the market cap demands significant sustained interest to keep valuations elevated. Dilution is a structural headwind.

    The toy loyalty program only affects 14,000 wallet addresses, less than 3% of current holders. Until that number grows meaningfully, it remains a story rather than a revenue driver for the token. Pudgy World also has to compete in a crowded gaming space where most blockchain games fail to retain users beyond the first week.

    Macro risks are the wild card. If Bitcoin retests lower levels or broader risk assets sell off, PENGU could easily fall back to the $0.004 to $0.005 range. At these valuations, it does not take much selling pressure to move the price significantly.

    The all-time high of $0.074 also creates significant overhead supply. Holders who bought near the top are still waiting to break even, and many will sell on any meaningful rally.

    PENGU Price Predictions: Bear, Base, and Bull

    PENGU Pudgy Penguins price prediction table showing bear, base, and bull targets for 30 days, 6 months, and 2027-2028

    Based on our AI model analysis of on-chain data, technical structure, and project fundamentals, here are our price prediction scenarios:

    • Short-term (30 days): Bear $0.0048 / Base $0.0095 / Bull $0.016
    • Mid-term (6 months): Bear $0.0055 / Base $0.020 / Bull $0.035
    • Long-term (2027-2028): Bear $0.008 / Base $0.040 / Bull $0.080

    The base case assumes continued product traction, stable macro conditions, and a modest uptick in toy loyalty enrollment. The bull case requires Pudgy World to hit meaningful daily active user numbers and macro crypto conditions improving sharply. The bear case assumes product traction stalls and broader market pressure weighs on small-cap tokens.

    What to Watch

    Three signals are worth tracking closely over the next 30 to 60 days:

    1. $0.0090 resistance: A confirmed weekly close above this level on high volume would validate the technical breakout thesis.
    2. Pudgy World DAUs: If the project releases daily active user numbers above 100,000, it would materially strengthen the bull case.
    3. Loyalty program enrollment: Watch for announcements about wallet growth. The gap between 14,000 enrolled and 534,000 token holders is the narrative gap PENGU needs to close.

    For more on identifying high-potential tokens in the Solana ecosystem before they move, check out our guide on Solana Memecoins: How to Find Massive Crypto Moonshots.

    You can track PENGU’s live price data and on-chain activity directly on CoinGecko.

    The Bottom Line

    PENGU is not a pure memecoin. It has a real consumer brand, real retail distribution, and a product roadmap that includes a game, a payment card, and a loyalty program. Those are genuine differentiators in a space full of assets with no fundamentals whatsoever.

    But it is also not a stock. Token supply dynamics, market sentiment, and macro conditions will drive short-term price action more than any product launch. The best version of the PENGU story takes 12 to 24 months to play out. Be patient if you are building a position, and keep your position size in line with the real risks.

    At $0.0071, PENGU is one of the more interesting risk-reward setups in the Solana ecosystem right now. That is the data talking, not the hype.


    Disclaimer: This article is for informational and educational purposes only and should not be construed as financial, investment, or trading advice. Cryptocurrency markets are highly volatile, and past performance does not guarantee future results. The price predictions and analyses presented here are based on AI models, technical indicators, and available data at the time of writing. They are not guarantees. Always conduct your own research and consult with a qualified financial advisor before making any investment decisions. Pump Parade and its authors do not assume liability for financial losses incurred based on information provided in this article.

    Photon vs BullX: Best Solana Trading Bot 2026

    0

    Choosing the right trading terminal can make or break your on-chain trading experience. For Solana traders, two names keep coming up in every conversation: Photon and BullX. Both promise fast execution, real-time charts, and MEV protection, but they take very different approaches to getting you from token discovery to trade execution.

    Photon vs BullX - Best Solana Trading Bot Comparison 2026
    Photon vs BullX: Which Solana trading bot comes out on top in 2026?

    So which one deserves a spot in your trading workflow? We spent weeks testing both platforms across memecoin sniping, DeFi token swaps, and active chart trading to find out. Here’s our honest, data-backed verdict.

    Quick Verdict: Photon vs BullX

    Short on time? Here’s the bottom line: Photon wins for pure speed and visual trading on Solana. BullX wins for multi-chain coverage and advanced order automation. If you only trade on Solana and want the fastest possible execution with clean charts, go with Photon. If you trade across multiple chains and want sophisticated automation tools like grid trading and DCA, BullX is your pick.

    Photon vs BullX feature comparison table
    Photon vs BullX at a glance

    What is Photon?

    Photon is a web-based trading terminal built exclusively for Solana. It focuses on speed above everything else, offering real-time candlestick charts, one-click trading with preset SOL amounts, and private node infrastructure with Jito bundle integration for reliable transaction landing. Since its launch, Photon has become the go-to terminal for memecoin traders who need to react to price action within seconds.

    The platform supports trading on Pump.fun, Raydium, Jupiter, and other Solana DEX protocols, all from a single browser-based interface. There’s no Telegram bot and no mobile app. Photon is purely a web trading dashboard, and it does that one thing exceptionally well.

    What is BullX?

    BullX (including its upgraded version, BullX Neo) is a hybrid trading terminal that combines a web dashboard with Telegram bot functionality. Unlike Photon’s Solana-only approach, BullX supports five chains: Solana, Ethereum, Base, TRON, and Blast. This makes it appealing to traders who want one interface for their entire on-chain portfolio.

    BullX’s standout feature is Pump Vision (upgraded to “Neo Vision” in the latest release), which provides real-time chart previews for every new token hitting the market. The platform also offers a broader range of order types, including grid trading and dollar-cost averaging (DCA) strategies that go beyond what most trading terminals provide.

    Solana trading terminal dashboard with live charts and candlestick data
    Modern Solana trading terminals offer real-time charts, one-click execution, and MEV protection

    Features Deep Dive

    Charting and Interface

    Both platforms use TradingView-style charts with drawing tools and technical indicators. Photon’s charts update faster, with a UI refresh rate that visibly outpaces BullX during high-volatility moments. The color-coded transaction history in Photon makes it easy to track your P&L in real time without switching views.

    BullX counters with a more feature-dense interface. The TradingView integration includes a wider selection of drawing tools and indicators. BullX Neo’s dashboard also surfaces market analytics alongside your trading view, so you can monitor new token launches while managing existing positions.

    Order Types and Automation

    This is where BullX pulls ahead significantly. While Photon offers basic market orders, limit orders, and DCA orders, BullX provides a full automation suite: rule-based swaps, stop-loss, take-profit, DCA, and grid trading strategies. For traders who want to set up complex entries and exits without watching charts 24/7, BullX is the clear winner.

    Photon is designed for active, hands-on trading. Its one-click preset buttons (configurable in settings for amounts like 0.1, 0.25, 0.5, or 1 SOL) make rapid-fire trading smooth, but you need to be at your screen to use them effectively.

    Token Discovery

    Photon includes a trending feed that aggregates the highest-volume tokens sorted by volume and launch recency. It’s functional but basic. You can paste any token contract address and start trading within seconds.

    BullX’s Pump Vision / Neo Vision is a major differentiator here. It categorizes new tokens based on their lifecycle stage and provides real-time chart previews without requiring you to navigate to each token individually. For traders focused on catching new launches early, this feature alone could justify choosing BullX. If you want to learn more about the tools Solana traders use for token discovery, check out our Axiom Review 2026 for another popular option.

    Multi-Chain Support

    Photon is Solana-only. Full stop. If you trade exclusively on Solana, this isn’t a limitation. If you also trade on Ethereum, Base, or other chains, you’ll need a second tool.

    BullX supports Solana, Ethereum, Base, TRON, and Blast from a single interface. Switching between chains is seamless, and your portfolio view aggregates holdings across all supported networks. For traders who move between ecosystems, this is a significant convenience advantage.

    Fees and Pricing

    Both platforms follow a simple fee model with no monthly subscriptions:

    Photon charges approximately 1% per swap on the initial token amount. When you factor in Solana base gas (under 0.000005 SOL) and priority fees/Jito tips (0.001 to 0.01 SOL, user-adjustable), the realistic total cost per trade is roughly 1.1% to 1.5% under normal network conditions.

    BullX charges a flat 0.9% transaction fee on all executed trades across all supported chains. This slightly lower base fee adds up for high-frequency traders. BullX also offers a 10% fee discount through referral signups, bringing the effective rate down to approximately 0.81%.

    On pure fee comparison, BullX has the edge at 0.9% vs Photon’s 1%. Over hundreds of trades, that 0.1% difference becomes meaningful. However, Photon’s faster execution can sometimes offset this through better fill prices during volatile moments.

    Pros and Cons

    Photon

    Pros:

    • Fastest UI refresh and execution speeds among web-based Solana trading terminals
    • Excellent visual feedback with real-time color-coded transaction history and live charts
    • Quick setup: you can be trading within minutes of your first visit
    • Non-custodial wallet with immediate private key export
    • Token safety indicators (mint authority status, liquidity locks, holder distribution) displayed before every trade

    Cons:

    • Solana-only, with no multi-chain support
    • Limited automation compared to BullX (no grid trading or rule-based swaps)
    • No Telegram bot or mobile interface
    • Requires active screen monitoring rather than “set and forget” strategies

    BullX

    Pros:

    • Multi-chain support (Solana, ETH, Base, TRON, Blast) from one interface
    • Advanced order types including grid trading, DCA, and rule-based automation
    • Pump Vision / Neo Vision for real-time new token monitoring
    • Lower base trading fee (0.9% vs 1%)
    • Both web dashboard and Telegram bot access

    Cons:

    • Slightly slower execution than Photon on Solana specifically
    • Steeper learning curve due to feature density
    • 1% (or 0.9%) fee accumulates quickly for high-frequency traders
    • No free tier or trial period

    Comparison Table

    Feature Photon BullX
    Trading Fee ~1% 0.9%
    Supported Chains Solana only SOL, ETH, Base, TRON, Blast
    Interface Web app Web app + Telegram bot
    Execution Speed Ultra-fast (private nodes + Jito) Fast (JITO MEV bundling)
    MEV Protection Yes (Smart-MEV toggles) Yes (JITO bundling)
    Order Types Market, Limit, DCA Market, Limit, DCA, Grid, Stop-Loss, Take-Profit
    Token Discovery Trending feed Pump Vision / Neo Vision
    Wallet Built-in (non-custodial) Connect external wallet
    Mobile Access Browser only Telegram bot on mobile
    Best For Speed-focused Solana traders Multi-chain traders & automation fans

    Security and Trust

    Both Photon and BullX take a non-custodial approach, which means your private keys remain under your control. However, they handle this differently.

    Photon generates a built-in wallet when you first connect. You’re encouraged to export your private key immediately and store it offline. The platform displays token safety indicators before every trade, showing mint authority status, liquidity lock details, and top holder percentages. This is a useful safety net for traders dealing with new and potentially risky tokens.

    BullX connects to your existing external wallets (Phantom for Solana, MetaMask for EVM chains). This approach means your keys never touch BullX’s servers, which some traders prefer from a security standpoint. Both platforms offer MEV protection through Jito infrastructure to shield trades from sandwich attacks.

    Neither platform has published third-party security audits of their trading infrastructure, which is worth noting. As with any on-chain trading tool, it’s wise to only deposit active trading capital and keep the bulk of your holdings in a hardware wallet. For more on the Solana ecosystem’s evolving security landscape, see our Solana price prediction and ecosystem analysis.

    User Experience

    Photon’s learning curve is shorter. The interface is clean and focused: charts on top, trading controls below, transaction history on the side. You can be executing trades within minutes of your first visit. The one-click preset buttons remove friction for rapid trading, and the overall design feels purpose-built for speed.

    BullX has a steeper initial learning curve because there’s simply more to learn. The Neo Vision dashboard, multi-chain switching, advanced order configuration, and Telegram bot integration all add layers of complexity. Once you’re past the setup phase, the additional features become second nature, but expect to spend 30 to 60 minutes getting comfortable with the full feature set.

    For mobile access, BullX has a clear advantage through its Telegram bot. You can monitor positions and execute trades from your phone without opening a browser. Photon is browser-only, which means trading on mobile requires navigating the full web interface on a smaller screen.

    Verdict: Which Should You Choose?

    Choose Photon if: You trade exclusively on Solana, you prioritize execution speed above all else, you’re a visual/chart-driven trader who actively monitors positions, and you want the simplest possible path from token discovery to trade execution. Photon is the best Solana-specific trading terminal available in 2026 for active, hands-on traders.

    Choose BullX if: You trade across multiple chains (not just Solana), you want advanced automation like grid trading and DCA strategies, you need mobile access through Telegram, or you’re focused on catching new token launches early through Pump Vision. BullX is the better all-around trading terminal for traders who value versatility and automation.

    Our overall pick: For most Solana-focused traders, we’d recommend starting with Photon for its speed advantage, and adding BullX when you need multi-chain coverage or more sophisticated order management. Many experienced traders use both.

    FAQ

    Is Photon safe to use?

    Photon uses a non-custodial wallet model, meaning you control your private keys. However, as with any hot wallet trading tool, you should only deposit funds you’re actively trading with and export your private key to offline storage immediately after setup.

    Does BullX support Solana?

    Yes. BullX supports Solana alongside Ethereum, Base, TRON, and Blast. You can trade Solana tokens through both the web dashboard and the Telegram bot.

    Which has lower fees, Photon or BullX?

    BullX has a slightly lower base fee at 0.9% compared to Photon’s approximately 1%. With a referral discount, BullX’s effective fee drops to around 0.81%. However, total trading costs also depend on network gas fees and priority tip settings.

    Can I use Photon on my phone?

    Photon doesn’t have a dedicated mobile app or Telegram bot. You can access it through a mobile browser, but the experience is optimized for desktop. BullX offers a Telegram bot for mobile trading.

    Which is better for memecoin trading?

    Both are popular among memecoin traders. Photon’s speed advantage makes it slightly better for sniping new launches on Solana. BullX’s Pump Vision feature is better for discovering and evaluating new tokens before committing to a trade. Your choice depends on whether you prioritize execution speed (Photon) or discovery tools (BullX).

    Bittensor (TAO) Price Prediction 2026: Can TAO Recover?

    Bittensor (TAO) just had a rough week. After surging 62% in early April 2026 to nearly $332, the AI-powered blockchain network shed 23% in two days after one of its largest subnet operators walked out the door. As of April 13, 2026, TAO is trading around $261, down 66% from its all-time high of $757.60.

    The question the market is asking: is this a temporary shakeout, or the start of a longer decline? We ran our AI model, pulled the on-chain data, and looked at both sides of the trade. Here is what we found.

    Bittensor TAO price prediction 2026 hero image showing current price $261 and 7-day decline

    What Is Bittensor?

    Bittensor is a decentralized AI network built on its own blockchain. Instead of running AI models in centralized data centers, Bittensor lets anyone contribute computing power or AI models to its network of subnets. Contributors earn TAO tokens for their work.

    Think of it like a decentralized version of AWS for AI. Each subnet specializes in a different task: text generation, image recognition, prediction markets, and more. At its peak, Bittensor was running over 60 active subnets with hundreds of validators and miners worldwide.

    The tokenomics are designed to mirror Bitcoin’s scarcity model. TAO has a hard cap of 21 million tokens. The first halving occurred on December 14, 2025, cutting daily emissions from 7,200 TAO to 3,600 TAO. With fewer tokens entering circulation each day, the supply side is structurally tightening.

    At time of writing, approximately 9.6 million TAO are in circulation, giving it a market cap of roughly $2.5 billion and a rank of #38 by market cap on CoinGecko.

    The Covenant AI Exit: What Actually Happened

    On April 10-11, 2026, Covenant AI, one of Bittensor’s most prominent subnet operators, announced it was leaving the network. The founder, Sam Dare, published a public statement accusing Bittensor co-founder Jacob Steeves of exercising outsized control over what was supposed to be a permissionless, decentralized protocol.

    The specific allegations included:

    • Suspending token emissions to Covenant AI’s subnets
    • Overriding community moderation decisions
    • Unilaterally deprecating infrastructure
    • Using large personal token sales to apply economic pressure

    Covenant AI did not just walk away. They sold approximately 37,000 TAO (roughly $10.2 million at the time) and shut down three active subnets. The market reacted immediately. TAO dropped from around $332 to a low near $254, a 23% decline in under 48 hours.

    Bittensor’s co-founder Jacob Steeves denied the centralization claims. But the damage to market confidence was done. When a project’s largest contributor publicly accuses leadership of undermining the protocol’s core promise, the market does not quickly forget.

    Technical Analysis: Where Does TAO Stand?

    TAO’s chart tells a story of a token that was building momentum before running into a governance wall.

    Key levels to know:

    • Current price: ~$261
    • 30-day moving average: ~$297 (TAO is trading below this, a bearish signal)
    • RSI (Relative Strength Index): 45.52, below 50, indicating bearish momentum but not yet oversold (oversold is typically below 30)
    • Support: $240-$250 zone is the immediate floor. Below that, $200 is the next major level.
    • Resistance: $273 (first test), $297 (30-day MA), $332 (pre-crash high)

    The RSI reading is worth watching closely. At 45.52, TAO has room to fall further before reaching oversold territory. A hold above $250 would be encouraging. A break below $240 could trigger a move toward $200.

    The 7-day volume has been elevated, which makes sense given the Covenant AI news. High volume on down moves typically indicates selling pressure, not accumulation. That said, volume has started to stabilize over the past 24 hours, which suggests the panic selling may be subsiding.

    The Bull Case: Why TAO Could Still Recover

    The governance drama is real, but so are Bittensor’s fundamentals. Here is the case for TAO recovering from this pullback.

    1. The halving creates genuine scarcity. With daily emissions now capped at 3,600 TAO, the supply side is tightening every day. If demand holds steady or grows, basic supply economics favor price recovery. Bitcoin’s halvings consistently preceded major rallies, and Bittensor’s design follows the same playbook.

    2. The AI narrative is not going away. Decentralized AI infrastructure is one of crypto’s strongest fundamental use cases. Bittensor remains the leading project in this category by market cap and mind share. One subnet operator leaving does not invalidate the thesis, even if it raises governance questions.

    3. The network is still running. Despite the exit, Bittensor’s remaining subnets continue to operate. The network processed transactions normally throughout the selloff. Infrastructure resilience matters more than any single operator’s departure.

    4. TAO was up 62% in April before the crash. That move suggests real buying interest and a broader AI token tailwind. A correction after a 62% run is not unusual. The question is whether buyers return at the $250-$260 support zone.

    Our AI model currently assigns a 54% probability of TAO recovering above $300 within the next 60 days, conditional on holding the $240 support zone.

    The Bear Case: What Could Go Wrong

    The bull case requires governance trust to hold. Here is where that assumption could break down.

    1. Trust is hard to rebuild quickly. Covenant AI’s exit was a public indictment of the protocol’s governance. If other subnet operators share similar concerns but have not spoken up yet, more exits could follow. That is the tail risk the market is pricing in right now.

    2. RSI has room to fall further. At 45.52, TAO is not oversold. The absence of a technical floor means there is no automatic bounce signal to lean on. Momentum indicators are pointed down.

    3. Macro conditions are not supportive. The broader crypto market has been dealing with elevated oil prices, persistent inflation, and a Federal Reserve that is not cutting rates. Bitcoin dropped 2.71% around the same period. Risk assets across the board are under pressure.

    4. The $240-$250 support zone has not been tested yet. If selling pressure increases and TAO breaks below $240, a move to $200 becomes the near-term base case. That would represent a 30% further decline from current levels.

    The bear case becomes more likely if TAO closes two consecutive daily candles below $250, or if additional large subnet operators announce exits.

    Bittensor (TAO) Price Predictions

    These predictions are generated by our hybrid AI model using technical indicators, on-chain data, and market sentiment analysis. They are not guarantees.

    Short-term (30 days): TAO needs to reclaim the $273 resistance to confirm any meaningful recovery. The base case is consolidation between $240 and $280. Our model sets a bull target of $330 (recovery of pre-crash levels) and a bear target of $210 (break below $240 support).

    Mid-term (6 months): If Bittensor resolves its governance questions and the AI narrative continues to attract capital, a move toward $400-$520 is plausible by end of 2026. The base case sits around $340-$380. The bear case, if governance continues to deteriorate, is a grind toward $150-$180.

    Long-term (2027-2028): This is where the halving thesis becomes most relevant. With emissions continuing to decline and a total supply cap of 21 million TAO, scarcity-driven price appreciation is the core bull argument. Our long-term base case is $600-$700 by 2028. The bull case, assuming continued AI infrastructure demand and resolved governance, is $1,000-$1,200. The bear case, if the network loses critical mass of subnet operators, is $250-$350.

    Bittensor TAO price prediction table 2026 showing bear, base, and bull targets for short-term, mid-term, and long-term

    For a comparable AI agent token in the Solana ecosystem, see our recent analysis of AI Rig Complex (ARC), which covers similar dynamics around AI network tokens and governance risk.

    What to Watch

    Here are the specific signals that will determine which scenario plays out for TAO over the next 30-90 days:

    • $240-$250 support zone: This is the key level. A hold here would suggest buyers are absorbing the Covenant AI news. A break below opens the door to $200.
    • Subnet operator activity: Watch for announcements from other major subnet operators. Additional exits would validate the governance risk thesis.
    • Bittensor Foundation response: Any formal governance reform announcement would be bullish. Silence would be bearish.
    • Bitcoin correlation: TAO tends to move with BTC in macro risk-off environments. If Bitcoin reclaims $70,000, altcoins like TAO typically get a tailwind.
    • RSI rebound: Watch for RSI to cross back above 50 on the daily chart. That would be the first technical signal that selling pressure is easing.

    Disclaimer: This article is for informational and educational purposes only and should not be construed as financial, investment, or trading advice. Cryptocurrency markets are highly volatile, and past performance does not guarantee future results. The price predictions and analyses presented here are based on AI models, technical indicators, and available data at the time of writing. They are not guarantees. Always conduct your own research (DYOR) and consult with a qualified financial advisor before making any investment decisions. Pump Parade and its authors do not assume liability for financial losses incurred based on information provided in this article.

    About our AI predictions: Pump Parade’s price predictions are generated by machine learning models that analyze technical indicators, on-chain data, and market sentiment. These models have limitations and cannot account for black swan events, regulatory changes, or sudden market shifts. Prediction confidence scores reflect the model’s internal assessment, not guaranteed accuracy. Use AI predictions as one input among many in your research.