

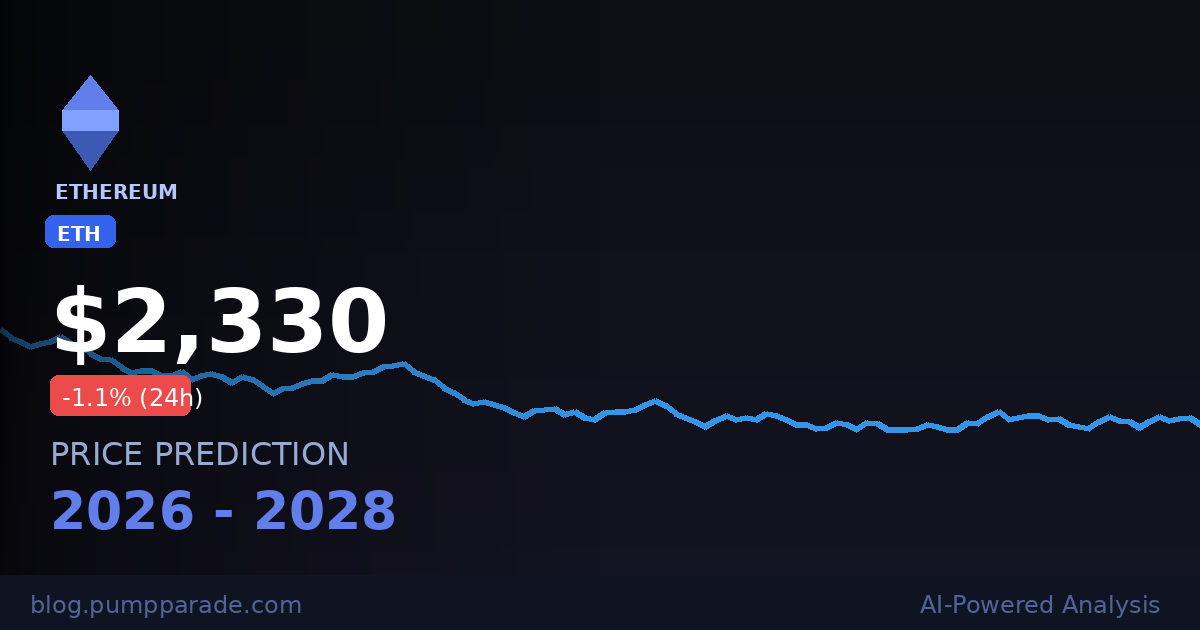
Ethereum (ETH) is trading at $2,330 as of April 19, 2026. That is down sharply from the highs it touched after the Pectra upgrade activated in May 2025. The weekly RSI (Relative Strength Index) sits near 30. Historically, that level has marked Ethereum’s cyclical price floors.
So here is the real question: is ETH in a deep accumulation phase, or is this a prolonged breakdown? The data points in two directions. That is exactly why this is worth analyzing right now.
In this article, we break down the current market setup, the technical picture, the key catalysts, and what our AI model assigns as price targets across three timeframes. We also cover the bear case, because ignoring downside risk is how traders get hurt.
What Is Ethereum?
Ethereum is the world’s second-largest cryptocurrency by market capitalization. It is a programmable blockchain that hosts decentralized applications, smart contracts, DeFi protocols, NFTs, and stablecoins.
Think of it as the internet’s settlement layer for digital finance. Bitcoin stores value. Ethereum runs programs. That distinction is why Ethereum’s total addressable market is so large.
According to CoinMarketCap, ETH has a circulating supply of approximately 120 million coins and a current market cap of around $280.7 billion. That makes it the most valuable smart contract platform by a significant margin.
Current Price and Market Context
ETH closed the week of April 14-19 at $2,330, up 5.5% over seven days but down roughly 55% from its 2025 all-time high zone. The 24-hour trading volume is approximately $19.25 billion.
Here is the context that matters. Ethereum ran aggressively after the Pectra upgrade went live on May 7, 2025. It posted a 20% weekly gain, its largest in over four years. Since then, the market has digested that move. Price has settled into a wide consolidation range between $2,100 and $2,400.
That range has held for over two months. A decisive break above $2,400 or below $2,100 would define the next leg.
The Pectra Upgrade: Why It Still Matters
Pectra was Ethereum’s most significant protocol upgrade since the Merge in 2022. It combined two coordinated hard forks: Prague on the execution layer and Electra on the consensus layer.
Three changes stand out for long-term ETH valuation:
- Maximum stake raised from 32 ETH to 2,048 ETH. Institutions no longer need to manage hundreds of separate validators. This dramatically reduces staking friction for large capital allocators.
- Validator activation time cut from 13 hours to 13 minutes. New ETH entering the staking system deploys faster. This improves capital efficiency across the ecosystem.
- EIP-7702 enables smart account functionality. Standard wallets can now temporarily act as smart contracts. Users can pay gas fees in stablecoins instead of ETH. This is a meaningful step toward mainstream usability.
Standard Chartered cited these changes as the primary driver behind their updated price target of $15,000 for ETH by 2027. That is not a fringe prediction. It comes from one of the world’s largest banks.
Looking ahead, the PeerDAS upgrade is scheduled for later in 2026. PeerDAS will dramatically increase data availability bandwidth for Layer 2 rollups. More L2 activity means more ETH burned, and more burned ETH means deflationary pressure on the supply.
Technical Analysis
Let us look at what the chart is actually saying.
The 14-day RSI sits at approximately 39. That is above oversold territory (below 30) but clearly weak. Momentum has not turned bullish yet.
The weekly RSI is more interesting. It is hovering near 30. In every Ethereum market cycle since 2018, a weekly RSI at or below 30 has coincided with a price floor, not a further collapse. That does not guarantee a bottom here. It does suggest the risk-reward for patient accumulators is historically favorable.
Key levels to watch:
- Immediate resistance: $2,230 (recent trading high). A sustained close above this level opens the door to $2,600.
- Key support: $2,056. A weekly close below this level would shift the short-term trend from neutral to bearish.
- Major support: $1,800 to $1,900. This is the next structural floor if the $2,056 level fails.
The 50-day moving average is sitting above the current price, acting as overhead resistance near $2,450. ETH would need to reclaim and hold above that level to signal a proper trend reversal.
Compare this to our Bitcoin (BTC) price prediction for 2026, where BTC faces a similar consolidation pattern. When BTC breaks its range, Ethereum historically follows, often with amplified magnitude.
The Bull Case for Ethereum in 2026
Here is what has to go right for ETH to push significantly higher.
First, the PeerDAS upgrade delivers as expected. If L2 activity surges post-PeerDAS, ETH burn rates could accelerate. A deflationary supply shock combined with growing staking demand would tighten circulating supply significantly.
Second, staked ETH ETF products gain traction. Several asset managers filed for spot ETH ETF products with staking yield in late 2025. If those products reach the market in 2026, they would pull significant ETH off exchanges and into long-term lockup.
Third, BTC leads a broad market rally. ETH has historically multiplied BTC’s gains by a factor of 1.5x to 3x during bull phases. If BTC reclaims $90K-$100K, Ethereum at $5,000 to $6,000 is a reasonable base case, not an optimistic stretch.
Our AI model assigns a 65% probability of ETH reaching $3,200 within 30 days if it can break and hold above $2,400 on strong volume.
The Bear Case: What Could Go Wrong
Crypto is full of confident predictions that aged poorly. Here is the honest risk picture.
Ethereum has lost significant market share to Solana and other high-performance chains over the past 18 months. If L2 fragmentation continues and ETH burn rates stay low, the deflationary narrative weakens.
Macro conditions remain uncertain. If the broader risk asset environment deteriorates, ETH could revisit the $1,800 to $1,900 support zone. A break below $1,800 would invalidate the current accumulation thesis entirely.
There is also competition risk. New Layer 1 blockchains are shipping faster upgrades with fewer coordination headaches. Ethereum’s governance process is methodical but slow. That creates windows for competitors to capture developer mindshare.
Bearish scenario: if key support at $2,056 fails on a weekly close, the next technical target is $1,900. A macro shock could push it to $1,600 in a worst-case scenario.
AI Price Prediction Summary
Our hybrid AI model combines technical indicators, on-chain data, historical cycle analysis, and sentiment signals. Here are the outputs for three timeframes as of April 19, 2026.
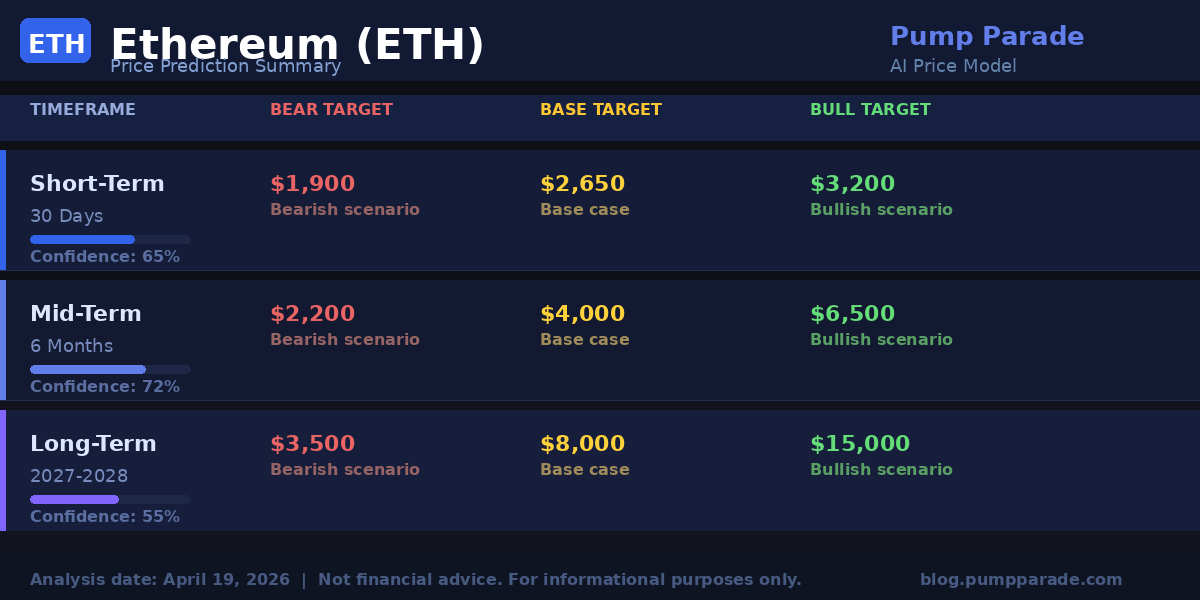
Short-Term (30 Days)
Bear target: $1,900. Base target: $2,650. Bull target: $3,200. Confidence score: 65%. The short-term outcome depends heavily on whether ETH can break above $2,230 resistance on meaningful volume.
Mid-Term (6 Months)
Bear target: $2,200. Base target: $4,000. Bull target: $6,500. Confidence score: 72%. A successful PeerDAS upgrade and continued institutional staking inflows support the base case move toward $4,000 by Q4 2026.
Long-Term (2027-2028)
Bear target: $3,500. Base target: $8,000. Bull target: $15,000. Confidence score: 55%. The $15,000 bull target aligns with Standard Chartered’s official forecast. It requires staked ETF adoption, sustained L2 growth, and a favorable macro environment. Lower confidence scores at longer timeframes reflect genuine uncertainty, not pessimism.
What to Watch
These are the signals that will tell you whether the bull or bear case is materializing:
- Weekly close above $2,230: This would be the first real signal of trend reversal from the current consolidation range.
- ETH staking rate: If the percentage of circulating ETH staked continues to rise past 30%, supply pressure builds in ETH’s favor.
- PeerDAS activation timeline: Watch for official Ethereum Foundation announcements. A confirmed late-2026 activation date would be a positive catalyst.
- BTC price action: If BTC breaks above $80K-$85K with conviction, ETH will likely follow with an amplified move.
- Staked ETH ETF filings: Any SEC approvals or denials in 2026 will move the market quickly.
Conclusion: Patience Has a Price Target
Ethereum at $2,330 is not an obvious trade. The technical picture is weak in the short term. The weekly RSI near 30 is historically constructive, but it is not a guarantee.
What is clear is this: the fundamental case for ETH in 2026 is stronger than the price currently implies. Pectra is live. PeerDAS is coming. Institutional staking is growing. Standard Chartered’s $15,000 target is an outlier, but $5,000 to $8,000 by 2027 is not.
The risk-reward here favors watching the key levels closely. A break above $2,230 with volume is your signal. A weekly close below $2,056 is your stop signal.
Position sizing and patience are the smart plays right now, not chasing.
Disclaimer: This article is for informational and educational purposes only and should not be construed as financial, investment, or trading advice. Cryptocurrency markets are highly volatile, and past performance does not guarantee future results. The price predictions and analyses presented here are based on AI models, technical indicators, and available data at the time of writing. They are not guarantees. Always conduct your own research and consult with a qualified financial advisor before making any investment decisions. Pump Parade and its authors do not assume liability for financial losses incurred based on information provided in this article.
About our AI predictions: Pump Parade’s price predictions are generated by machine learning models that analyze technical indicators, on-chain data, and market sentiment. These models have limitations and cannot account for black swan events, regulatory changes, or sudden market shifts. Use AI predictions as one input among many in your research.
