More
    Home Blog Page 19

    Toncoin (TON) Price Prediction 2026: Telegram Catalyst

    Toncoin (TON) is having a strange month. The token rocketed from $1.36 to $2.90 in early May 2026, a 115% rally in six days. Now it sits at $2.08, down 21% in the last week. The pullback has traders asking one question: was that the start of a bigger move, or just a Telegram pump that burned out?

    The answer matters because TON’s story has changed. Pavel Durov is no longer hands-off. Telegram now runs the network, stakes the biggest validator, and has cut fees by a factor of six. That is a real catalyst, not a meme. The price action since the rally is a reminder that real catalysts still meet real resistance.

    We pulled live data from CoinGecko, mapped the Telegram takeover against on-chain activity, and ran our AI model across short, mid, and long horizons. Here is where TON could go through 2028.
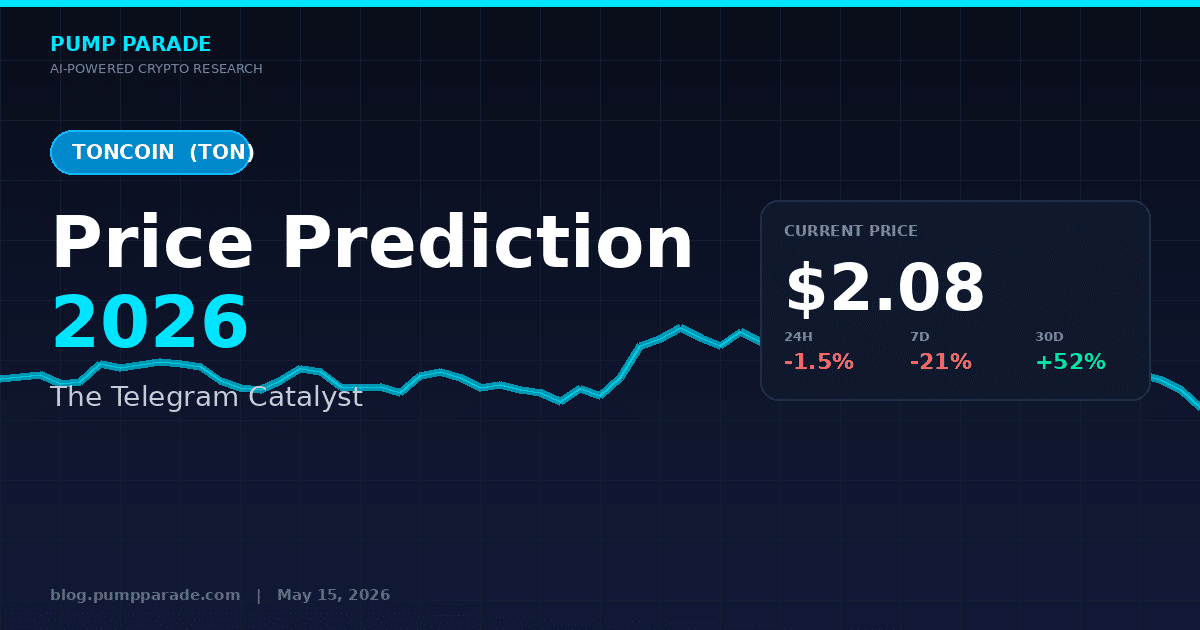
    Toncoin TON price prediction 2026 with current price $2.08 and recent performance

    Where TON Trades Right Now

    As of May 15, 2026, Toncoin trades at $2.08 with a market cap near $5.6 billion. Daily volume sits at $333 million. The 24-hour move is a mild -1.5%. The seven-day chart is uglier: -21%.

    Zoom out and the picture flips. TON is up 52% over the last 30 days. That is one of the strongest monthly returns in the top 25 by market cap. The token is still 75% below its $8.25 all-time high from June 2024.

    So you have a token that ripped on a real catalyst, gave back about a third of the move, and remains far from its peak. That is a setup worth watching, not chasing.

    The Telegram Catalyst, In Plain Terms

    Here is what changed in early May. Pavel Durov, Telegram’s founder, announced that Telegram itself will take over network direction. The TON Foundation is no longer the lead steward. Telegram now operates the largest validator, with around 2.2 million TON staked.

    Three concrete upgrades came with the takeover:

    • Fees cut 6x. A standard transfer now costs about $0.0005. That is near-zero by any practical measure.
    • Catchain 2.0 went live. Block finality dropped below one second. TON is now one of the fastest layer-1 chains in production.
    • The MTONGA roadmap. Short for “Make TON Great Again,” it lays out seven steps to turn TON into a mobile-first settlement layer for Telegram’s user base.

    That last point is the real story. Telegram has more than one billion monthly active users. If even a small slice of them transacts in TON, the demand floor is structural, not speculative.

    The Bull Case for TON in 2026

    The bull case rests on three legs. The first is the Telegram integration itself. Wallets are now native inside the app. Sending TON to a contact is as easy as sending a sticker. That removes the biggest friction point in crypto: onboarding.

    The second leg is the ecosystem. Meme tokens on TON, including Dogs and Notcoin, rallied 26-90% during the May spike. Builder activity has picked up. New TON-based DeFi protocols are launching weekly. A chain with one billion potential users plus fast and cheap transactions is hard to ignore.

    The third leg is the chart. TON tested $1.30 in April and held. It now sits above its 50-day moving average. If buyers defend the $2.00 zone, the next resistance is $2.60. Above that, the 200-day moving average near $3.20 comes into play.

    Analysts at several research firms have year-end 2026 targets in the $5 to $8 range. Those numbers require sustained user growth from Telegram, not just speculation.

    The Bear Case You Should Take Seriously

    Now the other side. TON has rallied this hard before and given it back. The June 2024 peak at $8.25 was followed by an 80% drawdown. Telegram-driven hype has a track record of fading fast.

    Three risks stand out. First, centralization. A network where the founder’s company is the biggest validator and the protocol director is not decentralized in any meaningful sense. That makes TON a regulatory target. The SEC has already flagged similar structures on other chains.

    Second, supply. TON has a circulating supply of 2.69 billion and a total supply of 5.18 billion. Roughly half the tokens are not yet circulating. Unlocks could pressure the price even if demand stays strong.

    Third, the macro. Bitcoin trades near $80,000, down from its January high. The broader crypto market is in a measured recovery, not a melt-up. If risk assets sell off, altcoins like TON tend to fall harder than majors.

    For context, the same pattern played out with other Layer-1 tokens this cycle. See our breakdown of Solana’s Alpenglow setup for how a single upgrade can swing sentiment in either direction.

    Technical Outlook

    The daily chart shows a clean technical structure. TON broke above the descending trendline from June 2024 during the May rally. That breakout is still valid as long as price holds above $1.80.

    RSI on the daily reads 48. That is neutral. It cooled from an overbought 78 at the rally peak. There is room to run if buyers step in.

    The MACD is starting to curl back up after the pullback. Volume on down days has been lower than volume on the rally. That is a healthy sign. It suggests distribution is not the dominant force, at least not yet.

    Key levels to watch:

    • Support: $1.95, then $1.80, then $1.50
    • Resistance: $2.30, then $2.60, then $3.20

    A close above $2.30 on volume would reopen the upside. A daily close below $1.80 would invalidate the May breakout and target $1.50.

    TON Price Predictions by Timeframe
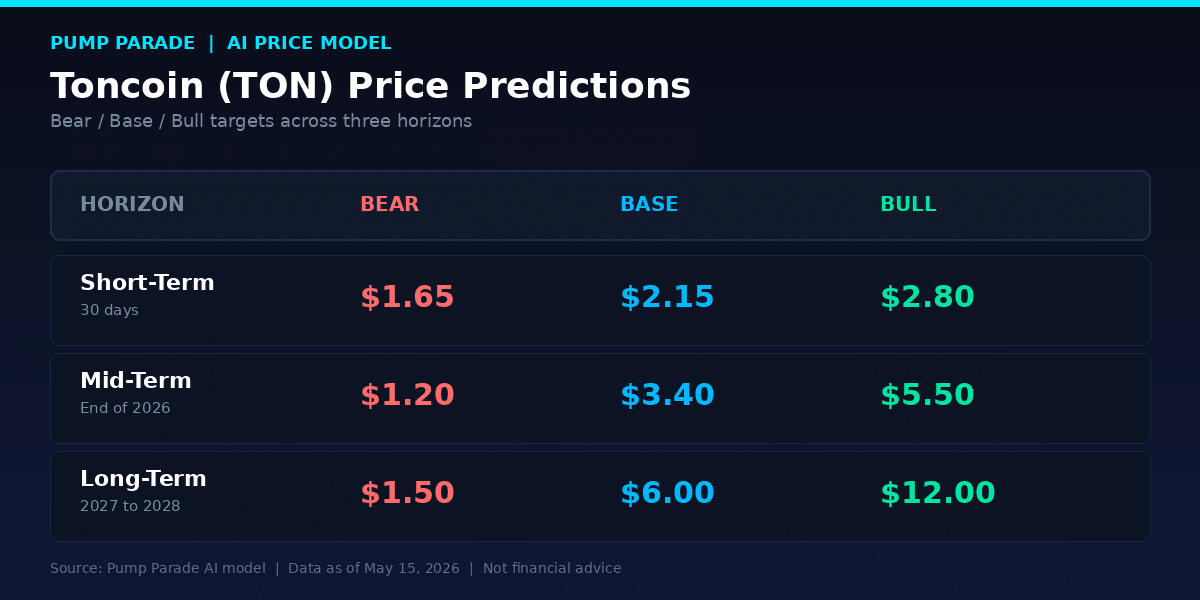
    Toncoin TON price prediction table bear base bull targets short mid long term

    Our AI model blends technical signals, on-chain growth, Telegram user metrics, and macro inputs. Here is the breakdown.

    Short-Term: Next 30 Days

    The next month is a coin flip between consolidation and a retest of $2.60. The Telegram catalyst is priced in for now. New buyers need a fresh trigger.

    • Bear: $1.65 if BTC breaks $76,000 support
    • Base: $2.15 in a sideways grind
    • Bull: $2.80 if Telegram announces a new wallet feature or partnership

    Mid-Term: 6 Months (End of 2026)

    By the end of 2026, the picture depends on adoption metrics. Watch for monthly active wallet addresses, total value locked in TON DeFi, and transaction count growth. If those trend up, the price will follow.

    • Bear: $1.20 if the Telegram rollout stalls or regulators challenge the structure
    • Base: $3.40 with steady user growth and no major macro shock
    • Bull: $5.50 if TON captures even 1% of Telegram’s user base for monthly transactions

    Long-Term: 2027 to 2028

    This is where TON becomes interesting as a thesis. A successful Telegram integration would put TON in a category of one: the only chain with native, in-app distribution to a billion users.

    • Bear: $1.50 if the project gets squeezed by regulation or supply unlocks
    • Base: $6.00 with continued growth and partial ecosystem adoption
    • Bull: $12.00 in a scenario where TON becomes the default payment layer for Telegram commerce

    For comparison, Coinbase’s model puts TON at $2.84 in 2027 using a flat 5% annual growth rate. We think that underweights the Telegram angle. Other analysts at Coinpedia and Coincodex have called for $10 by late 2027 in their bull cases.

    What Could Change This Outlook

    Two events would force us to revise.

    A confirmed wallet rollout to all Telegram users in a major market like the US or Brazil would push the base case higher. We are talking real users transacting, not just custody. That is the single biggest unlock for TON.

    On the flip side, a regulatory action against Telegram in a key market would hit TON harder than most altcoins. The token’s value is now tied to Telegram’s operational freedom. That is both its strength and its biggest risk factor.

    The Bottom Line

    Toncoin is no longer just another Layer-1. It is a directional bet on whether Telegram can turn its user base into a crypto network. The May rally proved the market is willing to price that bet in. The pullback proved nobody is convinced yet.

    At $2.08, TON looks neither cheap nor expensive. It looks like a token waiting for the next catalyst. The setup favors patient buyers who can hold through volatility, not short-term traders chasing the last rally.

    Watch the $2.00 level. Watch the Telegram product announcements. Watch the on-chain activity numbers. Those three signals will tell you whether the next leg up is coming, or whether May was the peak.

    Disclaimer

    This article is for informational and educational purposes only and should not be construed as financial, investment, or trading advice. Cryptocurrency markets are highly volatile, and past performance does not guarantee future results. The price predictions and analyses presented here are based on AI models, technical indicators, and available data at the time of writing. They are not guarantees. Always conduct your own research (DYOR) and consult with a qualified financial advisor before making any investment decisions. Pump Parade and its authors do not assume liability for financial losses incurred based on information provided in this article.
    Ethereum (ETH) Price Prediction 2026: Glamsterdam Catalyst

    0

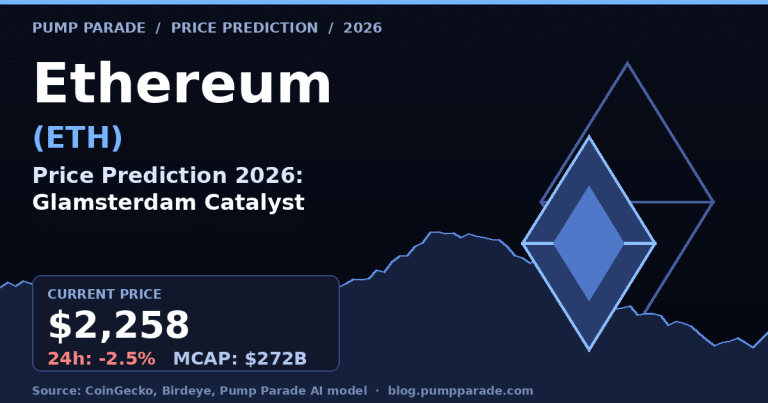
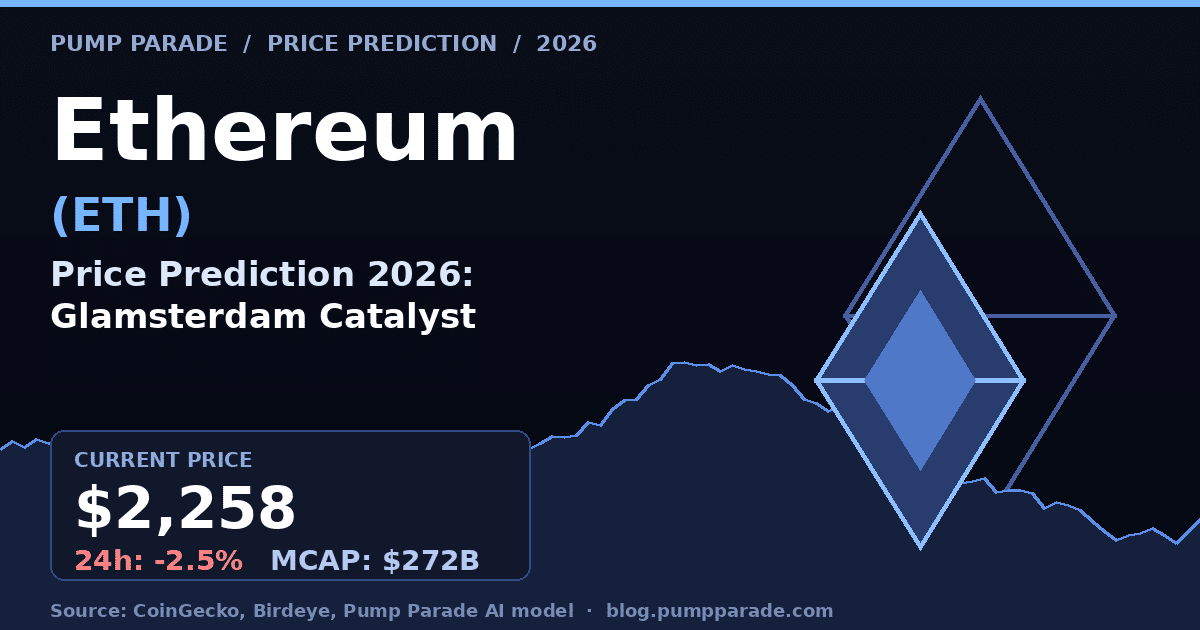
    Ethereum is trading at $2,258 as of May 14, 2026. That is down 2.5% in the last 24 hours, but up 29% from the February low of $1,743. The chart has stopped bleeding. The question is whether it can break out before the year’s biggest catalyst arrives.

    That catalyst is Glamsterdam, Ethereum’s next major network upgrade. Developers are targeting H1 2026 for mainnet activation, with some now pushing the timeline into Q3. When it ships, it could raise the gas limit from 60 million to 200 million per block. Throughput could approach 10,000 transactions per second. That is roughly 10 times what Ethereum handles today.

    Ethereum ETH price prediction 2026 hero, current price and Glamsterdam catalyst

    Whales have noticed. Wallets tracked by on-chain analytics accumulated over 140,000 ETH, worth about $322 million, in a 96-hour window earlier this month. ETF flows have also turned positive. May 1 saw $101.2 million in net inflows into U.S. spot ETH ETFs, with BlackRock’s ETHA and Fidelity’s FETH leading the day.

    Here is the data, the bull case, the bear case, and where our AI model lands on ETH for the rest of 2026.

    Ethereum at a Glance

    Ethereum is the second-largest cryptocurrency by market cap. At time of writing it sits at roughly $272 billion, behind Bitcoin’s $1.6 trillion. Daily trading volume runs around $14.3 billion.

    The protocol secures over $50 billion in DeFi total value locked. It also hosts the largest stablecoin market in crypto. More than $130 billion in USDT and USDC supply lives on Ethereum mainnet and its Layer 2 rollups.

    Three numbers matter most right now for traders:

    • Current price: $2,258
    • 52-week range: $1,743 low to roughly $4,100 high
    • Year-to-date: down approximately 30%, but recovering

    Technical Setup: What the Chart Is Saying

    ETH has been carving out a base between $2,000 and $2,400 for most of the past six weeks. That is a tight range after the February capitulation. Tight ranges after big drawdowns often resolve in one of two ways: a sharp breakout, or a final flush before recovery.

    Key levels to watch:

    • Support 1: $2,040, the April consolidation floor
    • Support 2: $1,743, the February cycle low
    • Resistance 1: $2,420, the level that traders flagged this week as a “strong move” trigger
    • Resistance 2: $2,800, the prior breakdown zone from December
    • Resistance 3: $3,400, the 200-day moving average

    The Relative Strength Index, a momentum indicator that measures whether an asset is overbought or oversold, sits around 48 on the daily chart. That is neutral territory. It leaves room for ETH to run higher without flashing immediate exhaustion signals.

    The 50-day moving average has flattened. The 200-day is still pointing down. A bullish reclaim of the 200-day at $3,400 would be the cleanest technical signal that the trend has flipped.

    The Bull Case: Glamsterdam, Staking ETFs, and CLARITY

    Three catalysts make the case for ETH upside through the rest of 2026.

    1. The Glamsterdam Upgrade

    Glamsterdam is the headline event. The upgrade introduces two major changes that could reshape Ethereum economics.

    First, ePBS (EIP-7732). In plain terms, this separates the heavy work of validating transactions from the lighter work of reaching consensus. It expands the data propagation window from 2 seconds to about 9 seconds. That unblocks Ethereum’s ability to handle much higher transaction throughput safely.

    Second, Block-Level Access Lists (EIP-7928). These let validators see in advance what data each block needs to read and write. The result is parallel transaction execution. Multiple transactions can be processed at the same time instead of one after another.

    Put together, the upgrade targets a 78% reduction in gas fees and a 10x lift in throughput. If it ships on time and works as designed, it will be the biggest performance jump for Ethereum since The Merge.

    2. The BlackRock Staked ETF

    BlackRock launched the iShares Staked Ethereum Trust (ticker: ETHB) on Nasdaq on March 12, 2026. It was the first major U.S. staking-enabled ETH ETF.

    The product stakes between 70% and 95% of its ether holdings through Coinbase Prime. Investors receive about 82% of the gross staking rewards, currently running at roughly 3.1% per year, distributed monthly. The non-staking ETHA fund still holds $6.5 billion in assets. ETHB adds a yield-bearing option that competes directly with bond products.

    The regulatory door for this opened in 2025. Combined April ETF inflows hit $356 million, with BlackRock and Fidelity accounting for over 90% of the total.

    3. The CLARITY Act

    The U.S. Senate Banking Committee is voting on an updated version of the CLARITY Act today. The bill addresses how digital asset issuers and exchanges are regulated. A compromise has been reached on stablecoin yield: issuers cannot pay interest on holdings, but related user incentives are allowed.

    For ETH, the practical impact is straightforward. A clearer regulatory framework reduces the discount that institutions apply to crypto exposure. It also helps unlock more conservative pools of capital that have stayed on the sidelines.

    The Bear Case: Delays, Macro, and L2 Cannibalization

    Balanced analysis means owning the downside too. Three risks deserve serious weight here.

    1. Glamsterdam Could Slip Again

    Ethereum upgrades have a history of pushing right. Glamsterdam was originally a June 2026 target. Developers are now openly discussing Q3. If testnet bugs surface, it could slide further. Each month of delay weakens the case for ETH outperformance because the market is already partly pricing the upgrade.

    2. Macro Risk

    Bitcoin is currently trading below $80,000 after producer price inflation surged to 6%. Hot inflation data has historically dragged risk assets lower. ETH tends to trade with a beta higher than 1 to Bitcoin during macro stress. If BTC retests $70,000, ETH could revisit $1,800 or lower.

    3. Layer 2 Cannibalization

    This is the structural concern that bears keep raising. Layer 2 rollups like Arbitrum, Base, and Optimism handle a growing share of Ethereum activity. They pay fees to mainnet, but post-Dencun blob pricing those fees are tiny. If Glamsterdam succeeds and L1 becomes cheaper, it could compete with the L2s for high-value transactions. If it slips, L2s keep growing and ETH revenue stays low.

    The bull rebuttal is that more total transactions, on L1 or L2, still drive ETH demand for gas and staking. The bear rebuttal is that EIP-1559 burn rates have dropped substantially from 2024 levels. Both points are valid. Watch the burn rate and L1 fee revenue trend over the next two quarters.

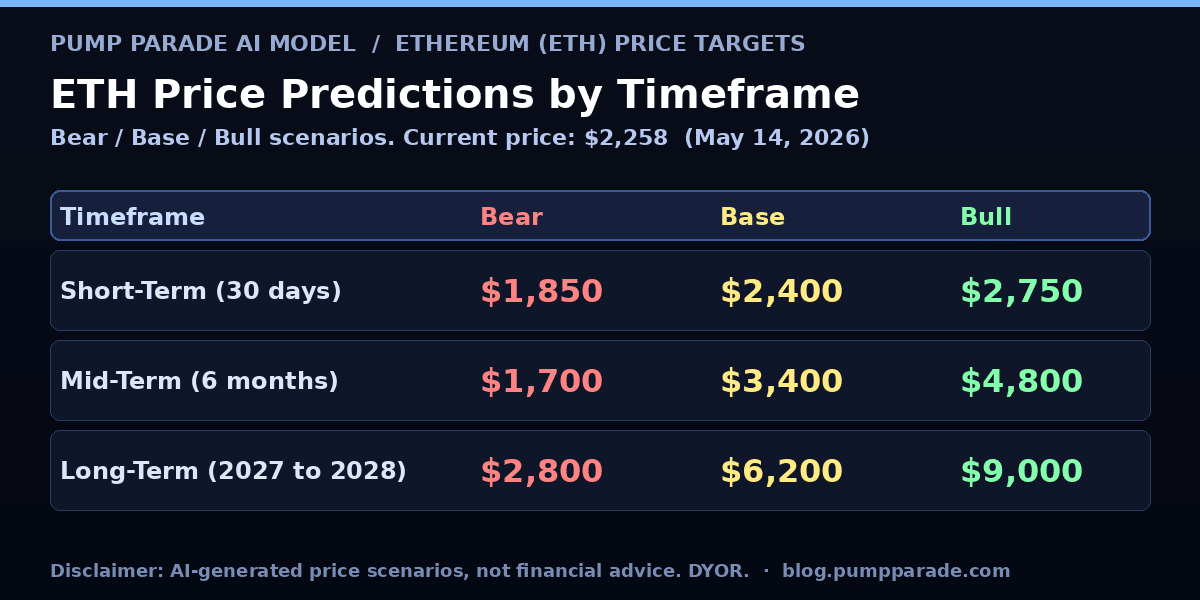
    Price Predictions by Timeframe

    Ethereum ETH price prediction 2026 bear base bull targets by timeframe

    Here is how our hybrid AI model frames the next 30 days, 6 months, and 24-plus months for ETH. These are scenarios, not promises.

    Short-Term (Next 30 Days)

    The base case is continued consolidation between $2,100 and $2,500. A clean breakout above $2,420 on volume would open the path to $2,800. A loss of $2,040 brings $1,800 back into view.

    • Bear target: $1,850
    • Base target: $2,400
    • Bull target: $2,750

    Medium-Term (6 Months, Through Q4 2026)

    This window contains the Glamsterdam activation, the next leg of ETF flows, and the post-CLARITY regulatory picture. If the upgrade ships in Q3 and macro stays neutral, the setup looks constructive. Historically, L1 narrative trades around major upgrades have run 60% to 100% from multi-month accumulation ranges.

    • Bear target: $1,700 (upgrade slips, macro deteriorates)
    • Base target: $3,400 (upgrade ships, ETF flows continue, BTC stable)
    • Bull target: $4,800 (upgrade plus altseason rotation plus rate cuts)

    Long-Term (2027 to 2028)

    Standard Chartered raised its end-2026 ETH target to $7,500 in a recent note. That is the high end of mainstream Wall Street estimates. Other analyst ranges cluster between $4,500 and $7,500 for base cases. Our model is slightly more measured but still constructive.

    • Bear target: $2,800
    • Base target: $6,200
    • Bull target: $9,000

    The bull case assumes Glamsterdam ships, staking ETFs continue to gather assets, and Ethereum maintains its lead as the dominant settlement layer for tokenized real-world assets. The tokenized Treasuries market on Ethereum recently crossed $8 billion. That is a structural tailwind that did not exist in prior cycles.

    What to Watch

    Five concrete signals will tell you whether the bull or bear path is winning over the next 90 days:

    1. Glamsterdam testnet milestones. Clean public testnet activation is the green light. Bugs that delay it are a red flag.
    2. ETF flows. Weekly net inflows above $300 million signal institutional demand is sustained. Sustained outflows mean the institutional bid is gone.
    3. The $2,420 resistance. A daily close above this level on above-average volume is the cleanest short-term breakout signal.
    4. The ETH burn rate. If post-Glamsterdam transaction volume lifts L1 burn meaningfully, the deflationary narrative comes back.
    5. Bitcoin’s behavior. ETH rarely runs hard while BTC is bleeding. A BTC reclaim of $85,000 would create the macro room for ETH to outperform.

    For traders watching parallel Layer 1 narratives, the playbook around major upgrades has been a familiar one. Solana’s upcoming Alpenglow upgrade is a useful reference point. We broke down that setup in our Solana price prediction for 2026. The mechanics are different, but the market structure around an upgrade-driven move tends to rhyme.

    The Bottom Line

    ETH is in a setup that rewards patience. The downside is bounded by a clearly defined support zone. The upside is anchored by a real, dated catalyst that the market has only partly priced in. The base case is constructive but not heroic. The bull case requires the upgrade to ship and macro to cooperate.

    If you trade ETH, the framework right now is simple. Watch $2,420 to the upside. Watch $2,040 to the downside. Size positions around how much you trust the Glamsterdam timeline.

    You can track real-time ETH price action and market cap data at CoinGecko.

    Disclaimer: This article is for informational and educational purposes only and should not be construed as financial, investment, or trading advice. Cryptocurrency markets are highly volatile, and past performance does not guarantee future results. The price predictions and analyses presented here are based on AI models, technical indicators, and available data at the time of writing, they are not guarantees. Always conduct your own research (DYOR) and consult with a qualified financial advisor before making any investment decisions. Pump Parade and its authors do not assume liability for financial losses incurred based on information provided in this article.
    Dogecoin (DOGE) Price Prediction 2026: Supply Cut Ahead?

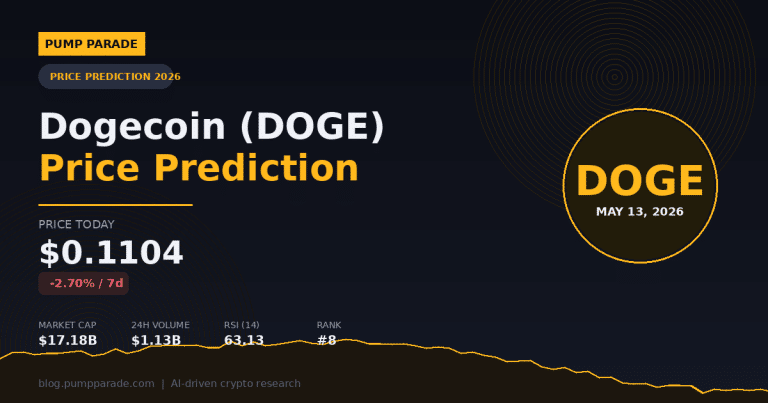
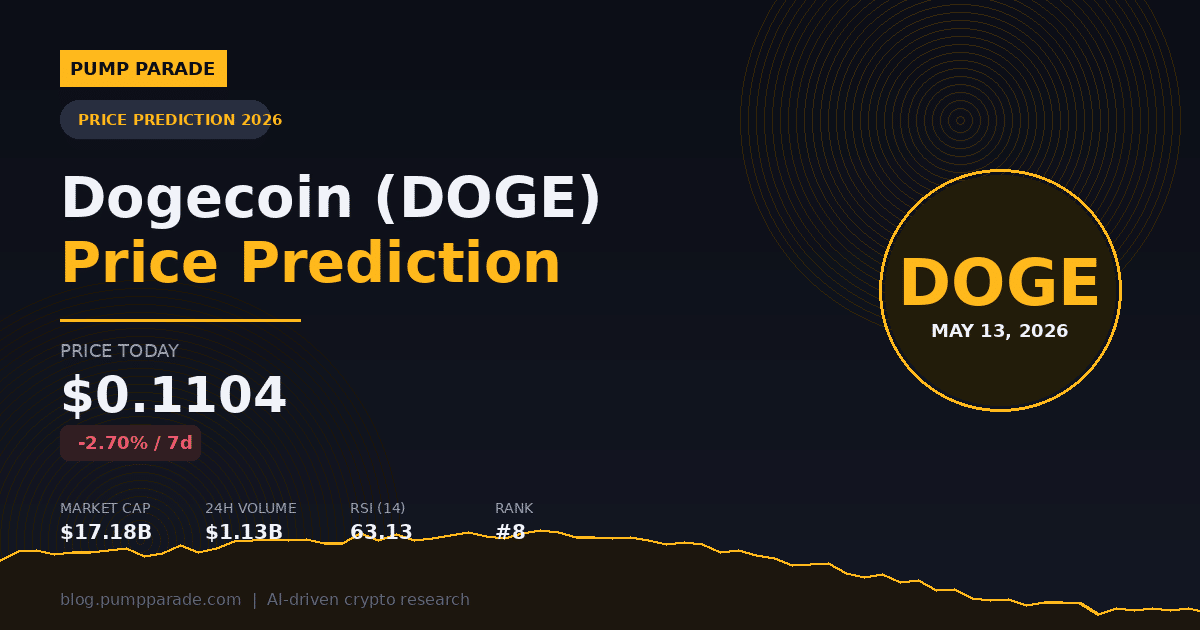
    Dogecoin is trading at $0.1104 as of May 13, 2026, with a market cap of $17.18 billion and 24-hour volume near $1.13 billion. DOGE is down 2.7% on the week, but that small dip hides a much bigger story.

    Behind the chart, three real catalysts are stacking up. A GitHub proposal wants to slash DOGE issuance by 90%. X Money is rolling out to 600 million users. And whale wallets just hit a record 108.52 billion DOGE. This article breaks down what the data says, the bull case, the bear case, and where our AI model lands on DOGE through 2028.

    Dogecoin DOGE price prediction 2026 with current price and market stats

    Where Dogecoin Stands Right Now

    Let’s start with the numbers. DOGE is the largest memecoin by market cap and one of the most liquid crypto assets in the world. Right now, the chart looks neutral.

    The RSI (Relative Strength Index, a momentum gauge that runs from 0 to 100) sits at 63.13. That is not overbought, but it is leaning bullish. The 50-day and 200-day moving averages are clustered around $0.1140, which means DOGE is trading just below its medium-term trend.

    Support levels worth watching:

    • $0.1090: the first line of defense, tested twice this week
    • $0.1068: the level bulls need to hold to keep the structure intact
    • $0.1051: the strongest support, where buyers stepped in hard during the April pullback

    Resistance to clear:

    • $0.1129: immediate ceiling
    • $0.1146: aligns with the moving averages
    • $0.1168: a breakout above here opens the door to $0.13+

    The 24-hour volume is down 32% from yesterday. Translation: traders are waiting. They want a catalyst before they commit. And there are real catalysts on the table.

    Catalyst #1: The 90% Supply Cut Proposal

    This is the one most retail traders are sleeping on. GitHub Issue #3776 in the official Dogecoin repository proposes cutting the block reward from 10,000 DOGE to 1,000 DOGE per block.

    In plain terms, annual DOGE issuance would drop from about 5 billion to roughly 500 million. That cuts the inflation rate from around 3.8% to under 0.4%. For context, Bitcoin’s inflation rate is currently about 0.84%. The proposal, if accepted, would make DOGE harder than BTC on the issuance front.

    Here’s the catch: it needs a hard fork and broad consensus to pass. The proposal is open, not merged. Dogecoin’s developer community moves slowly, and any change touching monetary policy will draw heated debate. But the discussion itself is significant. The Dogecoin Foundation is actively engaging with it, and developers are floating implementation paths.

    The bull case argument is simple. Less new supply hitting the market each year means less sell pressure from miners. If demand stays flat, price goes up. If demand grows, price goes up more. The bear case is just as simple: the proposal might fail, or it could take years to implement.

    Catalyst #2: X Money and the 600 Million User Pipe

    X Money entered closed beta in March 2026. The public rollout started in April. Elon Musk has not officially confirmed DOGE as a native payment option, but the connection is hard to ignore.

    Musk has championed DOGE for years. X’s payments infrastructure now serves a user base north of 600 million. If even 1% of those users hold a small DOGE balance for in-app tipping, payments, or creator support, that is roughly 6 million new holders.

    Why this matters: most of DOGE’s price action since 2021 has been narrative-driven. Real utility has been thin. An X integration would change that. It would give DOGE a payment use case at scale, something no other memecoin can claim. Even crypto traders skeptical of memecoins admit this would re-rate the token.

    The risk here is timing. Musk is unpredictable. The integration could come tomorrow, in Q3, or never. Position sizing matters.

    Catalyst #3: Whales Are Loading Up

    On-chain data tells a clearer story than price. Dogecoin whale wallets now hold a record 108.52 billion DOGE, worth about $11.6 billion at current prices. That is roughly 70% of the circulating supply concentrated in large addresses.

    This is a double-edged sword. Whale accumulation often precedes major moves, because large players have better information and longer time horizons. But it also means that if a few of those wallets decide to sell, the price impact is brutal.

    The pattern we are watching: net flow. If whale wallets keep adding even as retail sells, that is a setup that has historically preceded breakouts in DOGE. The opposite, whales distributing into rallies, would be a major red flag.

    Catalyst #4: DOGE-1 and the Moon Mission

    SpaceX’s DOGE-1 lunar mission, fully funded by Dogecoin payments back in 2021, is finally targeting a 2026 launch after multiple delays. It would be the first space mission funded entirely with cryptocurrency. The marketing value alone is real.

    This is the softest of the four catalysts. It will not move DOGE on fundamentals. But the meme-driven attention spike when the CubeSat actually launches could pull retail back into the trade. Memecoins live and die on attention.

    Dogecoin DOGE price prediction targets for short, mid, and long-term horizons

    Technical Outlook: What the Chart Wants

    The pattern on DOGE’s daily chart looks like a textbook coil. Lower highs since the late-2025 peak near $0.43, but higher lows since the February bottom around $0.085. That is a symmetrical triangle, and it usually resolves with a sharp move.

    The MACD (Moving Average Convergence Divergence, a trend indicator) is showing a slight bullish cross on the daily timeframe. Volume is contracting, which is normal inside a triangle. The breakout direction matters more than the move itself.

    A close above $0.1168 with rising volume would target $0.13 first, then $0.16. A breakdown below $0.1051 opens a path to $0.085, the February low. Until one of those levels gives way, the chart is in a wait-and-see mode.

    Price Predictions: Bear, Base, and Bull

    Our hybrid AI model, which weighs on-chain flows, technical setups, and sentiment data, generated the following ranges. These are scenarios, not promises.

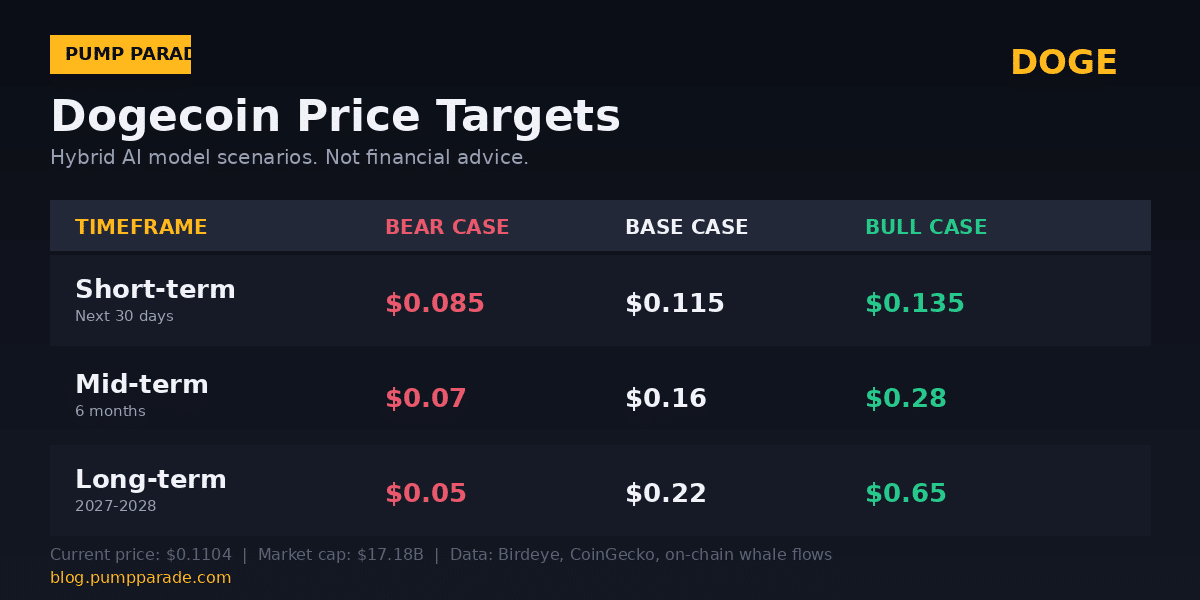
    Short-term (next 30 days)

    • Bear: $0.085 if support breaks and macro turns risk-off
    • Base: $0.115, sideways consolidation inside the triangle
    • Bull: $0.135 on a clean break above resistance with volume

    Mid-term (6 months)

    • Bear: $0.07 in a broader crypto correction
    • Base: $0.16, a recovery to the 2025 average price
    • Bull: $0.28 if the X integration drops or the supply proposal advances

    Long-term (2027-2028)

    • Bear: $0.05, the worst case if DOGE loses cultural relevance
    • Base: $0.22, steady growth in line with the broader crypto market
    • Bull: $0.65 if the supply cut passes AND X integration ships

    Note the asymmetry. The bull case requires multiple catalysts to land. The bear case only needs sentiment to roll over. That is the risk-reward profile of a large-cap memecoin in 2026.

    The Bear Case Worth Taking Seriously

    Most DOGE coverage glosses over the downside. We will not.

    The first risk is narrative fatigue. DOGE has been pumping on the X integration thesis for over a year. If it does not materialize in 2026, the market will reprice. Memecoins without fresh narratives bleed slowly, then suddenly.

    The second risk is rotation. Newer memecoins like BONK and others on Solana offer faster moves and better tokenomics. Capital chases what is working, and DOGE has been a relative underperformer in this cycle.

    The third risk is macro. DOGE has a beta to Bitcoin north of 1.5. If BTC drops 20%, DOGE typically drops 30 to 40%. Anyone holding DOGE is implicitly making a leveraged bet on the broader crypto market.

    What to Watch in the Next 30 Days

    Five things will tell you which scenario is playing out:

    • The $0.1168 resistance: a daily close above it, with volume, is the green light
    • GitHub Issue #3776 status: any movement toward a vote or implementation is a major bull signal
    • X Money announcements: watch for any mention of native crypto integration
    • Whale wallet flows: sites like Whale Alert or CoinGecko track this in near real-time
    • BTC behavior: if Bitcoin holds above $95K and pushes for new highs, DOGE typically follows with leverage

    The setup is binary. Either the catalysts land and DOGE squeezes higher, or they slip and the chart breaks down. Right now, the market is leaning slightly bullish but waiting for confirmation. That is a fine spot to watch, not a great spot to chase.

    Bottom Line

    DOGE in May 2026 is a coiled spring. The fundamentals are quietly improving, with a real supply cut on the table, real utility potentially coming via X, and on-chain accumulation that suggests sophisticated money is positioned for upside.

    But none of those catalysts are guaranteed. The technical picture is neutral, not bullish. And the broader memecoin sector has been losing share to newer narratives. The risk-reward favors patience over conviction here.

    Our base case for end of 2026 sits at $0.16. The bull case is $0.28. The bear case is $0.07. Position accordingly.

    Disclaimer: This article is for informational and educational purposes only and should not be construed as financial, investment, or trading advice. Cryptocurrency markets are highly volatile, and past performance does not guarantee future results. The price predictions and analyses presented here are based on AI models, technical indicators, and available data at the time of writing. They are not guarantees. Always conduct your own research (DYOR) and consult with a qualified financial advisor before making any investment decisions. Pump Parade and its authors do not assume liability for financial losses incurred based on information provided in this article.
    Ledger vs Trezor: Best Hardware Wallet 2026

    0

    If you hold any serious amount of crypto, the question is no longer should I use a hardware wallet, it is which one. And in 2026, that almost always means a choice between two names: Ledger and Trezor. Between them they cover the vast majority of cold-storage devices in circulation, and they have spent more than a decade trading punches over security, design, and supported coins.

    So which one should you actually buy this year? We took both ecosystems apart, compared the full current line-up, weighed the security trade-offs, and looked at how each one behaves day-to-day for typical Solana, EVM, and Bitcoin users. Here is the full breakdown.

    TL;DR: Quick Verdict

    Buy a Trezor Safe 5 ($169) if you value fully open-source hardware and software, want a modern color touchscreen, and your portfolio is mostly Bitcoin, Ethereum, major altcoins, and Solana. It is the sweet-spot device of 2026.

    Buy a Ledger (Nano X $149, Flex $249, or Stax $399) if you want the widest possible coin support (5,500+), the smoothest mobile experience over Bluetooth, deep DeFi and NFT integrations, and you are comfortable trusting a closed-source secure element.

    If you only need basic cold storage and price is the deciding factor, the Ledger Nano S Plus and the Trezor Safe 3 are tied at $79. The Trezor wins on open-source, Ledger wins on raw coin count and DeFi-app integration.

    Ledger vs Trezor: At a Glance

    Ledger vs Trezor 2026 hardware wallet comparison hero image

    Both brands have done genuine work since 2024. Ledger filled out the middle of its lineup with the Flex and refreshed its top end with the Stax. Trezor consolidated around the Safe 3 and Safe 5, retired the long-running Model One and Model T, and added a Certified EAL 6+ secure element to its full current range, addressing the loudest historical criticism of the brand. The result is two product families that are closer in raw security than at any point in the past, but still very different in philosophy.

    The 2026 Lineups

    Ledger

    Ledger hardware wallet family
    The Ledger 2026 lineup: Nano S Plus, Nano X, Nano Gen5, Flex, and Stax. Image: ledger.com.

    Ledger now sells five mainline devices: the entry-level Nano S Plus ($79), the Bluetooth-enabled Nano X ($149), the newer Nano Gen5 ($179), the mid-tier touchscreen Flex ($249), and the flagship Stax ($399). All of them use Ledger’s signature dual-chip architecture, with a STMicroelectronics ST33 series Certified EAL6+ secure element holding the keys and signing transactions, paired with a general-purpose MCU for the screen and connectivity. The Flex and Stax add a curved E Ink touchscreen that displays transaction details and addresses in a much larger format, which is a meaningful security feature, not just a cosmetic upgrade.

    On the software side, the Ledger Live app handles portfolio tracking, staking for assets like SOL and ETH, swaps via partners, and a growing NFT module. Ledger also leans hardest on third-party app support, with native integrations across MetaMask, Phantom, Rabby, Solflare, Uniswap, Aave, and most major DeFi front-ends.

    Trezor

    Trezor Safe 5 hardware wallet
    The Trezor product family in 2026: Safe 3 and Safe 5 with EAL 6+ secure elements. Image: trezor.io.

    Trezor’s current line is simpler: the Safe 3 ($79) and the Safe 5 ($169). The Model One and Model T are no longer in production. Both Safe devices ship with a CC EAL 6+ certified secure element, which is critical because earlier Trezor devices were famously secure-element-free and therefore vulnerable to certain physical attacks. The Safe 3 keeps the classic two-button design and a small monochrome OLED, while the Safe 5 introduces a 1.54-inch color touchscreen with haptic feedback and the same EAL 6+ chip.

    The companion app, Trezor Suite, handles send, receive, swaps, Tor routing for privacy, and coin control for Bitcoin. Suite is more focused than Ledger Live, but it is fully open-source, which matters to a meaningful slice of self-custody users.

    Security: Same Chip, Different Philosophy

    For years the easy answer was “Ledger has a secure element, Trezor does not”. That is no longer true. As of the Safe 3 and Safe 5, Trezor uses the same class of CC EAL6+ secure element that Ledger does. So both wallets now generate and store private keys inside a hardened chip designed to resist physical extraction.

    The interesting differences are in how each company uses that hardware.

    Ledger’s architecture keeps the secure element involved in almost every step, including screen rendering on the newer Flex and Stax. The trade-off is that the secure element firmware is closed-source, and the company controls the supply chain end to end. Ledger also offers an opt-in cloud recovery service, Ledger Recover, where shards of your seed phrase are split between custodians. It is genuinely optional, but the controversy around its launch in 2023 still colors community opinion.

    Trezor’s architecture uses the secure element for PIN and seed protection while keeping the general firmware and host code fully open-source. That means independent researchers can audit the entire stack, and a determined user can build firmware from source. Trezor also supports Shamir Backup on the Safe 5, splitting your seed into up to 16 shares with a configurable threshold. For users who want institutional-style key handling without buying institutional gear, Shamir is the single biggest security feature on either device.

    Neither device has been broken remotely in normal use. Both have had physical-attack research published against older models. If your threat model is “screen of my exchange got compromised and I want my coins offline”, both are more than enough. If your threat model is “evil maid with a $10,000 lab”, read each company’s research disclosures carefully before picking.

    Supported Coins and Networks

    This is where the numbers diverge, and the headline number is misleading.

    Ledger advertises 5,500+ supported coins and tokens. Trezor advertises 8,000+. Both numbers are real, but they count different things. Ledger’s number tends to include long-tail EVM tokens that work through the device’s signing layer plus a partner app. Trezor’s number includes most ERC-20s and SPL tokens routed through Trezor Suite or third-party wallets like MetaMask and Phantom. In practice:

    • Bitcoin, Ethereum, Solana, BNB Chain, Polygon, Arbitrum, Base, Optimism: Both fully support these networks.
    • Cosmos ecosystem (ATOM, OSMO, INJ, TIA), Cardano, Polkadot, Tron, Ripple: Ledger has broader native app coverage. Trezor supports most via Trezor Suite or third-party wallets, but the integration is less polished.
    • NFTs (Solana and EVM): Ledger has the smoother experience, especially via Ledger Live or Phantom and MetaMask integrations. Trezor users typically rely on third-party wallets.
    • DeFi (Aave, Uniswap, Jupiter, Drift, Kamino): Both work through MetaMask, Rabby, Phantom, or Solflare. Ledger has slightly tighter first-party UX on EVM DeFi.

    If you live mostly on Bitcoin, Ethereum, Solana, and major L2s, you will not feel the coin-count gap. If you are deep into Cosmos or have a long tail of obscure tokens, Ledger pulls ahead.

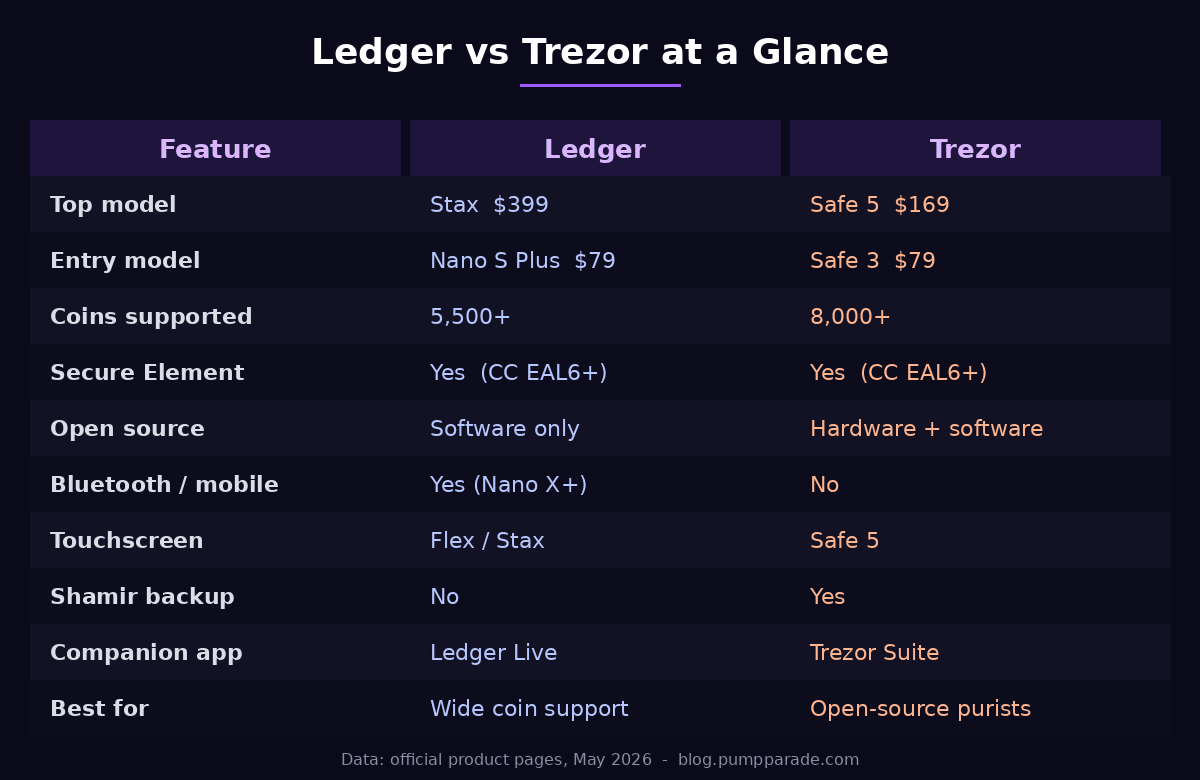
    Comparison Table

    Ledger vs Trezor 2026 comparison table: price, coins, security, open source

    User Experience

    Ledger Live and the mobile story

    Ledger has the better mobile experience, full stop. Bluetooth on the Nano X, Flex, and Stax lets you sign transactions from an iPhone or Android phone without a cable, which sounds like a small thing until you have done it for the third time on a Monday morning. Ledger Live on iOS is a first-class app, with full portfolio tracking, on-device staking for SOL and ETH, swaps, and NFT browsing. The newer Flex and Stax touchscreens make on-device address verification much easier than the older Nano S Plus.

    The downsides: Ledger Live’s swap and buy flows are powered by third-party partners with their own fees and KYC requirements, which can be jarring if you are used to direct DEX access. Some users also still avoid Ledger Recover entirely. It is fully opt-in and disabled by default, but the brand has not entirely recovered the trust it spent in the original launch.

    Trezor Suite and the desktop story

    Trezor Suite is more focused, less flashy, and arguably more pleasant to use day-to-day for the technical user who wants to know exactly what their wallet is doing. Coin control, replace-by-fee, Tor routing, and CoinJoin support for Bitcoin are first-party features. On the Safe 5, on-device confirmations on the color touchscreen are excellent, easily as readable as the Ledger Flex.

    The big trade-off is mobile. Trezor Suite Lite for Android is a watch-only companion app, not a full signing app. For iOS, there is no first-party signing experience at all, which is a real limitation if you want to sign DeFi transactions from your phone. If you live on the desktop, this is irrelevant. If you live on mobile, it matters.

    Pros and Cons

    Ledger

    Pros

    • 5,500+ supported coins, including the broadest native app library on the market
    • Bluetooth and a real mobile experience on iOS and Android
    • E Ink touchscreens on Flex and Stax that materially improve transaction verification
    • Deep integrations with MetaMask, Phantom, Rabby, Solflare, and most DeFi front-ends
    • Dual-chip architecture with a secure element involved in signing and display

    Cons

    • Secure element firmware is closed-source
    • Ledger Recover still divides the self-custody community, even as an opt-in
    • No Shamir Backup option
    • Top model (Stax) is expensive at $399

    Trezor

    Pros

    • Fully open-source hardware and software across the current line
    • CC EAL 6+ secure element on both Safe 3 and Safe 5
    • Shamir Backup on Safe 5 for institutional-style key splitting
    • Tor, coin control, CoinJoin, and replace-by-fee built into Trezor Suite
    • Safe 5 color touchscreen and haptics are excellent for the $169 price

    Cons

    • No Bluetooth and no full iOS signing app
    • Fewer first-party coin integrations beyond the major networks
    • NFT and DeFi UX usually goes through a third-party wallet
    • Suite is desktop-first, which is a real limitation in 2026

    Which One Should You Buy?

    For most Solana and EVM users who care about open source: Trezor Safe 5. The Safe 5 lands the modern features that used to live only on the Ledger flagship, at less than half the price of a Stax, with a full open-source stack and Shamir Backup. If your phone is not your main wallet client, it is the easiest recommendation in the category.

    For mobile-first users and heavy DeFi traders: Ledger Flex. At $249, the Flex gives you the larger touchscreen and the full Bluetooth and iOS experience without paying Stax money. Pair it with Phantom for Solana and MetaMask or Rabby for EVM and you have a setup that covers basically every chain that matters in 2026.

    For maximalist DeFi and NFT users with a five-figure portfolio: Ledger Stax. The 3.7-inch E Ink screen genuinely changes how you verify transactions, and Ledger Live plus the third-party app ecosystem is the broadest available. If your portfolio justifies $399 of cold storage, the Stax is the most polished device on the market.

    For first-time hardware wallet buyers: Trezor Safe 3 or Ledger Nano S Plus. Both are $79. Pick the Safe 3 if you want open-source and Bitcoin-heavy use. Pick the Nano S Plus if you want broader DeFi compatibility out of the box.

    Where This Fits in Your Stack

    A hardware wallet is one piece of a wider self-custody setup. If you are still relying on a centralized exchange for the bulk of your holdings, we ran a detailed look at the trade-offs in Bybit vs OKX: Best Crypto Exchange 2026. For software wallets on Solana that pair cleanly with either Ledger or Trezor, see our Phantom vs Backpack comparison. And if you want to put your cold-stored SOL to work via liquid staking, the breakdown in Marinade vs Jito is the easiest place to start.

    FAQ

    Are Ledger and Trezor still safe in 2026?

    Yes. Both ship CC EAL 6+ secure elements, both have public bug bounty programs, and neither has been remotely compromised in normal use. The main risk for both is user error: phishing, signing blind transactions, and writing your seed phrase down in unsafe places. The device is only as good as the operational security around it.

    Can I use Ledger or Trezor with Phantom or MetaMask?

    Yes for both. Phantom supports Ledger natively for Solana and EVM, and supports Trezor for EVM. MetaMask supports both Ledger and Trezor directly. Rabby and Solflare also support both. You sign on the device and broadcast through the software wallet.

    What happens if my Ledger or Trezor breaks or gets lost?

    You restore from your seed phrase on a new device, either a new Ledger, a new Trezor, or any other BIP39-compatible wallet. The device is just an interface to keys derived from the seed. Trezor users on Safe 5 with Shamir Backup restore from their share threshold. Ledger users without Recover restore from their 24-word seed.

    Do I need to verify the device when it arrives?

    Always. Buy directly from shop.ledger.com or trezor.io, never from a marketplace reseller. Both companies have published genuineness checks that run on first connect. Run them.

    Is the Ledger Stax worth $399?

    It is the best hardware wallet experience money can currently buy, and the large E Ink screen genuinely improves transaction verification. But the Trezor Safe 5 gets you a color touchscreen, open-source firmware, and Shamir Backup for $169. For most users, the Stax is a luxury upgrade, not a security upgrade.

    Verdict (May 2026): Trezor Safe 5 is the best all-round hardware wallet for self-custody-minded users this year. Ledger Flex is the best pick for mobile-heavy DeFi users. Ledger Stax remains the most polished device if you want the flagship experience and price is not the deciding factor.

    Sources: Ledger Academy, Coin Bureau, CoinLedger, BitDegree, official Ledger and Trezor product pages.

    Avalanche (AVAX) Price Prediction 2026: CME Catalyst

    Avalanche (AVAX) is trading at $10.05 at time of writing, a quiet number hiding a loud setup. AVAX has held the $9.50 to $10.50 range for most of May, even as the rest of the alt-L1 market has chopped. Volume is light at around $224M over the past 24 hours, and price is down just 0.33% on the day.

    Boring? On the surface, yes. But under the surface, three institutional catalysts are stacking up at once. CME Group switched on regulated AVAX futures earlier this month. Starting May 29, those futures move to 24/7 trading. And Japan’s Progmat, which controls more than half of the country’s tokenized securities market, is finishing a $2B+ migration of real-world assets onto a dedicated Avalanche Layer 1.

    Here is what our AI model sees, what the chart is telling us, and what could send AVAX out of its sleepy range, in either direction.

    Avalanche AVAX price prediction 2026 hero image with current price chart

    Avalanche at a Glance: The Numbers You Need

    Before we get to predictions, let’s anchor on the data. These are the figures driving the conversation right now.

    • Price: $10.05
    • 24h change: down 0.33%
    • Market cap: $4.34B (rank #24)
    • 24h volume: $223.7M
    • Circulating supply: 431.8M AVAX
    • Max supply: 720M AVAX
    • RSI (14-day): 63.88 (neutral, leaning bullish)

    For context on the broader market, you can cross-check live AVAX data on CoinGecko. The token sits inside a narrow $8.50 to $10.50 band that has defined the chart since late April.

    Why Avalanche Is in the Conversation Right Now

    Plenty of Layer 1s claim to be the “institutional chain.” Avalanche just got three receipts in the same month.

    1. CME Avalanche Futures Are Live

    On May 4, CME Group launched standard AVAX futures (5,000 AVAX per contract) and Micro AVAX futures (500 AVAX). The first trades cleared as blocks between FalconX and G-20 Group. In plain terms: large allocators now have a regulated, CFTC-compliant venue to gain exposure or hedge AVAX positions. Until this month, that venue did not exist.

    This matters because large funds and corporate treasuries often cannot touch a token without onshore derivatives. CME futures unlock a buyer base that was structurally locked out.

    2. 24/7 Trading Starts May 29

    Starting May 29, all CME Group crypto futures and options move to round-the-clock trading. That removes the weekend gap that has plagued institutional hedgers since CME launched Bitcoin futures in 2017. For AVAX, the timing is precise. The contract launches just before the format upgrade, which means liquidity should ramp into a 24/7 product from day one. Watch the open interest tape after May 29 closely.

    3. Progmat’s $2B Migration

    Japan’s Progmat is the dominant tokenized securities platform in the country, holding roughly 63% of cumulative issuance volume in Japan’s security token market. It is backed by SBI Group and Japan Exchange Group. Progmat is moving more than $2B in tokenized real estate and corporate bonds to a custom Avalanche L1, with completion targeted for June 2026. Japan’s digital securities sector is expected to exceed $7B by year-end, meaning the chain hosting these assets has a direct claim on real-world asset flow.

    Translation: Avalanche just became the settlement layer for one of the most regulated tokenization markets on earth.

    Technical Analysis: AVAX Is Coiling

    The chart is telling us “decision time.” Here is what the indicators show:

    Support and Resistance

    Near-term levels sit close together. Support: $9.80, then $9.66, then a stronger floor at $9.51. Resistance: $10.10 (just overhead), $10.25, and $10.40. The wider range that defines the broader structure is $8.50 to $10.50. A daily close above $10.50 on rising volume would be the cleanest breakout trigger we have had since March.

    Momentum and Trend

    The 14-day RSI (Relative Strength Index, a momentum gauge that runs from 0 to 100) prints at 63.88. That is firmly neutral and slightly bullish, not overbought. AVAX has room to push higher without hitting an immediate technical ceiling. The 50-day moving average is tracking near $9.90, and the 200-day moving average sits around $10.80. Price is sandwiched between them, which is classic pre-breakout posture.

    Pattern Read

    What we are watching is a textbook ascending consolidation: higher lows since the April $8.50 retest, capped by horizontal resistance at $10.50. In similar setups, the resolution direction tends to follow the underlying trend. With CME futures live and RWA flow incoming, the underlying news flow is constructive.

    The Bull Case for AVAX

    Here is what has to be true for AVAX to break out of its range:

    Catalyst stack converts to flow. CME futures need to attract real open interest in the first 30 days. A successful launch combined with the 24/7 trading switch on May 29 would mark Avalanche’s clearest institutional on-ramp to date. Compare it to the Bitcoin ETF flows of 2024: not every catalyst pumps the spot price immediately, but persistent inflows reshape the long-term floor.

    RWA narrative dominates summer. Tokenized real-world assets are the most defensible non-Bitcoin narrative this cycle. If Progmat completes the migration on schedule in June, every L1 covering RWAs will be benchmarked against Avalanche. That is a positioning win that compounds.

    Subnet activity broadens. Avalanche’s subnet model lets enterprises spin up custom L1s with their own validator sets. Progmat is the marquee example, but a handful of other regulated finance projects are reportedly evaluating the same architecture. More subnets, more AVAX burn (subnet creation requires AVAX), and a tighter supply story.

    If this thesis plays out, our hybrid AI model assigns roughly a 58% probability of AVAX reclaiming the $15 to $18 zone by Q3 2026, with a stretch target of $25 by year-end if RWA inflows surprise to the upside. Historically, every meaningful AVAX rally has needed a clean break above the prior cycle’s mid-range resistance. $10.50 is that line in 2026.

    The Bear Case for AVAX

    Now the other side. This is not a “guaranteed pump” setup, and the risks are real.

    Catalyst fatigue. Markets often price in the headline before the impact lands. CME futures launching is news, but if open interest stays thin in the first weeks, the move could fade. We saw this with ETH futures and Solana futures launches at points where the spot price actually drifted lower for weeks after.

    Supply pressure from unlocks. AVAX still has 288M tokens to unlock against a 431.8M circulating supply. That is 40% of the supply still ahead. Any acceleration in scheduled unlocks (team, foundation, or strategic allocations) acts as a constant headwind, especially if buy-side demand from institutions ramps slowly.

    RWA execution risk. The Progmat migration is happening. But “tokenized securities migrate to Avalanche” does not automatically mean “AVAX price goes up.” The economic value of that activity flowing back to AVAX holders depends on subnet design, gas usage, and ongoing fee capture. If activity is heavy but fee capture is low, the narrative outruns the fundamentals.

    Macro and L1 rotation. Capital in alt-L1s is finite. If Solana or Ethereum catches a stronger bid, AVAX can underperform even with good news. The broader risk is a return to the $8.50 floor, and a break below that opens the door to $6.80, which was the major support from late 2025.

    Under the bear scenario, our model sees a 38% probability of AVAX retesting $8.00 or lower over the next 90 days, with $6.80 as the cycle-floor risk if Bitcoin rolls over and pulls alts with it. For more on how L1 rotation typically plays out, our Polkadot price prediction covers a similar setup in a different L1.

    AVAX price prediction summary table for 2026 to 2028

    AVAX Price Predictions: AI Model Output

    Putting the data together, here is what our hybrid model returns across three timeframes. These are probability-weighted ranges, not guarantees. Treat them as scenarios, not certainties.

    Short-Term (Next 30 Days)

    The 30-day window is dominated by the CME 24/7 switch on May 29 and the final stretch of the Progmat migration.

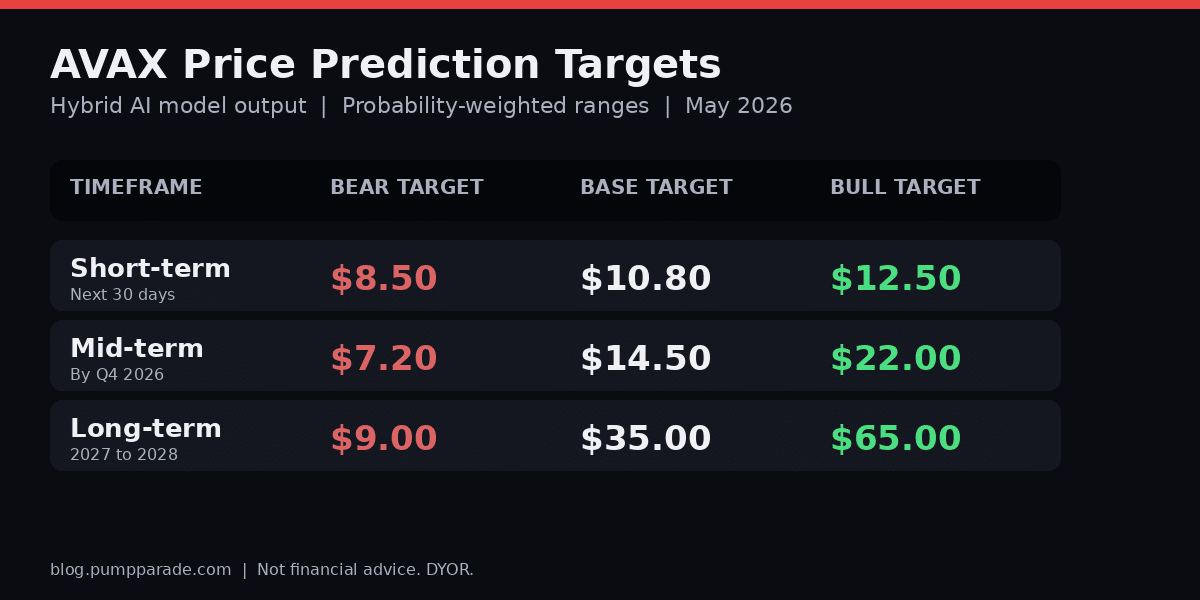
    • Bear target: $8.50
    • Base target: $10.80
    • Bull target: $12.50

    Trigger to watch: a clean daily close above $10.50 with volume more than 1.5x the 30-day average.

    Mid-Term (6 Months)

    By Q4 2026, both the CME futures market and the Progmat L1 should have visible operating data. That is when the institutional thesis gets tested with real numbers.

    • Bear target: $7.20
    • Base target: $14.50
    • Bull target: $22.00

    The base case assumes steady RWA growth, moderate CME open interest, and Bitcoin holding above $80K.

    Long-Term (2027 to 2028)

    The long-term picture leans on Avalanche’s positioning as a tokenization-first L1. If Japan’s RWA market hits projections and other regions follow, Avalanche could capture meaningful share of a multi-hundred-billion-dollar tokenized assets pie.

    • Bear target: $9.00
    • Base target: $35.00
    • Bull target: $65.00

    The bull case here assumes Avalanche becomes the default settlement layer for at least two more major regional tokenization platforms beyond Japan.

    What to Watch in the Next 30 Days

    If you are tracking AVAX, here are the four data points worth your attention.

    1. CME open interest growth. After May 29, watch how quickly notional OI scales. A jump past $300M in the first month would be a strong signal.
    2. Progmat migration completion. Expect a formal completion announcement in June. The press release itself is a catalyst.
    3. Subnet (L1) creation rate. More subnets means more AVAX burned and more demand. Track new L1 deployments through the official Avalanche dashboard.
    4. $10.50 resistance. A weekly close above this level resolves the consolidation. A weekly close below $9.50 puts the bear case in play.

    The Bottom Line

    AVAX is not a “buy now” trade. It is a setup worth monitoring. The catalysts are real, the institutional pipes are being built, and the chart is coiling toward a resolution. The risk is that catalysts get priced before they convert, and the broader alt-L1 rotation pulls capital elsewhere.

    The most useful frame: AVAX is currently a binary bet on institutional adoption. If CME flow shows up and Progmat lights up a working L1 with real fee revenue, the bull case unlocks. If neither converts within six months, the range continues and the token underperforms.

    For a deeper dive on how infrastructure-focused tokens have priced similar catalysts in past cycles, see our Chainlink price prediction. The patterns rhyme more than you might expect.

    Disclaimer: This article is for informational and educational purposes only and should not be construed as financial, investment, or trading advice. Cryptocurrency markets are highly volatile, and past performance does not guarantee future results. The price predictions and analyses presented here are based on AI models, technical indicators, and available data at the time of writing, they are not guarantees. Always conduct your own research (DYOR) and consult with a qualified financial advisor before making any investment decisions. Pump Parade and its authors do not assume liability for financial losses incurred based on information provided in this article.
    Sui (SUI) Price Prediction 2026: Can SUI Hit $5?

    0

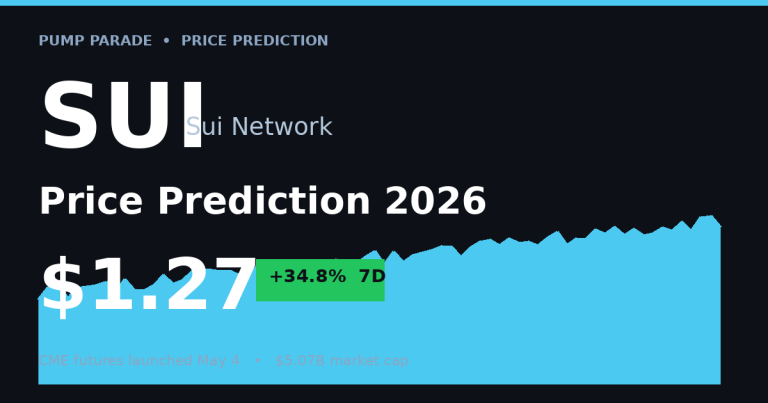
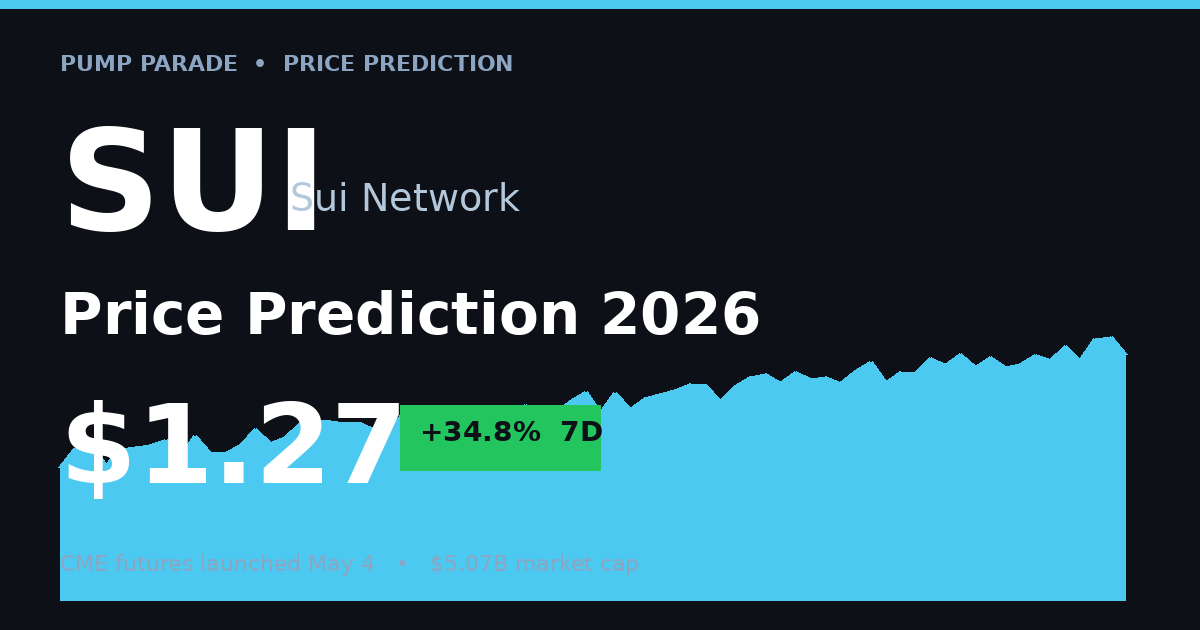
    Sui (SUI) is trading at $1.27 right now. The token is up 12.9% in the last 24 hours and 34.8% over the past week. That kind of move usually signals a catalyst. SUI has a big one.

    On May 4, CME Group listed regulated SUI futures. That move opened the door for hedge funds, RIAs, and institutional desks to short or hedge the token through a regulated venue. Combined with three spot SUI ETFs already trading on US exchanges, the institutional rails around SUI now look more like Bitcoin’s stack than a mid-cap altcoin’s.

    Sui (SUI) price prediction 2026 hero image showing current price $1.27 and 7-day gain of 34.8 percent

    This article breaks down where SUI’s price could go from here. We cover the current setup, the bull and bear cases, and what our hybrid AI model says about the next 30 days, 6 months, and 2027 to 2028.

    SUI Price Today: The Numbers

    • Current price: $1.27
    • 24h range: $1.12 to $1.41
    • 24h volume: $2.86 billion
    • Market cap: $5.07 billion
    • Circulating supply: 4.005 billion SUI (40% of the 10B max)
    • All-time high: $5.35 (January 2025)
    • 7-day change: +34.8%
    • 30-day change: +35.3%

    SUI is still 76% below its January 2025 peak. But $2.86 billion in 24-hour volume tells you the recent move is not a thin pump. Real capital is moving.

    The CME Futures Catalyst

    CME Group listed two SUI futures products on May 4. The standard contract is sized at 50,000 SUI. The Micro contract is sized at 5,000 SUI. The launch came alongside Avalanche (AVAX) futures and follows recent listings for Cardano, Chainlink, and Stellar.

    Why does this matter? Three reasons.

    1. Institutional hedging unlocks. Funds that wanted SUI exposure but could not short the token now have a regulated venue. That widens the buyer pool. Buyers who stayed sidelined for risk-management reasons can now build real positions.

    2. Price discovery deepens. CME volumes feed into options pricing, structured products, and lending markets. More liquidity layers usually mean tighter spreads and less violent gaps.

    3. The narrative compounds. SUI now sits in the same regulated futures bucket as BTC, ETH, SOL, ADA, LINK, and XLM. That is a short list. Inclusion alone changes how the asset is perceived by traditional desks.

    Add three spot SUI ETFs already trading (21Shares TSUI on Nasdaq, Canary’s staking SUI ETF, and Grayscale’s SUI staking fund) and the institutional stack looks remarkably complete for a token outside the top 15 by market cap. According to the CME announcement, all CME crypto futures and options will move to 24/7 trading on May 29. That removes weekend gap risk for institutional holders, another bullish structural shift.

    What Sui Actually Does

    Sui is a Layer 1 blockchain built by former Meta engineers. It uses the Move programming language and a parallel execution model. In plain terms, transactions that do not touch the same data can run at the same time, instead of waiting in a single line.

    The network’s consensus protocol is called Mysticeti. It finalizes shared-object transactions in roughly 390 milliseconds. For comparison, Solana finality runs near 800 milliseconds. Ethereum slot time is about 12 seconds. Speed alone does not win a market. But it gives Sui a real story for high-frequency apps, on-chain games, and consumer payments.

    On the application side, Sui’s DeFi total value locked sits near $561 million as of February. That is well below the 2024 peak but still meaningful on-chain activity. A recent partnership with Nigerian fintech Paga, which processed $11 billion in 2025, targets stablecoin payments, tokenized bonds, and dollar accounts on Sui. If that pipeline activates, SUI’s story shifts from “fast L1” to “real payments rail.”

    Sui vs Solana: The Layer 1 Question

    Most investors looking at SUI weigh it against Solana. Solana’s Alpenglow upgrade is its own catalyst story, but Sui plays a different angle. Lower fees per transaction. Faster finality. A leaner ecosystem still in early-cycle growth. Solana’s market cap is roughly 10 times Sui’s. If SUI captures even a fraction of any L1 rotation, the math compounds.

    Technical Setup

    The chart is in a confirmed short-term uptrend. SUI broke above the $1.15 resistance zone this week and is now testing $1.30. The 50-day moving average sits below price and is turning up. RSI is near 48, neutral but rising, which leaves room before the token gets overheated.

    Key levels to watch:

    • Support: $1.15 (former resistance, now flipped) and $1.00 psychological floor
    • Resistance: $1.50 (next major level), then $1.85 and $2.40
    • Invalidation: A close below $0.95 would break the structure

    The pattern looks like a multi-month base. Bases that break with this volume often produce 50% to 100% follow-through if the catalyst is real. The CME listing qualifies as a real catalyst.

    The Bull Case

    The bull case rests on three pillars.

    Institutional flows. CME futures plus three spot ETFs equals a complete TradFi stack. Even modest allocations rotating from BTC and ETH into the next institutional-grade L1 could push SUI higher fast.

    Technology shipping. Mysticeti finality, parallel execution, and the Move language give Sui a real performance edge. If a major consumer app launches on Sui and scales, the narrative flywheel spins.

    Cycle setup. Bitcoin dominance sits near 60% and the altseason index is at 39. When rotation begins, mid-cap L1s with institutional infrastructure tend to lead. SUI fits the profile.

    In the bull case, SUI revisits the $3.50 to $5.00 range over the next 12 to 18 months. A retest of the $5.35 all-time high is plausible if institutional flows accelerate and the ecosystem ships a hit app.

    The Bear Case

    The risks are real. Ignoring them would be lazy.

    Supply unlocks. Only 40% of SUI’s max supply is circulating. Future unlocks add structural sell pressure. Track the unlock schedule before sizing any position.

    Competition. Solana, Aptos, Sei, and Monad all want the same “next-gen L1” narrative. Sui needs to win developers and users, not just benchmarks.

    Macro risk. If global liquidity tightens or Bitcoin breaks below $68K support, high-beta alts like SUI typically fall 30% to 50% from local highs.

    TVL gap. Sui’s $561M TVL is well below network potential. If on-chain activity stalls, the bullish narrative weakens fast.

    In the bear case, SUI revisits the $0.85 to $0.95 zone. That is a 25% to 33% drawdown from current price. A break below $0.95 opens the door to $0.70.

    AI Price Prediction Summary

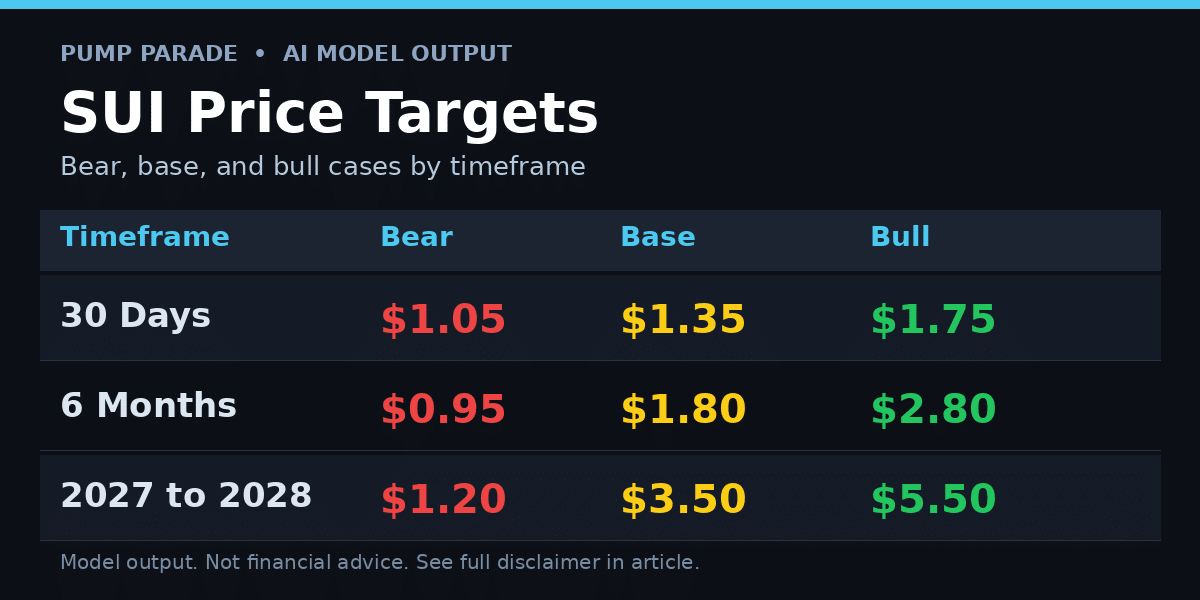
    Our hybrid model combines technicals, on-chain data, and macro signals. The output below shows bear, base, and bull targets by timeframe.

    Sui (SUI) price prediction targets table showing bear, base, and bull case scenarios for 30 days, 6 months, and 2027 to 2028

    Short-term (30 days): Bear $1.05, Base $1.35, Bull $1.75. The model assigns a 58% probability that price holds above $1.15 over the next month, supported by the CME futures launch and improving momentum.

    Medium-term (6 months): Bear $0.95, Base $1.80, Bull $2.80. The 6-month window captures the full impact of 24/7 CME trading and likely ETF inflows. Base case assumes Bitcoin holds the $70K range.

    Long-term (2027 to 2028): Bear $1.20, Base $3.50, Bull $5.50. The bull target retests the prior all-time high and requires sustained ecosystem growth plus continued institutional adoption.

    Short-term model confidence is moderate, near 62%. Long-term confidence drops sharply because cycle dynamics, regulation, and competition all carry wide error bars. Treat the long-term range as a scenario map, not a forecast.

    What to Watch Next

    Three concrete signals will tell you if the bull thesis is playing out.

    1. CME open interest. If SUI futures open interest crosses $200M within 60 days of launch, institutional demand is real.
    2. SUI ETF flows. Weekly net inflows above $20M would signal sticky capital, not rotation.
    3. Daily active addresses. A move above 1M daily active addresses sustained over 30 days would validate the consumer-app thesis.

    If two of the three hit, the path to $2.50 looks clean. If none hit by July, the rally is more likely a futures-launch pop than a sustained breakout.

    Bottom Line

    SUI is the most interesting institutional-grade L1 outside Bitcoin, Ethereum, and Solana right now. The CME futures listing is a real catalyst. The ETF rails are in place. The technology has shipped. None of that guarantees a move higher. But the setup is one of the cleanest in the current market.

    The base case sees SUI in the $1.80 to $2.50 range by year-end if catalysts compound. The bear case sends it back toward $0.95 if macro turns or supply unlocks accelerate. Risk-reward favors the long side at current prices, but position sizing should respect the volatility.

    Worth watching. Worth researching. Not worth betting the farm.

    Disclaimer

    This article is for informational and educational purposes only and should not be construed as financial, investment, or trading advice. Cryptocurrency markets are highly volatile, and past performance does not guarantee future results. The price predictions and analyses presented here are based on AI models, technical indicators, and available data at the time of writing. They are not guarantees. Always conduct your own research (DYOR) and consult with a qualified financial advisor before making any investment decisions. Pump Parade and its authors do not assume liability for financial losses incurred based on information provided in this article.
    Jupiter (JUP) Price Prediction 2026

    0
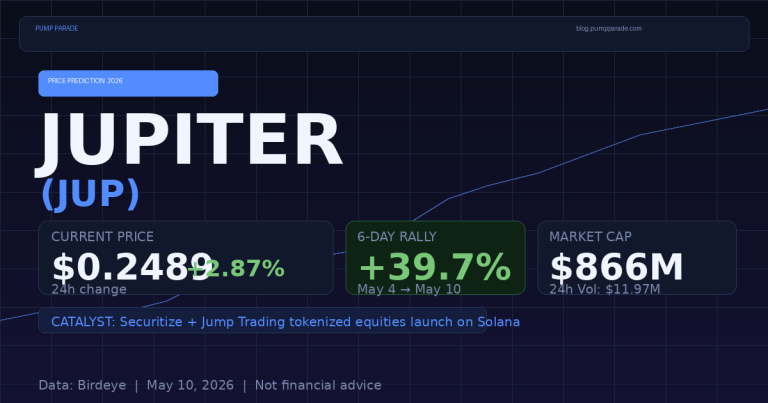
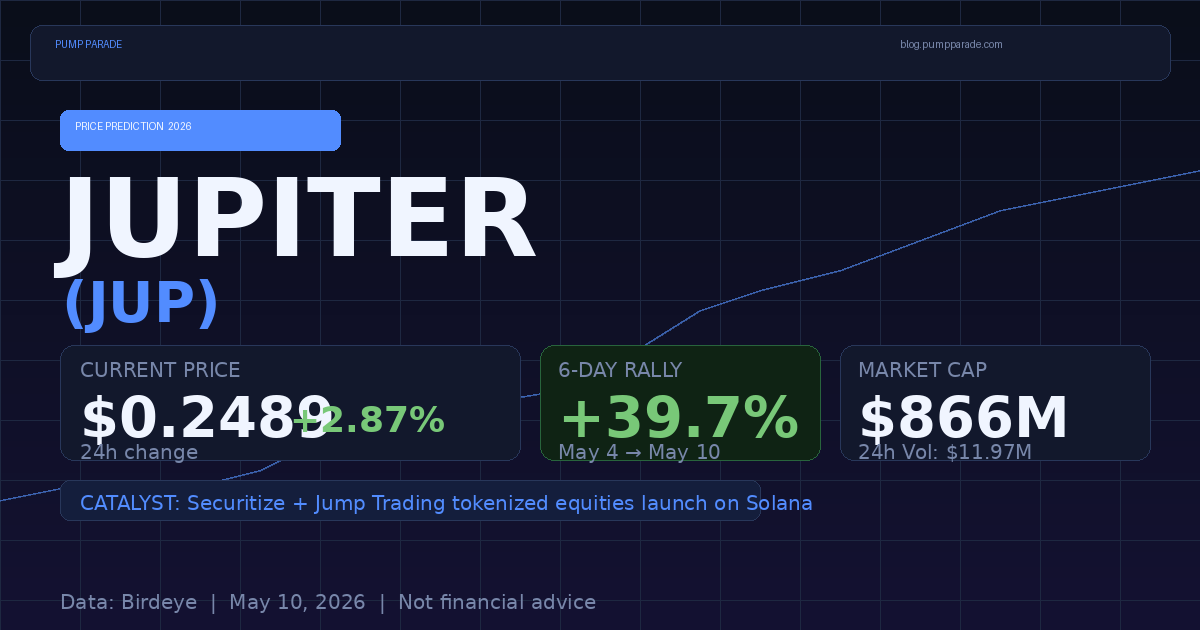
    Jupiter JUP price prediction 2026 hero image showing current price $0.2489 and 39.7% six-day rally

    Jupiter (JUP) is up nearly 40% in six days. As of May 10, 2026, JUP is trading at $0.2489, a level it hasn’t seen since early March. The catalyst is real: on May 5, Securitize, Jump Trading, and Jupiter jointly launched fully onchain, regulated trading of tokenized equities on Solana. Real stocks. On a DEX. Regulated. This is not a rumor or a roadmap item. It is live.

    The question now is simple. Can JUP hold its gains and push higher? Or is this a sell-the-news moment in disguise? Let’s look at the data.

    What Is Jupiter?

    Jupiter is Solana’s dominant DEX aggregator. It routes trades across more than 20 liquidity sources to give traders the best available price. Think of it as the Google Flights of Solana swaps: you search once and it finds the cheapest route.

    Beyond aggregation, Jupiter has expanded into perpetuals trading, limit orders, and dollar-cost averaging tools. It processes billions of dollars in monthly volume and sits at the center of Solana’s DeFi infrastructure. If you’ve traded on Solana in the past two years, you’ve almost certainly used Jupiter.

    Key metrics at time of writing:

    • Price: $0.2489
    • Market cap: $866 million
    • Fully diluted valuation (FDV): $1.71 billion
    • Circulating supply: 3.48 billion JUP (out of 6.86 billion total)
    • 24-hour trading volume: $11.97 million
    • Active holders: 833,186 wallets

    The Securitize Catalyst: What Actually Happened

    On May 5, 2026, Securitize, Jump Trading, and Jupiter announced a major partnership. The three firms built a complete market structure for tokenized equities on Solana. Here is how the stack works:

    • Securitize provides the regulated broker-dealer infrastructure, KYC-gated wallets, and transfer agent services.
    • Jump Trading deploys its PropAMM on Solana to provide liquidity and tight spreads.
    • Jupiter serves as the user-facing interface. Traders access and swap tokenized equities through Jupiter’s familiar DeFi frontend.

    This is significant for two reasons. First, it validates Jupiter as institutional-grade infrastructure. Second, it positions JUP at the center of a multi-trillion-dollar tokenization narrative. Real-world asset (RWA) tokenization is one of the strongest macro themes in crypto right now. Jupiter just landed a starring role in it.

    The market reacted. JUP went from $0.1782 on May 4 to a high of $0.2627 on May 9. That is a 47% move in five days. It has since pulled back slightly to $0.2489 as traders take some profit.

    Technical Analysis

    The chart tells a clear story. JUP spent most of Q1 2026 trapped below the $0.20 resistance level. It tested that ceiling multiple times in February and March and failed each time. The Securitize announcement finally broke through it.

    Here is what the chart is telling us right now:

    • Immediate support: $0.24 to $0.2419 (today’s intraday low). This level needs to hold.
    • Secondary support: $0.20. This was resistance for months. If JUP retests it and holds, that would be a bullish sign.
    • Key resistance: $0.2627 (May 9 high). A clean break above this level opens the path to $0.30+.
    • ATH reference: JUP’s all-time high was $1.85 in April 2024. Current price is 87% below that level, which gives bulls room to dream about a recovery.

    Volume is healthy. The 8-hour volume is up 21% versus the prior period, and the buy/sell ratio is roughly balanced. There is no obvious distribution pattern yet. That said, sell-side volume in the 2-hour window has picked up. Worth watching.

    JUP is not the only Solana DEX token worth tracking right now. If you want broader context on the Solana DEX landscape, our Raydium vs Orca DEX comparison for 2026 breaks down how the major players stack up.

    The Bull Case

    The bull case for JUP rests on three pillars.

    First, the RWA narrative is real and growing. Tokenized equities are a massive opportunity. If the Securitize partnership gains traction, Jupiter becomes the default interface for a new category of onchain finance. That kind of utility typically gets priced in over months, not days.

    Second, Solana’s broader ecosystem is strengthening. Institutional flows are increasing. The upcoming Alpenglow upgrade is expected to reduce latency further. Jupiter benefits directly from rising Solana network activity.

    Third, JUP is still trading at a fraction of its all-time high. At $0.25, the market cap is $866 million. The FDV is $1.71 billion. If JUP returns to even half of its 2024 peak, that would put the price near $0.90. Bulls see a straightforward path to $0.50 by year-end if current momentum holds.

    The Bear Case

    The bear case is just as important to understand.

    First, sell-the-news risk is real. The Securitize partnership is now priced in at some level. If it fails to generate meaningful volume or adoption, JUP could give back a significant portion of the rally.

    Second, JUP’s tokenomics create overhead. Only 3.48 billion of 6.86 billion tokens are circulating. The remaining supply represents potential future selling pressure as vesting schedules unlock.

    Third, macro risk is not gone. If Bitcoin pulls back sharply, altcoins including JUP will feel it. JUP has shown a strong correlation to broader market risk appetite.

    Finally, competition is real. Other DEX aggregators are building on alternative Layer 1s and Layer 2s. Jupiter’s dominance on Solana is not guaranteed long-term.

    Jupiter (JUP) Price Predictions 2026

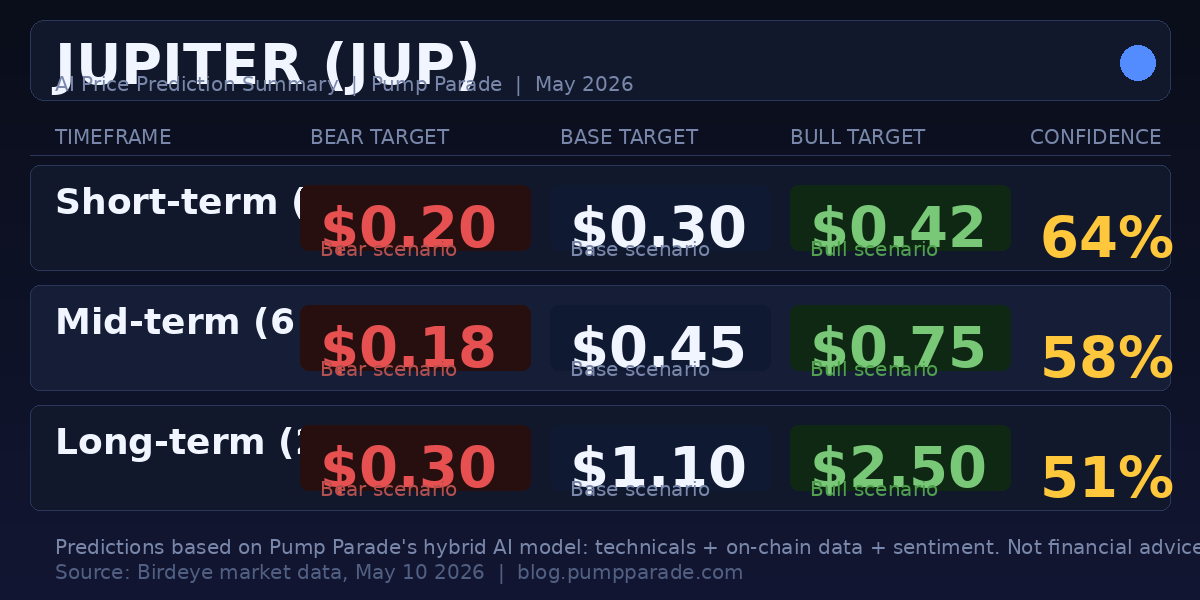
    Our hybrid AI model analyzes technical indicators, on-chain data, volume trends, and market sentiment to generate probability-weighted scenarios. Here are the targets:

    Jupiter JUP price prediction table for 2026 showing bear, base, and bull targets across three timeframes

    Short-term (30 days): The base case is a consolidation in the $0.26 to $0.30 range as the market digests the Securitize news. A healthy pullback to $0.20 is the bear scenario. A clean break above $0.27 with volume could push JUP to $0.42 in the bull case. Confidence: 64%.

    Mid-term (6 months): If the RWA narrative keeps building and Solana continues attracting institutional capital, JUP could reach $0.45 to $0.75 by late 2026. The bear case assumes macro deterioration and sell pressure from token unlocks, with JUP sliding back toward $0.18. Confidence: 58%.

    Long-term (2027 to 2028): This is where the range widens significantly. A partial recovery toward the 2024 peak puts JUP at $1.10 or higher in a bull market. A prolonged bear market could see it drop toward $0.30. Confidence: 51%.

    What to Watch

    Here are the specific signals worth monitoring over the next 30 to 60 days:

    • $0.24 support level: If JUP loses this on high volume, expect a retest of $0.20.
    • $0.2627 resistance: A close above this level on strong volume is a bullish signal for continuation.
    • Securitize volume data: Watch for any public reporting on tokenized equity trading volumes through Jupiter. Real adoption will be the next catalyst.
    • Solana ecosystem news: The Alpenglow upgrade timeline and any institutional announcements will move the entire Solana ecosystem, including JUP.
    • Token unlock schedule: Check Jupiter’s official transparency reports for upcoming vesting events that could add sell pressure.

    Disclaimer: This article is for informational and educational purposes only and should not be construed as financial, investment, or trading advice. Cryptocurrency markets are highly volatile, and past performance does not guarantee future results. The price predictions and analyses presented here are based on AI models, technical indicators, and available data at the time of writing. They are not guarantees. Always conduct your own research and consult with a qualified financial advisor before making any investment decisions. Pump Parade and its authors do not assume liability for financial losses incurred based on information provided in this article.
    About our AI predictions: Pump Parade’s price predictions are generated by machine learning models that analyze technical indicators, on-chain data, and market sentiment. These models have limitations and cannot account for black swan events, regulatory changes, or sudden market shifts. Use AI predictions as one input among many in your research.

    Zcash (ZEC) Price Prediction 2026: Can ZEC Hit $700?

    0
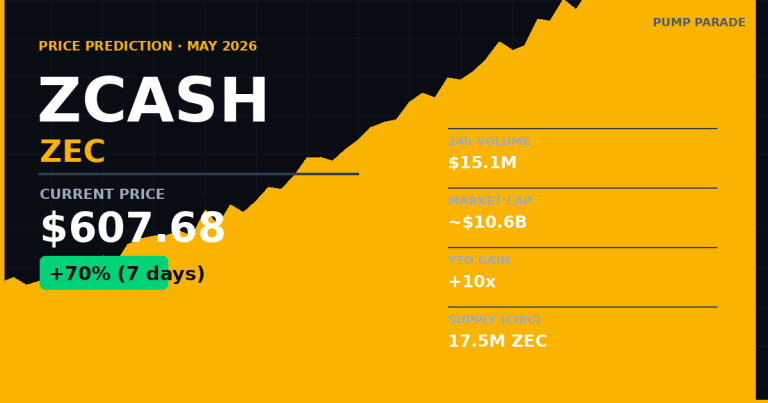
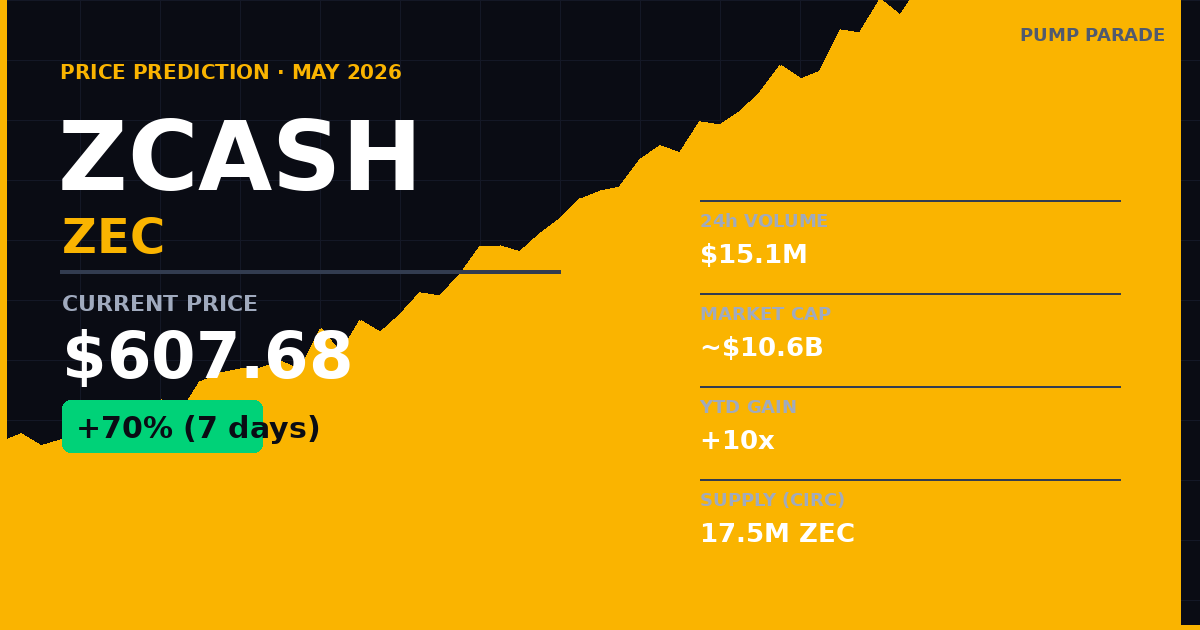
    Zcash ZEC price prediction 2026 hero image showing current price at $607.68

    Zcash (ZEC) just posted one of the most explosive moves in crypto this year. In seven days, it gained over 70%. At time of writing, ZEC trades at $607.68, up roughly 10x from where it started 2026.

    This is not a memecoin pump. It is not random noise. A series of high-conviction catalysts drove this move, and the narrative behind them is still building. So: can ZEC reach $700? And what would need to go wrong for it to fall back? Let us break it down.

    What Is Zcash? A Quick Refresher

    Zcash launched in 2016 as a Bitcoin fork with one key upgrade: privacy. Where Bitcoin makes every transaction visible on a public ledger, Zcash lets users send “shielded” transactions using zero-knowledge proofs. Think of it as a sealed envelope versus a postcard. The transaction still happens on a public blockchain, but the sender, receiver, and amount can all remain hidden.

    This optional privacy is a crucial distinction. Other privacy coins like Monero enforce privacy on every transaction, which has made them targets for exchange delistings and regulatory action. Zcash took a more pragmatic path. Users can choose transparent or shielded transactions. That flexibility has kept ZEC listed on Coinbase, Robinhood, and major global exchanges.

    Key metrics at time of writing:

    • Price: $607.68
    • Market Cap: approximately $10.6 billion
    • Circulating Supply: approximately 17.5 million ZEC
    • 24-hour Volume (on-chain): over $15 million on Birdeye
    • YTD Performance: approximately +900% (from ~$60 in January 2026)

    What Just Happened: The Catalysts Driving ZEC’s Surge

    A handful of things converged in May 2026 to ignite this move. None of them appeared overnight.

    1. Multicoin Capital Discloses a Major ZEC Position

    On May 4, 2026, Tushar Jain, co-founder of Multicoin Capital, publicly disclosed that his fund had been accumulating ZEC since February. The thesis was clear: Zcash is the “cleanest” hedge against government surveillance and wealth seizure.

    In an era where digital asset tracking is expanding globally, Jain argued that financial privacy is becoming a premium. Zcash’s shielded pools offer something Bitcoin simply cannot. When a firm with Multicoin’s reputation stakes that claim publicly, markets listen.

    2. A Short Squeeze Added Fuel

    The move above $500 caught bearish traders off guard. Over $55 million in ZEC short positions were liquidated within 24 hours. This kind of cascade amplifies price moves in both directions. It pushed ZEC past several technical levels quickly, which in turn triggered more forced buying.

    3. Nearly 30% of Supply Is Locked in Shielded Pools

    On-chain data shows that roughly 30% of ZEC’s circulating supply sits in shielded pools. That supply is not available for sale on exchanges. Less liquid supply means each dollar of buying pressure moves the price further than it would on a coin with high exchange availability.

    4. Regulatory Tailwinds Are Shifting

    In January 2026, the U.S. Securities and Exchange Commission closed its investigation into the Zcash Foundation without enforcement action. That removed a major legal cloud. Meanwhile, Grayscale filed to convert its Zcash Trust into the first-ever spot ETF for a privacy coin. If approved, analysts estimate it could attract $500 million to $2 billion in fresh inflows. That is significant for an asset previously sitting at a $4 billion market cap.

    5. Robinhood Listing Brought Retail Access

    Zcash was added to Robinhood’s platform in the months before this surge. That expanded its accessible retail market considerably. Combined with the institutional narrative from Multicoin, ZEC caught attention from multiple buyer types at once.

    Technical Analysis: Where Does ZEC Stand Right Now?

    After a 70% weekly gain, the technicals show a token that has cooled from overbought territory but has not broken down.

    • RSI (Relative Strength Index): approximately 56. After touching extreme overbought readings above 80 during the initial surge, RSI has normalized. This gives room for another leg up without starting from an exhausted base.
    • Key Support Levels: $546 to $550 is the first line of defense. Below that sits $469, which analysts flag as the critical pivot. A close below $469 would signal trend reversal and likely pull ZEC toward the $380 to $420 range.
    • Immediate Resistance: The recent local high of $603. A clean four-hour close above this level opens the door toward $700, which aligns with several technical targets and analyst forecasts.
    • Volume Profile: Volume spiked sharply during the initial move and has been declining as price consolidates. That is textbook post-surge behavior. A fresh volume surge above $603 would be a strong continuation signal.

    If you’re tracking other established Layer 1 assets in this market cycle, our Chainlink (LINK) price prediction covers another institutional-grade token that has been seeing renewed interest alongside the broader alt market recovery.

    The Bull Case: Why ZEC Could Reach $700 and Beyond

    The bull case for Zcash in 2026 is not a single bet. It is a convergence of independent tailwinds.

    ETF approval is the biggest catalyst. If Grayscale’s spot ZEC ETF receives SEC approval in Q2 or Q3 2026, the inflow potential is substantial relative to ZEC’s market cap. Even a modest $500 million in institutional inflows into a coin with limited liquid supply could send prices well above $1,000.

    Privacy demand is a macro theme. Governments in multiple jurisdictions are expanding digital surveillance. Wealth tax discussions are active in several countries. Zcash offers something no transparent blockchain can: the ability to transact without creating a permanent public record. That use case becomes more valuable as surveillance expands.

    Post-halving supply dynamics favor bulls. ZEC completed its halving in November 2024, cutting daily new issuance by 50%. That supply shock typically takes six to twelve months to fully price in. The rally of the past few weeks may represent that repricing beginning in earnest.

    Bull targets:

    • 30-day target: $700 to $750
    • 6-month target: $850 to $1,100 (with continued narrative momentum)
    • 2027 to 2028 optimistic case: $1,500 to $2,000 (if ETF inflows materialize)

    The Bear Case: What Could Send ZEC Back Down

    Balance requires honest risk assessment. Here is what could go wrong.

    The short squeeze exhaustion risk is real. A meaningful portion of the recent move came from forced short covering. Once those positions are cleared, the buying pressure driving the move disappears. If new buyers do not step in, a retracement toward $450 to $500 is plausible in the short term.

    ETF rejection would hit hard. Much of the current narrative is priced around the assumption that the Grayscale ZEC ETF will receive approval. A denial would remove that catalyst and likely cause a sharp selloff. ZEC could drop to $350 to $450 in that scenario.

    Regulatory reversal remains a tail risk. Privacy coins occupy a gray area globally. A change in the SEC’s posture, or delistings from major exchanges, would significantly damage ZEC’s accessibility and price. This is a low-probability but high-impact risk.

    Bitcoin correlation could override the narrative. If Bitcoin drops sharply below $75,000, most altcoins follow regardless of project fundamentals. ZEC is not immune to broad market drawdowns.

    Bear targets:

    • Mild correction: $520 to $550 (normal consolidation)
    • ETF rejection scenario: $350 to $450
    • Full trend reversal: $200 to $300 (break below $469 pivot)

    AI Price Prediction Summary

    Our hybrid AI model draws on technical indicators, on-chain data, and market sentiment. Here are the probability-weighted targets for ZEC across three timeframes.

    Zcash ZEC price prediction table 2026 showing bear base and bull targets across three timeframes

    The 30-day base case of $650 reflects continued consolidation above current support, with the $700 resistance serving as the key level to watch. The model assigns a 58% confidence to ZEC holding above $500 and reaching $650 within a month.

    For the 6-month base case of $850, the model factors in: further shielded supply growth, Grayscale ETF progress, and Bitcoin staying above $70,000. If Bitcoin corrects sharply, this target becomes less likely.

    The 2027 to 2028 base case of $900 assumes ETF flows eventually arrive and the privacy narrative continues to build. At $900 per ZEC with roughly 18 million in supply, market cap would approach $16 billion. That is large but not unprecedented for a proven-utility coin in a bull cycle.

    What to Watch in the Next 30 Days

    Here are the specific signals that will shape ZEC’s near-term direction:

    • $603 resistance break: A confirmed weekly close above $603 with rising volume opens the $700 path.
    • $546 support hold: If ZEC pulls back, watch this level closely. A bounce here keeps the bull structure intact. A close below it signals weakness.
    • Grayscale ETF news: Any update on the SEC’s review timeline will move the market. Monitor official SEC filings and Grayscale communications.
    • Shielded supply growth: On-chain growth in shielded pool participation signals accumulation. Declining shielded supply would be a bearish signal.
    • Bitcoin’s trajectory: ZEC runs its own narrative right now, but macro crypto sentiment still matters. A BTC move below $75,000 would put pressure on most altcoins.

    Final Take

    Zcash is not a new project chasing a hot narrative. It is a decade-old protocol with proven cryptography, real institutional backing, and a value proposition that is becoming more relevant as privacy becomes a premium.

    The 70% weekly move was partly a short squeeze. But the catalysts underneath it are not going away. The Multicoin thesis, the Grayscale ETF filing, the post-halving supply dynamics, and the growing shielded pool are all real structural factors.

    Our AI model sees the base case at $650 in 30 days and $850 by end of 2026. The path to $700 is clear if ZEC holds above $546 and breaks $603 with volume. The path to $350 exists too, if the ETF thesis fails or Bitcoin rolls over.

    The risk-reward here is genuinely interesting. That said, position sizing and risk management matter more than ever in a market this volatile.


    Disclaimer: This article is for informational and educational purposes only and should not be construed as financial, investment, or trading advice. Cryptocurrency markets are highly volatile, and past performance does not guarantee future results. The price predictions and analyses presented here are based on AI models, technical indicators, and available data at the time of writing. They are not guarantees. Always conduct your own research and consult with a qualified financial advisor before making any investment decisions. Pump Parade and its authors do not assume liability for financial losses incurred based on information provided in this article.
    About our AI predictions: Pump Parade’s price predictions are generated by machine learning models that analyze technical indicators, on-chain data, and market sentiment. These models have limitations and cannot account for black swan events, regulatory changes, or sudden market shifts. Use AI predictions as one input among many in your research.

    Solana (SOL) Price Prediction 2026: Alpenglow Ahead

    Solana SOL Price Prediction 2026 featuring current price, market cap, and Alpenglow upgrade catalyst

    Solana is trading at $88.30 as of May 8, 2026. That is down roughly 70% from its all-time high of $294.85, set in January 2025. The network has had a rough year: on-chain fees have dropped, total value locked (TVL) has pulled back, and spot ETF inflows hit their weakest monthly figure since launch in April.

    And yet, something shifted this week. SOL climbed from $83.75 on May 2 to a seven-day high of $90.45, a move of nearly 8% in six days. The catalyst? Solana co-founder Anatoly Yakovenko confirmed at Consensus Miami 2026 that the Alpenglow consensus upgrade is on track for Q3 2026. The technical implications are significant. The market appears to be pricing them in, at least partially.

    This article breaks down the current setup for SOL: the technicals, the bull case, the bear case, and where our AI model puts the price targets for 2026, 2027, and 2030.

    What Is Solana?

    Solana is a high-performance Layer 1 blockchain designed for speed and low transaction costs. It can process tens of thousands of transactions per second, with fees typically under a fraction of a cent. That combination made it the dominant chain for memecoins, DeFi trading, and consumer apps in the 2024-2025 cycle.

    The network has a circulating supply of approximately 576 million SOL and a current market cap of around $50.8 billion, placing it among the top five cryptocurrencies by market cap. Unlike Ethereum, Solana has no hard supply cap, so inflation dynamics are an ongoing consideration for long-term holders.

    Solana’s ecosystem includes major protocols like Raydium, Jupiter, and Kamino, along with a thriving memecoin culture that drove massive retail engagement during the last bull cycle. The ecosystem also supports a healthy liquid staking market: if you are holding SOL long-term, platforms like those covered in our Marinade vs Jito liquid staking comparison let you earn yield while you wait. For a broader look at how to navigate Solana’s trading ecosystem, our guide on Solana memecoins and high-potential opportunities is a solid starting point.

    The Alpenglow Upgrade: Why It Matters

    This is the most important catalyst for SOL right now, and it deserves a proper explanation.

    Solana’s current consensus mechanism achieves finality in roughly 12 seconds. That sounds fast. Compared to Bitcoin or Ethereum, it is. But for institutional trading desks, high-frequency market makers, and applications requiring real-time confirmation, 12 seconds is a long time.

    Alpenglow changes that. According to Yakovenko at Consensus Miami 2026, the upgrade replaces Solana’s Proof-of-History (PoH) and Tower BFT mechanisms with two new components: Votor and Rotor. The result is a two-tier finality system. If 80% or more of staked validators participate in the first voting round, a block achieves finality in 100 to 150 milliseconds. If participation drops to 60 to 80%, a secondary round kicks in, still settling in under 250 milliseconds.

    In plain terms: Solana goes from a 12-second blockchain to a sub-second blockchain. That unlocks a new category of applications, including institutional-grade trading infrastructure, real-time DeFi primitives, and payment systems that can compete with traditional financial rails.

    Yakovenko said the release is “basically due sometime this year, I think next quarter.” That puts the mainnet launch window in Q3 2026.

    Technical Analysis: Where SOL Stands Right Now

    The technical picture for SOL is cautiously constructive. Not wildly bullish, but not broken either.

    Key levels to know:

    • Current price: $88.30
    • Immediate support: $84 to $85 (held multiple times in the past two weeks)
    • First resistance: $95 to $97 (previous consolidation zone)
    • Second resistance: $110 to $120 (major structure from Q1 2026)

    The RSI (Relative Strength Index, a momentum indicator that runs from 0 to 100) is sitting at approximately 54. That puts it squarely in neutral territory, meaning the recent rally has not pushed the token into overbought conditions. There is room to run before sellers are likely to step in aggressively.

    More encouraging: both the 50-day and 200-day moving averages are now trending upward. The 200-day MA began rising in early February 2026, which is a significant structural shift after a long period of declining averages. When both major moving averages point up together, it tends to signal a durable improvement in trend, not just a short-term bounce.

    The recent candles are also forming a pattern of higher lows since early May. SOL put in a low near $83.23 on May 4, then a higher low around $86.04 on May 6. That is not a confirmed breakout, but it is the right kind of price action for bulls to be watching.

    Volume has been consistent throughout the move, ranging from 143 million to 177 million SOL per day in on-chain trading activity. That is not a volume spike, but it suggests sustained buying interest rather than a low-liquidity pump.

    The Bull Case for SOL in 2026

    The bull case rests on three pillars: the Alpenglow upgrade, a potential broader market recovery, and Solana’s structural position in the ecosystem.

    Alpenglow as a re-rating event. Sub-second finality fundamentally expands what can be built on Solana. If the mainnet launch proceeds in Q3 as expected, it could trigger a wave of new project deployments, capital migration from other chains, and renewed institutional interest. Markets tend to front-run these kinds of catalysts. If SOL has not already moved significantly by the time Alpenglow goes live, history suggests the price could move sharply on confirmation.

    Bitcoin macro tailwinds. BTC is currently trading around $82,000 and showing signs of momentum toward the $85,000 to $90,000 range. In previous cycles, sustained Bitcoin strength has been a leading indicator for altcoin rotation. Solana, as one of the largest and most liquid altcoins, tends to benefit early in those rotation phases.

    Cumulative ETF inflows still growing. While monthly ETF inflows for SOL have slowed significantly (April 2026 brought in just $39.93 million, down from a high of $419 million in November 2025), the cumulative figure is approaching $975 million. The infrastructure for institutional access is in place. A macro improvement or a technical catalyst like Alpenglow could restart the inflow trend.

    The Bear Case for SOL in 2026

    The bear case is real, and it should not be glossed over.

    TVL and fee revenue are down. Solana’s on-chain activity metrics have contracted meaningfully in 2026. Total value locked has fallen from its cycle highs, and daily fee revenue, which was a major narrative in 2024 and early 2025, has declined. The network generated much of its excitement during the memecoin supercycle. That cycle has cooled. You can see this dynamic play out in the muted performance of Solana DeFi tokens like ORCA, which reflects the broader pullback in on-chain activity.

    ETF inflows are decelerating fast. Six consecutive months of declining monthly ETF inflows is a warning sign. It suggests the institutional buying that drove SOL’s 2025 rally is not currently expanding. If that trend continues, one of the main structural supports for the price disappears.

    Broad altcoin headwinds. The overall altcoin market remains under pressure. The Fear and Greed Index is sitting near neutral (50), and the broader sentiment reading for Solana specifically is approximately 65% bearish. In that environment, any stumble in BTC or macro conditions could push SOL back toward its $75 to $80 support band or lower.

    Upgrade risk. Alpenglow is bullish if it ships on time and works as intended. Blockchain upgrades carry execution risk. A delay, a testnet issue, or a security concern discovered during the rollout could flip the narrative quickly.

    Solana (SOL) Price Prediction Summary (2026)

    Solana SOL price prediction targets for 2026 showing bear, base, and bull cases across three timeframes

    Our hybrid AI model combines technical indicators, on-chain metrics, and momentum signals to generate probabilistic price targets. Here is the current output, framed across three timeframes.

    Short-Term: Next 30 Days

    The setup favors a continued grind toward $95 to $105 if BTC holds its ground and the Alpenglow narrative stays positive. The $84 to $85 support zone has held consistently in recent sessions. A break below $83 would shift the short-term picture negative and open a path toward $75.

    • Bear target: $75
    • Base target: $97 to $105
    • Bull target: $120

    Mid-Term: 6 Months (Q4 2026)

    By Q4 2026, the Alpenglow upgrade should be live on mainnet. If it delivers on its promise and the broader market avoids a macro shock, SOL could realistically push toward the $130 to $150 range. The bull target of $200 would require both a strong BTC cycle and a material pickup in ETF inflows. The bear scenario of $62 assumes a deteriorating macro environment and continued ecosystem outflows.

    • Bear target: $62
    • Base target: $130 to $150
    • Bull target: $200

    Long-Term: End of 2026 to Early 2027

    Longer-term predictions within the 2026 cycle carry more uncertainty. If Solana successfully upgrades to Alpenglow and maintains its developer ecosystem, SOL has a credible path toward its previous ATH range and potentially beyond. The base case assumes it remains a top-three smart contract platform by developer activity and TVL.

    • Bear target: $85
    • Base target: $190 to $220
    • Bull target: $370

    SOL Price Prediction 2027 to 2030

    Many readers are looking further ahead. Here is a concise extended outlook based on our AI model and historical cycle analysis. These figures carry more uncertainty the further out they go.

    SOL Price Prediction 2027

    If the next Bitcoin halving cycle follows the pattern of previous cycles, markets typically begin pricing in the event 12 to 18 months in advance. That puts 2027 in a potential pre-halving accumulation phase. Our base target for SOL in 2027 is $180 to $250, assuming Alpenglow is live on mainnet and the broader altcoin market has recovered from its 2026 lows. The bear case is $90 if macro conditions deteriorate significantly. The bull case of $350 would require a full altcoin season and strong institutional demand.

    SOL Price Prediction 2030

    Four-year predictions carry substantial uncertainty. With that caveat stated clearly: if Solana maintains its position as a top-three smart contract platform, expands institutional adoption post-Alpenglow, and benefits from multiple Bitcoin halving cycles, our long-range model suggests the following range for 2030.

    • Bear target: $80 to $120 (if Solana loses ground to newer competitors)
    • Base target: $250 to $350 (continued ecosystem growth, mainstream adoption)
    • Bull target: $400 to $600 (full institutional adoption, dominant L1 position)

    What to Watch

    Here is a practical framework for tracking this setup over the coming months.

    • Alpenglow testnet progress. Watch for official announcements from Solana Labs and the core development team. Testnet deployment will be the signal that mainnet is getting close. Any major issues at that stage will show up in price first.
    • $90 to $95 reclaim. SOL hit $90.45 briefly on May 7. A sustained close above $95 would confirm the breakout and target the $110 to $120 resistance band. Failure to hold above $86 on a weekly close is a yellow flag.
    • Monthly ETF inflow data. If May 2026 shows a reversal in the declining inflow trend, that is a meaningful signal that institutional buyers are returning ahead of the upgrade.
    • BTC direction. Solana does not trade in isolation. If Bitcoin breaks below $75,000, expect SOL to revisit the $75 to $80 range regardless of project-specific news.

    The Bottom Line

    SOL at $88 is not the obvious buy that it might have looked like at $50. But it is also not the obvious avoid that it might look like given the 70% drawdown from ATH. The Alpenglow upgrade is a genuine, technically significant catalyst with a credible timeline. The on-chain data shows a network still generating real activity. And the technical structure, with rising moving averages and neutral RSI, gives the setup room to develop without being immediately overextended.

    The risk is real too. ETF inflows have been weak. Sentiment is tilted bearish. And upgrade execution always carries uncertainty.

    The probability-weighted base case has SOL somewhere between $97 and $150 by end of 2026. Getting there will depend on whether Alpenglow ships on schedule and whether BTC holds its macro momentum. Both are worth watching closely.

    Frequently Asked Questions

    What will Solana (SOL) be worth in 2026?

    Our AI model’s base case for SOL in 2026 is $130 to $150, assuming the Alpenglow upgrade ships on schedule in Q3 2026 and Bitcoin maintains momentum above $80,000. The bull case target is $200, which requires a strong macro environment and a pickup in SOL ETF inflows. The bear case is $62 if broader market conditions deteriorate significantly.

    Can SOL reach $200 in 2026?

    Reaching $200 in 2026 is possible but not our base case. It would require Alpenglow to launch without issues, a significant recovery in Solana ETF inflows (which have declined for six consecutive months), and Bitcoin holding above $90,000. If all three conditions are met, $200 is within reach by Q4 2026. Our AI model places the probability of this outcome at roughly 20 to 25%.

    What is the Alpenglow upgrade and why does it matter for SOL price?

    Alpenglow is Solana’s most significant consensus overhaul to date. It replaces Proof-of-History and Tower BFT with two new components called Votor and Rotor. Transaction finality drops from roughly 12 seconds to 100 to 150 milliseconds. That opens Solana to institutional trading desks, high-frequency market makers, and real-time DeFi applications. Co-founder Anatoly Yakovenko confirmed at Consensus Miami 2026 that mainnet launch is expected in Q3 2026.

    What will SOL be worth in 2030?

    Our long-range model puts SOL in a $250 to $350 range for 2030 in the base case, $400 to $600 in a bull scenario, and $80 to $120 in a bear scenario. These figures carry significant uncertainty given the four-year timeframe. They assume Solana retains its position as a top smart contract platform and benefits from multiple Bitcoin halving cycles.

    Is Solana (SOL) a good investment in 2026?

    This is not financial advice. Whether SOL suits any individual portfolio depends entirely on personal risk tolerance and goals. What the data shows: SOL is down 70% from its ATH, has a major technical upgrade on the near-term horizon, and sits in neutral technical territory with rising moving averages. Crypto markets are volatile, and SOL could fall further or rise significantly. Always conduct your own research and consult a financial advisor before making any investment decisions.


    Disclaimer: This article is for informational and educational purposes only and should not be construed as financial, investment, or trading advice. Cryptocurrency markets are highly volatile, and past performance does not guarantee future results. The price predictions and analyses presented here are based on AI models, technical indicators, and available data at the time of writing. They are not guarantees. Always conduct your own research (DYOR) and consult with a qualified financial advisor before making any investment decisions. Pump Parade and its authors do not assume liability for financial losses incurred based on information provided in this article.
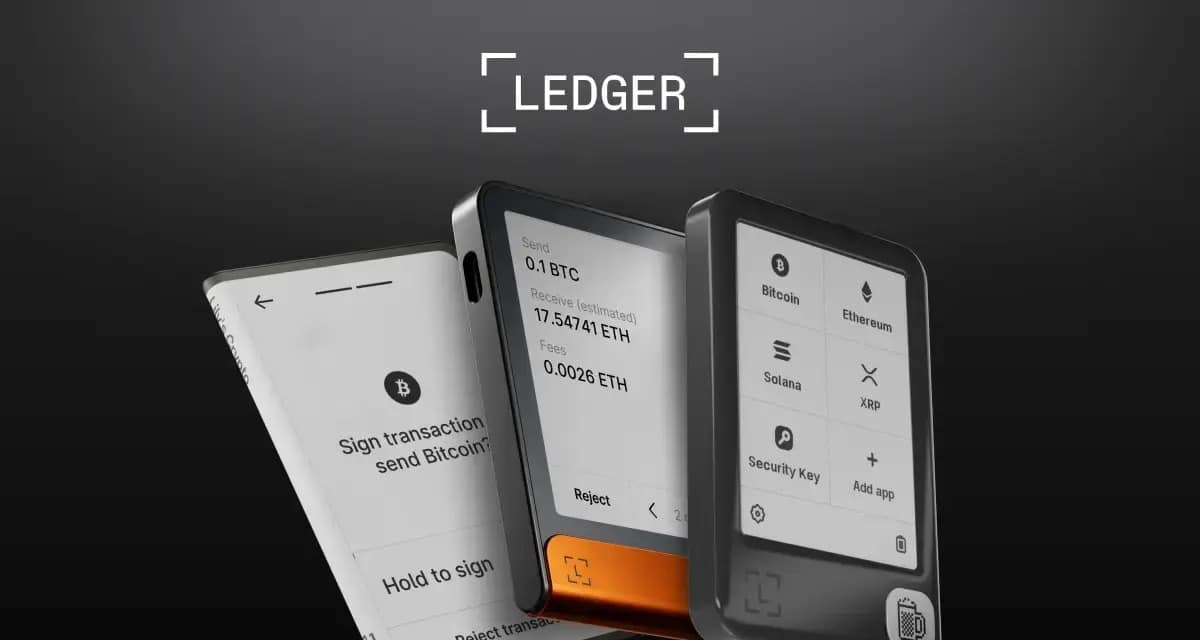
    About our AI predictions: Pump Parade’s price predictions are generated by machine learning models that analyze technical indicators, on-chain data, and market sentiment. These models have limitations and cannot account for black swan events, regulatory changes, or sudden market shifts. Use AI predictions as one input among many in your research.

    Drift Protocol Review 2026: Fees, Features & Verdict

    0

    If you trade derivatives on Solana, you have probably heard of Drift Protocol. It is one of the largest decentralized perpetual futures exchanges on the network, with billions in cumulative volume and a unified margin engine that lets you trade perps, spot, and lending from a single account. But 2026 has not been kind. After a $285 million exploit in April that drained more than half of the protocol’s TVL, traders are asking the obvious question: is Drift still worth using?

    This Drift Protocol review covers what the platform actually offers in 2026, how its fees and leverage compare, what the recent security incident really means for users, and whether you should put real capital on the line today.

    TL;DR Verdict

    Rating: 3.7 / 5

    Drift remains the most feature-complete on-chain perps venue on Solana. The unified cross-margin design, JIT auction model, and tight execution times are genuinely best-in-class for a DEX. Fees are competitive once DRIFT staking discounts kick in, and traders get up to 101x leverage on perps with deep liquidity in BTC, ETH, and SOL markets. The April 2026 exploit, however, is a serious mark against the protocol. The team has secured roughly $147.5M in recovery support from Tether and partners, is rebuilding the codebase with OtterSec and Asymmetric Research audits, and is rolling out a community-governed multisig. New users should size positions cautiously while the relaunched stack proves itself in production. Power users who already understand the platform will find Drift’s tooling hard to beat anywhere else on Solana.

    Drift Protocol Review 2026 hero image
    Drift Protocol remains Solana’s leading on-chain perps DEX in 2026.

    What is Drift Protocol?

    Drift is a decentralized trading protocol built on Solana that bundles perpetual futures, spot trading, and a lend and borrow market into one cross-margined account. Every asset you deposit can act as collateral, earn yield through the borrow market, or back a leveraged perp position, without the constant juggling required on most other DEXs.

    The team launched the original v1 product in late 2021 and shipped a major v2 redesign that introduced an on-chain orderbook and a Just-in-Time (JIT) liquidity auction model. The current v3 stack pushed execution further, with an internal write up describing fills on roughly 85% of market orders within a single Solana slot (about 400 milliseconds) and slippage on large orders compressed to as little as 2 basis points. For an on-chain perps venue, that level of execution quality is unusual.

    By the end of Q1 2026, Drift had crossed 175,000 unique traders and more than $150 billion in cumulative trading volume, making it the dominant perps DEX in the Solana ecosystem and one of the larger derivatives venues across all of crypto.

    Drift Protocol Key Stats at a Glance

    Drift Protocol key stats infographic for 2026
    Source: DefiLlama, Drift Protocol docs, official protocol disclosures (May 2026).

    Two notes on these numbers. TVL of around $256 million reflects the post-exploit reality, down from roughly $550 million before April 1, 2026. Volume and trader counts are cumulative and largely pre-incident. Fee numbers are the starting Tier 3 rate before any DRIFT staking discounts are applied.

    Features Deep Dive

    Unified Cross-Margin Account

    The headline feature is also the one most users underestimate. On Drift, your spot balances, lending positions, and perp collateral all live in the same risk engine. Deposit SOL and it earns lending yield, serves as margin for a long ETH-PERP, and can be borrowed against to short a memecoin in spot, all at the same time. The cross-margin design is closer to what professional CEX traders are used to than to the siloed sub-account model on most DEXs.

    Perpetual Futures with up to 101x Leverage

    Drift supports perps on the major reference assets (BTC, ETH, SOL) plus a long tail of Solana ecosystem and altcoin markets. Leverage tops out at 101x on certain perp markets, with risk parameters tuned per market. Funding payments use a standard predictive funding model so positions are pulled toward the index price over time.

    Spot Markets and Margin Trading

    Spot trading is available with up to 5x leverage by borrowing against deposited collateral. Because spot and perps share the same orderbook architecture and JIT auction, fills tend to be tight even on smaller assets relative to AMM-only venues.

    Just-in-Time (JIT) Liquidity

    Every market order on Drift kicks off a roughly 5-second Dutch auction. Market makers compete to fill the order at or better than the auction price, which decays from the better side of the book toward a worse end price. The model means retail orders frequently fill inside the visible spread, and it lets professional makers participate without needing to maintain dense passive orderbook quotes.

    Lending and Borrowing

    The same vault that backs perp settlement also runs a spot lending market. Suppliers earn variable yield, borrowers pay interest, and rates are set algorithmically based on utilization. For traders, this means you can carry idle stablecoins on Drift and earn while waiting to deploy.

    Vaults and Strategies

    Drift Vaults let users delegate capital to professional managers running market making, basis trading, and other quant strategies on the platform. It is a passive way to participate in Drift if you do not want to actively trade.

    Drift Protocol trading interface
    The Drift Protocol web app combines perps, spot, and lending in a single cross-margin view. Source: drift.trade.

    Fees and Pricing

    Drift uses a tiered taker and maker fee schedule based on 30-day volume and DRIFT staking. The starting rates for retail traders look like this:

    • Taker fee: 0.0275% on perps at Tier 3 (the entry tier). With the 20% DRIFT staking discount applied, the effective rate falls to roughly 0.022%.
    • Maker rebate: -0.0025% at the entry tier, which becomes -0.003% with the staking discount. Stakers can stack up to 40% extra rebates on top.
    • Spot trading: Spot taker fees are typically lower than perps, with details varying per market.
    • Borrow rates: Algorithmic and variable, set per asset by utilization curves.

    For comparison, most centralized exchanges charge taker fees in the 0.04% to 0.075% range for retail tiers, so Drift undercuts CEX taker fees by a meaningful margin once you factor in DRIFT staking. Maker rebates on Drift are unusual for a DEX and one of the reasons professional market makers have stayed engaged.

    The catch is that fee discounts via DRIFT staking only apply to perpetual contract fees, not to spot or lending. Active perp traders get most of the benefit.

    The April 2026 Exploit and What Comes Next

    Any honest Drift review in 2026 has to address the elephant in the room. On April 1, 2026, attackers drained roughly $285 million from the protocol in about 12 minutes, making it the largest DeFi hack of the year and the second largest security incident in Solana history.

    The exploit was not a smart contract bug in the strict sense. According to incident reports, North Korean DPRK-linked actors spent roughly six months socially engineering Drift contributors, eventually compromising developer devices through a malicious code repository and a fake TestFlight build. They then pushed code that listed a fake collateral token (CarbonVote / CVT), inflated its valuation through manipulated oracles, and used it as bogus margin to drain real assets from the vaults.

    Drift’s TVL fell from about $550 million to roughly $252 million in the immediate aftermath. To stabilize the protocol, the team announced a recovery package totaling around $147.5 million, with Tether contributing up to $127.5 million and other partners providing an additional $20 million. The structure includes a $100 million revenue-linked credit facility, an ecosystem grant, and dedicated loans to market makers to restore order book depth.

    For users, the most important developments are operational rather than financial. Before the relaunched stack goes live, every protocol component will be re-audited by OtterSec and Asymmetric Research. Drift is also introducing a community-governed multisig for core protocol assets, with all signers required to use dedicated devices and verify transaction content outside the primary signing interface. Solana Foundation simultaneously rolled out a broader security overhaul for the ecosystem in the wake of the incident, which is covered in our breakdown of the STRIDE security framework.

    None of this fully erases the incident. But the response so far has been credible: clear public communication, a real recovery package, independent audits, and material changes to operational security.

    Pros and Cons

    Pros

    • Best-in-class on-chain execution. Sub-second fills, 2 bps slippage on large orders, and JIT auctions that often improve on visible spreads.
    • True unified cross-margin. Spot, perps, and lending share collateral in one risk engine, similar to professional CEX accounts.
    • Deep liquidity in major perps markets. BTC, ETH, and SOL perps consistently rank among the deepest on-chain order books on Solana.
    • Competitive fees. Taker fees as low as 0.022% with DRIFT staking, plus genuine maker rebates.
    • Transparent recovery process. The team has communicated clearly post-incident and brought in OtterSec and Asymmetric Research for full re-audits.
    • No KYC. Like most Solana DEXs, Drift is permissionless: connect a wallet and trade.

    Cons

    • Recent $285M exploit. The April 2026 incident is significant and any user should consider counterparty and protocol risk before allocating large size.
    • Complex for beginners. Cross-margin, JIT auctions, and 101x leverage are powerful but easy to misuse if you are new to derivatives.
    • Reliance on Solana uptime. Solana network congestion or outages directly affect trading and liquidations on Drift.
    • DRIFT staking discounts only apply to perps. Spot and lending do not benefit from the staking program.
    • UI density. The trading UI is information-rich, which is great for power users but can overwhelm casual traders.

    Security and Trust

    Pre-incident, Drift had been audited multiple times and operated for years without a major exploit. The April 2026 attack exploited human and operational weaknesses rather than a single vulnerability in the audited contract logic, which is part of why the recovery plan focuses heavily on signer hygiene, dedicated devices, and a community-governed multisig in addition to fresh code audits.

    OtterSec, one of the most respected Solana security firms, is leading the codebase redesign and pre-launch audit. Asymmetric Research is conducting a parallel independent review. Both firms will sign off before the relaunched stack goes live.

    For traders, the practical implication is that the recovered protocol should be treated as a new system on its first lap. Start with smaller size, monitor the relaunch closely, and watch for the audit reports to become public.

    User Experience

    Drift’s web app is one of the more polished trading UIs on Solana. The default layout shows the orderbook, recent fills, and a clean chart from the same provider many CEXs use, with cross-margin balances and open positions docked along the bottom. Order entry supports market, limit, scaled, and trigger orders, and the JIT auction is exposed transparently so you can watch fills land inside the spread.

    Mobile users can install the Drift app via TestFlight on iOS or progressive web app on Android. Wallet support covers all major Solana wallets, including Solflare, Phantom, and Backpack. For spot swaps, Drift integrates aggregator routing similar to other Solana venues, so smaller markets are still tradeable with reasonable execution. If you are choosing between spot DEXs first, our Raydium vs Orca comparison covers the AMM side in more depth.

    Who Should Use Drift in 2026?

    Drift is a strong fit for traders who want serious on-chain derivatives without giving up custody, want to run cross-margin strategies that combine perps and spot, or want to earn maker rebates as a smaller market participant. It is also a fit for passive users who want to allocate to vetted vault strategies.

    It is less of a fit for absolute beginners, traders who only need simple spot swaps, or anyone who wants zero-risk exposure to a protocol that is still digesting a major incident. If you fall into the last group, consider sitting on the sidelines until the relaunched audited stack has been live in production for a meaningful period.

    Final Verdict

    Drift Protocol is, on the merits, still the best on-chain perps platform on Solana in 2026. The unified margin design, JIT execution, deep liquidity, and competitive fee structure are unmatched among native Solana DEXs. The April 2026 exploit is real, painful, and should not be downplayed, but the team’s response (a substantial Tether-anchored recovery package, dual independent audits, and structural changes to operational security) is about as good as a post-incident response gets in DeFi.

    Score: 3.7 / 5. Use it, but size positions appropriately while the relaunched stack proves itself.

    Visit Drift Protocol

    FAQ

    Is Drift Protocol safe to use after the April 2026 exploit?

    The protocol has secured a roughly $147.5M recovery package backed by Tether and partners and is re-auditing its codebase with OtterSec and Asymmetric Research before relaunching. It is reasonable to use the platform with appropriately sized positions, but treat the relaunched stack as a new system on its first laps and monitor closely.

    What is the maximum leverage on Drift?

    Drift offers up to 101x leverage on perpetual contracts and up to 5x leverage on spot trades, with risk parameters and effective leverage varying per market.

    How much does it cost to trade on Drift?

    Entry-tier perp taker fees are 0.0275% with maker rebates of -0.0025%. Staking DRIFT can lower taker fees by up to 20% and stack additional maker rebates by up to 40% on top of the standard schedule.

    What chains does Drift support?

    Drift is a Solana-native protocol. All trading, lending, and settlement happens on Solana, so you will need a Solana wallet and SOL for transaction fees.

    How does Drift compare to Hyperliquid or dYdX?

    Hyperliquid and dYdX run on their own chains and offer competitive perps with their own appchain trade-offs. Drift’s edge is being the leading perps venue native to Solana, which means tight integration with the broader Solana DeFi stack, including liquid staking tokens like the ones covered in our Marinade vs Jito comparison. If you live in the Solana ecosystem, Drift is the obvious choice. If you do not, the comparison gets closer.

    Disclaimer: This article is for informational purposes only and does not constitute financial or investment advice. Trading derivatives is high risk and can result in the loss of all deposited capital. Always do your own research before using any DeFi protocol.