More
    Home Blog Page 17

    Polkadot (DOT) Price Prediction 2026: JAM Catalyst

    0

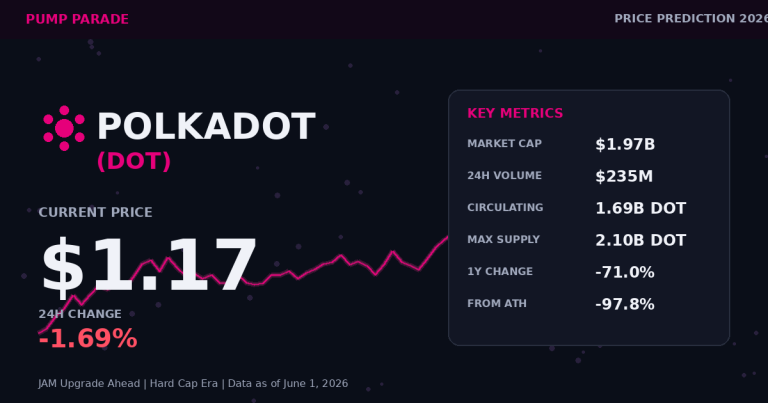
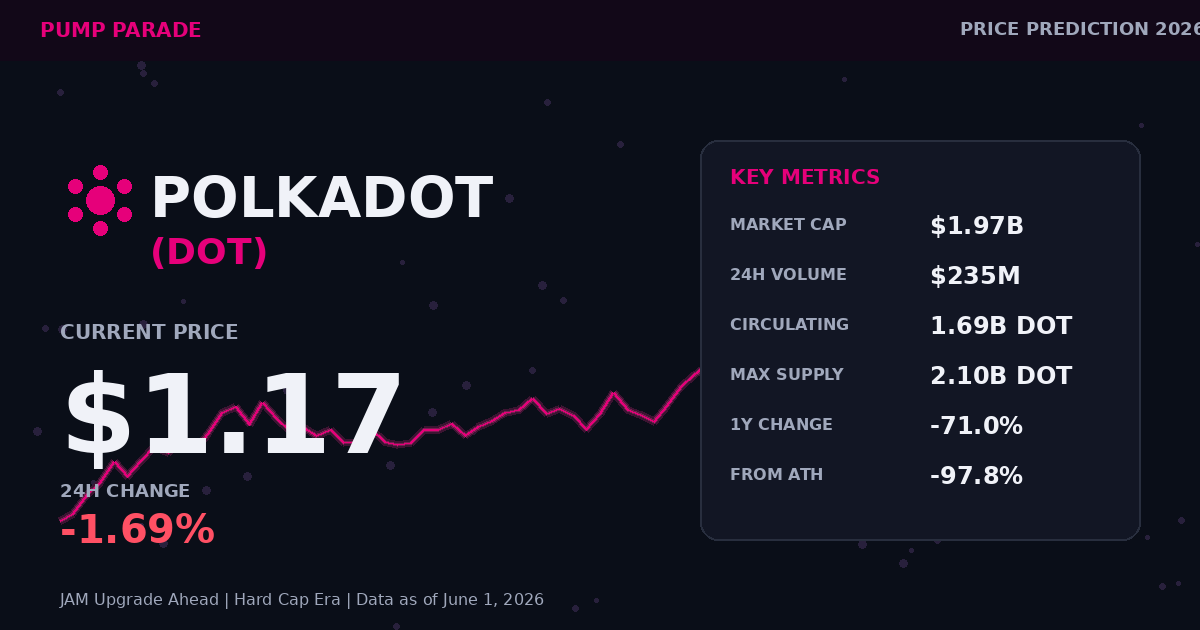
    Polkadot (DOT) is trading at $1.17 as of June 1, 2026. That is less than a dollar above its all-time low of $1.15. It is also 97.8% below its November 2021 peak of $54.98.

    So why are some of the most patient builders in crypto suddenly paying attention again? Two reasons. In March, Polkadot did something Bitcoin maxis never expected: it capped its supply forever. And in the second half of 2026, the network plans to ship JAM, the biggest architectural rewrite since Polkadot launched.

    This article breaks down the bull case, the bear case, and where DOT might actually trade by 2028. We use real on-chain and ETF data, not vibes.
    Polkadot DOT price prediction 2026 hero image showing current price and key metrics

    Polkadot Price Right Now: Stuck at the Floor

    Here is the data as of June 1, 2026:

    • Price: $1.17
    • Market cap: $1.97 billion
    • 24-hour volume: $235 million
    • 24-hour range: $1.16 to $1.20
    • Circulating supply: 1.686 billion DOT
    • Max supply: 2.1 billion DOT (capped)
    • 1-year change: -71%
    • 30-day change: -3%

    The chart looks brutal. DOT has lost about 71% of its value over the past 12 months. It has also failed to hold $1.20 support in recent sessions. Bulls will say this is capitulation. Bears will say it is just a slow bleed with no bottom in sight.

    Both can be right at the same time. That is the awkward part of analyzing DOT in 2026.

    Why DOT Is Suddenly Interesting Again

    On March 14, 2026, Polkadot governance enacted Referendum 1710. The vote passed with 81% in favor. It did two things at once.

    First, it set a permanent hard cap of 2.1 billion DOT. That makes Polkadot a disinflationary asset for the first time, with a fixed maximum supply written into the protocol. Second, it cut annual issuance by 53.6%. Before the change, the network minted around 120 million DOT each year. After, it mints closer to 57 million.

    The math matters. With circulating supply already at 1.686 billion, only about 414 million DOT remain to be minted, ever. At the new issuance rate, the network is roughly 7 years away from hitting the cap.

    This is the same playbook Bitcoin ran for 17 years. We covered the BTC version in our Bitcoin Price Prediction 2026 piece. The structural argument is similar. Scarcity narratives compound when supply growth slows and demand stays steady.

    The catch is demand. Bitcoin had ETFs pulling in tens of billions. DOT has the 21Shares TDOT ETF, which we will come back to in the bear case.

    The JAM Upgrade: Polkadot’s Bigger Bet

    JAM stands for Join-Accumulate Machine. It was first announced by Polkadot co-founder Gavin Wood in April 2024. It is now nearing mainnet deployment.

    What does JAM actually do? In plain terms, it replaces the current Relay Chain with a more flexible computer. Today, Polkadot’s Relay Chain coordinates parachains and provides shared security. JAM goes further. It turns Polkadot into a general-purpose decentralized supercomputer where any service can plug in, not just parachains.

    Three numbers tell you how serious this is:

    • 43 independent teams are building competing JAM clients.
    • 10 million DOT is the prize pool for teams that hit full conformance with the Gray Paper specification.
    • 100% conformance was achieved by multiple clients by August 2025, per the JAM Gray Paper test suite.

    If JAM ships and works as advertised, Polkadot stops being a parachain platform and becomes infrastructure for general computation. That is the bull thesis in one sentence.

    If JAM slips or arrives with bugs, the narrative dies and DOT trades on tokenomics alone. That has not been a winning trade in 2026.

    The Bear Case Nobody Talks Enough About

    Every price prediction article has the bull case. Here is what the DOT bulls do not want on the front page.

    The Hyperbridge exploit. On April 13, 2026, an attacker minted 1 billion bridged DOT tokens on Ethereum in a single transaction. They used a vulnerability in the Hyperbridge gateway. The attacker sold the tokens for around $237,000 before the bridge paused. The protocol itself was unaffected, but the optics were ugly. Bridges are a recurring weak point for cross-chain ecosystems.

    ETF inflows are weak. The 21Shares TDOT ETF launched on Nasdaq on March 6, 2026. It started with $11 million in seed capital and a 0.30% management fee. By early April, total net inflows were just $544,480. For context, the Bitcoin spot ETFs took in over $1 billion in their first week. DOT institutional demand is real but small.

    Competition is brutal. Solana ships a major consensus upgrade. Avalanche has its own L1 framework. Cosmos has IBC. Polkadot’s “shared security for many chains” pitch is no longer unique in 2026. The technical case for parachains needs to be paired with usage, and parachain auctions have cooled.

    Price action is broken. A token sitting 97.8% below its all-time high and 71% below last year is not a momentum trade. It is a value bet that requires patience and conviction.

    For more context on how ETF inflows shape altcoin prices, you can check live ETF flow data on CoinGecko’s Polkadot page.

    Polkadot Price Predictions: Bear, Base, and Bull Targets

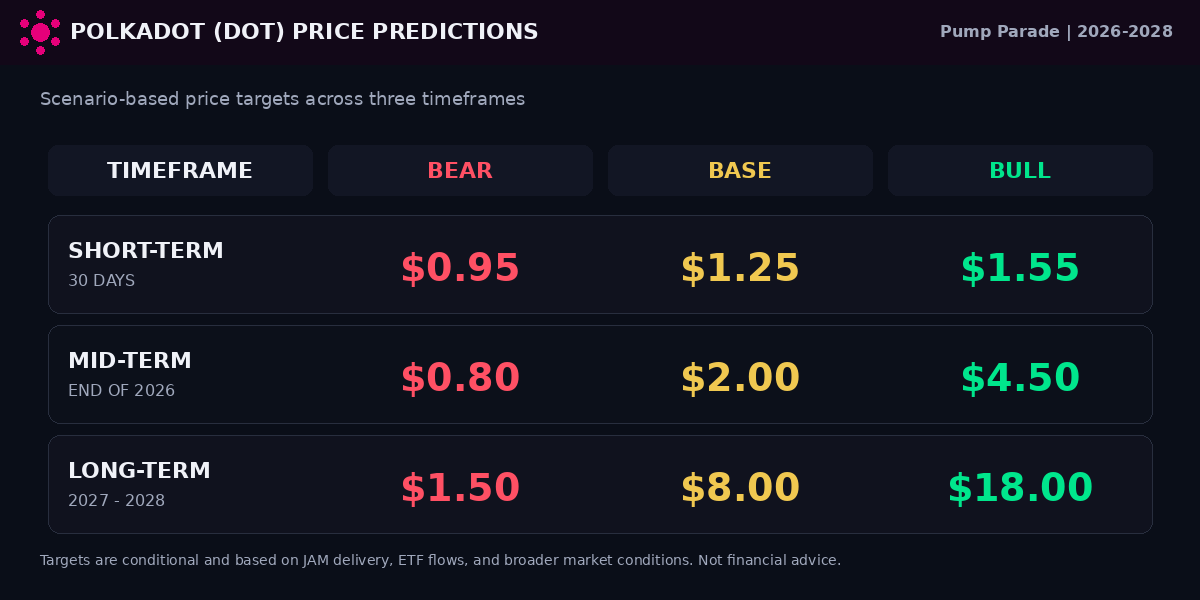
    Below is our scenario-based price model. These are not guarantees. They are conditional ranges based on what has to happen for each case to play out.
    Polkadot DOT price prediction table with bear base and bull targets

    Short-Term: Next 30 Days (June 2026)

    Bear: $0.95. DOT loses $1.15 support and drifts lower with the broader market. Volume stays weak.

    Base: $1.25. Price holds near current levels. A small bounce off the $1.15 floor brings DOT back to $1.30 resistance, but no breakout follows.

    Bull: $1.55. A JAM testnet milestone or fresh ETF inflows trigger a relief rally. DOT reclaims $1.50 and tests $1.60.

    The probability favors the base case. Most June seasonality in crypto has been weak historically, and DOT does not have a single hard catalyst confirmed for this month.

    Mid-Term: End of 2026

    Bear: $0.80. JAM is delayed past year-end. Another bridge or ETF setback rattles the market. DOT joins the long tail of large-cap altcoins that never recover.

    Base: $2.00. JAM mainnet ships on schedule. Hard cap narrative draws back some long-term buyers. TDOT ETF inflows pick up modestly. Market cap roughly doubles from here.

    Bull: $4.50. JAM ships and works. Developer activity rebounds. ETF inflows accelerate as institutional desks rotate from BTC and ETH into proof-of-stake alternatives. DOT trades like a credible Layer 1, not a leftover from the 2021 cycle.

    Long-Term: 2027 to 2028

    Bear: $1.50. JAM never finds product-market fit. DOT becomes a slow-bleed proof-of-stake asset with a fixed supply and shrinking mindshare. Holders earn staking yield but watch other chains take the spotlight.

    Base: $8.00. Polkadot establishes JAM as a real general-purpose compute layer. Real-world asset projects and AI agents start deploying on it. Supply cap kicks in as a meaningful scarcity story by 2028, with annual inflation falling toward 1%.

    Bull: $18.00. JAM becomes the settlement layer for a credible chunk of the on-chain economy. Spot DOT ETF inflows cross $1 billion. Market revaluates DOT against ETH on a developer-activity basis. DOT does not need to retake $54.98 to give holders a strong return from $1.17.

    The Setup Worth Watching

    Polkadot in June 2026 is one of the cleanest asymmetric setups in large-cap crypto, but it is not a layup. The token is cheap by any historical measure, the supply is now capped, and a major upgrade is in the build phase. The bull case has real ingredients.

    The bear case is just as honest. Bridge risk is real. ETF demand is muted. Competition is fierce. June seasonality is unfriendly.

    What a smart bet looks like: a small position sized to survive a 30% drawdown, with a thesis that hinges on JAM actually shipping. If JAM clears mainnet by year-end, the base case at $2.00 is in play. If JAM lands and the ETF picks up, the bull case opens up.

    This is not a trade for someone who needs to be right in a week. It is a setup worth monitoring through the second half of 2026.

    Disclaimer: This article is for informational and educational purposes only and should not be construed as financial, investment, or trading advice. Cryptocurrency markets are highly volatile, and past performance does not guarantee future results. The price predictions and analyses presented here are based on AI models, technical indicators, and available data at the time of writing, they are not guarantees. Always conduct your own research (DYOR) and consult with a qualified financial advisor before making any investment decisions. Pump Parade and its authors do not assume liability for financial losses incurred based on information provided in this article.
    Kaspa (KAS) Price Prediction 2026: Toccata Fork

    0

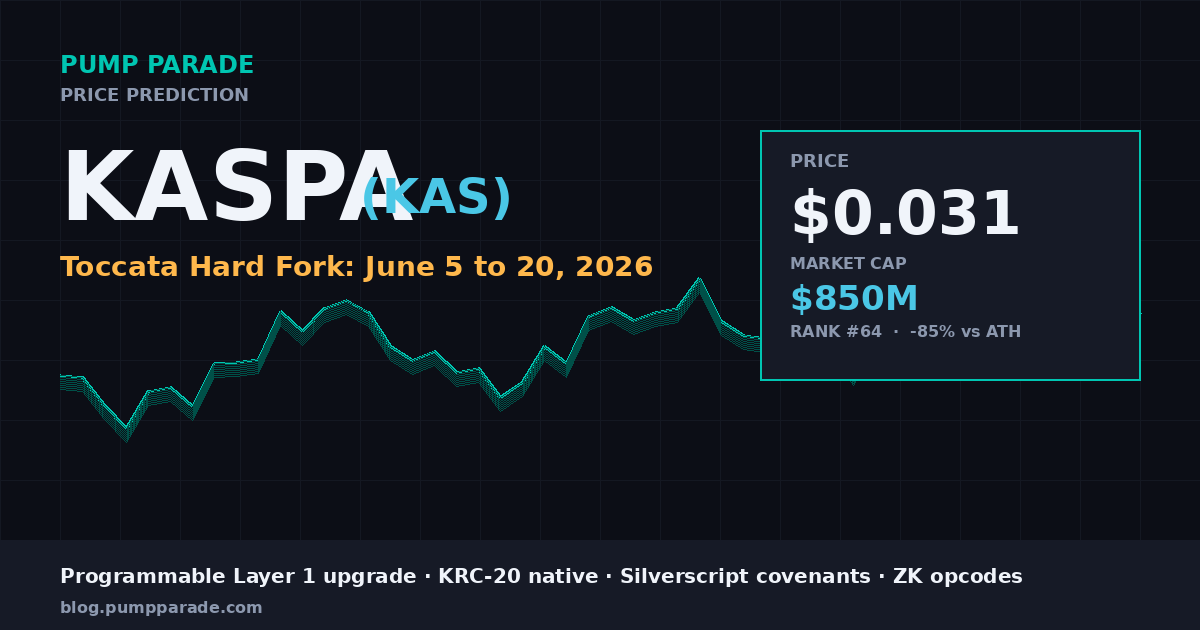
    Kaspa (KAS) is trading at $0.031 at the time of writing, with a market cap near $850 million and a CoinMarketCap rank of #64. That puts KAS roughly 85% below its August 2024 all-time high of $0.2076. The token has spent most of 2026 grinding sideways in a tight range while the rest of the Layer 1 sector chased catalysts.

    The grind is about to get tested. Kaspa’s Toccata hard fork goes live on mainnet in the June 5 to June 20, 2026 window. It is the most important upgrade in the network’s history. Toccata flips Kaspa from a pure proof-of-work payments chain into a programmable Layer 1. That means native KRC-20 tokens, covenant programming through the Silverscript compiler, and zero-knowledge verification at the base layer.

    This article breaks down what the upgrade actually changes, where the price could go, and the risk factors most analysts are glossing over.

    Kaspa KAS price prediction 2026 hero image showing current price and chart

    What Is Kaspa? A Quick Refresher

    Kaspa is a Layer 1 proof-of-work blockchain built on the GhostDAG protocol. Instead of orphaning competing blocks the way Bitcoin does, GhostDAG includes them in the ledger. The result is a chain that produces one block per second and confirms transactions in seconds, not minutes.

    Until now, Kaspa has been a one-trick chain. Fast payments. No smart contracts. No native tokens. No DeFi. That kept the use case narrow and the developer ecosystem small.

    A few key facts to set the stage:

    • Circulating supply: around 27.47 billion KAS, against a hard cap of roughly 28.7 billion
    • Emission status: over 95% of supply is already mined, with new issuance shrinking each month
    • Market cap: $850 million, ranked #64 on CoinMarketCap
    • 24-hour volume: $8 million to $28 million depending on the source
    • Consensus: proof-of-work, ASIC-mined, no premine, no insider allocation

    The supply story matters. Most Layer 1s still have huge unlocks ahead. Kaspa is on the other side of that curve.

    The Toccata Hard Fork: What Actually Changes

    Toccata is not a tweak. It is a full rewrite of what Kaspa can do at the base layer. The code freeze hit on April 15, 2026, and the final hardfork rehearsal is running on Testnet-10 right now. Mainnet activation is locked into the June 5 to June 20 window.

    Three changes drive the thesis:

    1. Native KRC-20 Tokens

    Today, KRC-20 tokens live as an inscription layer on top of Kaspa, similar to how BRC-20 sits on Bitcoin. After Toccata, KRC-20 becomes native to the protocol. That means cheaper minting, better wallet support, and the ability for tokens to interact with smart contract logic directly.

    2. Covenant Programming via Silverscript

    Silverscript is Kaspa’s new on-chain language. It is not a full virtual machine like the EVM. Instead, it adds covenants, which let developers attach spending rules to UTXOs. Translation: you can build vaults, escrows, conditional payments, and basic DeFi primitives without the overhead of a Solidity-style contract layer.

    3. Zero-Knowledge Verification Opcodes

    The upgrade adds base-layer opcodes for verifying zero-knowledge proofs. In plain terms, that opens the door to ZK rollups, privacy features, and verifiable off-chain computation. None of that ships day one, but the building blocks land with Toccata.

    Add it up and Kaspa is transforming from a payments rail into a programmable settlement layer with scarce supply. That is the bull thesis in one sentence.

    Current Technical Setup

    KAS is currently sitting inside a long-term falling wedge that started forming after the August 2024 high. Wedge breakouts tend to resolve in the direction of the prior trend, but they are unreliable until confirmed by volume.

    Key levels to watch:

    • Support: $0.028 to $0.030, the base KAS has been holding for the past six weeks
    • Resistance 1: $0.045, the top of the wedge and the 200-day moving average
    • Resistance 2: $0.065, the last major pivot before the 2024 peak
    • Invalidation: a daily close below $0.025 would break the structure and open a slide toward $0.018

    On-chain data leans constructive. Exchange netflows are negative (more KAS leaving exchanges than arriving), node count is rising, and the social engagement index is back near 2024 highs. None of that guarantees a move, but it stacks the order book for one.

    Bull Case: The Programmability Premium

    The bull thesis rests on three legs.

    First, supply scarcity meets new demand. Kaspa has roughly 1.2 billion KAS left to mine. New issuance keeps shrinking. If Toccata pulls in even a fraction of the DeFi capital that flowed into Sui or Aptos at launch, the float-to-demand math gets ugly fast for shorts.

    Second, the L1 narrative has rotation room. Bitcoin dominance is at 60% as of late May 2026, and the CMC Altcoin Season Index is at 39, on the edge of flipping. Capital looking for the next L1 story has limited options. Most of the obvious ones, like Solana, Sui, and Avalanche, are already heavily owned. Kaspa is under-owned by funds.

    Third, historical fork plays. Major L1 upgrades have a pattern. Ethereum’s Merge ran 60% in the four months before activation. Cardano’s Vasil ran 40%. Solana’s Firedancer testnet news drove a 35% move. None of those is a guarantee for KAS, but the playbook is well-worn.

    Bull case price targets:

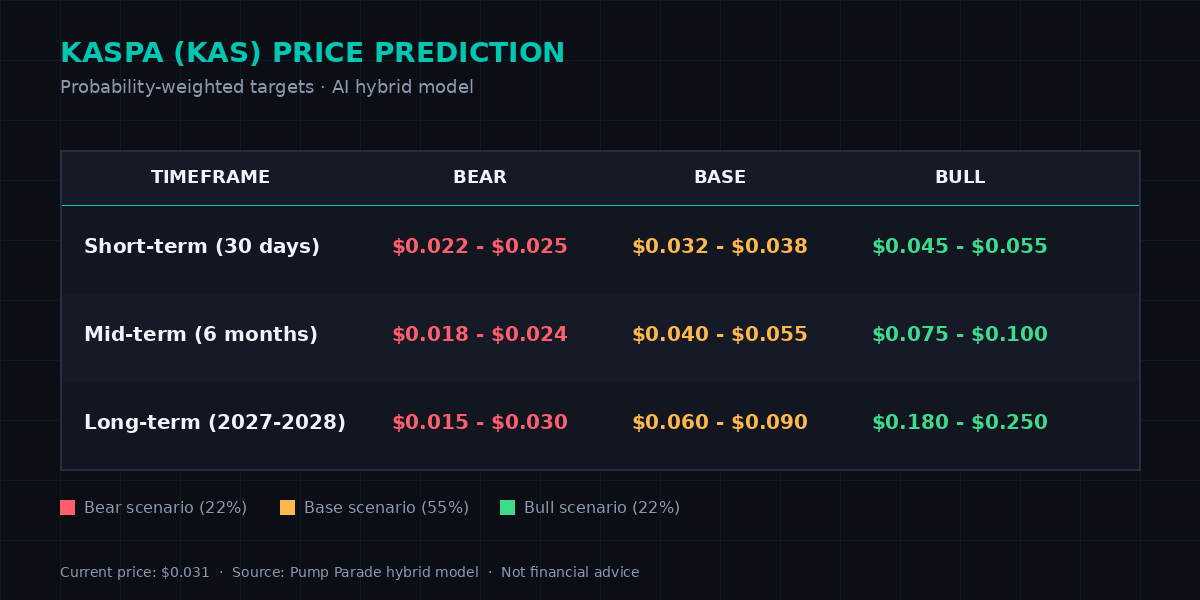
    • 30-day target: $0.045 to $0.055 if Toccata activates cleanly
    • 6-month target: $0.075 to $0.10 if KRC-20 launches see real volume
    • 2-year target: $0.18 to $0.25, a retest of the all-time high range

    Bear Case: The Risks Most Analysts Skip

    The bear case is real, and most price prediction articles wave it off. We will not.

    Risk 1: Hard fork execution. Toccata is the largest code change Kaspa has ever shipped. Hard forks fail. Sometimes they split the chain. Sometimes they ship with bugs that take weeks to patch. A delay past June 20 would gut the pre-event setup.

    Risk 2: No developers show up. Programmability is only valuable if builders use it. Kaspa does not have an EVM, which is a friction point for the existing Solidity developer base. Silverscript is new, untested, and has no killer app at launch. The chain could ship the upgrade and see nothing happen on top of it for months.

    Risk 3: PoW headwinds. Kaspa is mined by ASICs that consume serious power. The ESG narrative has come back into focus in 2026 as energy prices stay elevated. If a major regulator or exchange moves against PoW assets, KAS is in the blast zone.

    Risk 4: Macro risk-off. The current macro setup is fragile. Geopolitical tensions, persistent inflation, and a Bitcoin ETF outflow streak have weighed on risk assets all month. A broader risk-off move would not care about Toccata.

    Bear case price targets:

    • 30-day target: $0.022 to $0.025 if the fork slips or ships buggy
    • 6-month target: $0.018 to $0.024 if no developer traction emerges
    • 2-year target: $0.015 to $0.030, a slow bleed scenario

    AI Model Price Predictions

    Pulling the bull and bear cases together with our hybrid model, here is the consolidated forecast. These are probability-weighted ranges, not guarantees.

    Kaspa KAS price prediction targets short-term medium-term and long-term

    The model assigns the highest probability (around 55%) to the base case in each timeframe, with bear and bull tails roughly equal at 22% each. The remaining 1% is reserved for tail events like a fork failure or a black swan rally.

    For context on how a clean catalyst can move an L1, see our recent breakdown of the Stellar (XLM) DTCC catalyst, which followed a similar pre-event accumulation pattern.

    What to Watch in the Next 30 Days

    This is a catalyst trade. The thesis lives or dies on a short list of dates and levels.

    • June 5 to June 20: Toccata mainnet activation window. Any delay past June 20 is bearish.
    • Testnet-10 final rehearsal: Watch for any critical bugs. A clean rehearsal supports the bull setup.
    • $0.045 resistance: A weekly close above this level confirms the wedge breakout.
    • $0.025 support: A daily close below invalidates the bull case in the short term.
    • First KRC-20 native launches: The first 30 days of post-fork token activity will set the tone for the 6-month outlook.
    • Exchange listings: Watch for new spot listings on Coinbase or major Asian exchanges. KAS is not on Coinbase yet, and that is a known overhang.

    You can track current price and volume on the CoinGecko Kaspa page for live data during the fork window.

    The Bottom Line

    Kaspa is one of the cleanest catalyst setups in the Layer 1 sector right now. Supply is scarce, the fork is concrete, and positioning is light. That combination has driven big moves in other L1s.

    It is also one of the highest-risk setups. Hard forks fail. Developers may not show up. Macro may not cooperate. The honest answer is that KAS is a high-beta bet on a specific event, with a defined invalidation level and a wide range of outcomes.

    If you are watching this trade, the framework is simple. Track the testnet, watch the support and resistance levels above, and size your position to the bear case, not the bull case. The 30-day window through mid-June will tell you most of what you need to know.

    Disclaimer: This article is for informational and educational purposes only and should not be construed as financial, investment, or trading advice. Cryptocurrency markets are highly volatile, and past performance does not guarantee future results. The price predictions and analyses presented here are based on AI models, technical indicators, and available data at the time of writing, they are not guarantees. Always conduct your own research (DYOR) and consult with a qualified financial advisor before making any investment decisions. Pump Parade and its authors do not assume liability for financial losses incurred based on information provided in this article.
    Chainlink (LINK) Price Prediction 2026: CCIP Catalyst

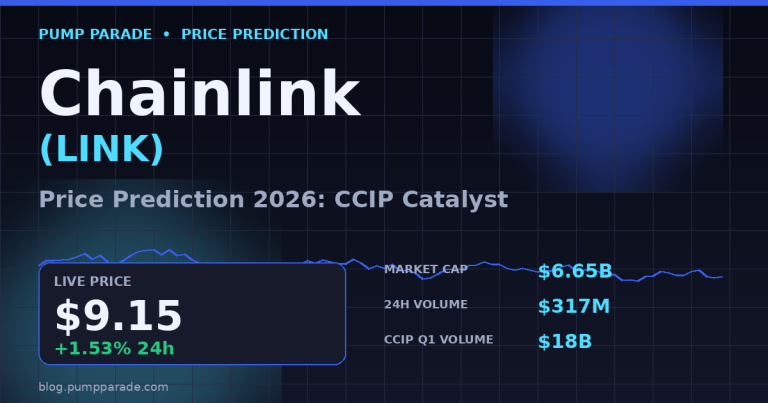
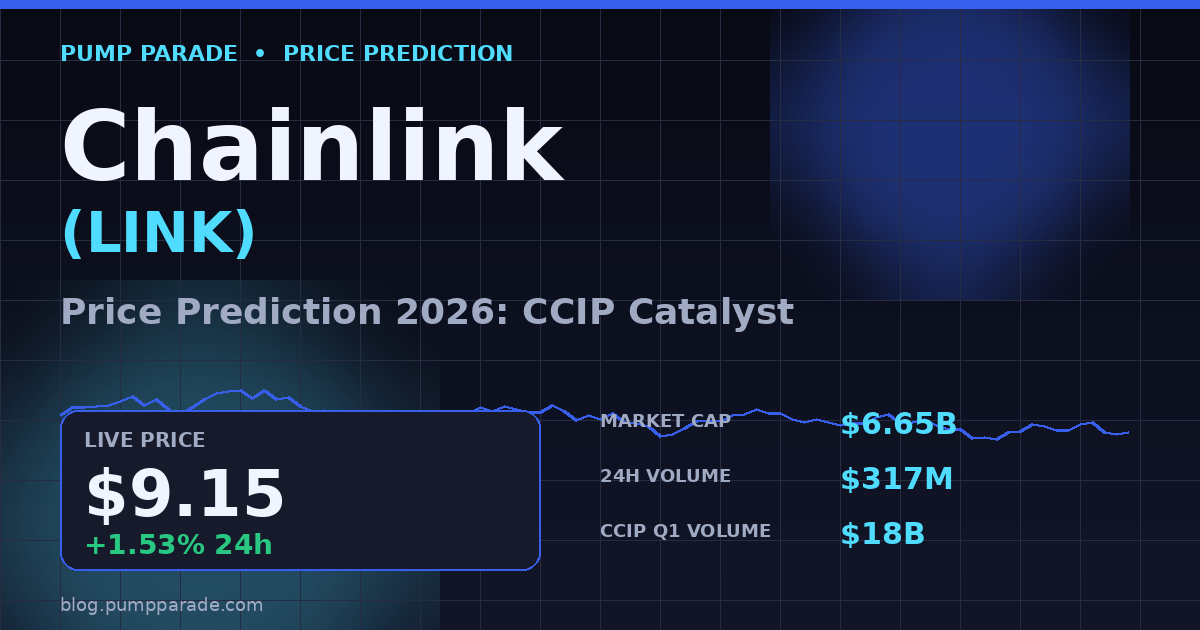
    Chainlink (LINK) trades around $9.15 today, up roughly 1.5% in the last 24 hours. The token’s market cap sits near $6.65 billion, with 24-hour volume of about $317 million. That puts LINK roughly 82% below its 2021 high of $52.88, but the on-chain story has changed.

    The numbers behind Chainlink are no longer just DeFi numbers. Its Cross-Chain Interoperability Protocol (CCIP) cleared $18 billion in Q1 2026 settlement volume, a 62% jump from the prior quarter. JPMorgan and UBS are running live pilots on it. Bitwise launched a spot LINK ETF in January. So the question is no longer “will Chainlink find users.” It is “will the price catch up to the throughput.”

    Chainlink LINK price prediction 2026 hero image showing $9.15 price and CCIP catalyst

    Where LINK Sits Today

    The chart tells a quiet story. LINK averaged near $9 through April and broke out to a local high of $10.78 in mid-May 2026 after the DTCC news cycle. It then pulled back into its $8 to $10 accumulation base, a zone it has tested repeatedly since the start of the year.

    That base is the key technical structure to watch. A weekly close above $10.50 with rising volume would mark a higher high. A weekly close under $8 would break the pattern and open the door to the $6.50 region.

    For now, the chart is balanced. Buyers defend $8.50. Sellers cap $10.50. The catalyst window decides the next move.

    The CCIP Story Is the Real Catalyst

    Most LINK price targets you read online still anchor to the 2021 DeFi narrative. That is the wrong frame for 2026. Here is what actually shifted under the surface.

    Institutional pilots are live, not theoretical

    JPMorgan and UBS are not running concept demos. Both banks are using CCIP for live cross-border settlement trials, with stated ambition to capture a slice of the $150 trillion SWIFT corridor. Even fractional capture matters here. If CCIP wins 0.5% of that flow, it routes $750 billion in annual volume through Chainlink infrastructure.

    That flow does not directly accrue to LINK holders one for one. But every cross-chain message and every data feed call burns oracle fees. Currently, CCIP fee revenue grew 213% quarter over quarter heading into Q2.

    The Bitwise ETF changed the buyer base

    The Bitwise Chainlink ETF (CLNK) began trading on NYSE Arca on January 14, 2026. CLNK debuted with a 0.34% expense ratio, waived on the first $500 million for three months. That structure was designed to attract advisor flows fast.

    Why this matters: spot ETFs route LINK exposure into 401(k) and IRA accounts. Those are sticky, rules-based buyers. They do not flip on a 10% pump. They drip in monthly. That smooths volatility and slowly absorbs sell-side liquidity.

    Real-world asset rails need oracles

    The RWA narrative cannot scale without trustworthy price feeds. ADI Foundation selected Chainlink to bridge $240 billion in institutional assets onto chain. SBI Group formalized a Chainlink partnership in Q1 2026. If you want to read more about why the RWA wave matters for token economics, our recent piece on Ondo’s RWA boom covers the demand side in detail.

    Staking is quietly soaking up supply

    LINK staking v0.2 has locked roughly 45 million tokens since launch, around 7% of circulating supply. Stakers earn fees from the protocol’s data delivery network. Translation: every new CCIP integration and every new RWA feed makes staked LINK slightly more attractive. That is a quiet supply sink, not a flashy one, but supply sinks compound.

    What Could Go Wrong

    Pump Parade always takes the bear case seriously. With LINK, the risks are real.

    Concentration risk. A handful of large banks dominate CCIP pilot activity. If JPMorgan or UBS scale back, narrative momentum stalls.

    Fee compression. Competing oracle networks (Pyth, RedStone, Chronicle) are pricing aggressively for cross-chain messaging. Chainlink may have to cut fees to keep market share, which would slow the fee growth story.

    ETF demand has been modest. CLNK’s market cap sits near $19 million as of late April 2026. That is not weak relative to other altcoin ETFs, but it is not a flood either. The flow story needs more time to compound.

    Macro overhang. If Bitcoin breaks below $60,000, altcoins typically lose 30 to 50% in sympathy. LINK is no exception.

    Technical Outlook

    Here is what the indicators say right now.

    The daily RSI sits near 48, neutral with a slight downward drift. The 50-day moving average is curling up toward $9.40, which has acted as soft resistance for the past two weeks. The 200-day moving average sits at $11.20 and is sloping flat. That gap between the 50-day and the 200-day defines the local trend: not breakout, not breakdown.

    The MACD on the weekly is close to a bullish crossover. If volume confirms over the next two to three weekly closes, that opens a path toward retesting the $13 to $14 resistance shelf last seen in early 2025.

    Price Predictions by Timeframe

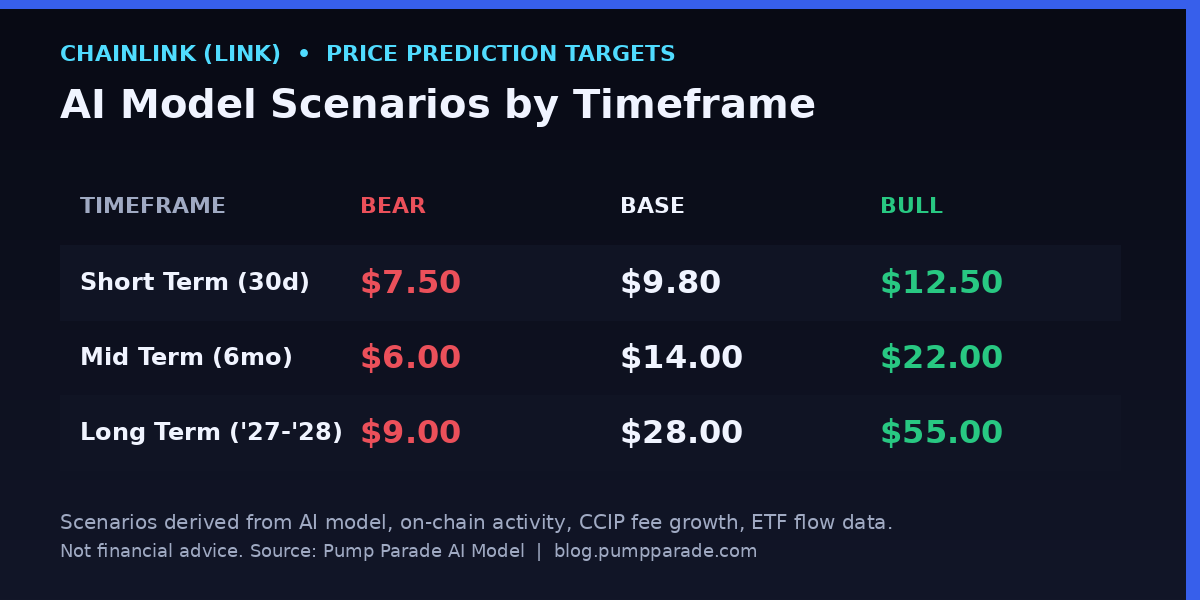
    Chainlink LINK price prediction table showing short, mid, and long term targets

    Our AI model blends on-chain activity, CCIP fee growth, ETF flow data, and broader Layer 1 sentiment. Here is what it gives us right now. Treat these as scenarios, not targets.

    Short term (next 30 days)

    • Bear: $7.50 (loss of $8 base, retest of mid-2025 lows)
    • Base: $9.80 (drift inside the current range)
    • Bull: $12.50 (weekly breakout above $10.50 with CCIP v1.5 news)

    Mid term (6 months, end of 2026)

    • Bear: $6.00 (macro risk-off, oracle competition bites)
    • Base: $14.00 (CCIP v1.5 ships, modest ETF inflows continue)
    • Bull: $22.00 (one major bank announces production CCIP rollout)

    Long term (2027 to 2028)

    • Bear: $9.00 (Chainlink stays relevant but loses share)
    • Base: $28.00 (CCIP captures meaningful SWIFT volume, RWA flows scale)
    • Bull: $55.00 (LINK retakes its prior high as oracle layer becomes default for tokenized assets)

    The bull case for 2027 to 2028 is not a meme. It rests on two assumptions: that CCIP becomes the default rail for cross-chain settlement, and that the RWA market grows to the $5 trillion zone analysts expect by 2030. Neither is guaranteed.

    The Bottom Line

    Chainlink is one of the few crypto assets where the institutional story is no longer speculative. The pilots are live. The ETF is trading. The fees are growing. The asset is also boring relative to memecoins, which is precisely why it gets underestimated in pump cycles.

    At $9.15, LINK is not a screaming buy. It is a setup worth monitoring. The next two weekly closes will tell you whether the $10.50 ceiling breaks or holds. If you are sizing exposure, scale in. Do not chase.

    The data favors a higher base over the next 12 months. The catalysts favor a higher one over the next 24. Just remember that crypto markets can ignore fundamentals for longer than your conviction lasts.

    Disclaimer: This article is for informational and educational purposes only and should not be construed as financial, investment, or trading advice. Cryptocurrency markets are highly volatile, and past performance does not guarantee future results. The price predictions and analyses presented here are based on AI models, technical indicators, and available data at the time of writing, they are not guarantees. Always conduct your own research (DYOR) and consult with a qualified financial advisor before making any investment decisions. Pump Parade and its authors do not assume liability for financial losses incurred based on information provided in this article.
    Stellar (XLM) Price Prediction 2026: DTCC Catalyst

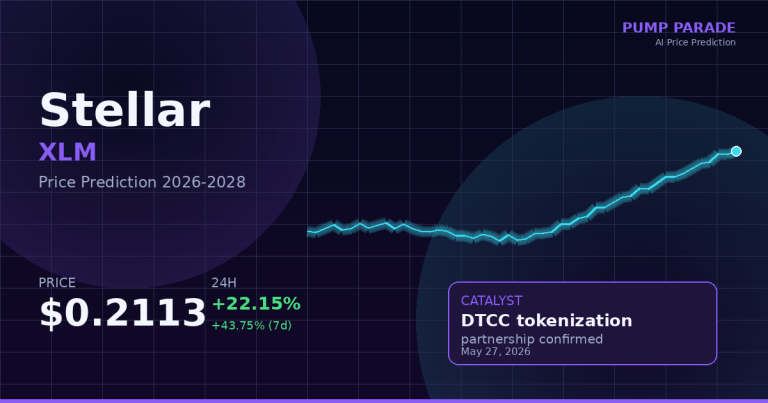
    Stellar (XLM) is having a moment. The token trades at $0.2113 at time of writing, up 22% in the last 24 hours and +43% over the past 7 days, while most of the crypto market is bleeding. The catalyst: on May 27, the Depository Trust & Clearing Corporation (DTCC) named Stellar as the first public blockchain in its new multi-chain tokenization push.

    That is the entity that processes $2.5 quadrillion in securities transactions a year. It is now wiring a piece of that plumbing into a public chain that most retail investors had written off as boring. The market noticed. The question is whether the move has legs or whether XLM is about to give it all back. Let’s break down the data.

    Stellar XLM price prediction 2026 chart showing DTCC catalyst rally

    What just happened to Stellar (XLM)?

    Two things are pushing XLM right now, and only one of them is hype.

    The first is structural. DTCC, through its subsidiary The Depository Trust Company (DTC), said it will connect its tokenized securities platform to the Stellar public network. The roadmap is concrete: limited production trades in July 2026, broader service launch in October 2026, and live DTC-custodied assets on Stellar in the first half of 2027. Initial scope includes Russell 1000 stocks, major ETFs, and U.S. Treasury securities.

    The second is technical. XLM had been ranging between $0.16 and $0.18 for most of May. The DTCC announcement hit and the token broke out on volume, printing a 24-hour high of $0.2205 against a low of $0.1730. 24-hour trading volume jumped to $2.03 billion, more than triple the recent average. On-chain wallets holding more than 1 million XLM also rose into the breakout, which suggests this is not just retail chasing a green candle.

    Here’s the thing: XLM still sits 75.9% below its January 2018 all-time high of $0.875. It is also down 26% over the past year. So the breakout is real, but XLM is rallying from a depressed base, not a peak. That matters for how we think about upside.

    Stellar token overview: the basics

    Stellar is a layer-1 blockchain built for cross-border payments and asset issuance. It launched in 2014 as a fork of Ripple, with the Stellar Development Foundation (SDF) running the open-source protocol. The chain settles in 3-5 seconds, charges fractions of a cent per transaction, and uses a federated Byzantine agreement consensus instead of proof-of-work.

    Key metrics at time of writing:

    • Price: $0.2113
    • Market cap: $7.06 billion (rank #17)
    • 24h volume: $2.03 billion
    • Fully diluted valuation: $10.5 billion
    • Circulating supply: 33.6 billion XLM
    • Total supply: 50 billion XLM (no inflation since 2019)

    Stellar’s pitch has always been the same: be the rails for moving value, not the casino for trading it. For years, that pitch felt out of step with where crypto attention went. The DTCC deal is the first time that pitch has lined up with a major institutional commitment in 2026.

    Technical analysis: where is XLM right now?

    Let’s look at the chart in plain terms.

    The breakout above $0.18 cleared a level that had held as resistance since early April. That level now flips to support. The next significant resistance sits at $0.25, which corresponds to the August 2025 high. Above that, the chart is fairly open until $0.35, where heavy distribution occurred in late 2024.

    The 14-day Relative Strength Index (RSI), a momentum indicator that ranges from 0 to 100, is now reading around 78. That is technically overbought. In most assets, overbought means a near-term cooldown is likely. In a high-conviction breakout, overbought can stay overbought for days or weeks. The pattern that matters more is whether XLM holds above $0.18 on the first pullback.

    The MACD (a trend-following momentum indicator) flipped bullish on May 24 and the histogram is expanding, which signals momentum is still building rather than fading.

    Our hybrid AI model assigns a 62% probability that XLM holds above $0.18 over the next 14 days, and a 38% probability of a sharp retest of the $0.16 range if Bitcoin breaks below $70K.

    The bull case for XLM

    The bull case writes itself, but it needs to be written carefully.

    DTCC’s multi-chain strategy is not a press release. It is a phased rollout with a known counterparty and a known timeline. If even a small slice of Russell 1000 settlement migrates to Stellar in 2027, the network captures fee revenue and validator activity at a scale that current XLM holders are not pricing in. Tokenized U.S. Treasuries alone are a $7+ billion market today, growing at roughly 60% year-over-year according to RWA.xyz.

    This is also where Stellar separates from the broader real-world asset (RWA) narrative. Most RWA exposure today happens through tokens like ONDO, which represent ownership of tokenized funds. Stellar’s pitch is one layer deeper: it wants to be the settlement chain that those tokens run on. For a deeper look at how the RWA narrative has played out for the asset-level tokens, see our Ondo (ONDO) price prediction.

    Second, Stellar has clean tokenomics. There is no inflation. The supply was set at 50 billion in 2019 after the SDF burned 55 billion XLM, and 33.6 billion is in circulation. That means the FDV-to-market-cap ratio is 1.49, which is friendlier to long-term holders than many newer L1 tokens with steep emission curves.

    Third, the breakout came on rising volume and decoupled from BTC. When XLM rallies hard on a day Bitcoin is down 3%, that is not retail FOMO. That is a re-rating of the asset.

    If the bull thesis plays out, XLM has room to reclaim the $0.35-$0.45 zone in the second half of 2026, with $0.55-$0.70 in play if the DTCC integration ships on time in 2027.

    The bear case for XLM

    Now the other side, because this is where most price prediction articles cheat the reader.

    Risk number one: the DTCC timeline is long. October 2026 is the broader launch. Full DTC-asset availability is first half of 2027. That is at least 8 months of waiting, and crypto rarely rewards patience without follow-on catalysts. If summer 2026 turns into a chop fest with no new headlines, the breakout traders rotate out.

    Risk number two: Stellar does not capture fees the way an L1 like Ethereum does. Per-transaction fees are minuscule by design. The bull case relies on volume making up for fee size. If DTCC integration produces low transaction counts at first (which is likely for a pilot), XLM holders may not see the on-chain revenue story they are expecting.

    Risk number three: macro. Bitcoin is at $73.6K, down 4.7% on the week. If BTC breaks $70K and the broader market enters a deeper correction, XLM gives back the move regardless of fundamentals. We saw exactly this dynamic in Q2 2024.

    Risk number four: competition. Stellar is not the only chain pitching itself to traditional finance. Avalanche, Polygon, and Hedera all have institutional partnerships in flight. DTCC explicitly called this a multi-chain strategy. Stellar is first, not exclusive.

    If the bear case plays out, a retest of $0.15-$0.16 is on the table by Q3 2026, with downside to $0.12 if BTC enters a real bear leg.

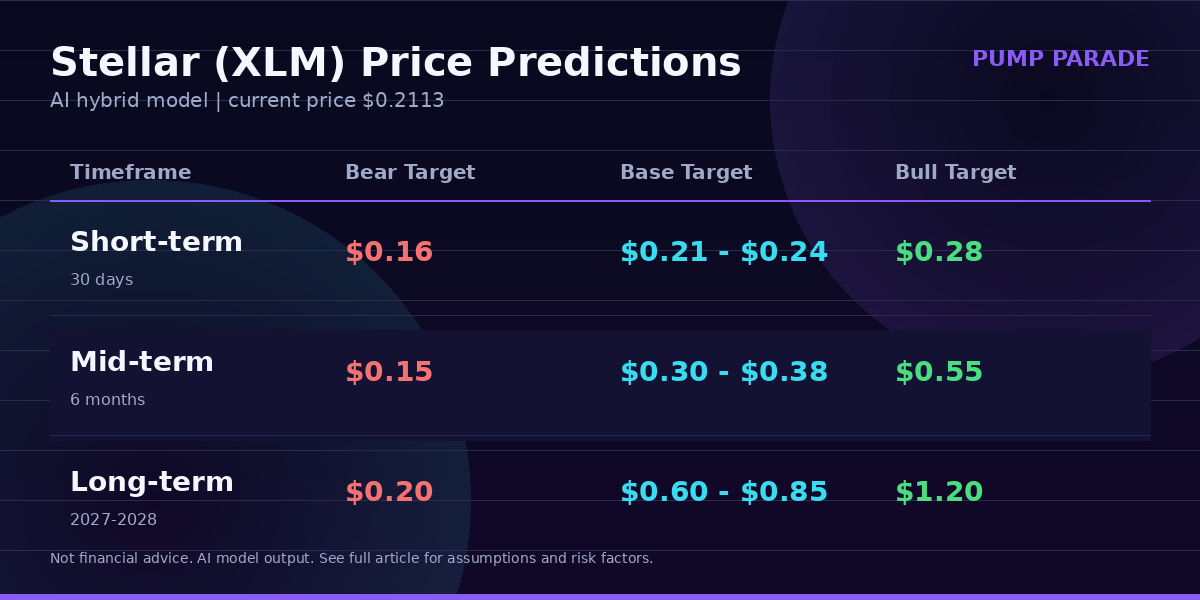
    XLM AI price prediction: short, mid, and long-term

    Here is what our hybrid AI model is signaling across timeframes, with current price as the baseline ($0.2113).

    Stellar XLM price prediction targets table: short, mid, and long-term bear, base, and bull cases

    Short-term (30 days)

    • Bear case: $0.16
    • Base case: $0.21 to $0.24
    • Bull case: $0.28

    The 30-day window is mostly about whether the breakout holds. Watch the $0.18 level. A clean defense of that zone on the first pullback is the strongest near-term signal.

    Mid-term (6 months, end of 2026)

    • Bear case: $0.15
    • Base case: $0.30 to $0.38
    • Bull case: $0.55

    This window captures the October 2026 DTCC service launch. If the launch ships on time with credible volume, base case is reachable. Bull case requires Bitcoin to be in a clear uptrend and at least one additional institutional partnership for Stellar.

    Long-term (2027-2028)

    • Bear case: $0.20
    • Base case: $0.60 to $0.85
    • Bull case: $1.20

    The long-term case is fully dependent on DTCC’s tokenization rollout succeeding at scale. The base case puts XLM near its 2018 all-time high. The bull case requires Stellar to capture meaningful share of tokenized securities settlement, plus a constructive macro backdrop. None of this is guaranteed.

    What to watch over the next 90 days

    If you are tracking XLM, here are the data points that actually matter.

    • July 2026 pilot trades: The first DTCC limited production trades on Stellar. Look for volume disclosures and any named issuers.
    • October 2026 service launch: Broader DTCC service goes live. Watch for transaction counts and the asset mix.
    • $0.18 support: The breakout level. If XLM closes below it on a daily candle, the technical setup weakens.
    • SDF announcements: Any follow-on partnership with a major bank, asset manager, or stablecoin issuer.
    • BTC behavior: Stellar can decouple on news days, but a true BTC bear leg drags everything down. $70K on Bitcoin is the level to watch.

    The bottom line

    XLM is in a real catalyst-driven move, not a meme pump. The DTCC partnership is a credible, dated, institutional commitment with a clear path to production. That said, the rally has already done a lot of work in a short window, the long-term thesis depends on rollouts that are 8 to 14 months out, and a macro reversal would override the fundamentals fast.

    A reasonable framing: this is one of the more substantiated bull cases in the current market for a top-25 token. It is also one where time risk is the dominant variable. The probability favors XLM as a setup worth monitoring, with sizing and entries that respect the chance of a sharp pullback before the next leg.

    Disclaimer: This article is for informational and educational purposes only and should not be construed as financial, investment, or trading advice. Cryptocurrency markets are highly volatile, and past performance does not guarantee future results. The price predictions and analyses presented here are based on AI models, technical indicators, and available data at the time of writing, and they are not guarantees. Always conduct your own research (DYOR) and consult with a qualified financial advisor before making any investment decisions. Pump Parade and its authors do not assume liability for financial losses incurred based on information provided in this article.
    Binance vs Coinbase: Best Crypto Exchange 2026

    0

    Two giants. Two very different bets on what a crypto exchange should be. Binance grew up offshore, optimizing for global reach, deep order books, and razor-thin trading fees. Coinbase grew up in San Francisco, optimizing for U.S. regulators, listed equities, and the kind of compliance story that institutions actually trust. In 2026, both still dominate, but they dominate in different worlds.

    So which one should you actually use? That depends on where you live, how often you trade, and how much you care about cheap fees versus regulatory comfort. We pulled the latest CoinGecko numbers, dug through official fee schedules, and compared every meaningful feature side by side. Here is the full breakdown.

    TL;DR — The Quick Verdict

    If you trade often, want the lowest fees, and live outside the United States, Binance is almost always the cheaper, more feature-rich choice. Spot maker and taker fees start at 0.10%, drop further with BNB, and the platform supports hundreds more tokens, advanced derivatives, copy trading, and a deep ecosystem of bots and APIs.

    If you are based in the United States, value strong consumer protections, or want a publicly listed company custodying your assets, Coinbase is the safer, more regulated pick. Fees are higher on the simple app, but Coinbase Advanced Trade brings them down to 0.40% maker and 0.60% taker, and the company is a SEC-registered public entity listed on NASDAQ as COIN.

    Short version: Binance wins on cost and selection, Coinbase wins on trust and U.S. access. Most active traders end up using both for different things.

    Binance vs Coinbase logos side by side with a VS badge

    Binance and Coinbase: Quick Snapshots

    Binance

    Binance official logo

    Founded in 2017 by Changpeng Zhao, Binance grew from a scrappy Shanghai startup into the largest crypto exchange in the world by daily volume. According to CoinGecko data, Binance currently processes roughly 143,000 BTC of spot volume per 24 hours, or about $10.5 billion in dollar terms at current prices. It supports more than 350 listed coins and offers spot, margin, futures, options, copy trading, launchpad, savings, and an in-house Layer 1 chain (BNB Chain).

    Binance is incorporated in the Cayman Islands and operates a separate, more restricted entity in the U.S. called Binance.US. CoinGecko gives the main Binance exchange a 10 of 10 Trust Score and ranks it #2 globally for reliability and liquidity metrics.

    Coinbase

    Coinbase official logo

    Founded in 2012 by Brian Armstrong and Fred Ehrsam, Coinbase is the largest U.S.-headquartered crypto exchange and became a public company in 2021 (NASDAQ: COIN). CoinGecko tracks roughly 24,800 BTC of daily spot volume on Coinbase Exchange (about $1.8 billion), and ranks it #1 globally on Trust Score with a 10 of 10 rating.

    Coinbase offers a beginner-friendly retail app, the more advanced Coinbase Advanced platform (formerly Coinbase Pro), Coinbase Wallet for self-custody, an institutional desk (Coinbase Prime), staking, and Base, its own Ethereum Layer 2. It is one of the most heavily audited and compliance-focused exchanges in the world, with full SEC reporting obligations as a listed company.

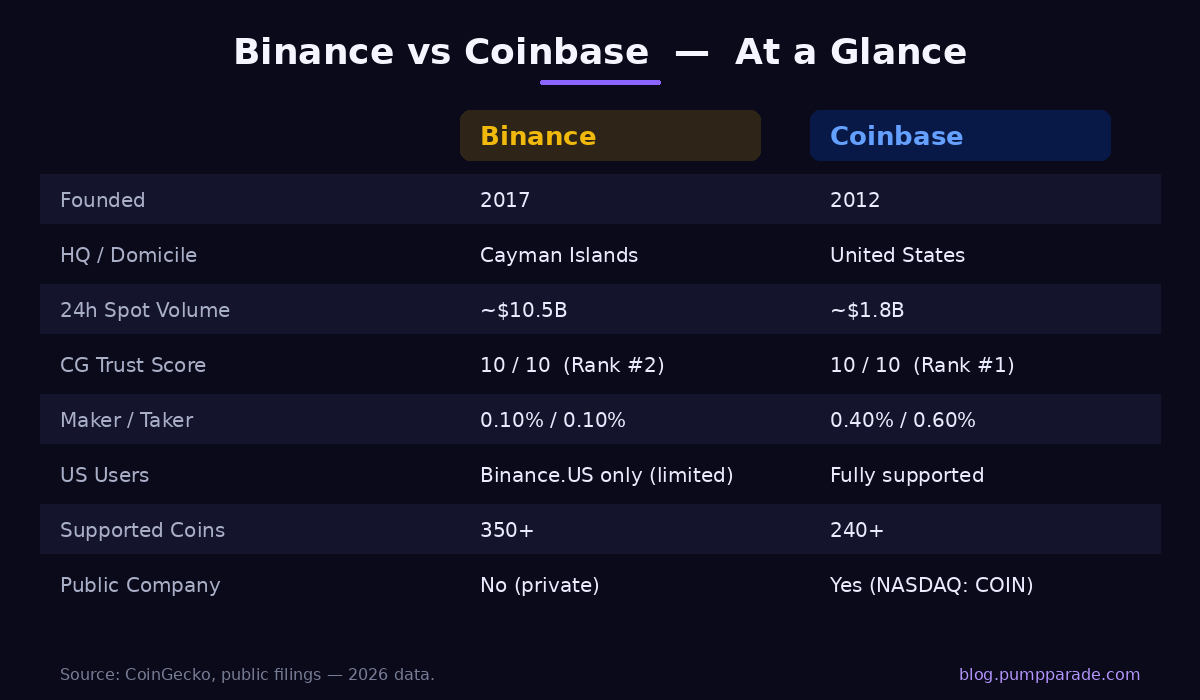
    Binance vs Coinbase: At a Glance

    Binance vs Coinbase comparison table showing fees, volume, supported coins, and regulatory status

    Fees: The Single Biggest Difference

    For most active traders, fees are the deciding factor, and this is where the gap between the two exchanges is widest.

    Binance fees

    Binance uses a standard maker / taker model with VIP tiers based on 30-day volume and BNB holdings:

    • Regular spot users start at 0.10% maker and 0.10% taker.
    • Paying fees in BNB gets you a 25% discount, dropping the effective rate to around 0.075%.
    • USDC trading pairs have zero fees on many markets.
    • VIP 9 tier (institutional volume) goes down to roughly 0.012% maker / 0.024% taker on spot.
    • Futures fees start at 0.020% maker / 0.040% taker.

    Binance also offers a free internal transfer system between its sub-accounts, and stablecoin deposits via networks like TRC-20, BSC, and Polygon are free or near-free.

    Coinbase fees

    Coinbase has two fee tracks, and which one you see matters a lot:

    • Coinbase (simple app): a spread plus a flat fee or percentage that often works out to 1.5% to 2.5% per trade for small amounts. This is the version that retail users see by default.
    • Coinbase Advanced: starts at 0.40% maker and 0.60% taker, with volume-based discounts down to 0.00% maker / 0.05% taker at the highest tier.
    • Deposits via wire or ACH (U.S.) are free, but stablecoin off-ramps and certain instant withdrawals can carry meaningful fees.

    The takeaway: on a typical $1,000 trade, you might pay $1 on Binance versus $4 to $25 on Coinbase, depending on whether you use the simple or Advanced interface. For active traders, that gap compounds fast.

    Supported Coins, Pairs, and Products

    Binance lists significantly more assets than Coinbase. Binance currently supports 350+ tradable coins and over 1,400 spot pairs, including most major altcoins, meme tokens, and freshly launched assets via its Launchpool and Launchpad programs. It also offers:

    • Spot, margin (up to 10x), and isolated margin trading.
    • USDT-margined and coin-margined perpetual futures, plus quarterly futures.
    • Options, copy trading, dual investment, and structured products.
    • Earn products including flexible savings, locked staking, dual-asset yield, and DeFi-style vaults.

    Coinbase lists roughly 240+ coins. The selection is narrower because Coinbase reviews assets through a stricter legal lens, especially after the 2023 SEC litigation that pushed it to delist or pause certain tokens. Coinbase Advanced offers spot trading, perpetual futures on the international entity (Coinbase International Exchange), staking on select PoS chains, and a small set of structured products. There is no margin trading on the U.S. spot product, and derivatives access is mostly geofenced.

    Security, Audits, and Trust

    Both exchanges score 10 of 10 on CoinGecko's Trust Score and rank in the top two globally. But the underlying stories are very different.

    Binance security

    Binance maintains the Secure Asset Fund for Users (SAFU), a $1 billion+ self-insurance pool that reimbursed users after the 2019 hack. The exchange publishes Merkle-tree proof-of-reserves reports for major assets (BTC, ETH, USDT, USDC, BNB) and supports two-factor authentication, withdrawal whitelisting, and hardware key support. CZ stepped down as CEO in late 2023 as part of the $4.3 billion U.S. settlement with the DOJ and FinCEN, and Richard Teng now runs the company under a court-supervised compliance monitor.

    Coinbase security

    Coinbase has never been hacked at the protocol level since its founding in 2012, an unusually long clean record in this industry. As a U.S. public company, it files quarterly 10-Q reports, undergoes annual financial audits by Deloitte, and provides FDIC pass-through insurance on USD balances up to $250,000 per user (held at partner banks). About 98% of customer crypto is held in geographically distributed offline cold storage, with the remaining hot wallet portion covered by a commercial crime insurance policy.

    For most non-U.S. users, the practical security difference is small. For U.S. users worried about regulatory enforcement actions, Coinbase's public-company status is a real advantage.

    User Experience and Mobile

    Coinbase has the smoother onboarding by a clear margin. The retail app is one of the most polished products in crypto: ID verification typically completes in minutes, the interface explains every action in plain English, and you can buy Bitcoin in three taps. This is one reason Coinbase remains the default on-ramp for first-time U.S. buyers.

    Binance's app is more powerful but also more cluttered. The home screen shows charts, futures funding rates, copy-trading leaderboards, and a dozen earn products simultaneously. Power users love it; newcomers can find it overwhelming. The Binance Lite mode helps, but the default mode assumes you already know what perp funding is.

    If your priority is "buy some BTC, see the price, sleep," Coinbase wins. If your priority is "route a complex trade across spot, futures, and an earn product," Binance wins.

    Regional Access and Regulation

    This is one place the two exchanges are not really comparable.

    Coinbase is available in over 100 countries and is fully licensed and operational in all 50 U.S. states (where local law allows). It holds money transmitter licenses, a BitLicense in New York, and an EU MiCA license through its Irish subsidiary.

    Binance's global entity is not available to U.S. residents. U.S. users have to use Binance.US, which has a much smaller selection of coins (around 100), no futures, and lower liquidity. Binance has also exited or restricted service in several jurisdictions, including the Netherlands, Canada (Ontario), and the UK retail market, and operates under specific regulatory regimes in places like France, Italy, Spain, and the UAE.

    For more on how regulatory shifts are reshaping the exchange landscape, see our piece on recent crypto regulation news.

    Staking, Earn, and Passive Income

    Both exchanges offer staking on Ethereum and several PoS networks, but with very different mechanics.

    Coinbase's staking is straightforward and conservative: you stake ETH, SOL, ADA, MATIC, ATOM, and a handful of others, Coinbase takes a 25% to 35% commission on the rewards, and you get the rest with no lockup tricks beyond protocol-level unbonding. The compliance perimeter is tight, but the yields are honest.

    Binance Earn is much broader: flexible savings on dozens of assets, locked products with higher APYs, dual investment (which has option-like payoffs), DeFi staking integrations, and Launchpool, where you stake BNB or stablecoins to earn newly listed tokens. The yields are often substantially higher, but the products are also more complex. Read the terms before parking serious size.

    Pros and Cons

    Binance Pros

    • Lowest spot fees among major exchanges (0.10% base, lower with BNB).
    • Massive coin selection (350+) and the deepest liquidity in the industry.
    • Full suite of derivatives, copy trading, and earn products.
    • Best-in-class API for bots, traders, and quant strategies.

    Binance Cons

    • Not available to U.S. users; Binance.US is a watered-down alternative.
    • UI can overwhelm new users.
    • Past regulatory issues (2023 DOJ settlement) still color institutional perception.
    • Customer support response times are inconsistent.

    Coinbase Pros

    • Most trusted brand for U.S. and institutional users; publicly listed company.
    • Cleanest UX for beginners and one of the smoothest fiat on-ramps.
    • Strong security track record with insured cold storage.
    • Tight regulatory standing, including MiCA license in the EU.

    Coinbase Cons

    • Simple-app fees are extremely high (often 1.5% to 2.5%).
    • Smaller coin selection and stricter listing process.
    • Limited derivatives access for retail users.
    • Staking rewards are reduced by a 25% to 35% commission.

    Verdict: Which One Should You Use?

    Choose Binance if you live outside the United States, you trade more than once a week, you want access to the broadest coin selection and derivatives, or you want to use API trading or copy trading. The fee savings alone justify it for anyone running real volume.

    Choose Coinbase if you live in the United States, you are new to crypto, you value the security of a publicly listed and audited company, or you want a clean fiat on-ramp without learning order types. Just remember to use Coinbase Advanced rather than the simple app to avoid the higher fees.

    Use both if you are a power user. Many active traders buy USDC on Coinbase with a free wire deposit, withdraw it to Binance for cheap trading, and bring profits back through Coinbase for cleaner tax reporting. It is more work, but it gives you the best of both worlds.

    For more reviews like this, check out our Bybit vs OKX comparison covering the next tier of CEXs, or our Phantom vs Backpack wallet breakdown if you also need a self-custody option for your withdrawals.

    FAQ

    Is Binance available in the United States?

    The main Binance global exchange is not available to U.S. residents. U.S. users can access Binance.US, a separate entity with around 100 listed coins, lower liquidity, and no futures or margin trading.

    Which is cheaper, Binance or Coinbase?

    Binance is significantly cheaper. Standard Binance spot fees are 0.10% maker and taker (lower with BNB), while Coinbase Advanced starts at 0.40% maker and 0.60% taker. The simple Coinbase app charges 1.5% to 2.5% per trade.

    Is Coinbase safer than Binance?

    Both score 10 of 10 on CoinGecko Trust Score. Coinbase has a stronger regulatory profile as a SEC-registered public company with annual Deloitte audits, while Binance maintains a $1 billion+ SAFU insurance fund and publishes proof-of-reserves. For U.S. users, Coinbase's compliance story is generally seen as a meaningful advantage.

    Can I use both Binance and Coinbase?

    Yes, and many active traders do. A common workflow is to deposit USD on Coinbase via free wire transfer, convert to USDC, withdraw to Binance for cheaper trading, then send profits back to Coinbase for off-ramping and tax reporting.

    Does Binance or Coinbase offer better staking yields?

    Binance Earn generally offers higher yields across more assets, but with more product complexity. Coinbase staking yields are more conservative and predictable, with a 25% to 35% commission taken from rewards. For a strictly passive U.S. user, Coinbase is simpler; for yield hunters, Binance is more competitive.

    This article is for informational purposes only and is not financial advice. Always do your own research before depositing funds on any exchange.

    Cardano (ADA) Price Prediction 2026: ETF Window

    0

    Cardano (ADA) is trading at $0.23 at the time of writing. The token is down 7% on the week, down 6% on the month, and sitting more than 92% below its 2021 all-time high of $3.09. On paper, it looks like a sleepy mid-cap. The setup tells a different story.

    But three catalysts converge between now and year-end. A spot ADA ETF decision window opens August 9. The public Leios testnet ships in June. The Midnight privacy sidechain is already live on its Kūkolu mainnet phase. The chart says exhaustion. The fundamentals say something is loading.

    Let’s break down what the data shows, what could go right, what could go wrong, and where our AI model sees ADA by 2028.

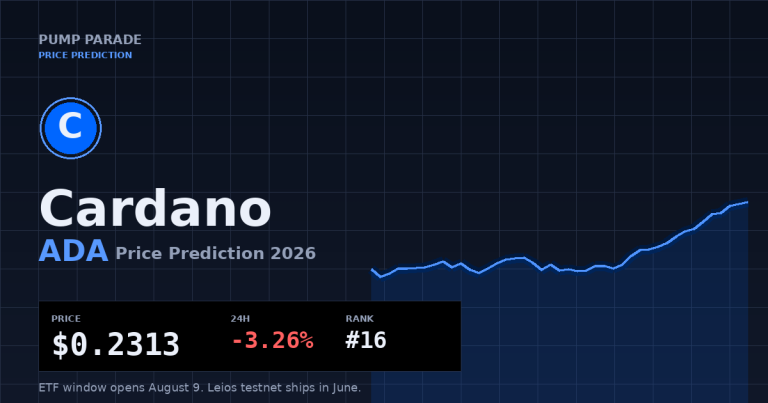
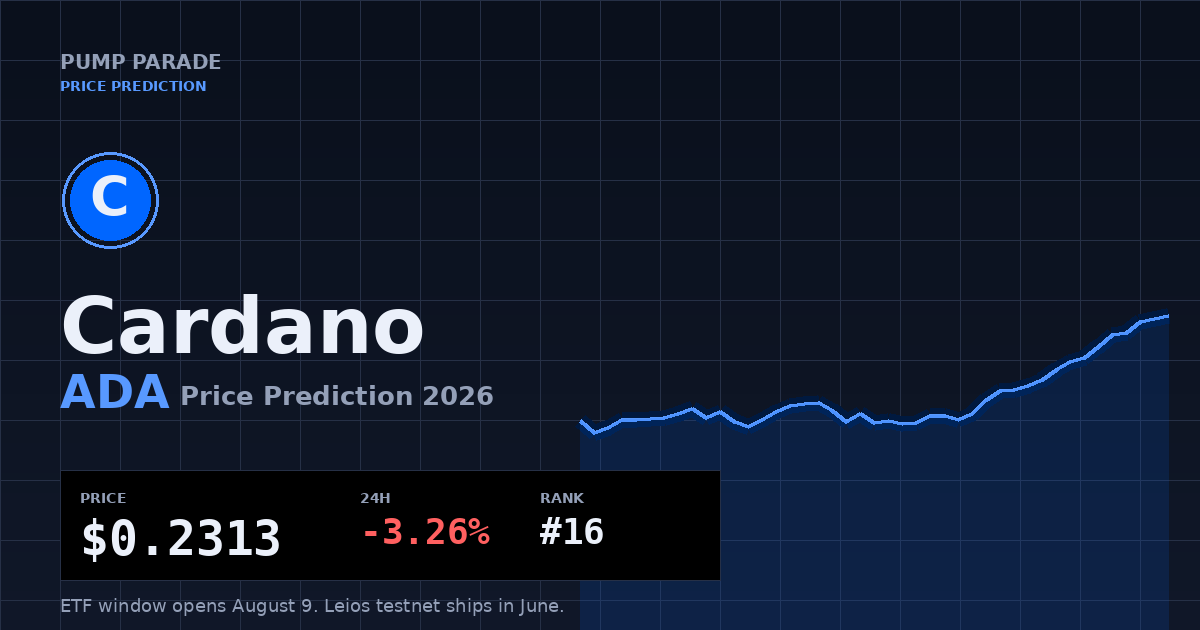
    Cardano ADA price prediction 2026 hero image

    Cardano (ADA) Price Today: Where ADA Stands Right Now

    Here are the numbers as of writing:

    • Price: $0.2313
    • Market cap: ~$8.56 billion (rank #16)
    • 24-hour volume: ~$467 million
    • 24h change: -3.26%
    • 7d change: -7.33%
    • 30d change: -5.98%
    • 1y change: -69.21%
    • Circulating supply: 37.01 billion of 45 billion max

    ADA spent most of the past 30 days bleeding against Bitcoin. Bitcoin dominance is sitting near 60% and the CMC Altcoin Season Index is at 39 out of 100. Large-cap alts without a fresh narrative have been quietly distributed. Cardano fits that profile on the surface.

    Look closer and the picture flips. The token is consolidating into a zone that has held three times since late 2024. Funding is neutral. Open interest on CME Cardano futures, live since February 9, is climbing. Something has to give.

    What Is Cardano? The 30-Second Refresher

    Cardano is a proof-of-stake layer-1 blockchain founded in 2017 by Charles Hoskinson, one of the original co-founders of Ethereum. It uses the Ouroboros consensus protocol, the first peer-reviewed PoS algorithm in production. Translation: every consensus change goes through formal academic review before it ships.

    That research-first approach is why Cardano ships slowly. It is also why institutions take the chain seriously. The CME Group does not list futures on hobby projects.

    The Three Catalysts That Matter for ADA Price in 2026

    Catalyst 1: The Spot ADA ETF Window Opens August 9

    This is the headline event. The SEC-CFTC joint framework now classifies ADA as a digital commodity, and CME Cardano futures have been live since February 9, 2026. That matters because August 9 marks the six-month threshold under generic listing standards. After that date, spot ADA ETFs can be listed without separate 19b-4 rule changes for each issuer.

    The filings are stacked and waiting. Grayscale filed S-1 forms in August 2025 under the ticker GADA, targeting NYSE Arca. VanEck, Bitwise, 21Shares, and Canary Capital have all filed or signaled intent. After the August 9 trigger, the SEC has up to 75 days to issue a final decision on activated filings. That puts the realistic launch window inside late Q3 or Q4 2026.

    For reference, spot XRP ETFs have pulled in roughly $1.32 billion since their November 2025 launch. ADA does not need XRP-tier inflows to re-rate. Even a modest $200 to $400 million of inflows in the first 90 days would absorb a meaningful chunk of float at current prices.

    Catalyst 2: Ouroboros Leios Public Testnet in June

    Leios is Cardano’s scaling upgrade. The target is between 1,000 and 10,000 transactions per second, up from roughly 250 today. It does this through input endorsers and parallel transaction processing, a design that has been in academic review for over two years.

    The public testnet is scheduled for June 2026. If it ships on time and holds throughput under realistic load, the narrative changes overnight. Cardano stops being a “slow chain that thinks too much” and starts being a credible competitor to Solana on raw throughput. Mainnet deployment is targeted for late 2026.

    Compare this to the playbook on other L1 upgrades. Solana’s Alpenglow upgrade narrative drove most of SOL’s positioning into 2026, and Cardano is now setting up the same kind of scaling-led re-rating window.

    Catalyst 3: Midnight Is Already Live

    The Midnight sidechain transitioned to its Kūkolu mainnet phase in late March 2026. Midnight is a privacy-first chain that uses zero-knowledge smart contracts, designed for enterprise use cases where compliance and confidentiality both matter. Think medical records, payroll, supply chain data.

    This is the catalyst the market is sleeping on. Privacy-compliant smart contract platforms have been a missing piece for enterprise adoption since 2017. Midnight is now in production. If even one Fortune 500 deployment surfaces this year, ADA gets a fundamental story it has never had. Real corporate users, real revenue, settled to the Cardano parent chain.

    Cardano Technical Analysis: What the Chart Says

    The technical setup is mixed, leaning constructive.

    Support and resistance: ADA has triple-bottomed in the $0.22 to $0.24 range over the past six months. That zone has now absorbed three distribution attempts. A loss of $0.20 on weekly close would invalidate the base. On the upside, the first real resistance is at $0.32, followed by $0.45, the pre-cycle high of this leg.

    The Relative Strength Index, or RSI, which measures whether an asset is overbought or oversold, is sitting at 38 on the daily and 41 on the weekly. Both readings are in the lower third, which historically has marked accumulation rather than capitulation in ADA’s price history.

    The 50-day moving average is below the 200-day, so the medium-term trend is technically still down. But the gap is narrowing, and a bullish crossover in the next 8 to 12 weeks is plausible if ADA holds the $0.22 floor.

    On-chain activity is the quiet tell. According to public Cardano explorer data and aggregators like CoinGecko, daily active addresses have been climbing for six straight weeks even as price has dropped. Holders are accumulating into weakness.

    Bull Case: Why ADA Could Re-Rate Hard

    The bull case stacks like this:

    • ETF approval by Q4 2026. Inflows of $300M to $700M in the first six months pull ADA back toward $0.55 to $0.75.
    • Leios testnet ships clean in June. Throughput narrative shifts. ADA gets a second-leg re-rate as developers start announcing Leios-native projects.
    • Midnight lands a major enterprise pilot. Fundamental story unlocks. Mid-cycle target moves to $1.00.
    • Macro turn. Bitcoin dominance peaks in Q3, capital rotates into majors. ADA participates with its higher beta.

    If three of those four hit, $1.00 by mid-2027 is in range. If all four hit, $1.50 to $2.00 is the upper bound the model assigns meaningful probability to.

    Bear Case: What Could Go Wrong

    This is the part most ADA coverage skips. Here is the honest list:

    • ETF gets delayed or denied. The SEC has wider latitude than people remember. A denial or 240-day delay would crater the catalyst calendar and push ADA toward $0.15 to $0.18.
    • Leios testnet slips or breaks. Cardano has slipped roadmap dates before. A delay past Q3 2026 kills the throughput narrative for this cycle.
    • Midnight stays niche. Privacy-compliant smart contracts have failed to find product-market fit on every previous chain that has tried. The base rate is bad.
    • Macro breakdown. If Bitcoin loses $58K and the broader risk environment turns, ADA’s beta works against it. The 2022 retest of $0.24 happened in a similar setup.
    • Unlock pressure. Roughly 8 billion ADA remain to enter circulation through staking rewards over the long tail. That is mild dilution per quarter, but it caps the upside in a weak demand environment.

    The level that invalidates the bull thesis cleanly is a weekly close below $0.20.

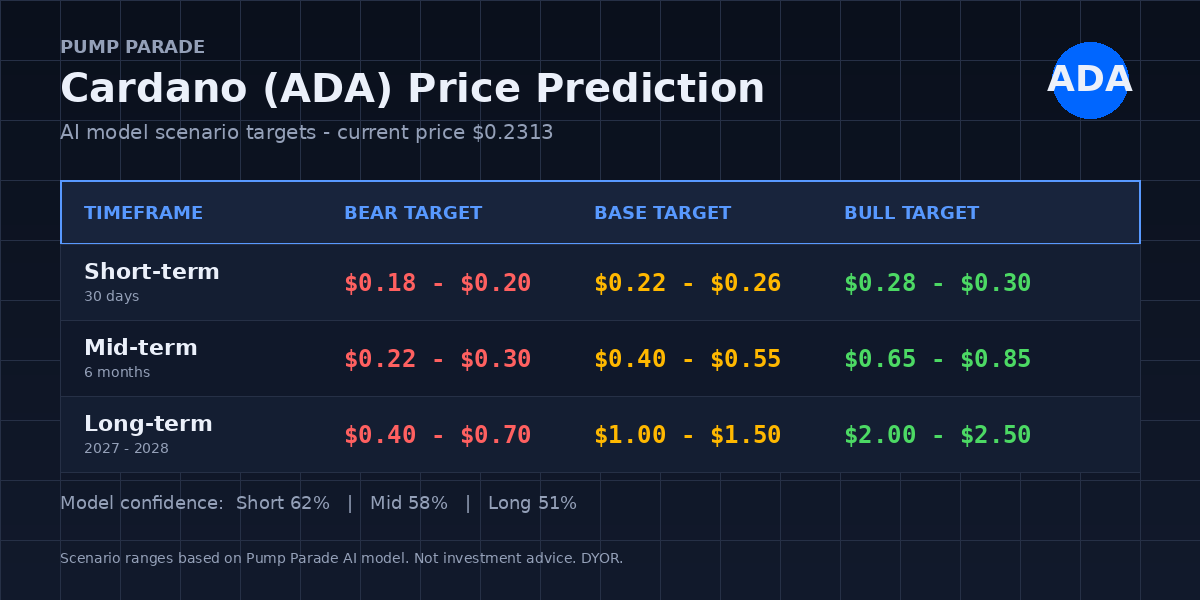
    Cardano ADA price prediction targets table

    Cardano Price Prediction: Short, Mid, and Long-Term

    Here is how our AI model sees it. These are scenario ranges, not guarantees. Confidence scores reflect model output, not certainty about the future.

    Short-Term (Next 30 Days): $0.20 to $0.28

    Base case is $0.22 to $0.26 as the market digests the macro and waits for the Leios testnet announcement window. Bear case is a flush to $0.18 if BTC loses $65K. Bull case is a squeeze to $0.30 on an early ETF headline. Model confidence: 62%.

    Mid-Term (6 Months, By Late Q4 2026): $0.30 to $0.65

    This is where the catalysts cluster. Leios testnet results, the ETF window opening August 9, and any Midnight enterprise news all land inside this window. Base case is $0.40 to $0.55 assuming the ETF gets approved and inflows are moderate. Bear case is $0.22 to $0.30 if the ETF slips and Leios disappoints. Bull case is $0.65 to $0.85 on a clean catalyst sweep plus macro tailwind. Model confidence: 58%.

    Long-Term (2027 to 2028): $0.40 to $2.50

    Bear case is $0.40 to $0.70, the path where ADA gets its catalysts but never escapes mid-cap purgatory. Base case is $1.00 to $1.50, the path where ETFs pull in steady institutional flows and Leios delivers measurable adoption. Bull case is $2.00 to $2.50, which requires Midnight to deliver real enterprise revenue plus a full crypto cycle peak in 2027 or 2028. The all-time high of $3.09 is not in our central range. Model confidence: 51%.

    What to Watch From Here

    Three concrete things on the calendar:

    • June 2026: Leios public testnet launch. Watch for actual TPS numbers under load, not marketing.
    • August 9, 2026: Spot ADA ETF window opens. Watch for which issuers activate filings first.
    • Q3 to Q4 2026: First Midnight enterprise deployments. Watch the news flow, not the price.

    The setup worth monitoring is straightforward. ADA is consolidating in a multi-month base with three concrete catalysts inside the next six months and one cyclical catalyst beyond. The risk-reward favors patient accumulators only if the $0.20 floor holds on weekly close. Break that, and the whole thesis needs to be re-evaluated.

    The Bottom Line

    Cardano is one of the cleanest mid-cap setups in the market right now. Beaten-down price, accumulating holders, climbing on-chain activity, and three real catalysts on the calendar before year-end. The bear case is real and worth respecting, but the asymmetry has gotten interesting after a year of underperformance.

    The smart move is to watch the catalyst calendar, mark $0.20 as your invalidation level, and let the data drive the decision. Not the hype. Not the cope.

    Disclaimer: This article is for informational and educational purposes only and should not be construed as financial, investment, or trading advice. Cryptocurrency markets are highly volatile, and past performance does not guarantee future results. The price predictions and analyses presented here are based on AI models, technical indicators, and available data at the time of writing, they are not guarantees. Always conduct your own research (DYOR) and consult with a qualified financial advisor before making any investment decisions. Pump Parade and its authors do not assume liability for financial losses incurred based on information provided in this article.
    ApeCoin (APE) Price Prediction 2026: New CEO

    0

    ApeCoin (APE) is trading near $0.135 at the time of writing. That is a small number with a big story behind it. The token is up more than 200% from its April 2026 lows. It also sits down roughly 99.7% from its all-time high of $39.40, set on launch day back in March 2022. So which number matters more: the bounce or the crash?

    The recent move was not random. A new CEO at Yuga Labs lit the fuse. A leveraged whale poured gas on it. And a wider gaming-token rally gave it room to run. In this article we break down the data, the catalysts, and a balanced set of price targets for APE through 2028. We will cover the bull case and the bear case, because both are real here.

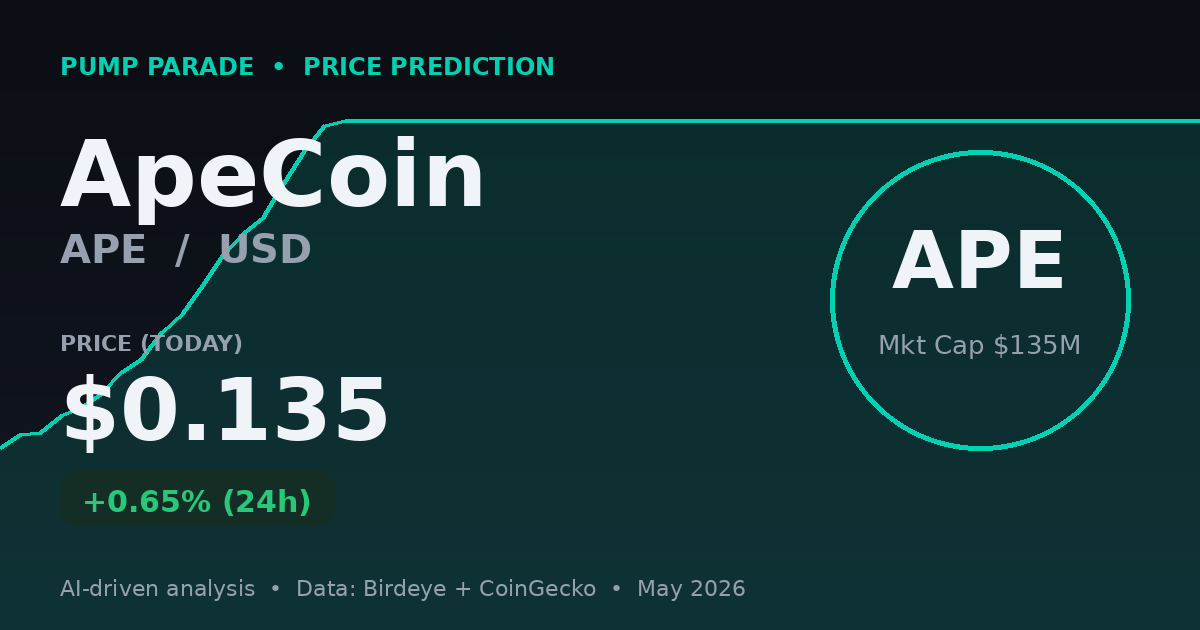
    ApeCoin (APE) price prediction hero showing current price and market cap

    ApeCoin (APE) Price Today: The Quick Snapshot

    Here are the numbers that frame everything else. APE trades around $0.135 today. Its market cap sits near $135 million. The full 1 billion token supply is already circulating, so there are no big unlock cliffs left to fear. That is rare for a 2022-era token and it matters for the long-term thesis.

    Daily trading volume runs near $17 million across major venues, per CoinGecko data. That is healthy liquidity for a token this size. It means the recent move had real buyers behind it, not just a thin order book getting pushed around.

    The big picture is simple. APE is a micro-cap now. It once carried a multi-billion dollar valuation. The market has written off most of that. The question for traders is whether the new leadership can write some of it back.

    What Is ApeCoin? A Plain-English Refresher

    ApeCoin is the token tied to the Bored Ape Yacht Club world. It powers ApeChain, a Layer-3 blockchain built on Arbitrum Orbit that launched in October 2024. In plain terms, ApeChain is a fast, low-cost network for gaming and metaverse apps. APE is the gas token that pays for activity on it.

    APE also fuels Otherside, Yuga Labs’ metaverse project. Think of it as the in-game currency for a digital world that is still being built. The thesis is that as more games and apps launch on ApeChain, more people need APE to use them. Demand rises, supply stays fixed at 1 billion, and the price reflects that. That is the bull thesis in one sentence.

    The Catalyst: A New CEO Changed the Story

    On April 24, 2026, Yuga Labs named Michael Figge as its new CEO. The market reacted fast. APE surged 92% to $0.223 within hours of the news. The timing was symbolic too. It landed on the fifth anniversary of the Bored Ape Yacht Club.

    Why did this matter so much? Because Figge is the person who built ApeChain. He spent three years inside Yuga as Chief Content Officer, then Chief Creative Officer, then Chief Product Officer. Before crypto, he co-founded the creative studio POSSIBLE and worked on shows for the Super Bowl and the VMAs. Traders read his promotion as a clear signal. Yuga plans to double down on building, not retreat.

    The bull case here rests on execution. Figge has a roadmap. Project R.A.I.D. is a multi-chain expansion plan. The Otherside metaverse keeps growing, with a new Resources gameplay system planned for 2026 that adds crafting and an in-game economy. Koda Nexus, a social hub, already launched in late 2025. If these turn into real daily users, the price story changes.

    The Whale Trade You Should Know About

    Part of the surge came from one aggressive bet. On-chain analytics firm Lookonchain flagged a freshly created wallet during the rally. The wallet sold about 75 ETH, worth roughly $174,000. It then deployed over $1.03 million into a 5x leveraged long on 9.19 million APE tokens through Hyperliquid.

    That trader reportedly walked away with around $700,000 in profit. The timing was close enough to the CEO news to raise eyebrows. Some called it an insider-trading controversy. We cannot confirm any wrongdoing. But the lesson for traders is clear. A big chunk of this move was leverage and speculation, not slow organic demand. Leverage cuts both ways.

    ApeCoin Technical Analysis: Key Levels to Watch

    Let’s look at what the chart is telling us. After the 92% spike to $0.223, APE pulled back hard. It now consolidates near $0.135. That is a classic pattern. A news pop fades, and the token searches for a new base.

    The first level to watch is support near $0.10. That zone acted as a launch pad during the April rally. If buyers defend it, the uptrend stays intact. A clean break below $0.09 would suggest the rally is running out of steam.

    On the upside, resistance sits at the recent high near $0.22. A daily close above that level would be a strong signal. It would show that buyers are willing to chase the move, not just buy the dip. Above $0.22, the next target is the psychological $0.30 mark.

    Momentum tells a mixed story. The token cooled off after running too hot in April. That kind of reset is often healthy. It lets weak hands exit before the next leg. But momentum alone will not hold APE up. It needs the fundamentals to follow.

    The Bull Case for APE

    The bull case is built on three pillars. First, leadership. Figge built ApeChain and now runs the whole company. That alignment is exactly what the project lacked before. Second, the sector tailwind. Around 80% of tracked gaming tokens outperformed Bitcoin over the past 30 days. Money is rotating into gaming and metaverse plays. APE is one of the largest brands in that space.

    Third, the supply picture. All 1 billion tokens are circulating. There are no hidden unlocks waiting to dump on holders. If demand for ApeChain gas rises, the price has room to move without supply pressure fighting it.

    Put those together and the upside scenario looks like this. A return to the $0.22 high in the short term. A push toward $0.30 to $0.35 over six months if ApeChain user numbers grow. And in a strong 2027 to 2028 gaming bull market, a stretch target near $0.80. That would still be a fraction of the old all-time high.

    The Bear Case for APE

    Now the other side of the trade. The risk here is real and it is worth respecting. The April rally was driven heavily by leverage and a single CEO headline. News-driven pumps fade fast when the buying dries up. We have already seen the sharp pullback from $0.223 to $0.135.

    The deeper problem is adoption. ApeChain launched in October 2024. The roadmap sounds good. But roadmaps are promises, not results. If Project R.A.I.D. and the Otherside games fail to convert into measurable daily active users within two or three quarters, the narrative collapses. APE could slide back toward $0.07 or lower.

    There is also the macro risk. APE is a high-beta, speculative token. If Bitcoin rolls over and risk appetite drops, micro-caps like APE tend to fall hardest. A broad market downturn could undo the entire bounce. Always size positions with that in mind.

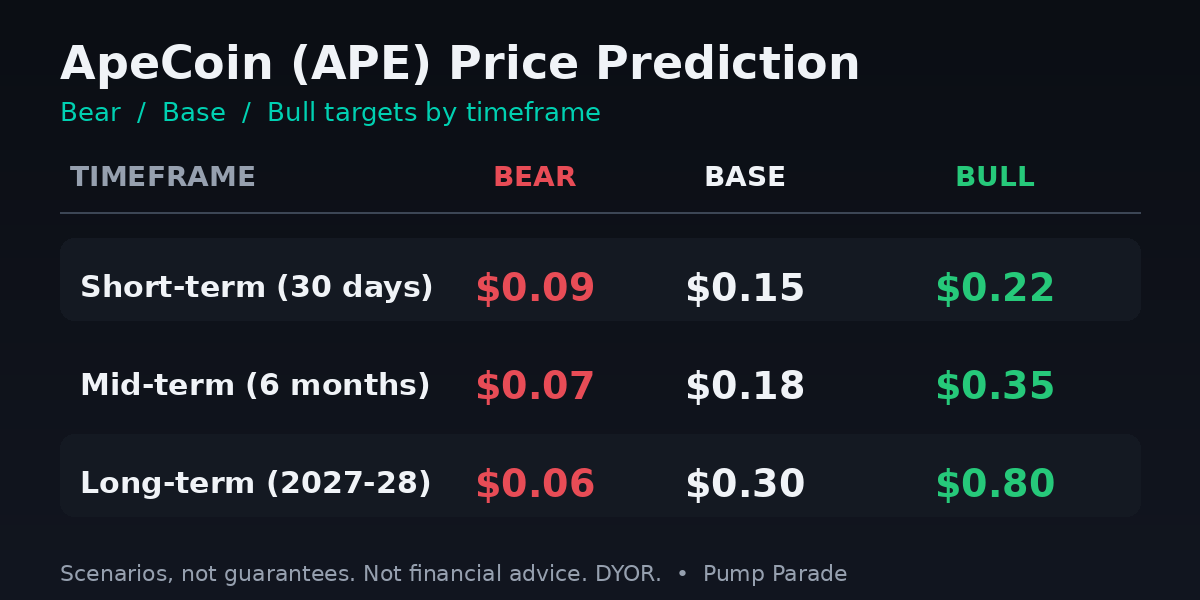
    ApeCoin (APE) price prediction targets table: bear, base, and bull cases by timeframe

    ApeCoin (APE) Price Prediction 2026-2028

    Here is our balanced outlook, based on technical levels, current catalysts, and the gaming-sector trend. These are scenarios, not promises. Treat them as a framework, not a target to chase.

    Short-term (next 30 days): The probability favors a range between $0.09 and $0.22. Our base case is $0.15. A reclaim of $0.22 needs fresh news or strong volume. A drop under $0.09 would flip the short-term trend bearish.

    Mid-term (6 months): If ApeChain adoption shows real growth, APE could trade between $0.18 and $0.35, with a base case near $0.18. The bear scenario sees it fade to $0.07 if the hype fades and users do not show up.

    Long-term (2027-2028): This is the widest range, because it depends on execution and the broader cycle. The bull case points to roughly $0.80 in a strong gaming bull market. The base case sits near $0.30. The bear case is a slow bleed toward $0.06 if the metaverse thesis never lands.

    For context on how community-driven tokens behave through hype cycles, see our Dogecoin price prediction for 2026. The patterns rhyme: strong brand, loyal community, and a price that lives and dies on narrative.

    What to Watch Next

    A few signals will tell you which way this is breaking. Watch ApeChain daily active users and transaction counts. Rising activity is the single best confirmation of the bull thesis. Watch for the $0.22 reclaim on the chart. Watch the broader gaming-token sector. If it keeps outperforming Bitcoin, APE has a tailwind. If it cools, APE loses its rotation fuel.

    Also keep an eye on Yuga Labs’ product announcements. Figge is a builder, and the market is pricing in delivery. Concrete launches with real users would be the catalyst that turns a speculative bounce into a durable trend. Empty roadmap updates would do the opposite.

    The Bottom Line

    ApeCoin is a high-risk, high-reward bet on a turnaround. The new CEO is the right person to lead a building-focused era. The supply picture is clean. The gaming sector is hot. Those are real positives. But the recent rally leaned hard on leverage and a single headline, and adoption is still unproven. The honest take is that APE is a speculative play where execution decides everything. The data gives you both paths. The rest is your risk tolerance.

    Disclaimer: This article is for informational and educational purposes only and should not be construed as financial, investment, or trading advice. Cryptocurrency markets are highly volatile, and past performance does not guarantee future results. The price predictions and analyses presented here are based on AI models, technical indicators, and available data at the time of writing: they are not guarantees. Always conduct your own research (DYOR) and consult with a qualified financial advisor before making any investment decisions. Pump Parade and its authors do not assume liability for financial losses incurred based on information provided in this article.
    Meteora Review 2026: Features, Fees & Verdict

    0

    If you have ever swapped a freshly launched Solana token, provided liquidity to a memecoin pair, or used an aggregator like Jupiter, there is a strong chance your trade touched Meteora without you ever noticing. Meteora has quietly become one of the most important pieces of liquidity infrastructure on Solana, powering a huge share of the chain’s swap volume through its dynamic liquidity pools. But is it actually a good place to provide liquidity, and should traders care which DEX their order routes through? This Meteora review for 2026 breaks down the features, fees, security, and real numbers so you can decide for yourself.

    Quick Verdict: Is Meteora Worth It in 2026?

    Meteora earns a strong 4.3 out of 5. It is the most advanced liquidity layer on Solana, with a Dynamic Liquidity Market Maker (DLMM) that lets liquidity providers concentrate capital and earn volatility-adjusted fees, plus dynamic pools that put idle assets to work. For active LPs and projects launching tokens, it is arguably the best option on the chain. For passive holders who just want set-and-forget yield, the learning curve and impermanent loss risk are real and worth taking seriously.

    Best for: active liquidity providers, memecoin and new-token launches, and protocols that need deep, programmable liquidity.
    Skip if: you want a simple swap interface and never plan to provide liquidity (use an aggregator instead).

    You can explore the protocol directly at the official Meteora website.

    What Is Meteora?

    Meteora is a decentralized exchange and liquidity protocol built on Solana. Rather than positioning itself purely as a trading front end, it describes its mission as building the most secure, sustainable, and composable yield layer for Solana and the broader DeFi ecosystem. In practice that means Meteora is where liquidity lives, and other apps, aggregators, and trading bots tap into that liquidity to execute swaps.

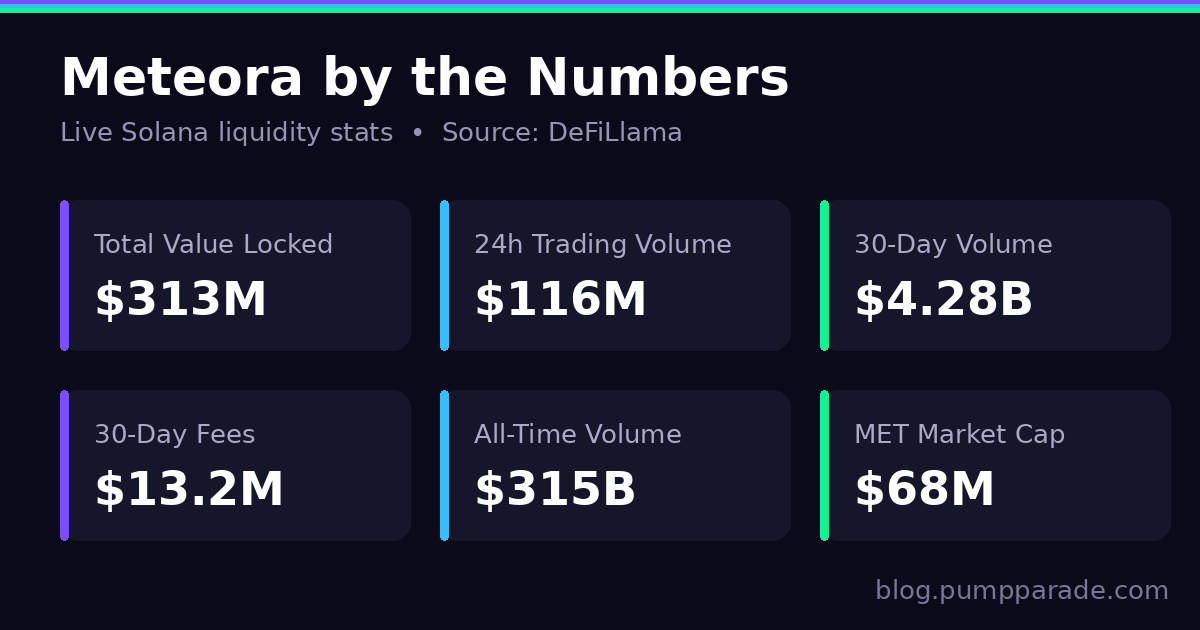
    The numbers tell the story of how central it has become. According to DeFiLlama, Meteora holds roughly $313 million in total value locked, processes around $116 million in daily trading volume, and has cleared more than $4.28 billion in volume over the last 30 days. Its all-time trading volume sits north of $315 billion, and it has generated over $1.42 billion in cumulative fees for liquidity providers and the protocol. Those figures place Meteora among the top decentralized exchanges on Solana by activity.

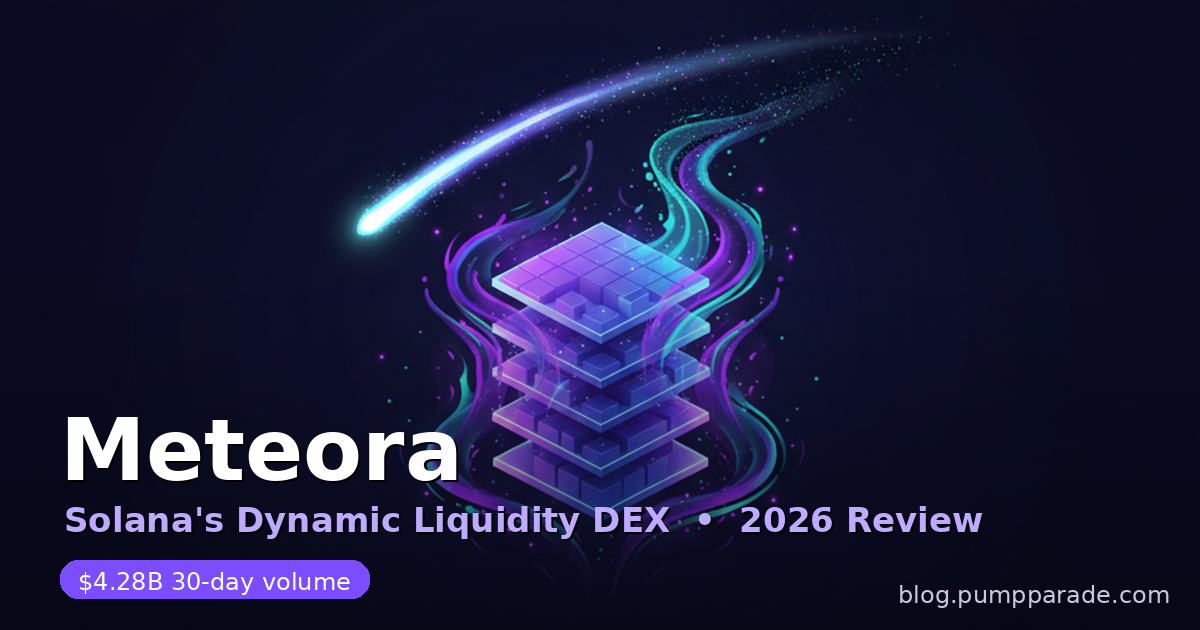
    Meteora Solana DEX review 2026 hero image
    Meteora is Solana’s dynamic liquidity layer, powering a large share of on-chain swap volume.

    Features Deep Dive

    Meteora is best understood as a toolkit of liquidity products rather than a single pool type. Here are the pieces that matter most.

    DLMM: The Dynamic Liquidity Market Maker

    The DLMM is Meteora’s flagship product and the reason most LPs are here. Instead of spreading liquidity evenly across an infinite price curve like a classic constant-product AMM, DLMM divides liquidity into discrete “price bins.” Think of each bin as a shelf that holds tokens available for trade at a specific price. Liquidity providers choose which bins to fund, which lets them concentrate capital exactly where they expect most trading to happen.

    This concentration means LPs can earn far more in fees per dollar deposited than they would in a traditional pool, because their capital is not diluted across price ranges where nobody is trading. The trade-off is that concentrated positions need active management, and if price moves out of your selected bins, your position stops earning fees until you rebalance.

    The standout feature is dynamic fees. DLMM automatically adjusts the fee a pool charges based on market volatility. When prices are swinging hard, fees rise to compensate liquidity providers for the extra risk they are taking. When the market calms down, fees fall to keep the pool competitive and attract volume. This volatility-aware pricing is one of the clearest advantages Meteora holds over older AMM designs.

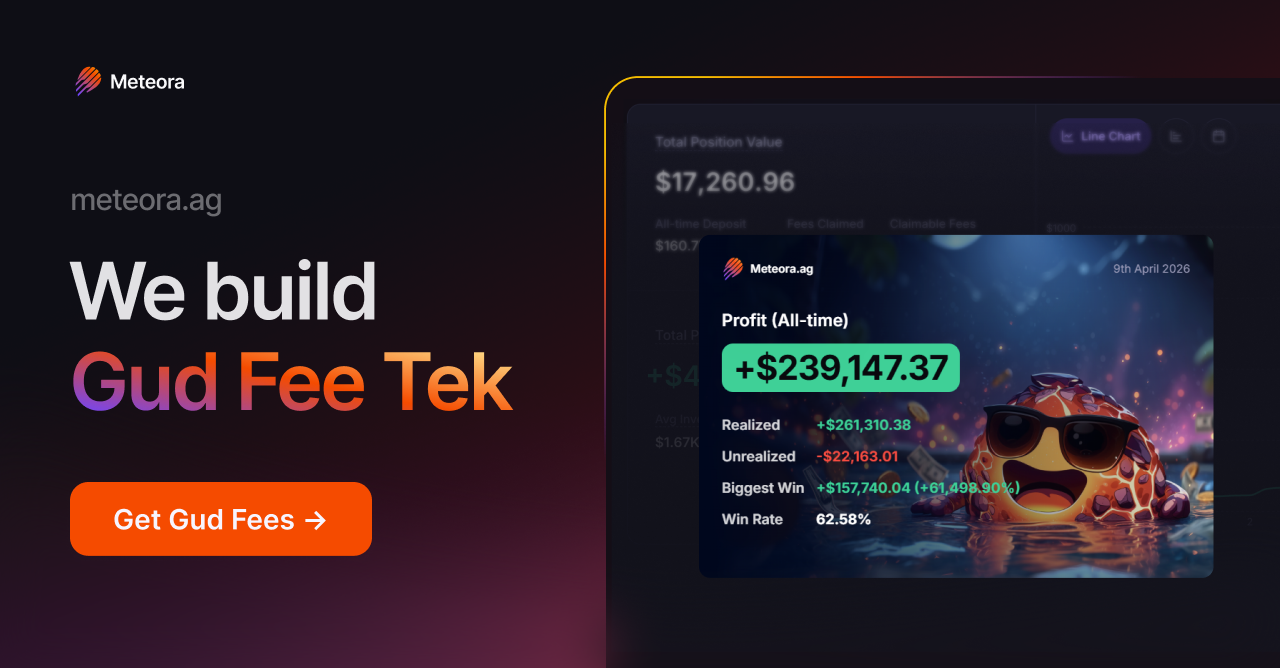
    Meteora app interface and liquidity pools
    The Meteora app surfaces DLMM pools, dynamic pools, and vault strategies in one interface.

    DAMM v2: Dynamic AMM Pools

    For LPs who want something closer to the simple, passive experience of a classic pool, Meteora offers DAMM v2. It behaves like a familiar constant-product pool, but with a meaningful upgrade: idle assets sitting in the pool are automatically lent out to Solana lending protocols, generating an extra layer of yield on top of the trading fees the pool already collects. That composability, stacking lending yield onto swap fees, is a recurring theme across Meteora’s design and is conceptually similar to how lending markets like Kamino Finance put deposited capital to work.

    Dynamic Vaults and Alpha Vault

    Dynamic Vaults are Meteora’s yield-optimization layer. They automatically rebalance idle capital across lending protocols to chase the best risk-adjusted yield, and they feed liquidity into the DAMM pools. The Alpha Vault is a launch tool that gives projects a fairer way to bootstrap liquidity and protect early participants from bots and snipers during a token launch. This launch tooling is a big reason Meteora has become the default liquidity venue for new Solana tokens.

    The MET Token

    Meteora launched its native MET token in October 2025 with a fixed supply of 1 billion tokens, 48 percent of which entered circulation at the token generation event. MET is a governance token: holders can vote through the Meteora DAO on protocol upgrades, fee structures, and emissions. It also serves as a reward, with MET incentives directed toward LPs in DLMM and DAMM pools, especially around new token launches. At the time of writing MET trades around $0.13 with a market capitalization near $68 million, which is modest relative to the protocol’s volume and gives the token room to grow if usage holds.

    Fees and Pricing

    For traders, Meteora’s fees are competitive and often invisible, because most users reach Meteora pools through an aggregator that simply routes to the cheapest path. For liquidity providers, the fee structure is where Meteora gets interesting.

    In DLMM pools, the base fee is set by the pool creator and can theoretically range anywhere from 0.01 percent to 99 percent. In practice, the active, high-volume pools you would actually trade in use base fees between roughly 0.04 percent and 0.20 percent to stay competitive with Solana routing. On top of that base fee sits the dynamic component that scales with volatility.

    Fee distribution is also worth understanding. Standard DLMM pools direct about 5 percent of total collected fees to protocol reserves, with the remainder going to liquidity providers. Launch pools can allocate up to 20 percent during their early, high-volatility phase. Over the last 30 days, the protocol and its LPs collectively earned roughly $13.2 million in fees, which underlines how much real economic activity flows through these pools.

    Meteora TVL, volume and fee statistics 2026
    Meteora’s key 2026 metrics at a glance. Source: DeFiLlama.

    Pros and Cons

    Pros

    • The most capital-efficient liquidity design on Solana thanks to DLMM bins and dynamic fees.
    • Deep liquidity and very high volume, so traders get tight pricing and low slippage.
    • DAMM v2 stacks lending yield on top of swap fees for more passive LPs.
    • Best-in-class launch tooling (Alpha Vault) for projects bootstrapping a new token.
    • Strong audit history from multiple respected firms.
    • A live governance token (MET) that aligns the community with protocol growth.

    Cons

    • DLMM has a real learning curve; concentrated positions need active management.
    • Impermanent loss can be significant, especially in volatile memecoin pairs.
    • Passive LPs may find the interface and strategy choices overwhelming at first.
    • MET token is still young, and emissions-driven yields can fade as incentives taper.

    Security and Trust

    Liquidity infrastructure lives or dies on security, and Meteora has invested heavily here. Its DLMM, Dynamic Pool, Alpha Vault, and Dynamic Vault contracts have been audited by multiple respected firms, including Offside Labs, Sec3 (formerly Soteria), OtterSec, Quantstamp, Halborn, and Oak. The Offside Labs audit of the DLMM smart contracts surfaced findings that were addressed and fixed by the development team, and the project publishes its audit reports openly. Multiple independent audits across different products is exactly the posture you want from a protocol holding hundreds of millions in deposits.

    That said, no smart contract is risk-free, and the larger risk for most users is not a hack but impermanent loss and poorly chosen bin ranges. Treat audits as a baseline of safety, not a guarantee of profit.

    User Experience

    Meteora’s app has matured considerably. The interface cleanly separates DLMM pools, dynamic pools, and vault strategies, and it surfaces useful data like pool fees, volume, and estimated yields so LPs can make informed decisions. For someone who already understands concentrated liquidity, the experience is smooth and powerful. For a newcomer, there is undeniably a lot to absorb, from choosing bin ranges to understanding how dynamic fees affect returns.

    Most traders, however, will never open the Meteora app at all. They will swap through an aggregator like Jupiter or a trading bot, and Meteora simply provides the underlying liquidity. In that sense Meteora’s best user experience is the one you never see. If you do want to compare it against other on-chain venues, our breakdown of Raydium vs Orca is a useful companion read.

    Verdict and Rating

    Meteora is the most sophisticated liquidity protocol on Solana, and for active liquidity providers and token launches it is close to essential. The DLMM design genuinely improves capital efficiency, the dynamic fee model is smarter than the static fees of older AMMs, and the security track record is reassuring. The main caveat is that this power comes with complexity and real impermanent loss risk, so it rewards users who are willing to learn and manage their positions.

    Final rating: 4.3 / 5. If you are an active LP or launching a Solana token, start at the Meteora app and begin with a small position to learn how bins and dynamic fees behave before scaling up. If you only ever swap, you are probably already using Meteora through an aggregator, and that is perfectly fine.

    Frequently Asked Questions

    Is Meteora safe to use?
    Meteora’s core contracts have been audited by several leading firms including Offside Labs, Sec3, OtterSec, Quantstamp, and Halborn, and reports are published publicly. No DeFi protocol is risk-free, and for most LPs the bigger practical risk is impermanent loss rather than a contract exploit.

    What is the difference between DLMM and DAMM?
    DLMM uses concentrated liquidity in discrete price bins with volatility-based dynamic fees, offering higher fee potential but requiring active management. DAMM v2 is a more passive, classic-style pool that also lends out idle assets for extra yield.

    How much does it cost to trade on Meteora?
    Trading fees depend on the pool, but active DLMM pools typically use base fees of roughly 0.04 percent to 0.20 percent, plus a dynamic component that rises with volatility. Solana network fees are minimal.

    What is the MET token used for?
    MET is Meteora’s governance token. Holders vote through the Meteora DAO on upgrades, fees, and emissions, and MET is also used to reward liquidity providers, particularly around new token launches.

    Is Meteora good for beginners?
    As a trader using an aggregator, yes, because the experience is seamless. As a liquidity provider, the DLMM has a learning curve, so beginners should start small with the more passive DAMM pools before attempting concentrated positions.

    This review is for informational purposes only and is not financial advice. Always do your own research before providing liquidity or trading. Data sourced from DeFiLlama and official Meteora documentation, accurate as of May 2026.

    NEAR Protocol (NEAR) Price Prediction 2026: AI Catalyst

    NEAR Protocol (NEAR) is trading near $2.70 at the time of writing. That is up about 11% in the last 24 hours and roughly 50% over the past week. The token just hit a six-month high. So the obvious question is simple: can NEAR keep climbing, or is this another short squeeze that fades?

    Here is the thing. This move is not just hype. NEAR has a real story right now, and it sits at the center of the hottest narrative in crypto: AI agents. Let’s break down the data, the catalysts, and both sides of the trade.

    NEAR Protocol (NEAR) price prediction 2026 hero showing price $2.70 and +11.4% 24h change

    NEAR Protocol Price Today: The Numbers

    NEAR is a Layer-1 blockchain. In plain terms, that means it is a base network that other apps build on, like Solana or Ethereum. NEAR is fast and cheap. It uses a sharding design called Nightshade, with block times around 600 milliseconds and very low fees.

    Here is where things stand today, based on Birdeye market data and major price trackers:

    • Price: about $2.70
    • 24-hour change: roughly +11%
    • 7-day change: roughly +50%
    • Market cap: around $3.5 billion (rank #29)
    • Circulating supply: about 1.29 billion NEAR

    For context, NEAR bottomed near $1.25 earlier this month. So the token has nearly doubled off that low. You can track the live price on CoinGecko. Always check the current number before you act, since markets move fast.

    Why Is NEAR Pumping? The Key Catalysts

    A few things lined up at once. Let’s look at them.

    1. The AI Agent Narrative

    NEAR has rebuilt its pitch around AI. The team calls it the “Agentic Web.” The idea is that AI agents will soon transact on-chain on their own. They will pay for things, move funds, and run tasks without a human clicking buttons. NEAR wants to be the rails for that.

    This is not just talk. NEAR recently added automatic PII anonymization for AI prompts. Translation: it can strip out passwords, API keys, and personal data before sending a request to an outside model like ChatGPT or Claude. It runs these tasks inside secure hardware powered by NVIDIA H200 and B200 chips. That is a real product, aimed at enterprise users who care about privacy.

    2. A Big Scaling Upgrade

    NEAR is rolling out dynamic resharding. Here is why that matters. It lets the network scale to 70 or more shards. The team claims this could push throughput past Visa-level speeds. More capacity means more room for AI agents and apps to run at once. It is a clear fundamental catalyst, not just a price story.

    3. A High-Profile Endorsement

    Part of the recent surge came from sentiment. BitMEX co-founder Arthur Hayes named NEAR in his “holy trinity” of altcoins, alongside Hyperliquid (HYPE) and Zcash (ZEC). That call drew attention fast. It also helped trigger close to $10 million in short liquidations, which added fuel to the move.

    4. Institutional Money

    NEAR now has a Bitwise exchange-traded product. Reports point to fresh institutional inflows into it. When big players can buy a token through a regulated wrapper, demand tends to grow more steadily. That is a slow burn, but it counts.

    If you follow the AI token space, this story may sound familiar. We covered a similar setup in our Bittensor (TAO) price prediction, another network betting big on decentralized AI.

    NEAR Technical Analysis: What the Chart Says

    The recent rally broke NEAR above the $1.72 resistance level. That breakout came with a short squeeze, which often means a sharp but fast move. Now $1.72 should act as support if price pulls back.

    After a 50% week, momentum indicators are likely stretched. The RSI (Relative Strength Index, a gauge of whether an asset is overbought or oversold) is probably running hot. That does not mean the move is over. It does mean a cooldown or pullback would be normal and healthy.

    Here are the key levels to watch:

    • Support: $2.10, then $1.72, then $1.25
    • Resistance: $3.00, then $3.50

    A clean hold above $2.50 keeps the trend bullish. A drop back under $1.72 would suggest the squeeze has run its course.

    The Bull Case for NEAR

    The bull case is straightforward. AI is the dominant narrative in tech and in crypto. NEAR has shipped real AI features, not just promises. It has fast block times, cheap fees, and a clear plan to scale. It also has strong usage, with reports of 40 to 50 million monthly active accounts.

    If AI agents start transacting on-chain at scale, NEAR could be a prime beneficiary. Add institutional inflows and a fresh narrative, and the upside could be real. In a strong market, a return toward the $5 to $6 zone is not far-fetched.

    The Bear Case for NEAR

    Now the other side. Much of this rally came from short liquidations. That is mechanical, not organic. Squeezes can reverse just as fast as they rise.

    The AI narrative is also crowded. NEAR competes with Bittensor, Render, and others for the same attention and capital. Standing out is hard. On top of that, NEAR’s total value locked (TVL) sits near $110 million. That is modest for a $3.5 billion network. The price reflects a lot of future hope, not current cash flow.

    There is also supply pressure. NEAR has ongoing token inflation, which adds new coins to the market over time. And like all altcoins, NEAR remains tied to Bitcoin’s mood. A broad market drop would drag it down too.

    NEAR price prediction targets table with bear, base, and bull cases by timeframe

    NEAR Price Prediction 2026 and Beyond

    Here is how our AI model frames the scenarios. These are ranges, not promises. Each depends on market conditions and whether the AI catalysts deliver.

    Short-Term (Next 30 Days)

    Expect chop after a big run. Bear: $2.10. Base: $2.90. Bull: $3.60. A push through $3.00 would open the door to the bull target. A failure to hold $2.10 points to deeper consolidation.

    Mid-Term (6 Months)

    This depends on the resharding rollout and AI adoption. Bear: $1.80. Base: $3.80. Bull: $5.50. Real on-chain usage from AI agents is the key swing factor here.

    Long-Term (2027-2028)

    If NEAR becomes a core layer for agentic activity, the upside is large. Bear: $2.50. Base: $6.50. Bull: $12.00. The bull case assumes a strong market and clear product-market fit for on-chain AI. The bear case assumes the narrative fades and usage stays thin.

    What to Watch Next

    Keep an eye on a few things. First, watch the dynamic resharding launch and whether throughput claims hold up. Second, watch TVL and active accounts. Rising usage would back up the price. Third, watch Bitcoin. NEAR will struggle to climb if the broad market turns.

    The smart move is to treat NEAR as a high-beta AI bet. The story is strong. The risk is real. Size your exposure with both in mind.

    The Bottom Line

    NEAR has momentum, a clear narrative, and real products behind the hype. That is a rare combo in crypto. But a 50% week often invites a pullback, and much of this move leaned on a short squeeze. The long-term case is compelling if AI agents go on-chain. The near-term path will likely be bumpy. Watch the levels, watch the catalysts, and do not chase.

    Disclaimer: This article is for informational and educational purposes only and should not be construed as financial, investment, or trading advice. Cryptocurrency markets are highly volatile, and past performance does not guarantee future results. The price predictions and analyses presented here are based on AI models, technical indicators, and available data at the time of writing. They are not guarantees. Always conduct your own research (DYOR) and consult with a qualified financial advisor before making any investment decisions. Pump Parade and its authors do not assume liability for financial losses incurred based on information provided in this article.
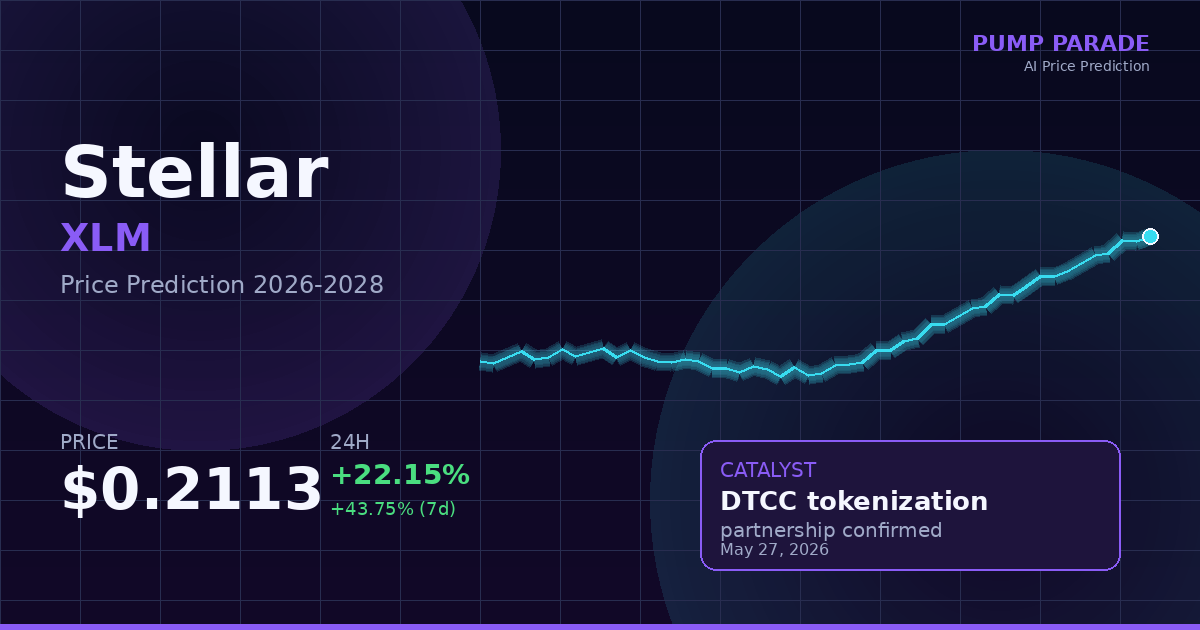
    Monero (XMR) Price Prediction 2026: Privacy Surge

    0

    Monero (XMR) is trading near $396 at the time of writing, up about 2.3% in the last 24 hours. The privacy coin now holds a market cap of roughly $7.31 billion, which puts it at #16 by size. Daily volume sits near $101 million. After a brutal first quarter, XMR has clawed back most of its losses. The question now is simple: does it have another leg up, or is the rally already tired?

    Here is the thing. Privacy coins are having a moment. Money is rotating out of transparent chains and into assets that hide transaction data. Zcash led the charge, and now traders are eyeing Monero as the next stop. So let’s break down where XMR stands, what could push it higher, and what could sink it. We will give you specific price targets with timeframes, plus the bull case and the bear case for each.

    Monero XMR price prediction 2026 hero image showing price of $396 and key market stats

    What Is Monero, and Why It Matters Right Now

    Monero is the largest privacy-focused cryptocurrency. It launched in 2014. Unlike Bitcoin, where every transaction is public, Monero hides the sender, the receiver, and the amount by default. In plain terms: nobody can trace your Monero on a public explorer the way they can trace Bitcoin.

    That design has kept Monero in demand for over a decade. It has no central company behind it. There is no foundation that can collapse or get sued into the ground. The network is run by a global group of contributors. For a sector built on the promise of decentralization, that matters.

    Right now privacy is the narrative. Crypto users are worried about on-chain surveillance and stricter exchange identity rules. That fear sends capital toward coins that offer real transaction privacy. Monero is the most established name in that group.

    Monero Price Today: Where XMR Stands

    XMR has had a wild 2026. Earlier in the year it rode the privacy narrative to a new all-time high near $800. Then it crashed. By February the price had dropped to around $285, a fall of more than 60% from the peak. That is the kind of move that shakes out weak hands.

    The recovery started in April. XMR bounced off an ascending trendline, a rising line of support that connects recent lows. From there it pushed back toward $395. According to live market data from CoinGecko, the coin is now holding that level with steady volume behind it.

    So the picture is mixed. XMR is well off its highs. But it has reclaimed most of the ground it lost. That is a more constructive setup than it looks at first glance.

    The Catalysts Driving XMR

    Two forces are pushing Monero into the spotlight. Let’s look at the numbers behind each.

    1. The Privacy Coin Rotation

    Zcash kicked off the privacy rally. After Multicoin Capital revealed a large ZEC position on May 6, the coin spiked to a fresh 2026 high above $585. It has since pushed even higher. That move put the whole privacy sector back on traders’ radars.

    Now capital is rotating. Traders who bet on ZEC are taking profits and looking for the next privacy play. Monero is the obvious candidate. It is bigger, older, and more battle-tested. We covered the Zcash side of this story in our Zcash (ZEC) price prediction, and the same tailwind now blows toward XMR.

    2. A Major Network Upgrade

    On May 6, the Monero project launched its FCMP++ and CARROT upgrade on a beta test network. The name is a mouthful, so here is the plain version. The upgrade replaces Monero’s old privacy method, called ring signatures, with a stronger system. It is called full-chain membership proofs.

    Translation: the new system hides each transaction among more than 150 million possible outputs from across the chain’s entire history. The old method only mixed a transaction with a small group. More cover means stronger privacy. For a coin whose whole value is privacy, this is a real fundamental boost, not just hype.

    Technical Outlook

    The chart is leaning bullish, with caveats. Two moving averages tell the story. A moving average is just the average price over a set number of days. Traders use it to smooth out the noise and spot the trend.

    The 50-day moving average sits below the current price and is rising. That is a short-term bullish signal. The 200-day moving average has also turned up since mid-April. That points to longer-term strength returning. When both lines rise together, it often marks the start of a healthier trend.

    Key levels to watch: $400 is the first resistance, a price where sellers tend to step in. A clean daily close above it opens the door to $480 and then the $560 zone. On the downside, support sits near $340. Below that, the $300 area is the line bulls need to defend. Lose $300 and the recovery thesis weakens fast.

    The Bull Case for Monero

    The bull case rests on three pillars. First, the privacy narrative has legs. If financial surveillance keeps growing, demand for private money grows with it. Monero is the default choice.

    Second, the FCMP++ upgrade strengthens the product itself. Better privacy makes Monero harder to replace. That is a moat competitors cannot copy overnight.

    Third, the rotation from Zcash could bring fresh buyers. ZEC already proved the sector can run. If even part of that capital flows into XMR, the thinner supply could move the price quickly. Monero’s circulating supply is just 18.45 million coins, so demand spikes hit the price hard.

    In a strong scenario, XMR could retest its $800 high within six months. A full privacy supercycle in 2027 to 2028 could push it past that.

    The Bear Case for Monero

    Now the other side. The biggest risk is regulation. Privacy coins are the most sensitive corner of crypto. Exchanges can delist them with little warning. Several major platforms have already removed Monero in some regions. If more follow, liquidity dries up and the price suffers. This is not a small risk. It is the single largest threat to XMR.

    The second risk is that the rally is just a rotation, not a trend. Privacy coins tend to spike late in a cycle, then fade. If the broader market rolls over, XMR could give back its recent gains and revisit the $285 to $300 zone.

    The third risk is competition. Zcash and newer privacy projects are fighting for the same capital. Monero leads today, but the narrative could split across several coins instead of flowing to one.

    Monero (XMR) Price Prediction by Timeframe

    Here is where our AI model lands. These are scenarios based on technical indicators, on-chain data, and the current privacy narrative. They are not guarantees. Treat them as a framework, not a promise.

    Monero XMR price prediction targets table for short, mid, and long term scenarios

    Short-term (next 30 days): Our model favors a range of $320 to $560. The base case sits near $440. A daily close above $400 is the trigger for the upside path. Failure to hold $340 points to the bear target.

    Mid-term (6 months): The base case sits near $560. A strong privacy run could carry XMR toward $820, close to its prior all-time high. If the narrative fades or regulators act, $300 is the realistic downside.

    Long-term (2027 to 2028): This is the widest range. A full privacy supercycle could lift XMR past $1,200 in the bull case. A base case of $700 assumes steady adoption. The bear case of $250 reflects a world where regulation chokes off exchange access.

    What to Watch Next

    Three things will decide which path XMR takes. First, watch the FCMP++ upgrade timeline. A smooth move from beta to mainnet would be a strong signal. Second, track exchange policy. Any new delisting is a red flag, and any new listing is a green one. Third, watch Zcash. If the privacy leader keeps running, the rotation into Monero has more fuel. If ZEC stalls, XMR likely cools with it.

    The smart move is to set your levels in advance. Know your entry, your invalidation point near $300, and your targets. Let the data guide you, not the hype.

    Disclaimer: This article is for informational and educational purposes only and should not be construed as financial, investment, or trading advice. Cryptocurrency markets are highly volatile, and past performance does not guarantee future results. The price predictions and analyses presented here are based on AI models, technical indicators, and available data at the time of writing. They are not guarantees. Always conduct your own research (DYOR) and consult with a qualified financial advisor before making any investment decisions. Pump Parade and its authors do not assume liability for financial losses incurred based on information provided in this article.