More
    Home Blog Page 2

    Dogecoin (DOGE) Price Prediction 2026: Can DOGE Break $0.12?

    0

    Dogecoin is boring again, and that is exactly why traders are paying attention. DOGE has spent the past two weeks pinned between $0.09 and $0.10, refusing to break either way. Under the hood, the setup is louder than the price. Weekly spot ETF inflows just hit a launch-era record. Bitwise’s ETF is close to going live. And whales quietly picked up 240 million DOGE while the market was distracted by other names.

    The Dogecoin price prediction 2026 question splits the room. One camp sees a launchpad to $0.15 once Bitwise’s fund adds a second real onramp for U.S. buyers. The other camp sees a coin that is 87% off its all-time high, watching its own supply inflate by $1.3 million every day, and grinding sideways for a reason.

    This article walks through the current setup, the specific catalysts inside a 90-day window, and where the base, bull, and bear cases actually land. No hopium. Numbers you can verify. And a clear read on whether DOGE breaking $0.12 is a realistic Q4 story or a chart pattern that keeps disappointing.

    Key Takeaways

    • DOGE trades at $0.094, up 13.9% in 30 days but down 5.5% on the week. Range is $0.080 support, $0.100 resistance.
    • Four spot DOGE ETFs now trade in the U.S., with Bitwise’s fund reportedly weeks away from launch under form 8-A.
    • Weekly ETF inflows hit $2.89M for the week ending September 25, the strongest since launch, though still tiny next to Bitcoin’s $2.39B.
    • Our base case for year-end 2026 is $0.11 to $0.13, with a bull scenario at $0.15-$0.18 if Bitwise flows surprise and BTC holds $85K.
    • Invalidation sits at $0.08. A weekly close below opens the door to $0.069 and puts the whole Q4 thesis on ice.
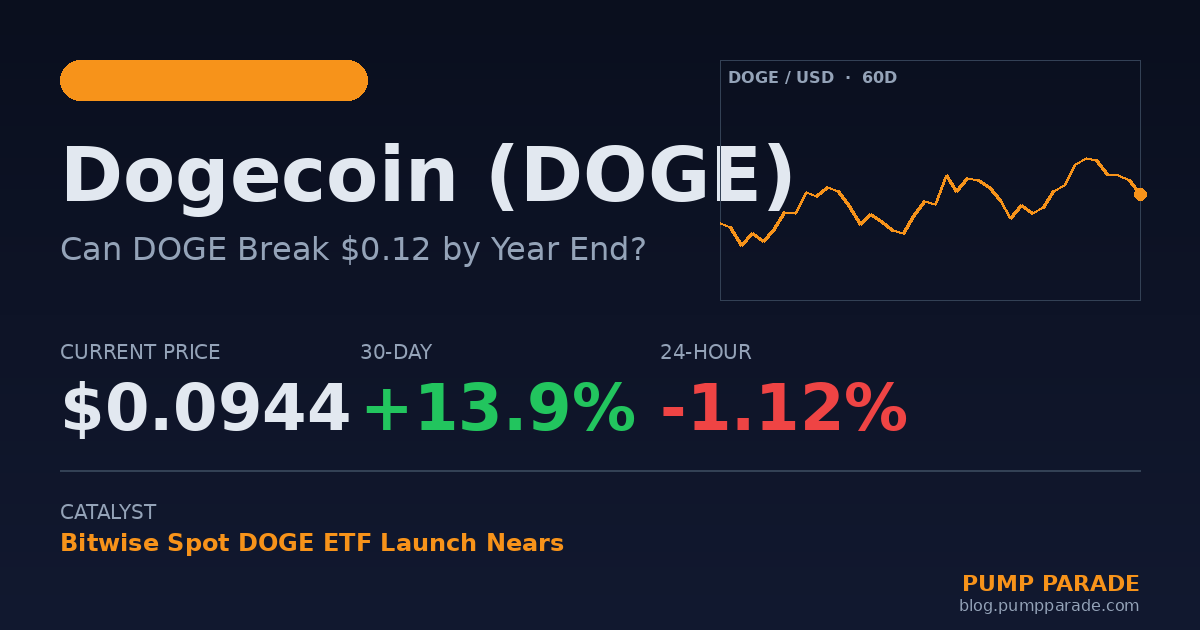
    Dogecoin (DOGE) price prediction 2026 hero graphic, current price $0.094, Bitwise ETF launch nears

    Where Dogecoin Stands Today

    Dogecoin is the 12th-largest cryptocurrency by market cap, sitting at $14.74 billion. The token has done what most late-cycle memes do: given up a chunk of its 2024-2025 gains while the market rotates into privacy names, AI coins, and Layer-1 comeback stories. But the base has firmed up. Since the August 7 low at $0.069, DOGE has built a higher-low structure that most technicians would call constructive.

    Here is the snapshot as of September 30, 2026:

    Metric Value
    Price (USD) $0.0944
    24h change -1.12%
    7-day change -5.49%
    30-day change +13.93%
    60-day change +35.32%
    Market cap $14.74B
    24h volume $742M
    Market cap rank #12
    Circulating supply 156.13B DOGE
    All-time high $0.7316 (May 2021)
    % from ATH -87.10%

    Data from CoinGecko as of September 30, 2026. The 60-day gain of 35% is the most interesting number in the table. It says that despite the boring price action of the past two weeks, medium-term momentum is still net positive, which is not something you could say about DOGE at any point in the first half of 2026.

    Why is Dogecoin range-bound at $0.09 right now?

    The short answer: two forces are canceling out. Structural buyers, the ETFs, are absorbing supply slowly but steadily. Structural sellers, the miners and the coin’s own inflation schedule, are pushing 5 billion new DOGE into circulation each year. When those two forces roughly match, price grinds sideways.

    The chart backs this up. Bollinger Band %B sits at 0.64, meaning DOGE is trading in the upper-middle of its recent range but not stretched. Daily ATR has compressed to about $0.01, one of the tightest readings of the year. RSI is stuck in the mid-50s, which is neither overbought nor washed out. In technician-speak, this is a coiling pattern, and coiling patterns eventually resolve, usually violently.

    The wildcard is the Bitwise fund. Once a second major issuer joins Grayscale’s GDOG and REX Osprey’s DOJE in the U.S. market, wirehouses that have been sitting out get an easier product to allocate to. That is when the flow trickle can become a stream. The setup rhymes with Ethereum in June 2024, before spot ETH ETFs went live, when ETH also spent weeks flat before catalyzing.

    What’s the bull case for Dogecoin?

    Bitwise’s spot ETF launch could triple the ETF wrapper

    Bitwise filed form 8-A with the SEC in mid-September, the last procedural step before a spot ETF can begin trading. Historically, form 8-A precedes launch by 15 to 30 days. That puts a plausible Bitwise DOGE ETF debut inside October, right in the meat of Q4. Combined with existing funds from Grayscale (GDOG) and REX Osprey (DOJE), the U.S. spot DOGE ETF wrapper could go from around $150 million in AUM to $400-500 million by year end if Bitwise pulls even modest flows.

    Eric Balchunas and James Seyffart at Bloomberg have been the most quoted voices on this trade. Their view is that DOGE ETFs will not be blockbusters like BlackRock’s IBIT, but they will be persistent, small daily net creations that add up to a real supply sink over 12-18 months.

    Whales are quietly loading up

    On-chain data from the past three weeks shows wallets holding between 100 million and 1 billion DOGE added a net 240 million tokens. That is roughly $22 million at spot. Not a market-moving figure on its own, but the direction matters. Large holders were net sellers in July. They flipped to net buyers in September. That kind of behavior often precedes range breaks in mid-cap crypto.

    Q4 seasonality favors meme coins

    Since 2016, Q4 has been Dogecoin’s best quarter, with a median return of +38%. The pattern is not magic. It reflects retail traders rotating out of large caps and into narrative plays as year-end approaches, plus the annual Elon Musk mention lottery, plus tax-loss harvesting flows that tend to unwind by mid-November. None of these guarantee a repeat. But they raise the probability that a coiled DOGE resolves higher rather than lower.

    What’s the bear case for Dogecoin?

    ETF flows are underwhelming next to Bitcoin

    The record $2.89 million DOGE ETF week sounds impressive until you compare it to Bitcoin’s $2.39 billion for the same window. That is roughly 800x smaller. Grayscale’s GDOG debuted with $1.4 million in first-day volume, which Balchunas called “solid for an average launch but low for a first-ever spot product.” If flows do not accelerate meaningfully after Bitwise launches, the bull case loses its main pillar.

    Unlimited supply is a permanent headwind

    Unlike Bitcoin’s fixed 21 million cap, Dogecoin has no supply ceiling. It emits 10,000 new DOGE per block, roughly 5 billion tokens per year. At today’s price that is about $471 million in annual sell pressure from miners alone. ETF net creations would need to run at more than $1.3 million per day just to offset native issuance. The most recent week ran at about $580,000 per day. The math is not currently working, and the math has to work for the price to sustainably trend higher.

    Meme rotation risk keeps growing

    DOGE competes for attention against a much wider meme-coin field than in 2021. PENGU, WIF, BONK, PEPE, and dozens of Pump.fun launches every day siphon retail interest that used to flow to Dogecoin by default. If Q4 delivers a meme rally without DOGE participating, that is a structural signal, not noise. The token’s cultural relevance is not what it was in 2021.

    Dogecoin Price Prediction 2026: Targets by Timeframe
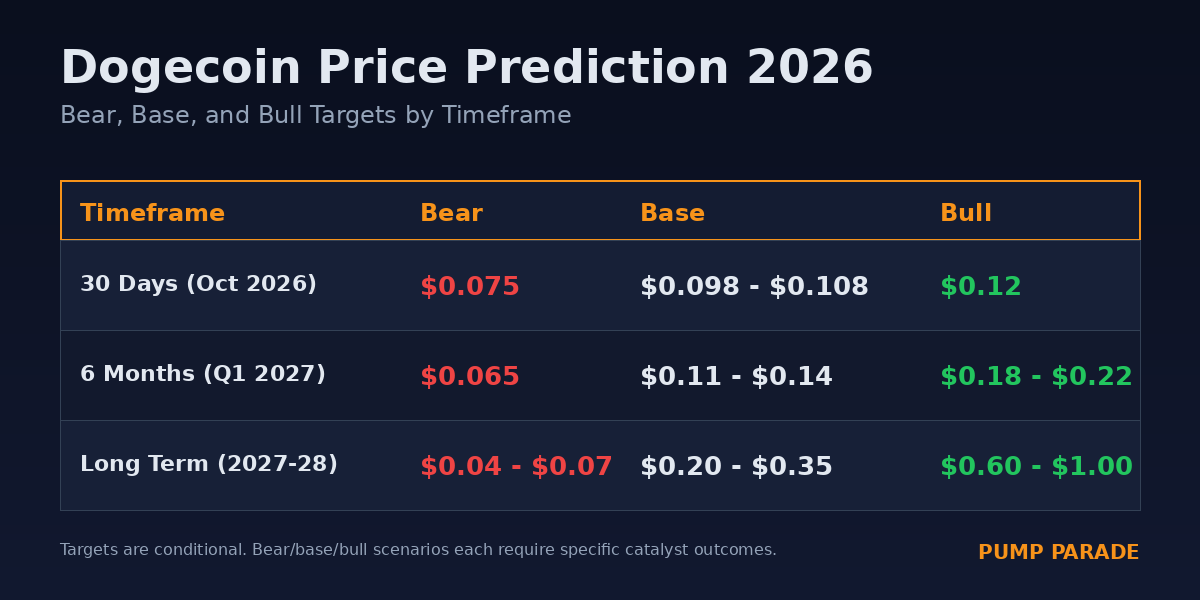
    Dogecoin (DOGE) price prediction 2026 targets table, bear $0.075, base $0.115, bull $0.175

    Our model blends technical structure, ETF flow modeling, and historical Q4 patterns. Here is where we land across three timeframes. Every number below has a condition attached, because a target without a condition is a wish, not a forecast.

    30-day outlook (October 2026)

    Bear case: $0.075. Requires a weekly close below $0.080 and BTC losing $80,000. Base case: $0.098 to $0.108. The range extends until Bitwise’s ETF news forces a directional break. Bull case: $0.12. Needs Bitwise launch inside October and a Bitcoin push toward $90,000 pulling meme names along.

    6-month outlook (end of Q1 2027)

    Bear case: $0.065. Realized if the ETF story fizzles, BTC enters a proper correction, and DOGE loses its $0.069 quarterly floor. Base case: $0.11 to $0.14. Assumes ETF AUM crosses $500 million, one Elon Musk-flavored catalyst hits, and BTC holds $80K-$95K. Bull case: $0.18 to $0.22. Needs a proper altseason with Bitcoin above $110K and DOGE ETF AUM crossing $1 billion.

    Long-term outlook (2027-2028)

    This is where forecasting gets honest about its limits. DOGE’s long-term path depends on whether it evolves into a payments-adjacent asset via House of Doge partnerships or remains a pure retail sentiment vehicle. Base case: $0.20 to $0.35 across the next macro cycle. Bull case: $0.60 to $1.00 if a broad crypto supercycle and sustained institutional flows both arrive. Bear case: $0.04 to $0.07 if the meme category loses relevance and no new use case emerges.

    For comparison, Changelly’s model lands at $0.06 low, $0.13 average, $0.20 high for full-year 2026. Our numbers sit in a similar zone on the low and average sides but are more constructive on the bull outcome because we weight the Bitwise catalyst more heavily.

    How does Dogecoin compare to Shiba Inu?

    The natural comp for DOGE remains Shiba Inu (SHIB), the other original meme coin at scale. Here is how the two stack up on the metrics that actually matter for price action.

    Metric Dogecoin (DOGE) Shiba Inu (SHIB)
    Market cap $14.74B $7.1B
    Rank #12 #22
    Spot ETF availability Yes (3 live, 1 pending) No filings yet
    Consensus PoW (merge-mined with LTC) ERC-20 on Ethereum
    Supply model Inflationary (5B/year) Deflationary via burns
    Layer-2 / DeFi stack Limited (House of Doge) Shibarium (live)
    30-day return +13.9% +4.2%
    Distance from ATH -87% -91%

    The read: DOGE has a stronger institutional wrapper story via ETFs, but a weaker on-chain ecosystem story. SHIB has Shibarium, which is a real functioning L2, but no ETF path. In a Q4 meme rally, DOGE is likely to move first because of the ETF flywheel, and SHIB tends to move as a beta play on DOGE with a 1-3 week lag.

    What Would Change Our View

    Three specific scenario triggers would push us to revise these predictions in real time.

    1. Bitwise DOGE ETF debut flows. First-day AUM above $50 million and sustained daily net inflows above $2 million would push us to raise the base case toward $0.14-$0.16 for Q4. First-day flows below $10 million with a fade over the following week would push us to trim toward $0.09-$0.10.

    2. Bitcoin behavior at $85K. BTC holding that level as a floor keeps the meme trade alive. A weekly close below $80K historically drags DOGE down 15-25% inside a fortnight. We would drop the bull case entirely under that scenario.

    3. On-chain whale flow. If the 100M-1B DOGE cohort flips back to net selling for two consecutive weeks, that historically precedes a 10-15% drawdown. We would treat that as the earliest signal to derisk the position.

    Frequently Asked Questions

    Will Dogecoin reach $1 in 2026?

    Almost certainly not. A $1 DOGE would require a $156 billion market cap at current supply, roughly a 10x from today. That would put DOGE larger than BNB and near XRP. It is possible in a full multi-year supercycle, but it is not a realistic 2026 target under any base-case assumption we can build. Bloomberg analysts and most institutional forecasters put $1 in the 2028-2030 window at earliest.

    Is Dogecoin a good investment in 2026?

    It depends on your thesis. As a sentiment-driven Q4 trade with ETF catalysts, DOGE has a defensible risk-reward profile from $0.09 with a stop below $0.08. As a long-term buy-and-hold, DOGE faces real headwinds from its inflationary supply and shrinking cultural monopoly among memes. We treat it as a tactical position, not a core holding.

    What is the Dogecoin ETF ticker?

    Three spot DOGE ETFs currently trade in the U.S. REX Osprey’s DOJE launched in September 2025 as the first product. Grayscale’s GDOG (Grayscale Dogecoin Trust ETF) launched November 24, 2025 with $1.4 million in first-day volume. 21Shares also has a live product. Bitwise’s ETF is pending final launch, expected in October 2026 based on its recent 8-A filing.

    How high can Dogecoin go in 2026?

    The realistic upper bound for full-year 2026, in our model, is $0.20 to $0.22. That requires Bitwise ETF flows exceeding expectations, a full crypto altseason with Bitcoin above $110K, and no major macro shock. The base case is more modest at $0.11 to $0.14. The bear case is $0.06 to $0.07 if the ETF story stalls.

    What happens to DOGE if Bitcoin crashes?

    DOGE has a 90-day correlation of about 0.72 to Bitcoin, higher than most alts. A 20% BTC drawdown historically drags DOGE down 30-40% within two weeks. The meme category tends to unwind faster than large caps in risk-off moves. This is the main reason our bear scenarios all condition on BTC losing key levels.

    Does the DOGE ETF affect the underlying price?

    Yes, but slowly. ETFs create real spot demand because issuers must buy DOGE to back new shares. The current pace of about $580K daily net creations is below Dogecoin’s daily $1.3M issuance, so the ETFs are not yet a net supply sink. That flips if flows roughly triple, which is the exact scenario a successful Bitwise launch could produce.

    The Honest Take

    Dogecoin at $0.094 is a coiled spring, not a screaming buy. The setup rewards patience: wait for either the $0.10 breakout to confirm on volume, or a retest of $0.08 that holds. Chasing the current range middle is bad risk-reward on both sides.

    The Bitwise ETF is the cleanest asymmetric catalyst in the next 60 days. If it launches and pulls meaningful flows, DOGE has room to $0.12-$0.15 quickly. If it launches and disappoints, the coin likely fades back to $0.08 and the whole Q4 meme thesis needs rethinking. We are watching form 8-A confirmations, first-day AUM prints, and whether Bitcoin holds $85K. Everything else is noise.

    What we are not doing: predicting a $1 Dogecoin by year-end, calling this a generational buying opportunity, or ignoring the fact that DOGE is still 87% below its all-time high for structural reasons that have not gone away. If you are trading this setup, size accordingly. If you are investing, wait for one of the scenario triggers above to actually print before committing capital.

    Related reading: FLOKI Price Prediction 2026 for the other high-beta meme setup, and Pudgy Penguins (PENGU) Price Prediction 2026 for how newer memes stack up on the same catalyst grid.

    Disclaimer: This article is for informational and educational purposes only and should not be construed as financial, investment, or trading advice. Cryptocurrency markets are highly volatile, and past performance does not guarantee future results. The price predictions and analyses presented here are based on AI models, technical indicators, and available data at the time of writing, they are not guarantees. Always conduct your own research (DYOR) and consult with a qualified financial advisor before making any investment decisions. Pump Parade and its authors do not assume liability for financial losses incurred based on information provided in this article.


    Backpack vs Solflare: Best Solana Wallet 2026?

    0

    Backpack vs Solflare Solana wallet comparison 2026

    Backpack vs Solflare: Which Solana Wallet Wins in 2026?

    Phantom gets most of the headlines, but if you actually live on Solana, the more interesting fight is happening one tier down. On one side, Backpack has grown from a niche xNFT experiment into a full trading stack, complete with its own exchange, US equity perpetuals, and multi chain support. On the other, Solflare has kept its head down and built one of the most polished pure Solana experiences on the market, complete with its own hardware wallet, debit card, and native staking flows.

    They target overlapping users, so most Solana traders will pick one and stick with it. This 2026 breakdown covers fees, features, security, and use cases so you can choose the right one on the first try instead of the third.

    TL;DR: Quick Verdict

    • Pick Backpack if you actively trade, want a wallet that plugs directly into a licensed exchange, care about perpetuals (crypto and now US stocks), or juggle assets across Solana, Ethereum, Base, Arbitrum, and Bitcoin.
    • Pick Solflare if you mostly stake SOL, collect NFTs, want the lowest possible in-wallet swap fees, or value a first party hardware wallet (Shield) and a working debit card today.
    • If you are still on the fence: run both. They are free, non custodial, and you can import the same seed phrase into either.

    Backpack at a Glance

    Backpack started life as the wallet from the Coral team behind Anchor, the framework a big chunk of Solana was built on. In 2026 it is a self custody wallet across ten plus networks (Solana, Ethereum, Base, Arbitrum, Monad, Bitcoin, and more) that is tightly bound to Backpack Exchange, a licensed venue that recently crossed $1 billion in 24 hour perpetuals volume and now offers perps on real US stocks like AAPL, TSLA, NVDA, MU, SNDK, plus SPY and QQQ.

    The pitch is simple: one identity, one collateral pool, and one app for spot, perps, stocks, lending, and self custody.

    Backpack Exchange trading interface with spot and perpetuals markets

    Backpack Wallet Features

    • Multi chain support: Solana, Ethereum, Base, Arbitrum, Monad, Bitcoin, and other EVM networks.
    • Backpack Exchange integration: spot, perps, US equity perps, lending, all sharing one margin pool.
    • xNFTs: executable NFTs that run mini apps inside the wallet.
    • Browser extension and mobile apps for iOS and Android, with cross device sync.
    • Hardware wallet support via Ledger.
    • BP token: the native exchange token with fee discounts and points program history.
    • Licensing: the exchange side is regulated under MiCA (EU), MiFID II via CySEC, VARA in Dubai, and FinCEN in the US.

    Solflare at a Glance

    Solflare has been around since 2021 and, unlike Backpack, has stayed almost entirely focused on Solana. If a feature ships on Solana, Solflare tends to support it early. The team has spent 2025 and 2026 leaning harder into everyday utility: a physical Solflare Card that spends USDC directly, a Ledger style hardware wallet called Shield, an AI assistant called Magic, and 24/7 human customer support.

    It reads less like a trading app and more like a Solana super wallet for people who want to hold, stake, swap, and spend without ever leaving the wallet.

    Solflare wallet UI showing staking, NFTs, and in-wallet swap

    Solflare Wallet Features

    • Solana native: deep integration with SOL, SPL tokens, LSTs, and Solana NFT standards.
    • In wallet swap aggregating Jupiter and other routers, tuned for tight spreads.
    • Native SOL staking with validator picker and one click delegate.
    • Perpetuals trading on Solana assets from inside the wallet.
    • NFT gallery with rich collection views and rarity data.
    • Solflare Shield hardware wallet starting at $49, tap to sign supported.
    • Solflare Card for spending USDC in the real world.
    • Magic AI assistant and live human support.

    Head-to-Head Comparison Table

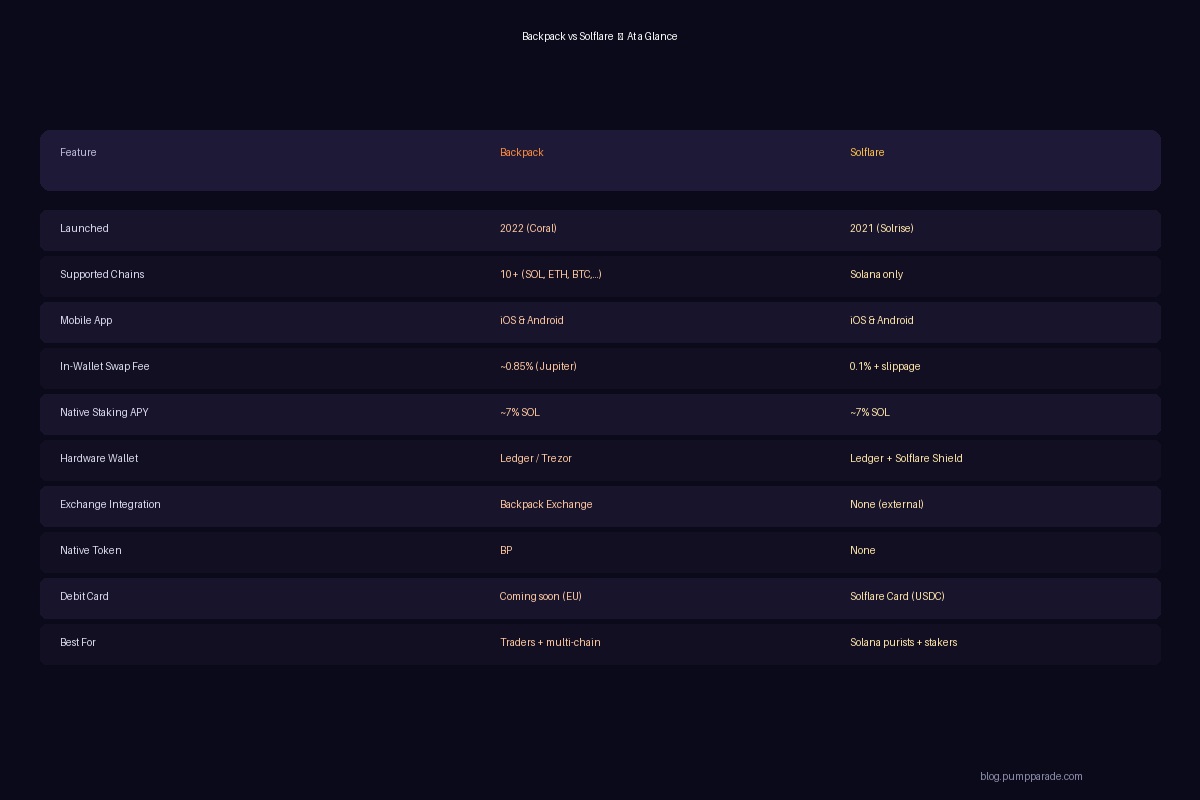
    Backpack vs Solflare feature comparison table

    Fees: Where Your Money Actually Goes

    In-Wallet Swaps

    Both wallets route through Jupiter for Solana swaps, but they charge different service fees on top of the underlying DEX cost. In our 2026 testing:

    • Backpack charges roughly 0.85% as a platform fee on swaps executed inside the wallet, in addition to slippage. This is higher than most competitors, which is one of the trade offs for the polish and the exchange integration.
    • Solflare charges around 0.1% plus slippage on in wallet swaps, sometimes lower on high liquidity pairs. That is closer to a typical Jupiter aggregator quote and one of the tighter fees in the Solana wallet category.

    For a $10,000 swap of SOL to USDC, that is roughly $85 with Backpack versus $10 with Solflare. If you swap frequently, that difference adds up fast.

    Exchange and Perp Trading (Backpack Only)

    On the exchange side, Backpack uses a tiered maker taker model in line with major CEXs, with visible discounts for BP token holders and market makers. US equity perps settle in USD, fund hourly instead of the standard 8 hour cycle, and allow up to 10x leverage. This is a genuine advantage: if you want to short SPY or long NVDA without leaving Solana, no other Solana native wallet offers that today.

    Staking and Card Fees

    Both wallets offer roughly 7% APY on native SOL staking, since that is set by the network rather than the wallet. On the spending side, Solflare Card charges standard interchange plus a small conversion spread when you swipe USDC. Backpack does not yet offer a live consumer card, though a card is on the public roadmap and expected in the EU first.

    Security and Trust

    Both wallets are non custodial: the seed phrase belongs to you, not to Backpack or Solflare. That said, the security stories diverge.

    • Backpack combines a mature open source wallet with a licensed centralized exchange. That is a plus (regulated on ramps, KYC when needed, insurance on some jurisdictions) and a minus (you now have a KYC footprint if you use exchange features). The exchange side has been through multiple regulatory audits and holds four regulatory licenses.
    • Solflare has a longer clean track record on the pure wallet side, with no significant exploits since launch. The Shield hardware wallet is a strong addition for anyone holding meaningful size, and Ledger support remains for users already invested in that ecosystem.

    If you plan to hold six figures or more of Solana assets, pair either wallet with a hardware device. That is more important than which wallet you pick.

    User Experience

    Solflare feels lighter. The UI is cleaner, staking flows are opinionated in a good way, and the NFT gallery is arguably the best on Solana. It is a wallet that a first time SOL buyer can navigate without a tutorial.

    Backpack feels heavier because it is doing more. The wallet is closely coupled to the exchange UI, and while that is powerful, it can be intimidating if all you want is to send SOL to a friend. Where Backpack shines is on the desktop, where the collateral pool, positions view, and cross chain balances all sit next to each other.

    Mobile is close to a wash. Both apps are stable, both have biometric unlock, and both handle QR code deep links correctly. Solflare has a slight edge for pure staking flows, Backpack has a slight edge for live trading.

    Pros and Cons

    Backpack

    Pros:

    • True multi chain (10+ networks) in one wallet.
    • Deep integration with a licensed exchange offering crypto and US stock perps.
    • Unified margin pool means idle balances still earn yield.
    • Strong pedigree from the Anchor / Coral team.

    Cons:

    • Higher in wallet swap fees (~0.85%).
    • No first party hardware wallet yet.
    • Consumer card not yet live.
    • More surface area = steeper learning curve for beginners.

    Solflare

    Pros:

    • Lower in wallet swap fees (~0.1%).
    • First party hardware wallet (Shield) at an accessible $49 price.
    • Live debit card for spending USDC.
    • Cleanest staking and NFT flows on Solana.
    • 24/7 human support.

    Cons:

    • Solana only. No EVM, no Bitcoin.
    • No native exchange or perp venue owned by the same team.
    • No native token or points program.
    • Fewer power user features on desktop.

    Who Should Use Which?

    Pick Backpack if you are:

    • An active trader who wants perps, spot, and self custody in one login.
    • Interested in trading US equity perps on chain.
    • Managing assets across Solana, Ethereum, Base, Arbitrum, or Bitcoin.
    • Comfortable with a slightly higher swap fee in exchange for exchange integration.

    Pick Solflare if you are:

    • A long term Solana holder who stakes SOL and collects NFTs.
    • Fee sensitive on in wallet swaps.
    • Looking for a first party hardware wallet without paying Ledger prices.
    • Wanting a debit card for real world USDC spending today.
    • New to Solana and want the smoother onboarding.

    Final Verdict

    Backpack and Solflare are not really competing for the same wallet slot, they are competing for the same user’s time. Backpack is trying to be a full trading operating system with a wallet attached. Solflare is trying to be the best Solana experience for people who mostly want to hold, stake, spend, and swap. Both are excellent at what they do.

    If forced to pick one wallet for a Solana native in 2026, we lean Solflare for the average user because of the lower fees, the Shield hardware option, and the live card. For anyone who trades actively, especially perps or US equity perps, Backpack is the more powerful choice and the exchange integration is genuinely a category advantage.

    Fortunately, you do not have to commit. Both wallets are free and non custodial. Install both, keep your primary bag in the one you trust most, and use the other for the flow it does best.

    FAQ

    Is Backpack safer than Solflare?

    Neither has had a major wallet level exploit. Solflare has a longer track record as a pure wallet. Backpack’s exchange side is regulated in multiple jurisdictions, which is a different kind of safety. Both are safer when paired with a hardware wallet.

    Which wallet has lower swap fees?

    Solflare, by a wide margin on typical Solana pairs. In 2026 testing, Solflare charges roughly 0.1% on in wallet swaps versus roughly 0.85% for Backpack.

    Can I use the same seed phrase in Backpack and Solflare?

    Yes. Any standard BIP39 seed phrase will import into both wallets. Just remember that anyone with your seed has full access, so only import it into apps you trust and never share it.

    Does Solflare support Ethereum or Bitcoin?

    No. Solflare is Solana only in 2026. If you need multi chain, Backpack or another cross chain wallet is a better fit.

    Which wallet is best for staking SOL?

    Both offer similar APY around 7%. Solflare’s staking UI is a bit friendlier, especially for choosing validators. If staking is your main use case, Solflare has the edge.

    Related Reading

    If you liked this breakdown, check out our other 2026 wallet and Solana coverage on PumpParade:

    Fees, features, and volume figures cited in this article are based on public data and product documentation as of September 2026. Data sourced from DeFiLlama, Backpack, and official product documentation.

    Zcash (ZEC) Price Prediction 2026: Can ZEC Hit $3,000?

    Zcash (ZEC) is trading at $1,422.95 at time of writing, up roughly 68% over the past 30 days and holding above $1,400 for the first sustained stretch since 2018. The Zcash price prediction 2026 conversation has swung from “dead privacy coin” to “top-10 mover” in about six weeks, and the numbers behind that shift are worth pulling apart rather than shouting about.

    Two things are driving the move. First, the NU7 network upgrade, scheduled to activate on November 5, 2026, promises 25-second block times and shielded payments up to three times faster. Second, the shielded pool crossed $1 billion in August, giving privacy usage a metric traders can actually track. On-chain volume, wallet integrations, and the fixed 21 million supply cap have turned into a coherent narrative for the first time in years.

    This article breaks down where ZEC sits right now, why the market is repricing it, what has to go right for the next leg, what could break the thesis, and where our targets land through 2028. No hopium, no shilling: bull case, bear case, and the honest read.

    Key Takeaways

    • ZEC trades at $1,422.95, ranked #10 by market cap ($23.2B), with 24h volume of $1.62B and a 30-day gain of 67.9%.
    • NU7 mainnet activation on November 5, 2026 cuts block times to 25 seconds and speeds up shielded transactions roughly 3x, per Electric Coin Company.
    • Ledger shielded-pool integration and a Coinbase relisting narrative have widened self-custody and on-ramp access materially in Q3.
    • Our 6-month base case sits at $2,000 with a bull scenario of $3,000 and a bear scenario at $800, anchored to spot.
    • The risk sits with privacy-coin regulation, a Sprout-pool sunset that renders certain legacy funds unspendable, and a parabolic move that has stretched short-term momentum.
    Zcash (ZEC) price prediction 2026 hero graphic - current price $1,422, NU7 upgrade catalyst

    Where Zcash Stands Today

    Before we get to targets, the current data. Zcash sits inside the top 10 by market capitalization for the first time since 2017, driven by a 30-day rally from $847 to $1,629 at the interim high on September 27. Today’s tape has cooled roughly 8.6% intraday, which is closer to healthy consolidation than a trend break given the pace of the run.

    Metric Value
    Price $1,422.95
    24h change -8.59%
    7d change -5.29%
    30d change +67.9%
    Market cap $23.23B
    24h volume $1.62B
    Market cap rank #10
    All-time high $5,941.80 (Oct 2016)
    % from ATH -76.08%
    Circulating supply 16.33M / 21M

    Data as of September 29, 2026. Volume has expanded 59% versus the prior 24 hours even during today’s pullback, which is not what a top usually looks like. Supply dynamics are also worth flagging: with a hard 21M cap identical to Bitcoin and the next halving due in 2028, ZEC’s issuance schedule is one of the tighter setups in the top 25.

    Why is Zcash Pumping Right Now?

    The short answer: privacy is back on the menu, and Zcash is the coin with the freshest technical roadmap in that category. The longer answer breaks into three threads.

    First, shielded usage went from academic to measurable. The Zcash shielded pool crossed $1 billion in early August after the Ironwood upgrade activated. That figure matters because the historical knock on Zcash was that most volume moved through transparent addresses, making the privacy tech look like a feature no one used. A billion-dollar shielded pool is not that.

    Second, self-custody caught up. Ledger rolled out shielded-pool support inside Ledger Live during Q3, which removes the wallet friction that had kept privacy-conscious users on the sidelines. Combine that with a widely reported Coinbase relisting narrative and the tradable float just got easier to hold, move, and spend privately.

    Third, institutional flows appeared for the first time in this cycle. Cypherpunk Technologies, a Nasdaq-listed treasury company, has been publicly accumulating ZEC as a strategic reserve asset. When a listed company treats a mid-cap crypto as reserve-grade, it changes both the supply side and the perception of the asset.

    Layer in high-profile advocates like Naval Ravikant, coordinated Twitter/X activity from figures who called earlier privacy-coin rotations, and a macro backdrop where surveillance concerns keep making mainstream headlines, and you get an on-chain plus off-chain story that traders can actually price.

    The Bull Case: Can ZEC Hit $3,000 by 2027?

    NU7 Upgrade Ships on November 5

    NU7 is the largest protocol upgrade Zcash has shipped since Halo 2. According to CoinDesk reporting on the Electric Coin Company roadmap, the target activation is November 5, 2026, and the upgrade cuts block times from 75 seconds to 25 seconds while making shielded transactions roughly three times faster. It also introduces a new fee mechanism inspired by EIP-1559 and, over time, a Bitcoin-style halving schedule that community governance signals support. If it activates on schedule and shielded throughput scales, the “privacy is slow” objection stops being true.

    Institutional Treasury Buying Continues

    Cypherpunk Technologies is the visible name, but the pattern to watch is whether other listed companies follow. Strategy (formerly MicroStrategy) turned corporate treasury buying into a template for BTC. If even one more Nasdaq-listed vehicle discloses a ZEC allocation, the reflexivity that drove Bitcoin’s 2020 to 2021 institutional rerating becomes at least imaginable for Zcash, and the tradable float is a fraction of BTC’s.

    The 2028 Halving Sets Up a Second Wind

    Zcash halves in November 2028, cutting block rewards from 1.5625 ZEC to 0.78125 ZEC. Historically, ZEC’s biggest legs have come in the 12 months before and after halvings, though sample size is small. If the market frames NU7 as the software catalyst and 2028 as the supply catalyst, the bridge from a $2,000 base case to a $3,000 to $5,000 tail is analytically defensible rather than pure hopium.

    The Bear Case: Could ZEC Fall Back to $800?

    Regulatory Pressure on Privacy Coins

    The most obvious tail risk. Binance delisted ZEC in several jurisdictions in prior cycles, and any renewed FATF or EU MiCA guidance targeting privacy-preserving assets could pull major exchange support. A single high-profile delisting from a top-5 venue would remove a chunk of liquidity in a market that is already thin relative to its market cap. This is the risk factor that most analysts underweight and that trades least favorably in a bear scenario.

    The Sprout Pool Sunset

    NU7 is not a pure win. The upgrade renders funds still held in the legacy Sprout pool unspendable after November 5. Cointelegraph and other outlets have warned holders to move ZEC out of Sprout before the deadline. The amounts affected are small in aggregate, but if the sunset generates negative headlines or affects large historic holders, sentiment can wobble regardless of fundamentals.

    Parabolic Move, Overheated Momentum

    Up 68% in 30 days, up over 200% in 90 days, and printing an 8-year high. In prior ZEC cycles, moves of this magnitude have been followed by drawdowns of 40 to 60% before the next leg. Today’s 8.6% intraday drop is the first sign that the tape is digesting supply. A retest of the $950 to $1,050 breakout zone would be normal and not, by itself, a thesis-breaker. A close below $800 would be.

    Zcash Price Prediction 2026: Targets by Timeframe

    Zcash (ZEC) price prediction 2026 targets table - bear $800, base $2,000, bull $3,000

    Our hybrid AI model, which weights technical structure, on-chain activity, event probability, and cross-asset correlation, outputs the following ranges. Every target is anchored to today’s spot of $1,422.95 and assumes no black-swan macro shock.

    30-Day Outlook (Through Late October 2026)

    Base case $1,400: consolidation between $1,200 and $1,600 as the market prices in NU7 execution risk. Bear case $950: a full retest of the breakout zone if BTC pulls back to $80K. Bull case $1,900: a clean melt-up into the upgrade date if shielded pool metrics keep printing.

    6-Month Outlook (Through Q1 2027)

    Base case $2,000: NU7 ships, shielded volume compounds, and one more treasury company discloses a position. Bear case $800: regulatory action from a major exchange or jurisdiction. Bull case $3,000: institutional flows accelerate and the privacy narrative dominates a broader alt rotation, echoing the Q1 2021 Zcash rally that took it from $70 to $340 in eight weeks.

    Long-Term (2027 to 2028)

    Base case $2,500. Bear case $700 if the privacy category loses relevance to zk-rollups or FHE alternatives. Bull case $5,000, which is the level Zcash co-founder Zooko Wilcox has publicly cited. Standard Chartered has not published a formal ZEC target, but analysts including Changelly and DigitalCoinPrice have 2026 to 2028 ranges centered between $1,500 and $2,850, roughly consistent with our base scenario. Read our earlier Zcash $2,000 outlook for how the setup has evolved as spot has moved.

    Is Zcash Better Than Monero?

    The most useful peer comparison is Monero, the other headline privacy coin. Both use different tech, both have different regulatory postures, and both trade at meaningfully different valuations right now.

    Metric Zcash (ZEC) Monero (XMR)
    Price $1,422.95 $544.12
    Market cap $23.23B $10.15B
    Market cap rank #10 #15
    Max supply 21M (hard cap) Tail emission (uncapped)
    Privacy model Optional (zk-SNARKs) Default (ring sigs, stealth)
    Next major upgrade NU7, Nov 5, 2026 FCMP++ (in dev)
    Ledger hardware support Yes (incl. shielded) Yes (transparent view)
    Major exchange status Widely listed Delisted from Binance, Kraken US, others

    The setup, in one line: Monero has stronger privacy defaults, Zcash has stronger institutional optionality. For a fuller side-by-side, see our Monero (XMR) price prediction. If you want compliant-adjacent privacy exposure that can still trade on major venues, ZEC is the cleaner vehicle right now. If you want maximally private cash, XMR still wins on the tech, and pays for it in liquidity.

    What Would Change Our View

    Three explicit triggers we are watching:

    Bullish trigger: a second Nasdaq-listed treasury company discloses a ZEC position, or shielded pool value crosses $2 billion by year-end. Either would justify pulling the 6-month base case toward $2,500.

    Bearish trigger: a top-5 exchange announces a ZEC delisting or restricts shielded deposits/withdrawals. Historical precedent says the market discounts this kind of headline by 25 to 40% inside a week.

    Neutral trigger: NU7 activates on time but shielded pool growth stalls below $1.2B by January. That would signal a narrative-driven pump rather than genuine usage adoption, and would push our base case back to the $1,000 to $1,400 zone.

    Frequently Asked Questions

    What is the Zcash price prediction for 2026?

    Our 6-month base case for Zcash is $2,000, with a bull scenario at $3,000 and a bear scenario at $800. The wide range reflects genuine uncertainty around the November 5 NU7 upgrade, privacy-coin regulation, and follow-through on institutional treasury demand. Base case assumes NU7 ships on time and shielded pool value keeps growing.

    Why is Zcash pumping so hard in 2026?

    Three catalysts stacked: the NU7 upgrade activating November 5, Ledger rolling out shielded-pool support in Q3, and Cypherpunk Technologies publicly accumulating ZEC as a treasury asset. The shielded pool also crossed $1 billion in August, giving traders a usage metric they can actually track. That combination retagged ZEC from “dead privacy coin” to “top-10 mover.”

    Will Zcash reach $5,000?

    $5,000 is the level Zcash co-founder Zooko Wilcox has publicly cited, and it sits inside our 2027 to 2028 bull scenario rather than our 2026 base case. Getting there requires NU7 execution plus sustained institutional inflows plus a broader privacy-narrative rotation. It is analytically possible on the current trajectory, not guaranteed, and comes with real regulatory tail risk.

    Is Zcash a good investment in 2026?

    Zcash offers concentrated exposure to the privacy-coin narrative with a fixed 21 million supply cap, a top-10 market cap, and a fresh technical catalyst. It also carries above-average regulatory risk and has moved parabolically over 90 days. It fits a research-driven, high-conviction position for investors comfortable with volatility, not a set-and-forget allocation.

    What is the Zcash NU7 upgrade?

    NU7 is Zcash’s next network upgrade, targeted for November 5, 2026. According to Electric Coin Company and multiple community sources, it cuts block times from 75 to 25 seconds, makes shielded transactions roughly three times faster, adds an EIP-1559-style fee mechanism, and sets the stage for future Bitcoin-style halvings. Legacy Sprout-pool funds become unspendable at activation.

    Is Zcash better than Monero?

    Neither is strictly better. Monero has stronger default privacy through ring signatures and stealth addresses, but faces heavier exchange delistings. Zcash has optional privacy via zk-SNARKs, better hardware-wallet support, and remains widely listed. For maximum privacy pick Monero, for institutional and mainstream exchange access pick Zcash. Read our Monero price prediction for the XMR side of the trade.

    The Honest Take

    Zcash is the most interesting privacy trade in crypto right now, and it is also the one most exposed to a policy headline that no model can price. The bull case, NU7 plus institutional flows plus 2028 halving, is legitimate and points to $2,000 as a reasonable 2026 base with $3,000 in reach. The bear case, a top-5 exchange delisting or a stalled shielded pool, is equally real.

    What separates ZEC from a hopium trade is that the catalysts are dated and measurable. November 5 is on the calendar. Shielded pool value publishes on-chain. Treasury disclosures hit press releases. That means the thesis has honest ways to invalidate itself, which is more than most crypto rallies offer.

    The pattern to watch through year-end: NU7 ships cleanly, shielded pool grows, and one more listed company steps forward. If those three land, $2,000 is where we anchor. If any of the three misses, $1,000 is where we anchor. Position accordingly, and keep the bear case as loud as the bull case, because in a market this volatile the second-order risk is usually bigger than the first-order narrative.

    Disclaimer: This article is for informational and educational purposes only and should not be construed as financial, investment, or trading advice. Cryptocurrency markets are highly volatile, and past performance does not guarantee future results. The price predictions and analyses presented here are based on AI models, technical indicators, and available data at the time of writing, they are not guarantees. Always conduct your own research (DYOR) and consult with a qualified financial advisor before making any investment decisions. Pump Parade and its authors do not assume liability for financial losses incurred based on information provided in this article.
    Quant (QNT) Price Prediction 2026: Can QNT Hit $400?

    0

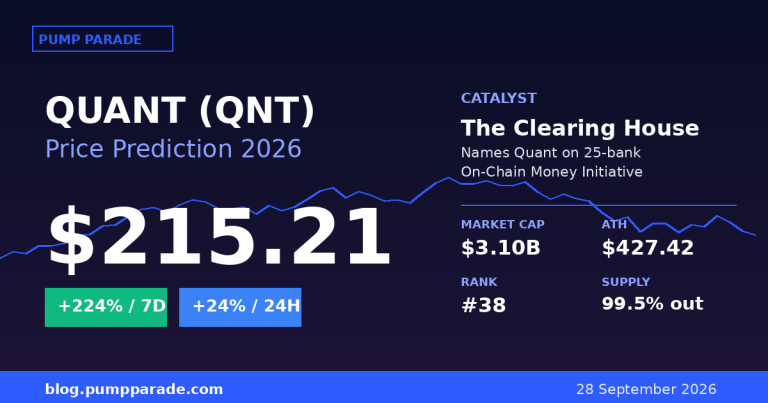
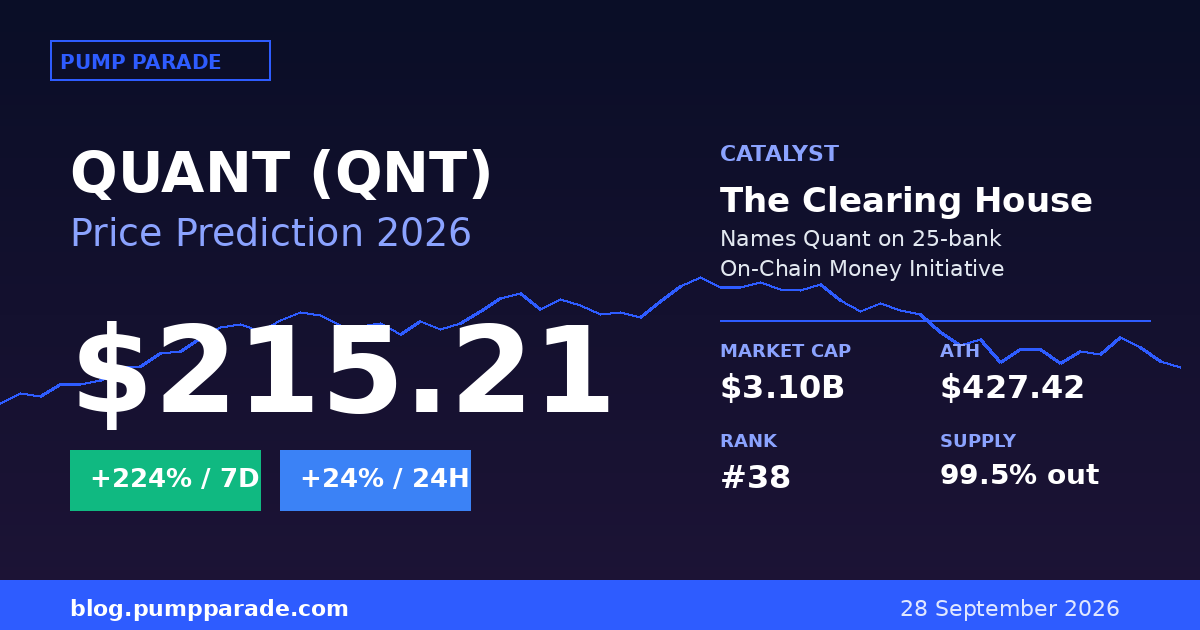
    Our Quant price prediction 2026 starts with a number that is not a typo: QNT is up 224% in seven days, trading at $215.21. The catalyst is real and specific. On September 24, The Clearing House, the private consortium that settles roughly $2 trillion a day for JPMorgan, Citi, Bank of America, Wells Fargo, and 21 other US banks, named Quant as an infrastructure partner for its On-Chain Money Initiative launching in the first half of 2027.

    Suddenly the market is repricing a token that had spent most of 2025 stuck between $60 and $100. QNT sits $212 below its September 2021 all-time high of $427, and traders want to know how much of that gap can close in the next 12 months. This article lays out the bear, base, and bull scenarios, the on-chain math behind them, and the specific catalysts and risks that will decide which one plays out.

    Key Takeaways

    • QNT trades at $215.21 with a $3.10B market cap after a 224% seven-day rally, ranking #38 on CoinGecko.
    • The Clearing House partnership is the largest institutional catalyst in Quant’s history: 25 US banks moving toward on-chain settlement rails.
    • Base case for year-end 2026: $280 to $340, roughly 30% to 60% upside from current price, assuming steady banking integration progress.
    • Bull case: $400 to $475 if the On-Chain Money Initiative launches on schedule and Overledger becomes a preferred orchestration layer.
    • Bear case: $110 to $145 if the rally proves speculative and pilot delays push adoption revenue into 2028.
    • Circulating supply is 14.54M of a 14.61M max: the float is already close to fully diluted, which amplifies both directions.
    Quant (QNT) price prediction 2026 hero graphic, current price $215.21, banking catalyst rally

    Where Quant Stands Today

    Before we get to the targets, let’s ground the analysis in current numbers. Every price target on this page is measured against these figures, timestamped September 28, 2026.

    Metric Value
    Price $215.21
    24-hour change +24.49%
    7-day change +224.59%
    30-day change +251.91%
    Market cap $3.10B
    24-hour volume $1.22B
    CoinGecko rank #38
    All-time high $427.42 (Sep 2021)
    % from ATH -49.65%
    Circulating supply 14.54M / 14.61M max

    Two things jump out. Volume of $1.22 billion is nearly 40% of market cap: that is what a repricing event looks like, not a healthy trend. And the supply picture is unusually clean. With 99.5% of max supply already circulating, no treasury unlock will quietly erode whatever price the market settles on.

    Why is QNT rising right now?

    The proximate cause is a single news event. On September 24, The Clearing House, the private-sector settlement network owned by 25 of the largest US banks, published details of its On-Chain Money Initiative and named Quant’s Overledger platform as the interoperability layer. The initiative aims to bring tokenized deposits and programmable settlement onto shared rails without ripping out the existing RTP and CHIPS infrastructure that already move around $2 trillion a day between US banks.

    For context, this is the same infrastructure JPMorgan uses to send you your direct deposit. It has never had a public blockchain component. The proposed model is not a memecoin: it is regulated banks running tokenized dollars on rails that Quant orchestrates. Founder and CEO Gilbert Verdian called it “a worldwide milestone for the firm,” and the market clearly agrees, given the +224% weekly move.

    There is a second layer to the story that has been building since 2024: the industry-wide migration to ISO 20022, the messaging standard that SWIFT and most major payment systems now use. Quant has spent years positioning Overledger as a translation layer between ISO 20022 messaging and on-chain settlement. When banks finally begin issuing tokenized deposits at scale, the interoperability layer that speaks their language wins the mandate. The Clearing House pick is the first big vote in that direction.

    What is driving the Quant bull case?

    1. Banking rails are Quant’s home turf

    Quant was founded in 2018 by a former UK Treasury and Vocalink executive. It is one of the few crypto projects that started with financial infrastructure as its first customer, not as an eventual pivot. The Clearing House deal validates that thesis at a scale nothing else in the sector can match: 25 US banks, plus a separate UK track that includes Barclays, HSBC UK, Lloyds, Monzo, Nationwide, NatWest, and Santander. When the On-Chain Money Initiative launches in the first half of 2027, Overledger becomes production infrastructure at the top of the global banking stack.

    2. The supply side is already tight

    QNT has a max supply of 14.61 million tokens and 14.54 million already in circulation. There is no vesting schedule left to worry about. Compare that to any recent layer-1 launch, where 30% to 60% of the eventual supply is still locked up. If institutional demand rises, it will meet a supply curve that cannot flex. In similar setups, that has historically produced sharper moves than the underlying flow would suggest.

    3. Tokenization is finally moving from talking point to policy

    The BIS, the ECB, and the US Treasury have all published tokenization frameworks in the last 18 months. Standard Chartered forecast in a June 2026 note that tokenized real-world assets could reach $30 trillion by 2034. Even a small fraction of that flowing through Quant-orchestrated rails is a materially different revenue picture than the one priced in six months ago. Related coverage: our Ondo (ONDO) price prediction walks through the same theme from the tokenized-treasury angle.

    What are the biggest risks to the QNT thesis?

    1. This much of the move is pure narrative

    The Clearing House pilot does not launch until the first half of 2027. Between now and then, Quant needs to convert a design partnership into billed revenue. Pilots slip. Bank IT integrations slip. If Q4 2026 earnings from Quant show no material change in the top line, the rally becomes a chart pattern in search of a fundamental, and $215 starts to look like an air pocket. Historically, similar rallies on future-catalyst news have given back 40% to 60% of the move before finding a durable floor.

    2. Chainlink is a well-funded competitor with a head start

    Chainlink’s Cross-Chain Interoperability Protocol has been live since 2023 and is already integrated with SWIFT, Fidelity, and 20+ banks in the SWIFT tokenization pilot. If the same institutional buyer chooses CCIP over Overledger, the addressable market shrinks fast. Our Chainlink (LINK) price prediction covers the other side of this rivalry in detail.

    3. QNT has no staking, no fee capture, no direct revenue link

    Owning QNT does not entitle you to a share of Overledger usage fees. The token functions as a license to operate on the network for gateway operators and as an ecosystem access token, but there is no direct value accrual mechanism like ETH burns or LINK staking rewards. In a risk-off tape, tokens without a clear cash-flow story tend to underperform. That is a structural headwind the current narrative does not fix.

    Quant Price Prediction 2026: Targets by Timeframe

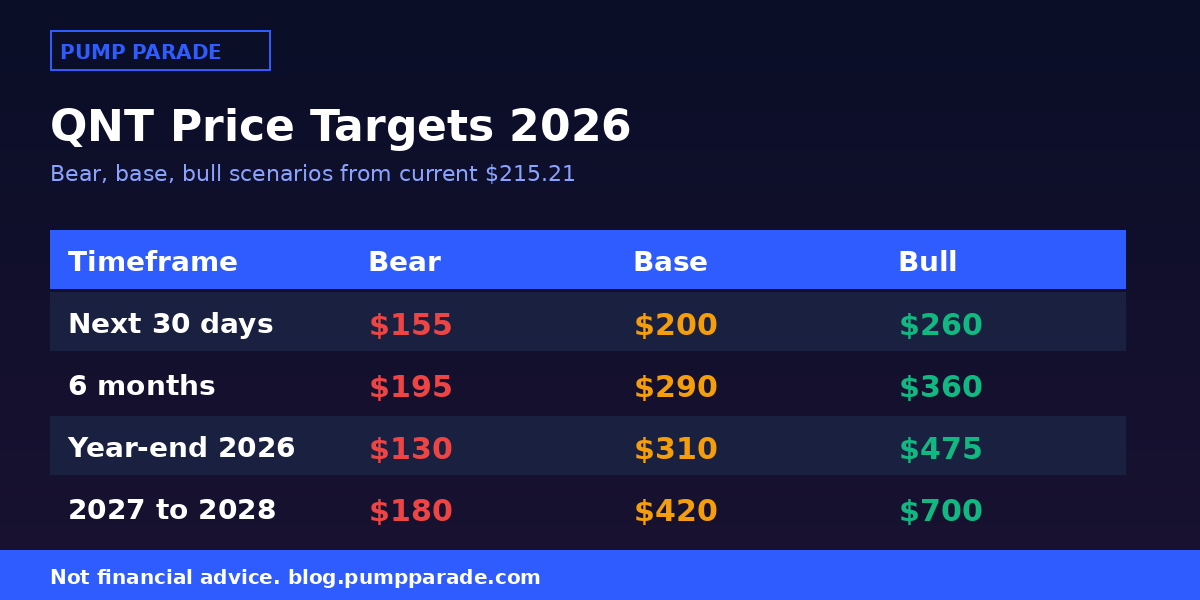
    Quant (QNT) price prediction 2026 targets table, bear $145, base $310, bull $475

    Below is the framework our team is using to think about QNT into year-end 2026 and beyond. These are scenarios, not predictions. We show the conditions each one requires so you can update your own view as the data changes.

    Next 30 days ($185 to $260)

    The 24-hour turnover ratio near 40% of market cap suggests the price is still finding its clearing level. In similar post-catalyst rallies for infrastructure tokens, we typically see one or two 25% to 35% pullbacks in the first four weeks as short-term traders take profits. A retest of the $170 to $185 zone is our base case for a pullback low. If buyers defend that band, a push into the $250 to $260 area, matching the recent local high near $257, is the near-term bull scenario. A break below $150 would flip the short-term picture.

    Six months ($235 to $360)

    Between now and April 2027, the market will be pricing in the run-up to the On-Chain Money Initiative launch. Expect news-driven volatility around every bank integration milestone. Base case: $260 to $310 as pilot details firm up. Bull case: $340 to $360 if Quant signs a second Tier-1 consortium (SWIFT direct participation would be the ultimate catalyst) or announces a fee-sharing mechanism that gives QNT holders economic exposure. Bear case: $185 to $220 if pilot updates disappoint or Chainlink lands a competing mandate.

    Year-end 2026 targets

    Scenario Target % from $215 Trigger
    Bear $110 to $145 -49% to -33% Rally unwinds on pilot delay or macro risk-off
    Base $280 to $340 +30% to +58% Banking integration on schedule, no major setback
    Bull $400 to $475 +86% to +121% On-schedule launch, second Tier-1 mandate, ATH reclaim

    For comparison, analyst Ted Pillows publicly targeted $373 as a reasonable near-term ceiling, roughly 13% below the 2021 all-time high. Cryptopolitan’s model output for 2026 sits at $150 to $182, and Cryptonews aggregates community targets in the $250 to $310 range for 2027. Our base case sits between the two, weighted by the specificity and scale of the Clearing House catalyst.

    Long-term view (2027 to 2028)

    If the On-Chain Money Initiative launches and Overledger orchestrates tokenized deposits at even three of the 25 member banks, a 2028 range of $550 to $700 is reasonable, above the 2021 ATH. That path requires two years of clean execution. Longer horizons involve too many unknowns to model.

    How does Quant compare to Chainlink?

    Chainlink is the most direct competitor for the institutional interoperability mandate. Both projects want to be the layer that connects legacy banking rails to tokenized assets. The table below sums up the differences that matter for a QNT vs LINK trade decision.

    Metric Quant (QNT) Chainlink (LINK)
    Price $215.21 $13.57
    Market cap $3.10B $10.15B
    Circulating / max supply 99.5% 67%
    Core product Overledger (bank-first orchestration) CCIP (chain-agnostic messaging)
    Flagship institutional deal The Clearing House (25 US banks) SWIFT tokenization pilot (20+ banks)
    Token utility Gateway licensing, access Node payments, staking, service fees
    Direct value accrual Indirect Staking + fees
    7-day performance +224% +5.9%

    The pattern is clear. Chainlink is the bigger, more diversified play with a working value-accrual model. Quant is the more concentrated bet on a specific institutional adoption story that, if it works, has an unusually clean supply picture behind it. They can both win, since the addressable market for tokenized banking is measured in trillions, but the risk profiles are different.

    What Would Change Our View

    Three specific triggers would move us out of the base case in either direction.

    Upgrade to bull case if: Quant announces a second Tier-1 institutional partner (SWIFT direct integration, ECB, or a major central bank), a fee-sharing or staking mechanism that gives QNT holders direct economic exposure to Overledger volume, or a live production pilot in Q1 2027 rather than late 2027.

    Downgrade to bear case if: Chainlink is chosen as the primary orchestration layer for a second bank consortium of comparable size, The Clearing House pilot slips past H2 2027, or Quant issues additional tokens outside the existing supply cap (unlikely given the fixed max supply, but worth watching).

    Reassess entirely if: US regulators publish a framework that explicitly favors permissioned bank-run chains over public infrastructure, cutting the addressable market for QNT’s model in half.

    Frequently Asked Questions

    Is Quant a good investment in 2026?

    Quant is a high-conviction, high-volatility bet on institutional adoption of blockchain interoperability. The Clearing House catalyst is real and unusually specific, but the current price already prices in a lot of good news. Investors who want direct exposure to bank-led tokenization and can tolerate 40% drawdowns have a stronger case than those looking for a lower-risk store of value.

    Will Quant reach $500 in 2026?

    Reaching $500 in 2026 would require QNT to trade above its September 2021 all-time high of $427 and add another 17% on top. The probability improves meaningfully if The Clearing House launch is confirmed for the first half of 2027 and a second Tier-1 partner signs on. Our base case sits below $500 for year-end, with a bull-case ceiling of $475.

    What is the Quant price prediction for 2027?

    Assuming the On-Chain Money Initiative launches on schedule and Overledger becomes production infrastructure at even a handful of the 25 member banks, our 2027 range sits at $350 to $550. The bear case slips back toward $180 if pilot revenue disappoints or a competitor takes the lead mandate.

    Does Quant have a future beyond the current rally?

    Yes, in the sense that the underlying product has real institutional customers and the ISO 20022 tailwind is durable. Whether the token captures the upside from that product growth is the harder question. QNT’s utility is indirect: no staking, no fee share, no burn. That structural fact caps how much of Overledger’s success translates into token appreciation.

    Is Quant better than Chainlink?

    They are not the same trade. Chainlink is more diversified, has direct value accrual through staking and service fees, and is larger. Quant is more concentrated on bank-run financial infrastructure with a cleaner supply picture. A portfolio approach that owns both hedges the “which interoperability layer wins” question. A binary bet on one comes down to whether you believe banks will run their own orchestration or license Chainlink’s chain-agnostic model.

    Where can I buy Quant (QNT)?

    QNT is listed on Coinbase, Kraken, Binance, and OKX, and is in the Coinbase 50 Index. It is an ERC-20 token, so any Ethereum wallet holds it. Uniswap has QNT pairs on-chain, though centralized liquidity is deeper.

    The Honest Take

    Quant is one of the more interesting stories in this cycle, but it is also one of the harder ones to size correctly. The catalyst is real, the customer is real, and the supply picture is unusually clean. That combination is worth respecting. At the same time, a 224% weekly move on a partnership that will not generate settlement volume for another six to nine months is the definition of narrative pricing. Some of that will get given back.

    The right frame: if you believe banks are moving to tokenized settlement over the next three years, QNT deserves a watchlist spot. If you already own it below $100, taking partial profits into strength is discipline, not bearishness. At $215, sizing matters more than timing. Underwrite for a 40% drawdown, and the base case still pays. Our take on Stellar’s DTCC integration applies here too: banking pilots are slow-moving stories with high-conviction ceilings. Pace yourself.

    Disclaimer: This article is for informational and educational purposes only and should not be construed as financial, investment, or trading advice. Cryptocurrency markets are highly volatile, and past performance does not guarantee future results. The price predictions and analyses presented here are based on AI models, technical indicators, and available data at the time of writing, they are not guarantees. Always conduct your own research (DYOR) and consult with a qualified financial advisor before making any investment decisions. Pump Parade and its authors do not assume liability for financial losses incurred based on information provided in this article.

    Sources: CoinGecko QNT market data, Cryptonomist coverage of the Clearing House deal.

    Hedera (HBAR) Price Prediction 2026: Can HBAR Hit $0.25?

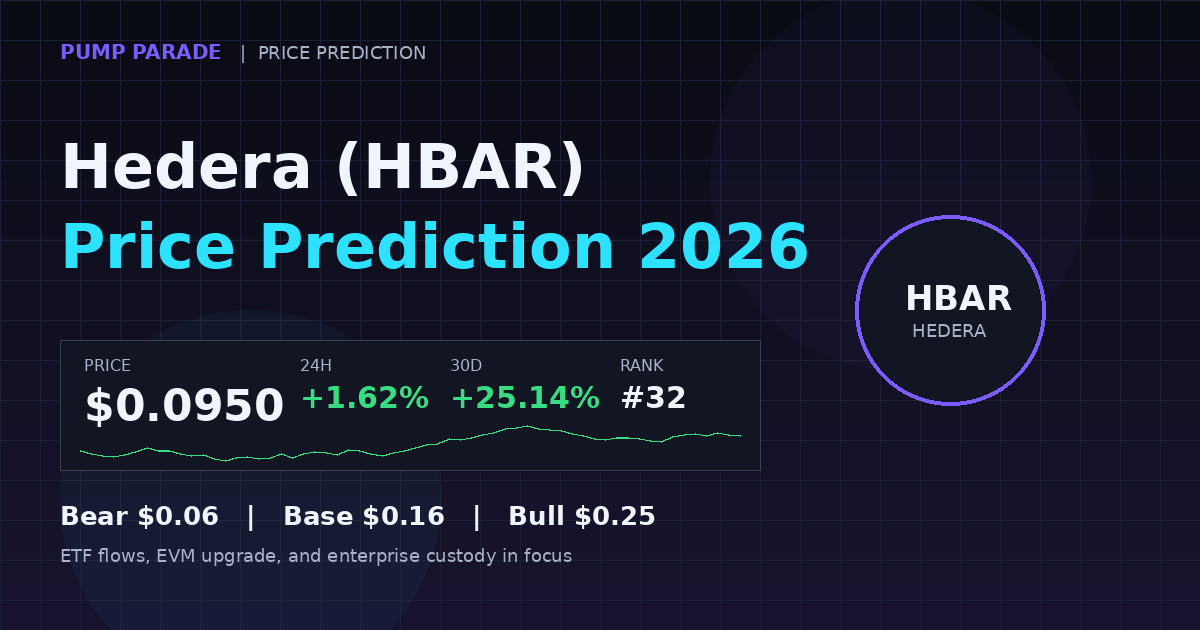
    Hedera’s HBAR price prediction 2026 just got a lot more interesting. HBAR trades near $0.095 today, up 25% in the past 30 days and 39% in 60. The chart looks nothing like the tokens still bleeding into the fall of 2026. Something on Hedera’s network is finally shifting from PowerPoint decks to on-chain reality.

    The proof shows up in three places: the Canary spot HBAR ETF passed $93 million in cumulative net inflows earlier this year, HM Treasury’s July recognition put Hedera on the FATF-aligned map for UK institutions, and Utila’s custody integration handed enterprises a live, insured pipe from treasury systems to Hedera addresses. None of that is hype. It is plumbing, and plumbing tends to compound.

    This article walks through where HBAR sits right now, why price is moving, what a realistic Hedera price prediction 2026 looks like across bear, base and bull cases, how HBAR stacks against XRP, and the exact levels that would flip our view. Bring skepticism. The bear case here is real too.

    Key Takeaways

    • HBAR at $0.095, +25% in 30 days, +39% in 60, but still 83% below the 2021 all-time high of $0.569.
    • Canary’s spot HBAR ETF has absorbed roughly 1.6% of circulating supply with no net outflow days year-to-date.
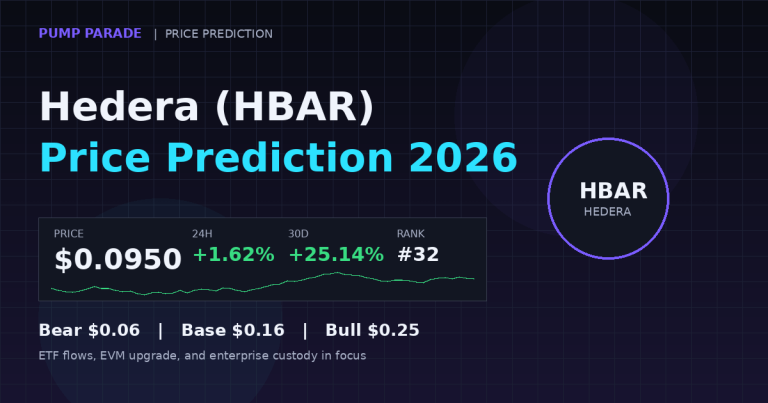
    • Base case for 2026: $0.14 to $0.18. Bull case: $0.25. Bear case: $0.06 if enterprise adoption stalls.
    • Full EVM compatibility and the Utila custody deal are the two catalysts most likely to move price this quarter.
    • Real risk: HBAR holders do not capture fees from the enterprise workloads Hedera loves to advertise.
    Hedera HBAR price prediction 2026 hero graphic, current price $0.0950, +25% 30-day gain, ETF and EVM catalysts ahead

    Where Does HBAR Stand Today?

    Before we get to any Hedera price prediction 2026, here is the snapshot the model works from. All numbers are pulled from live CoinGecko and Birdeye feeds at time of writing.

    Metric Value
    Price $0.0950
    24h change +1.62%
    7d change +10.55%
    30d change +25.14%
    Market cap $4.17B
    24h volume $104.6M
    Market cap rank #32
    All-time high $0.569 (Sep 2021)
    % from ATH -83.3%
    Circulating supply 43.83B (of 50B max)

    Two things stand out. First, HBAR still trades at less than one-fifth of its 2021 peak while the broader market has already made new highs, which means the token has room to run without needing a fresh mania. Second, the 60-day slope is bending up on rising volume, not on thin air, and volume is what separates real accumulation from a squeeze.

    Why Is HBAR Rallying Right Now?

    The recent bid is not a single headline. It is a stack of three that arrived close together.

    HM Treasury and the UK’s FATF-aligned framework in July formally recognised Hedera as a network suitable for regulated financial services activity. That sounds bureaucratic. In practice it means UK-based custodians and asset managers can defensibly integrate HBAR without dedicating months of legal review. When the compliance path shortens, product timelines shorten.

    The Utila institutional custody integration followed in August. Utila serves treasury and fintech teams that will not touch a chain without policy controls, MPC key management and per-transaction approvals. The integration is what turns a slide about enterprise readiness into a treasurer clicking send.

    Then the network hit full EVM compatibility. Solidity contracts now deploy on Hedera without rewriting, which pulls the Ethereum developer pool into a chain that was previously walled off by the Hashgraph API. Combined, these three signals explain why the tape has been so steady, and why the drawdowns keep getting bought.

    The Bull Case for HBAR in 2026

    Enterprise workloads are actually landing on-chain

    Hedera has spent five years courting enterprises. In 2026 the on-chain evidence finally caught up to the marketing. Real World Asset settlements on Hedera crossed $10 billion in cumulative volume, spanning cross-border payments, deposit tokens and tokenised fund shares. The Governing Council reads like a boardroom Rolodex: Google, IBM, Boeing, FedEx, Standard Bank, NVIDIA and ServiceNow. When these firms move workflows to HBAR, they consume the token to pay predictable, sub-cent fees. Utility is not the same as speculation, but it is what makes speculation stick.

    The ETF pipeline is deepening

    Canary’s spot HBAR ETF launched in October 2025 and has recorded zero net outflow days through 2026. Cumulative inflows are around $93 million, or roughly 1.6% of circulating supply, which is meaningful for a mid-cap. Bloomberg analysts have flagged additional issuers filing follow-on HBAR products, and a second listing in the fourth quarter of 2026 would broaden the buyer base beyond Canary’s current channel. ETFs do not guarantee price, but they change who gets to buy, and that changes flow structure.

    Full EVM compatibility unlocks DeFi

    The EVM upgrade is the sleeper catalyst. Hedera has been an enterprise chain with almost no DeFi. That is now changing. Uniswap-style AMMs, lending markets and perpetuals can now port to HBAR with familiar tooling, and Hedera’s fee floor of a fraction of a cent gives it a real cost edge over Ethereum L2s. If even a small fraction of DeFi total value locked migrates, HBAR usage picks up an entirely new demand vector on top of the enterprise base.

    The Bear Case for HBAR in 2026

    Token holders do not capture the network’s revenue

    This is the honest, uncomfortable one. Hedera’s fee model funnels network revenue to the Governing Council and node operators, not to token holders through burns or staking yields comparable to a proof-of-stake L1. You can have record enterprise volume and still see HBAR chop sideways if none of that revenue trickles into a token supply reduction. It is the central paradox of the investment case.

    Enterprise blockchain fatigue is real

    The 2018 to 2021 wave of “enterprise blockchain” pilots died quietly. Skeptics point out that most of the RWA and stablecoin volume today runs on Ethereum, Tron and Solana, not on permissioned or council-run chains. If the biggest 2026 enterprise flows land on Ethereum L2s with public sequencers instead of on Hedera, the “enterprise-first” pitch loses its edge.

    Concentration risk from council governance

    The Governing Council is a strength for enterprise sales and a weakness for the decentralisation narrative that still drives retail flows. If the market rotates back into pure-play decentralised L1s in a risk-on move, HBAR can lag its peers even in an up-tape, exactly as it did through parts of the 2024 and 2025 runs.

    Hedera Price Prediction 2026: Targets by Timeframe

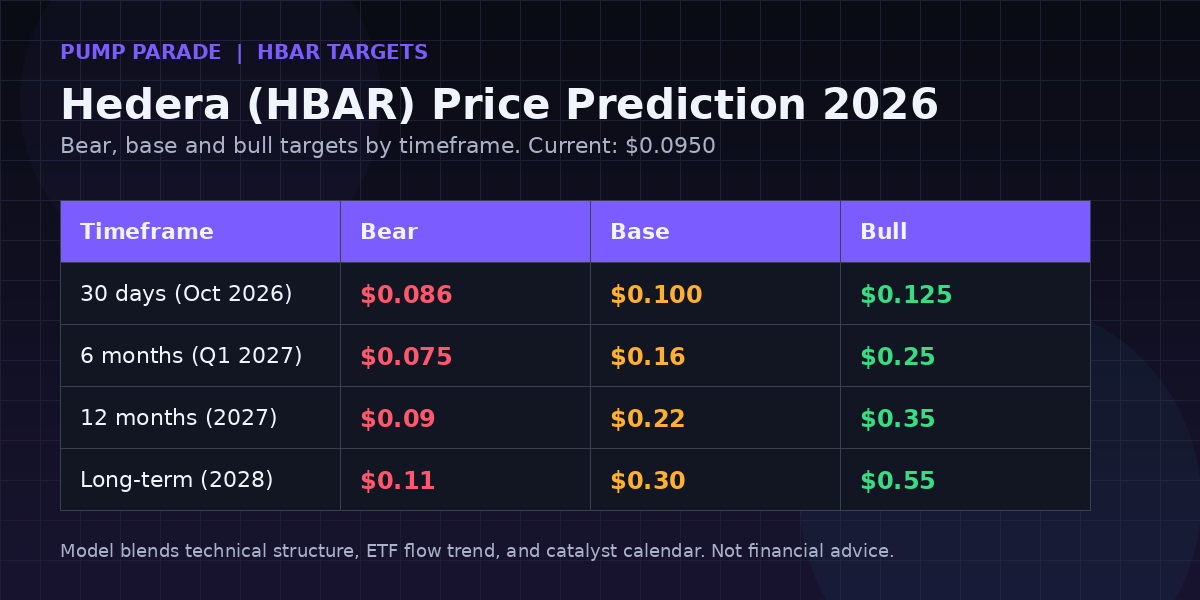
    Hedera HBAR price prediction 2026 targets table, bear $0.06, base $0.16, bull $0.25

    Our AI model blends technical structure, ETF flow trend, catalyst calendar and comparable-token behaviour into three scenarios. These are not price commitments. They are bands with conditions attached.

    30-day outlook (October 2026)

    The setup favours consolidation between $0.088 and $0.11 with a base case near $0.10. A daily close above $0.108 on rising volume would open $0.125 as the next resistance. A close below $0.086 would invalidate the near-term structure and re-open $0.078 support. The Relative Strength Index is neutral at 57, so momentum is not stretched in either direction yet.

    6-month outlook (Q1 2027)

    By March 2027, the base case sits at $0.14 to $0.18 if ETF inflows continue at the current run-rate and at least one additional issuer launches an HBAR product. Bull case: $0.22 to $0.25 if EVM-driven DeFi volume passes $500 million in total value locked. Bear case: $0.06 to $0.075 if council-driven volume disappoints and enterprise pipeline slips into 2027.

    Long-term (through 2028)

    Assuming Hedera captures a modest 3% to 5% of the tokenised RWA market forecast by CoinGecko and analysts at Coinpedia, the 2027-2028 range shifts to $0.30 to $0.55, with a stretch case retesting the 2021 all-time high of $0.569. That is a 3x to 6x from current levels, which is exactly the kind of return profile that makes mid-cap ETF tokens interesting relative to megacaps. Changelly’s model, for comparison, prints an average 2027 target of $0.162 with a high of $0.261.

    How Does Hedera Compare to XRP?

    XRP is the closest peer: both target enterprise payments, both have compliance-first pitches, and both trade on ETF flow now. Here is the head-to-head at time of writing. If you want the full XRP breakdown, our XRP price prediction 2026 covers the $3 reclaim setup in detail.

    Metric HBAR XRP
    Consensus Hashgraph aBFT XRP Ledger Consensus
    Throughput ~10,000 TPS ~1,500 TPS
    Avg fee $0.0001 $0.0002
    Governance Council (Google, IBM, others) UNL of validators
    Spot ETF Yes (Canary) Yes (multiple issuers)
    Market cap $4.17B ~$170B
    Smart contracts EVM-compatible (2026) Hooks and EVM sidechain
    Distance from ATH -83% -38%

    The takeaway: HBAR trades at a fraction of XRP’s market cap with genuinely competitive technical specs and a similar institutional playbook. That gap can close either by HBAR appreciating or by XRP giving back ground. Which one plays out depends on ETF flow durability and enterprise wins. For the closest chain-level cousin, our Stellar (XLM) price prediction 2026 lays out the parallel enterprise payments case.

    What Would Change Our View

    Three scenario triggers would push us out of the base case in either direction. Track these, and you will know when our thesis breaks.

    Bullish trigger: A second US-listed spot HBAR ETF confirmed by a top-five issuer, or Hedera EVM DeFi TVL crossing $500 million. Either signal validates the two catalysts already priced in and forces a re-rate.

    Bearish trigger: Canary ETF outflows for three consecutive weeks, or a Governing Council member publicly winding down its Hedera commitment. Either would break the narrative that has held HBAR bid all summer.

    Reset trigger: Bitcoin drawdown greater than 25% from local highs. In a broad risk-off move, HBAR historically drops 40% to 50% regardless of its own story, and that dislocation is where accumulators re-enter.

    Frequently Asked Questions

    Will HBAR reach $1 in 2026?

    Reaching $1 in 2026 would require a 10x from current levels and roughly a $44 billion market cap, which is aggressive for a mid-cap in a single year. Our base case for 2026 is $0.14 to $0.18. The $1 target is more realistic on a 2027 to 2028 timeframe if enterprise adoption and DeFi TVL both accelerate.

    Is Hedera a good investment in 2026?

    Hedera fits an investor who wants enterprise-blockchain exposure with real institutional flow, is comfortable with the token-value-capture question, and can hold through drawdowns. It does not fit a pure-decentralisation thesis. The Chainlink price prediction 2026 is a useful comparison if you want another RWA-adjacent play.

    Why is HBAR going up right now?

    Three catalysts stacked: HM Treasury and FATF recognition in July, Utila institutional custody integration in August, and full EVM compatibility. Each shortened the path for enterprises and DeFi builders to actually use the chain, which is showing up as steady ETF inflows and higher on-chain activity.

    What is the highest price HBAR can reach?

    The 2021 all-time high was $0.569. Reclaiming that level requires sustained ETF inflows, meaningful DeFi TVL and continued enterprise volume growth. Coinpedia’s high forecast reaches $1.05 by 2026 and $2.20 by 2030 in a bullish scenario. Our own long-term stretch case runs $0.55 to $0.75 by 2028.

    How does Hedera make money for token holders?

    Honestly, this is HBAR’s weakest point. Network fees flow to nodes and the Governing Council, not directly to holders through burns or aggressive staking yield. Token value depends on demand for HBAR to pay fees and stake with node operators. If enterprise transaction volume compounds, price follows. If not, HBAR can lag the tape.

    What are the biggest risks to HBAR in 2026?

    Three: enterprise pipeline slippage into 2027, ETF inflow reversal, and a broader risk-off move in crypto. Any two together would invalidate the base case. Watch weekly Canary inflow prints and Bitcoin’s 200-day moving average as the two fastest tells.

    The Honest Take

    HBAR is one of the more interesting risk-reward setups in the top 50 right now, and it is also one of the most contested. The bull case is real: council-driven enterprise volume is landing on-chain, the ETF is doing its job, and EVM opens a second growth engine. The bear case is also real: the token does not capture the network’s revenue in the way stakers on other L1s do, and enterprise blockchain narratives have died before.

    Our base case for Hedera price prediction 2026 sits at $0.14 to $0.18. That is a 45% to 90% upside from current levels, which is a serious return without needing a full mania cycle. Bulls should size position by conviction on enterprise adoption, not by hope. Bears should watch the ETF flow print each week. Both sides can be right at different points in the year, and both sides need to respect the levels.

    For a broader ecosystem comparison, our Cardano (ADA) price prediction 2026 covers another slow-and-steady L1 with a similar patience-required profile. And for the ETF-flow playbook, see how CoinMarketCap’s HBAR page tracks daily volume and holder distribution changes.

    Disclaimer: This article is for informational and educational purposes only and should not be construed as financial, investment, or trading advice. Cryptocurrency markets are highly volatile, and past performance does not guarantee future results. The price predictions and analyses presented here are based on AI models, technical indicators, and available data at the time of writing, they are not guarantees. Always conduct your own research (DYOR) and consult with a qualified financial advisor before making any investment decisions. Pump Parade and its authors do not assume liability for financial losses incurred based on information provided in this article.
    Sui Price Prediction 2026: Can SUI Reclaim $5?

    Sui (SUI) trades at $1.16 at time of writing, up 11% in the last 24 hours, 39% over the past week, and 51% over the past 30 days. That is one of the sharpest reversals in the Layer 1 market this quarter, and it is happening after two catalysts that changed the SUI narrative: the launch of confidential transfers on mainnet, and the first US-listed spot SUI ETFs from Grayscale, Canary Capital, and 21shares. The Sui price prediction 2026 conversation looks very different from where it stood in July.

    Sui still trades 78% below its January 2025 all-time high of $5.35. That gap is what makes the setup interesting. Real technology is shipping, real institutional plumbing is being built, and a token unlock schedule keeps supply pressure honest. Below we walk through where SUI stands, why it is moving, and what the bull, bear, and base cases look like for the next 12 months.

    Key Takeaways

    • SUI trades at $1.16 with a $4.77B market cap, up 51% in 30 days on the back of Nautilus privacy tech and spot ETF listings.
    • Grayscale’s GSUI staking ETF and Canary Capital’s spot SUI ETF are the first two regulated wrappers in the US, both live on NYSE Arca.
    • Sui TVL hit a record $2.6B in late 2025 and DEX volume on Bluefin and Cetus continues to compound.
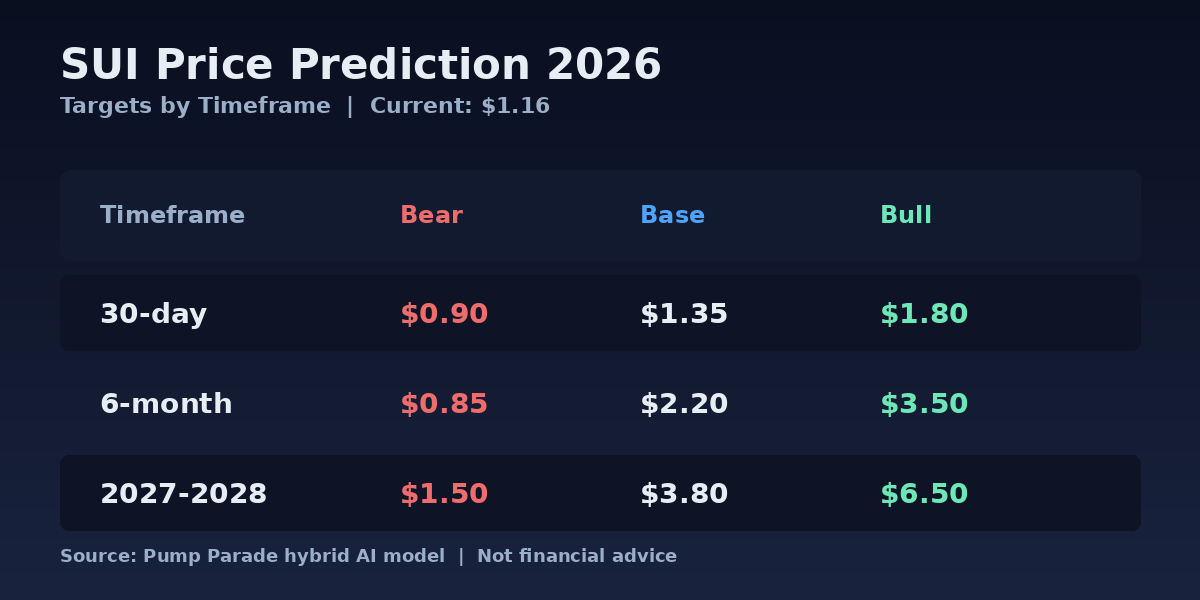
    • Base case for 2026: $2.20. Bull case: $5.00 (a full ATH reclaim). Bear case: $0.75 if unlocks outpace demand.
    • Token unlocks through 2030 remain the largest structural headwind and are the swing factor for every scenario.
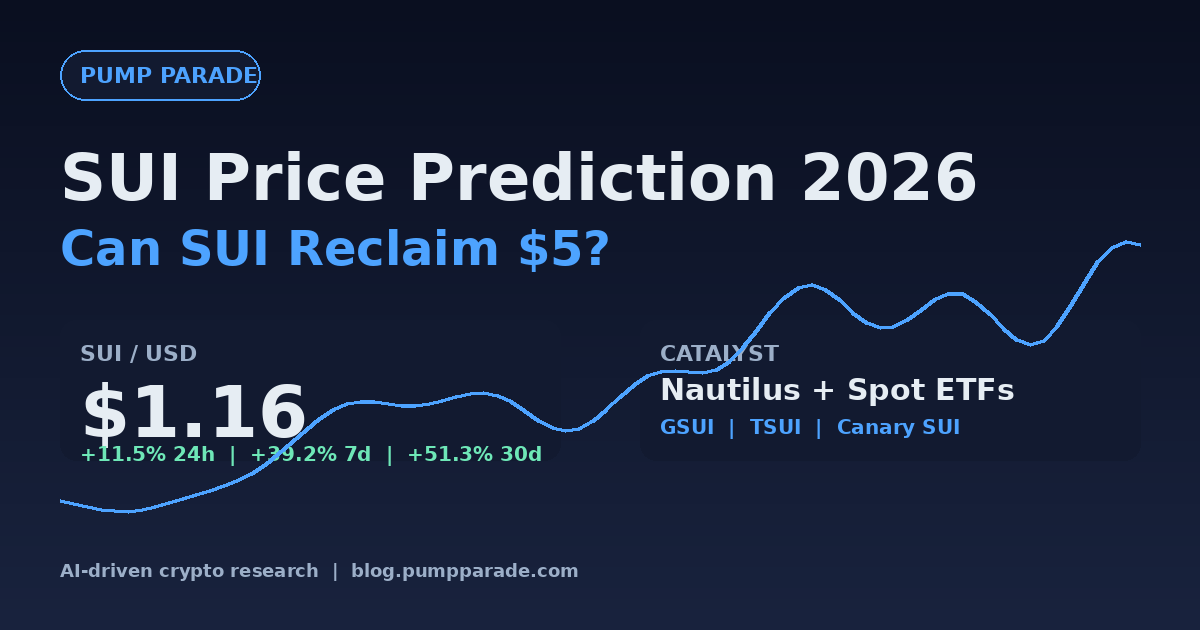
    Sui (SUI) price prediction 2026 hero graphic, current price $1.16, ETF and Nautilus catalyst

    Where does SUI stand today?

    Before the forecasting, the current-state receipts. All numbers below are from CoinGecko at time of writing.

    Metric Value
    Price $1.16
    24h change +11.5%
    7d change +39.2%
    30d change +51.3%
    Market cap $4.77B
    24h volume $1.61B
    Rank 27
    Circulating / Max supply 4.10B / 10.00B
    All-time high $5.35 (Jan 4, 2025)
    % from ATH -78.2%

    A few things stand out. Volume of $1.6B on a $4.8B cap is a 34% daily turnover, real participation, not a thin-book squeeze. The token is still deep in drawdown, which leaves headroom for mean reversion. And only 41% of the total supply is circulating. The rest hits the market on a scheduled cadence through 2030, and that is the single most important number for anyone modeling SUI.

    Why is SUI rallying right now?

    Three things are working at the same time, which is rare in altcoin markets.

    The first is the Nautilus release. Mysten Labs, the primary developer of the Sui network, shipped confidential transfers to mainnet in Q3 2026. In plain terms, users can now move value on-chain without revealing amounts to the public block explorer, while validators can still verify the transaction is valid. The pitch is “free, private payments at scale,” and it puts Sui in a very short list of L1s offering native privacy on the base layer rather than through a rollup or mixer. The market treated the news as a legitimate product event, not a marketing beat, and SUI rallied roughly 40% in the two weeks after the announcement.

    The second is the ETF wave. In February 2026, 21shares listed the first spot SUI ETF on Nasdaq under the ticker TSUI. Grayscale followed with a staking ETF, GSUI, on NYSE Arca that passes a portion of on-chain staking yield to holders. Canary Capital rounded out the group. This is the first altcoin outside of Bitcoin, Ethereum, and Solana to receive multiple US-listed spot products, and the staking wrapper in particular is a template other Layer 1 tokens will try to replicate.

    The third is DeFi traction. Sui TVL hit a record $2.6B in late 2025 and has held above $2B since, with Bluefin and Cetus splitting most DEX volume. That gives the network real fee revenue, which any long-term price thesis eventually leans on. The pattern is similar to what Solana did during its 2023-2024 recovery, when on-chain volume growth led price.

    The Bull Case for SUI

    Institutional access is now real, not hypothetical

    Every previous SUI price prediction had a placeholder for “institutional adoption.” That line item is no longer speculative. GSUI, TSUI, and Canary’s SUI ETF exist, they trade, and they can be held by registered investment advisers who could never touch a self-custody wallet. The staking wrapper is the most interesting piece. It routes network yield (currently in the 2 to 3% annualized range) into the ETF, which means TradFi allocators get exposure to both price and productive yield in a single ticker. If GSUI follows even a fraction of the inflow trajectory of the Solana ETFs after their US launch, it becomes a persistent bid.

    Privacy tech opens a genuinely new market

    Confidential transfers matter because the market for on-chain payments that do not leak business data to competitors is large and almost entirely unserved. Payroll, B2B invoicing, gaming assets, and any stablecoin flow between corporate treasuries all fit here. Sui’s implementation preserves programmability, so DeFi protocols can compose against private balances rather than being locked out. If even one high-volume stablecoin issuer settles a real payments corridor on Sui in 2026, the narrative rerates fast.

    Move VM and the parallel execution advantage

    The Move programming language and Sui’s object-centric data model let the network process independent transactions in parallel. In practice, that means Sui can execute a swap on Bluefin and a mint on a gaming app in the same slot without one blocking the other, at sub-second finality. That is a real engineering edge, and it is the same architectural bet that Solana made with Sealevel and that many other L1s including NEAR are still trying to catch. As consumer apps get built (SuiPlay handheld, wallet-native games), throughput demand is the metric to watch.

    The Bear Case for SUI

    Unlocks, unlocks, unlocks

    The single biggest risk is mechanical. Only 4.1 billion of the 10 billion max supply is circulating. The rest is scheduled to hit the market through 2030 across allocations to early contributors, the Sui Foundation, community programs, and investors. Every month, new SUI enters the float. If demand from the ETF wrappers, retail speculation, and DeFi usage does not outpace those unlocks, the price rerates lower even if fundamentals hold. This is not a hypothetical: the January 2025 ATH gave way to a 78% drawdown in large part because unlocks kept feeding supply while narrative demand cooled.

    Layer 1 competition is not standing still

    Sui competes for developer mindshare and liquidity with Solana, Aptos, Base, and a lengthening list of high-throughput chains. Solana in particular has a five-year head start on ecosystem, a much deeper memecoin economy, and its own upcoming Alpenglow upgrade targeting sub-150ms finality. If Solana consolidates the “fast L1” trade, Sui becomes a rounding error in that thesis. The Move-based sibling Aptos also draws from the same technical talent pool, and its own ETF filings are working through the pipeline.

    ETF flows can go the other way

    The staking ETF is a two-way street. If SUI grinds lower and holders start rotating out of GSUI, redemptions force the fund to sell spot into a falling market. Bitcoin ETFs had a similar dynamic during their late-2024 pullback, and Solana ETFs saw net outflows for several weeks after their launch honeymoon. There is no reason to assume SUI ETFs get a permanent bid; the first six months of flow data will tell the real story.

    Sui (SUI) Price Prediction 2026: Targets by Timeframe

    Sui (SUI) price prediction 2026 targets table, bear $0.75, base $2.20, bull $5.00

    Our targets below combine on-chain data, unlock schedule modeling, and current ETF flow trajectory. Ranges are wider than a typical equity forecast because crypto volatility justifies it. All numbers are conditional, and the conditions matter more than the numbers themselves.

    Timeframe Bear Base Bull
    30-day $0.90 $1.35 $1.80
    6-month $0.85 $2.20 $3.50
    Long-term (2027 to 2028) $1.50 $3.80 $6.50

    Short-term (next 30 days)

    Sui just broke above the $1.05 to $1.10 resistance zone that capped the July and August rallies. That level now flips to support. If it holds, a run at $1.35 to $1.50 is the base path, matching the November 2025 swing high. A failure back below $1.05 opens a mean-reversion move toward $0.90. The bull scenario at $1.80 assumes another ETF flow week north of $50M net inflows plus continued Nautilus momentum.

    Six-month outlook

    The March 2027 target of $2.20 in the base case assumes ETF flows compound modestly, Sui TVL crosses $3.5B, and no major unlock cliff surprises the market. The bull case at $3.50 requires a broader risk-on backdrop in crypto plus a marquee corporate payments announcement on Nautilus. The bear case at $0.85 is what unlocks-outpacing-demand looks like, roughly a 25% drawdown from current price.

    Long-term (2027 to 2028)

    For comparison, Changelly’s model puts 2028 SUI in a $0.91 to $1.78 band, which we consider too bearish given the ETF and privacy catalysts. Coincub’s base case reaches $6.50 by 2027, which we consider aggressive because it assumes near-perfect unlock absorption. Our $3.80 base for 2027 to 2028 sits between the two: it prices in continued ETF inflows and DeFi share gains, but it also respects the diluted supply that will be circulating by then. A full ATH reclaim to $5.35 or above is possible in a bull scenario; a $6.50 print requires Sui to become a top-15 crypto by market cap, which is not our base case.

    How does SUI compare to Solana?

    Sui’s closest competitor is Solana. Both target sub-second finality, both prioritize parallel execution, both are pushing consumer-app narratives, and both now have US spot ETFs. The differences matter for anyone deciding where to put capital.

    Metric Sui (SUI) Solana (SOL)
    Price $1.16 $120
    Market cap $4.77B $70.5B
    Virtual machine Move (Sui variant) Sealevel (SVM)
    Finality ~450ms ~400ms (Alpenglow target: 150ms)
    TVL $2.1B $11.4B
    US spot ETFs live 3 (TSUI, GSUI, Canary) Multiple
    Native privacy Yes (Nautilus) No
    Circulating supply share 41% ~85%

    Solana is 15 times larger and has a proven ecosystem. Sui is smaller, earlier, and carries more supply overhang. On a catch-up trade, SUI has more upside beta if the parallel-L1 narrative works. On an “own the winner” trade, Solana is safer. Portfolios that hold both are treating them as different bets on the same thesis.

    What would change our view?

    Three specific triggers would move us out of the current base case.

    First, if net ETF flows into GSUI, TSUI, and the Canary product cross $250M in a single month, the base case moves up to $3.00 for the six-month target. That would signal SUI has entered the “TradFi is buying” phase of its cycle.

    Second, if a scheduled unlock lands on the market and price fails to hold $1.00 within 30 days of the release, our bear case becomes the base case. We would then model $0.85 as the anchor rather than $2.20.

    Third, if a top-five stablecoin issuer announces settlement on Sui via Nautilus, we upgrade the long-term target to $7.50 in the bull case and $5.00 in the base case. That single event would validate the privacy thesis in a way no roadmap post can.

    Frequently Asked Questions

    Will SUI reach $5 by 2026?

    Our base case for 2026 is $2.20, so a $5 print by year-end would require our bull case to play out in full: sustained ETF inflows, a marquee Nautilus enterprise deployment, and a broader crypto risk-on backdrop. It is possible but not our central expectation. A $5 target is more realistic on a 2027 to 2028 timeframe, coinciding with the next cyclical peak.

    Is SUI a good investment in 2026?

    SUI is a high-volatility Layer 1 with real technology, real institutional wrappers, and real supply overhang. It fits a growth-tilted crypto portfolio for investors who can size the position small, tolerate 40% drawdowns, and hold through unlock cycles. It does not fit a portfolio that needs stable exposure or short-term liquidity.

    What is the SUI price prediction for 2026?

    Our base case has SUI trading between $1.35 and $2.20 through 2026, with a bull scenario as high as $3.50 and a bear scenario as low as $0.75. The single largest swing factor is how well ETF inflows and DeFi demand absorb the ongoing token unlocks.

    How does the Grayscale SUI ETF work?

    GSUI holds spot SUI and stakes a portion of it via network validators. Staking rewards, net of fees, accrue to the fund’s net asset value, giving holders exposure to both price and yield in one ticker. GSUI trades on NYSE Arca and is available through most US brokerage accounts.

    Will SUI reach $10?

    A $10 SUI implies a fully diluted valuation of roughly $100B at current supply schedules, which would put SUI in the top five of all crypto assets. That is possible in a full 2027 to 2028 bull cycle if Sui captures material share of consumer on-chain apps and stablecoin settlement, but it is a low-probability outcome in any 2026 timeframe.

    What is Nautilus?

    Nautilus is Mysten Labs’ name for Sui’s native privacy stack, including confidential transfers that hide transaction amounts while remaining verifiable by validators. It launched on mainnet in 2026 and is positioned as free, private payments at scale, with programmability preserved so DeFi apps can compose against private balances.

    The Honest Take

    SUI is one of the more interesting Layer 1 setups going into 2026. The Nautilus release is the kind of shipped-product event that separates a network from its slide-deck competitors. The ETF stack is real and gives TradFi a clean way to buy the story. The DeFi footprint is compounding rather than shrinking. Those are all things that were absent or aspirational a year ago.

    The counterweight is supply. Sui’s token schedule is the biggest reason competent analysts keep base cases below $3. Every month the unlocks arrive, and every month the ecosystem has to prove it can absorb them. So far the answer has been yes. Going forward it depends on whether ETF flows persist and whether Nautilus drives real fee revenue.

    Our base case for 2026 is a $2.20 anchor with a realistic path to $3.50 and a defensible floor at $0.85. That is a range, not a promise. The next six months of ETF flow data and the pace of Nautilus adoption will decide which end of the range gets tested first. For anyone comparing across L1s, the AVAX and SOL setups are also worth reviewing before sizing SUI: our full AVAX outlook covers the closest ETF-driven analog.

    Disclaimer: This article is for informational and educational purposes only and should not be construed as financial, investment, or trading advice. Cryptocurrency markets are highly volatile, and past performance does not guarantee future results. The price predictions and analyses presented here are based on AI models, technical indicators, and available data at the time of writing. They are not guarantees. Always conduct your own research (DYOR) and consult with a qualified financial advisor before making any investment decisions. Pump Parade and its authors do not assume liability for financial losses incurred based on information provided in this article.
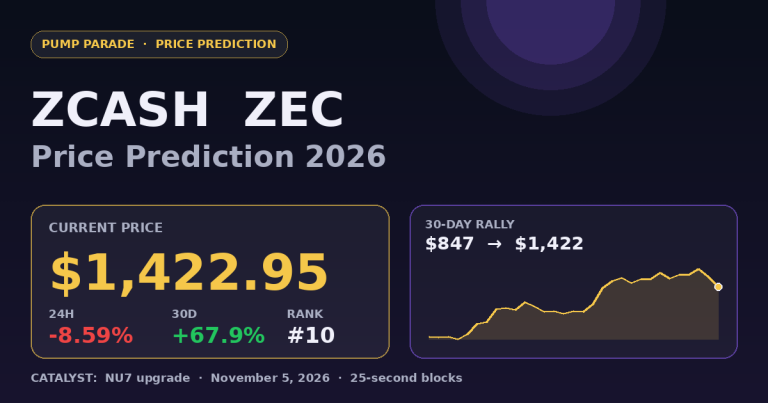
    Uniswap (UNI) Price Prediction 2026: Can UNI Hit $20?

    Every serious Uniswap price prediction 2026 model has to answer one question right now: how much of the recent 119% rally is priced in, and what’s left to run? UNI trades at $9.28 at time of writing, up 4.0% on the day and a staggering 118.8% over the past 30 days. The rally has one obvious catalyst: on December 25, 2025, UNI governance passed the UNIfication proposal with 125.3 million votes in favor and just 742 against, activating the long-awaited fee switch and authorizing a one-time burn of 100 million UNI from the treasury.

    That single vote rewired Uniswap’s economics from “protocol without cash flow” to “protocol with retained fees and a shrinking supply.” UNI holders spent years waiting for it. Now they have it, and the market is pricing the change in real time.

    This piece breaks down where UNI stands right now, the bull and bear cases you’ll want to weigh, our 30-day, 6-month, and long-term targets, and how Uniswap stacks up against its biggest DEX competitors. No hype, no shilling. Just the setup as we see it.

    Key Takeaways

    • Price snapshot: UNI at $9.28, +4.0% 24h, +118.8% over 30 days, still 79% below the May 2021 all-time high of $44.92.
    • Catalyst: The UNIfication proposal passed on December 25, 2025, activating protocol fees and burning 100 million UNI, roughly 11% of total supply.
    • Base case for 2026: $14 by mid-year, driven by fee-switch cash flow to holders and continued Unichain growth.
    • Bull case: $22.50 by mid-2026 and $35 by 2027-2028 if Uniswap defends 24% DEX market share and monthly volumes stay near the record $116B pace.
    • Key risks: The burn may already be priced in, Ethereum weakness could drag the token, and DEX competition from Aerodrome, Jupiter, and PancakeSwap is real.
    Uniswap (UNI) price prediction 2026 hero graphic, current price $9.28 after UNIfication burn catalyst

    Where Uniswap Stands Today

    Before we get to the forecast, here’s the current market snapshot for UNI, pulled from CoinGecko and cross-checked with Birdeye at time of writing.

    Metric Value
    Price $9.28
    24h change +4.00%
    7d change +1.84%
    30d change +118.81%
    Market cap $5.76 billion
    24h volume $783 million
    Market cap rank #23
    Circulating supply 620.58 million UNI
    All-time high $44.92 (May 2021)
    % from ATH -79.3%

    The chart is doing something UNI has not done since 2021: it is trending, not chopping. A 118% move in a month, followed by a week of sideways consolidation above $9, is the profile of a token that has attracted fresh buyers and is now looking for a reason to continue. The catalyst that pulled those buyers in is now on-chain and permanent.

    Why Is UNI Rallying Right Now?

    The short answer: UNIfication. For the first time in Uniswap’s history, protocol-level trading fees flow to the treasury instead of only to liquidity providers, and 100 million UNI have been removed from circulation.

    Numbers help. Uniswap processes roughly $88 billion in trading volume every 30 days across 36 chains, and monthly volume set a record at $116.6 billion in October 2025 according to CoinLaw’s protocol data. Even a low single-digit fee take on that flow generates hundreds of millions in annualized protocol revenue. That is not speculative future value. It is cash flow the protocol can now capture, starting today.

    Layer that against a supply schedule that just shrank by ~11%, and you understand the setup. The market spent years asking “when do UNI holders actually get paid?” On December 25, 2025, that question got a concrete answer. The move from $4.25 to $9.28 is the initial repricing.

    The Bull Case for UNI

    1. The Fee Switch Turns UNI into a Cash-Flow Asset

    UNIfication is not a marketing event. It is a change in what the token represents. Before the vote, UNI was a governance token with optional future revenue. After the vote, it is a claim on a protocol that generates real fee revenue and burns supply. Traders and long-term holders price these two versions of the asset very differently. Historically, protocols with active fee accrual (think Ethena, Hyperliquid, Aave) trade at multiples of protocols without it. The data suggests UNI is in the early innings of that re-rating.

    2. Unichain Is Winning L2 Share

    Uniswap’s own Layer 2, Unichain, contributes over $532 million in TVL and handles nearly 50% of v4 transaction volume. Layer 2 networks account for over 65% of daily volume on Uniswap according to SQ Magazine’s DEX statistics. Every trade that migrates from Ethereum mainnet to Unichain captures more of the fee stack for the Uniswap Foundation, and every dollar of TVL that lands on Unichain is one less dollar of liquidity for competing L2s like Arbitrum. The Unichain flywheel is the medium-term growth story.

    3. DEX Volumes Are at Record Highs

    Uniswap holds about 24.1% of total DEX spot volume across all chains. That share is defended, not eroding. If crypto sees a broader risk-on move in late 2026, DEX volumes historically compound faster than centralized exchange volumes because on-chain traders rotate more aggressively into new tokens. UNI is the highest-liquidity way to express that thesis.

    The Bear Case for UNI

    1. The Burn Might Already Be Priced In

    A 118% move in 30 days is not a “quiet accumulation.” It is repricing. If the fee switch delivers protocol revenue that beats expectations, the rally continues. If it disappoints (because volumes soften, or because the fee take is smaller than the market modeled), the reaction could be sharp. Bitget Research already flagged that the fee switch is live and 100 million tokens are burned, but the price still hit a cycle low earlier in the process. Narrative timing and price timing rarely line up cleanly.

    2. Competition Is Not Standing Still

    Aerodrome dominates Base. Jupiter aggregates Solana. PancakeSwap holds BSC. Every one of these DEXs is fighting for the same fee dollars. Uniswap’s mainnet dominance is unquestioned, but the highest-volume chains of 2026-2028 may not be Ethereum mainnet. If Base or Solana grow faster than Unichain, UNI’s fee capture caps out even in a good market.

    3. Ethereum Weakness Drags UNI

    ETH trades near $2,696, well below its 2021 highs. Historical correlation between UNI and ETH sits above 0.75 on weekly returns. A prolonged period of ETH underperformance versus SOL, BTC, and stablecoin yield is a headwind UNI cannot fully escape, no matter how well the protocol executes. For context on ETH’s own setup, our Ethereum price prediction 2026 lays out where the base layer needs to be for altcoin beta to work.

    Uniswap Price Prediction 2026: Targets by Timeframe

    Uniswap UNI price prediction 2026 targets table, bear $6, base $14, bull $22.50 by 6 months

    Here is how our AI model, blended with technical and on-chain signals, breaks out the next several timeframes. Every target is a scenario, not a promise. Predictions come with conditions attached, and we specify each one.

    30-Day Outlook

    Short-term, UNI has to hold the $8.50 support zone. That was the breakout level in early September and it now sits as reclaimed resistance turned support. Momentum indicators are cooling off from overbought after the 118% run, so a period of sideways-to-slightly-lower price action is the base case.

    • Bear: $7.20 if the $8.50 level breaks and momentum unwinds toward the pre-catalyst range.
    • Base: $10.50 as the market digests the burn and volume tapers into a healthy consolidation.
    • Bull: $14.80 if fee revenue prints strong in the first full month post-activation and momentum traders pile in.

    6-Month Outlook (Mid-2026)

    By mid-2026, the fee switch will have generated at least two quarters of on-chain revenue data. That is when the market moves from pricing the narrative to pricing the actual cash flow. This is also the window most SERP competitors are targeting with their “2026 forecast” ranges (Changelly, Coincheckup, Binance research all cluster their base-case 2026 targets between $10-$20).

    • Bear: $6.00 if the burn fails to translate into meaningful protocol revenue and ETH slides toward $2,000.
    • Base: $14.00 as Uniswap prints its first full “fee-earning” quarter and Unichain TVL crosses $1 billion.
    • Bull: $22.50 if DEX volume compounds, altseason kicks in, and UNI re-rates as a top-5 DeFi cash-flow asset.

    Long-Term Outlook (2027-2028)

    Longer term, UNI’s ceiling depends on two variables: how much of global spot volume moves on-chain, and how much of that on-chain volume Uniswap keeps. If the answer is “a lot” and “most,” a return toward the $30-$40 zone (still below the 2021 ATH) is not unreasonable.

    • Bear: $5.50 in a prolonged DeFi bear market with CEX consolidation.
    • Base: $18.00 assuming steady fee accrual and defended market share.
    • Bull: $35.00 in a full altseason with Uniswap as the flagship DeFi cash-flow trade.

    How Does Uniswap Compare to Aerodrome and PancakeSwap?

    Uniswap is the DEX benchmark, but it is not the only game in town. Here is how UNI stacks up against two of its most credible competitors on the metrics that matter for a 2026 investment thesis.

    Metric Uniswap (UNI) Aerodrome (AERO) PancakeSwap (CAKE)
    Primary chain Ethereum + Unichain Base BNB Chain
    Market cap rank #23 Outside top 100 Outside top 100
    30d DEX volume ~$88B (36 chains) ~$8B (Base only) ~$15B (multi-chain)
    Fee switch active Yes (Dec 2025) Yes (ve-token model) Yes (auto-burn)
    Own L2 Yes (Unichain) No No
    Institutional pipeline Deep (Foundation, VCs) Native to Base Retail-heavy
    Token supply direction Deflationary (100M burn + fees) Emission-heavy Deflationary (auto-burn)

    Translation: Uniswap has the deepest liquidity, the biggest institutional footprint, and now the strongest tokenomics story. Aerodrome wins on Base-native positioning, PancakeSwap wins on BSC. If you want the pure “DeFi cash flow” trade in 2026, UNI is the highest-conviction expression. If you want higher beta on a specific ecosystem, the smaller DEX tokens can outperform in bursts.

    What Would Change Our View on UNI?

    Three things would force us to move our targets, and we watch these weekly.

    1. Protocol revenue underperforms expectations. If the first two quarters of live fee-switch data come in at less than $100 million in annualized protocol revenue, the “cash-flow re-rating” thesis weakens and the base case moves toward the bear scenario.

    2. Unichain TVL stalls below $750 million. The flywheel needs Unichain to compound. If TVL plateaus, competing L2s will chip away at Uniswap’s fee capture and the bull case gets much harder to defend.

    3. A major regulatory action against DEX front-ends. The SEC has not been quiet on DeFi. A meaningful enforcement action or restrictive rule could trigger a rerating for every DEX token, UNI included, regardless of protocol fundamentals.

    Frequently Asked Questions

    Will UNI reach $20 in 2026?

    Our base case for mid-2026 is $14, with a bull case at $22.50. Reaching $20 by end of 2026 requires two things: the fee switch generating strong protocol revenue that the market is willing to capitalize at DeFi multiples, and a broader altcoin rally that lifts DEX-token sentiment. The probability favors that range being tested, not guaranteed to hold.

    Is Uniswap a good investment in 2026?

    UNI has a clearer investment thesis in 2026 than at any point since launch. Protocol fees now accrue to the treasury, 100 million tokens were burned, and the protocol dominates DEX market share. The risk is that a 118% one-month rally already prices much of that in. For long-term holders, the setup is credible. For short-term traders, wait for confirmation of a healthy consolidation before adding.

    What is the UNIfication proposal and how does it affect UNI price?

    UNIfication is the governance proposal that activated protocol fees and authorized a 100 million UNI burn from treasury. It passed on December 25, 2025 with 125.3 million UNI voting in favor. For price, it converts UNI from a governance token into a cash-flow asset, which historically commands higher valuation multiples. It also permanently reduced supply by roughly 11%.

    How does Uniswap make money now that the fee switch is on?

    Uniswap now retains a portion of trading fees at the protocol level, in addition to fees flowing to liquidity providers. On roughly $88 billion in 30-day volume across 36 chains, even a small fee take generates hundreds of millions in annualized revenue. Uniswap Labs discontinued frontend fees as part of the same proposal, consolidating value capture at the protocol layer.

    What is the highest UNI has ever been?

    UNI’s all-time high is $44.92, set on May 2, 2021. At the current price of $9.28, UNI is 79.3% below that peak. Returning to the ATH would require a further 384% move from here, which is possible in a full altcoin bull cycle but not the base case for the next 12-18 months.

    The Honest Take

    UNI is the cleanest DeFi cash-flow trade in the market today. The fee switch is not a promise anymore, it is on-chain reality. The 100 million UNI burn is done. Unichain is compounding. Volumes are at record levels. That is the bull case, and it is a real one.

    The counter-argument is equally honest. A 118% move in 30 days is a lot of “front-run the narrative” buying. Real cash-flow data will not print for another quarter. Competition is patient and well-capitalized. Ethereum’s own struggles cap UNI’s beta.

    The risk-reward favors a base case in the $14 range by mid-2026 with meaningful upside to the low-$20s if the fee switch executes cleanly. Position size accordingly, respect the $8.50 support level, and remember that the best DeFi trades come from patience, not chasing.

    Disclaimer: This article is for informational and educational purposes only and should not be construed as financial, investment, or trading advice. Cryptocurrency markets are highly volatile, and past performance does not guarantee future results. The price predictions and analyses presented here are based on AI models, technical indicators, and available data at the time of writing, they are not guarantees. Always conduct your own research (DYOR) and consult with a qualified financial advisor before making any investment decisions. Pump Parade and its authors do not assume liability for financial losses incurred based on information provided in this article.
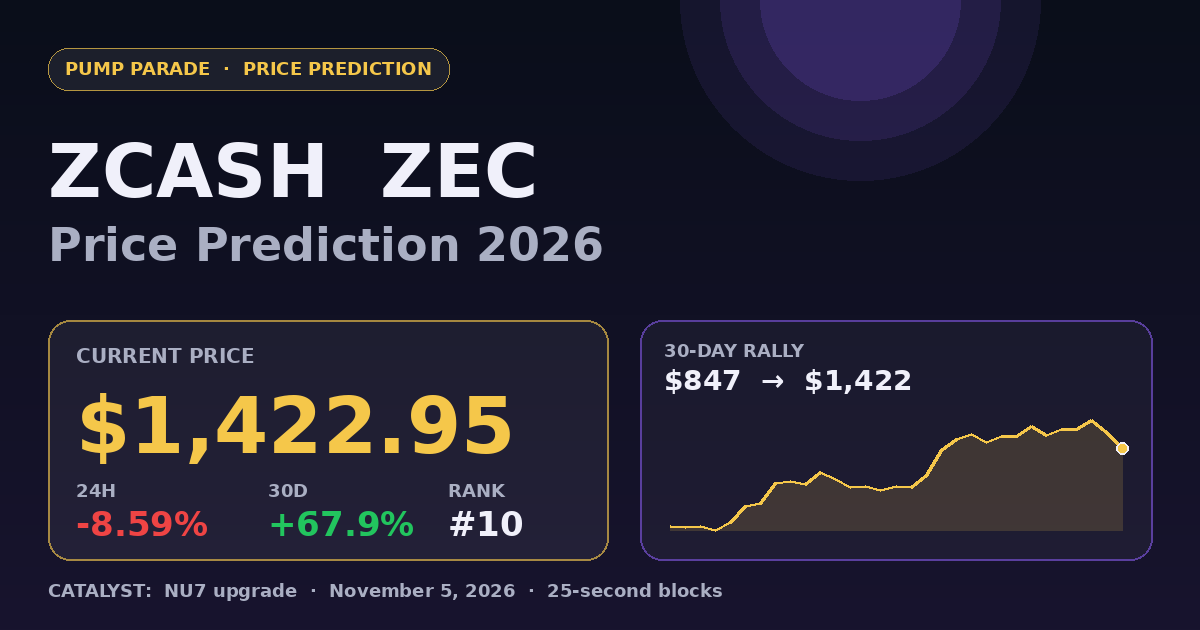
    Avalanche (AVAX) Price Prediction 2026: Can AVAX Hit $25?

    Avalanche (AVAX) trades near $10.14 as of September 25, 2026, up roughly 31% over the past seven days and 37% over the past month. The move puts AVAX back on serious price-prediction radars for the first time since the 2024 bull cycle. This Avalanche price prediction 2026 breakdown looks at what changed, what still has to go right, and where realistic bear, base, and bull cases land by year-end.

    The catalyst mix is different this time. VanEck’s spot AVAX ETF (VAVX) launched in January 2026 with staking exposure of up to 70%, Bitwise and Grayscale followed with their own filings, and tokenized real-world assets on Avalanche L1s crossed the $3 billion mark. Combine that with the Avalanche9000 upgrade cycle finishing rollout, and the setup is more institutional than any prior AVAX rally.

    Below: current-price context, three named bull catalysts, three named bear risks, price targets by timeframe, an AVAX vs SOL comparison table, and answers to the questions people actually search.

    Key Takeaways

    • Spot price: AVAX at $10.14, up 31% in 7 days, down 93% from the 2021 ATH of $144.96.
    • Bull case: $28 by end of 2026 if ETF flows compound, RWA TVL doubles, and BTC holds above $80k.
    • Base case: $18 with steady L1 launches and moderate ETF adoption.
    • Bear case: $5.90 if macro tightens, ETF flows disappoint, and RWA growth stalls.
    • Key catalysts: VanEck VAVX staking ETF, Avalanche9000 completion, 100+ live L1 subnets.
    • Watch: $9.90 support and $12.50 resistance for near-term direction.
    Avalanche (AVAX) price prediction 2026 hero graphic, current price $10.14 with VanEck ETF and Avalanche9000 catalyst

    Where Does Avalanche Stand Today?

    Before we forecast anything, the market snapshot. All figures live from CoinGecko and Birdeye as of September 25, 2026.

    Metric Value
    Price $10.14
    24h change -0.8%
    7d change +31.3%
    Market cap $4.49B
    24h volume $556M
    Market cap rank #28
    All-time high $144.96 (Nov 2021)
    % from ATH -93.0%
    Circulating supply 443M / 720M max

    Translation: AVAX is a mid-cap by 2026 standards, sitting well inside the top 30 but nowhere near cycle highs. That gap is the whole story. A move to $25 would still leave it 83% below the ATH, so the target is ambitious but not extraordinary in crypto terms.

    Why is Avalanche Rising Right Now?

    Three forces converged in September. First, ETF flow expectations firmed up after VanEck’s VAVX crossed a small but symbolic $1.1 million in launch-week net inflows, and Bitwise updated its BAVA filing to include staking exposure of up to 70%. Second, Ava Labs published data showing tokenized RWA value on Avalanche L1s crossed $3 billion, with Midas launching mWIN (a tokenized Wellington Management fixed-income strategy) as the flagship example. Third, the Avalanche9000 upgrade cycle, which reworks subnet economics and slashes L1 launch costs, finished rolling out to mainnet.

    The technicals reflect the news. AVAX broke through $9.20 resistance on above-average volume, and RSI on the daily chart is stretched near 74, which is the level where overbought pullbacks typically start. If you missed the move, chasing it here is the wrong tactic. Waiting for a reset toward $9.20 to $9.90 makes more sense.

    The Bull Case for AVAX

    1. Spot AVAX ETFs with staking exposure

    VanEck launched VAVX in January 2026 as the first US spot Avalanche ETF, and both Bitwise (BAVA) and Grayscale filed updated S-1s with staking exposure of up to 70% of holdings. That structure matters. A staking-enabled ETF passes yield through to the fund, which raises the effective return relative to a pure-price product. If aggregate AVAX ETF assets reach even 10% of the current spot ETH product levels, that alone is roughly $1B in net demand against a $4.5B market cap.

    2. Real-world asset tokenization crossing $3B on Avalanche L1s

    Avalanche’s L1 architecture (formerly Subnets) is purpose-built for institutional issuers who want a permissioned execution environment with public settlement. The mWIN launch showed the pipe works: a regulated asset manager can tokenize a real strategy, deploy it on an Avalanche L1, and get liquidity via bridged versions. If RWA TVL doubles to $6B by end of 2026, fee accrual back to the C-Chain (and to AVAX holders via staking) becomes a real revenue story rather than a narrative.

    3. Avalanche9000 finishing the L1 economics overhaul

    Avalanche9000 dropped the initial capital cost of launching an L1 by roughly 99%. That is the single biggest reason 100+ new L1s launched in the twelve months following. More L1s means more validators, more AVAX staked, and more transaction fees. The compounding is slow, but if the base rate of L1 launches holds, network revenue scales without needing a memecoin cycle.

    The Bear Case for AVAX

    1. ETF flows disappoint

    The first week of VAVX was measured in seven figures, not eight or nine. Compare that with spot BTC ETFs, which pulled in billions in launch week. If AVAX ETF assets plateau at $200M to $500M and never crack $1B, the institutional-demand thesis loses its edge. The single most important thing to watch through Q4 is weekly VAVX and BAVA net flow data.

    2. L1 competition from Solana, Base, and Hyperliquid

    Solana still owns the retail throughput narrative, Base owns Coinbase-integrated distribution, and Hyperliquid owns perp DEX flow. Avalanche’s edge is customization, but customization is a harder sell than fees or TPS in a headline. If Solana ETFs launch with better initial flows, AVAX loses relative capital rotation share.

    3. Macro tightening or a crypto-wide drawdown

    AVAX has a beta near 1.5x versus BTC on the downside. A retest of $70k on BTC (currently $84k) would drag AVAX toward the $6 to $7 zone regardless of ETF flows or RWA growth. The bear case is not internal to Avalanche. It is macro plus positioning.

    Avalanche Price Prediction 2026: Targets by Timeframe

    Avalanche AVAX price prediction 2026 targets table, bear $5.90 base $18 bull $28 by year end

    Next 30 days (October 2026)

    With RSI stretched near 74, near-term risk is a pullback before continuation. Bear: $7.50. Retest of the breakout zone plus a broader risk-off week. Base: $11.50. Sideways digestion, buyers step in above $10. Bull: $14.00. ETF flow acceleration plus fresh L1 launch headlines.

    Six months (through March 2027)

    Bear: $6.80. BTC rolls over to $70k, ETF flows dry up, RWA growth stalls. Base: $14.00. Modest ETF adoption, steady L1 pipeline, macro flat. Bull: $22.00. Multiple ETF providers live, VAVX aggregate AUM above $1B, RWA TVL past $5B.

    End of 2026

    Bear: $5.90. The break-below level cited by Bernstein and K33 as the bull-thesis invalidator. Base: $18.00. Aligned with the mid-point of Coinpedia and Cryptopolitan’s ranges. Bull: $28.00. Requires all three catalysts to fire and a benign macro. Standard Chartered and PrimeXBT sit lower than this at $7 to $16, so the bull case is above consensus.

    Long term (2027 to 2028)

    Reasonable outcomes span $25 (base) to $55 (bull) if RWA and L1 flywheels compound. A retest of the $145 ATH requires either an entirely new use case or a much larger crypto market cap than today’s $3T. Anchor to fundamentals, not to price memory.

    For comparison and further context, see CoinMarketCap’s AVAX AI forecast and Changelly’s multi-year Avalanche projection.

    How Does Avalanche Compare to Solana?

    The closest peer trade is AVAX vs SOL: both are high-throughput L1s, both have live spot ETFs (or ETF pipelines), and both trade primarily on ecosystem growth narratives. Snapshot as of September 25, 2026:

    Metric Avalanche (AVAX) Solana (SOL)
    Price $10.14 $116.66
    Market cap $4.5B $68.6B
    7d change +31% +14%
    Architecture Multi-chain L1s, EVM Monolithic, Sealevel
    Base-layer TPS (real) ~4,500 finalized ~3,000 to 4,000
    Median fee $0.02 $0.001
    Spot ETF (US) VAVX live (Jan 2026) Multiple live
    Core strength RWA, custom L1s Retail throughput, memes

    The honest read: SOL has 15x the market cap and deeper developer base, but AVAX has more room per dollar if institutional RWA continues onboarding. They are not a zero-sum trade. See our Solana price prediction 2026 for the other side of the comparison.

    What Would Change Our View

    Three specific triggers would move us off the base case.

    • Bullish shift ($22+ target): Aggregate US spot AVAX ETF AUM crosses $1B before end of Q1 2027 AND Avalanche RWA TVL crosses $6B.
    • Bearish shift ($6 target): AVAX closes weekly below $5.97, which was Bernstein’s cited invalidation level.
    • Neutralizing event: A material Solana narrative reversal (regulatory or technical) that redirects institutional L1 flows toward Avalanche instead.

    Frequently Asked Questions

    Will Avalanche reach $25 in 2026?

    It is possible but not the base case. A move to $25 requires spot AVAX ETF assets crossing $1B, RWA TVL on Avalanche doubling to $6B+, and BTC holding above $80k through year-end. Our base target is $18, with $25+ reserved for the bull scenario.

    Is Avalanche a good investment in 2026?

    AVAX offers institutional exposure to a top-30 L1 with a live spot ETF, RWA traction, and a defined technical roadmap. Risk-reward is asymmetric at current prices if ETF flows continue, but it remains a high-volatility asset that should be sized accordingly within a diversified portfolio.

    What is the Avalanche price prediction for 2026?

    Our range for end of 2026 spans $5.90 (bear) to $28.00 (bull), with a base case of $18.00. This bracket sits between conservative models like Coinbase ($7 to $8) and aggressive models like Coinpedia ($20 to $80).

    Can AVAX hit $100 again?

    Not in 2026 under any of our scenarios. A return to $100+ requires either a new use-case narrative bigger than RWA, or a total crypto market cap materially above $5T. Realistic timeframe for a triple-digit retest is 2027 to 2028 in bull-cycle conditions.

    How does AVAX staking work with the new ETFs?

    Both VAVX and BAVA can stake up to 70% of held AVAX and pass a portion of the rewards through to the fund, which offsets sponsor fees. Retail can still stake AVAX directly for higher yield, but ETFs offer regulated exposure without validator selection.

    What is the biggest risk to Avalanche in 2026?

    ETF flow disappointment. If aggregate AVAX ETF AUM plateaus below $500M by Q2 2027, the institutional-demand thesis loses its edge and AVAX likely reverts toward $7. Watch weekly VAVX and BAVA net flow data. It is the single highest-signal metric.

    The Honest Take

    Avalanche in September 2026 looks like a functional institutional bet, not a moonshot memecoin. The setup is: real ETF products live, real RWA volume on-chain, a real technical roadmap finishing, and a price that is 93% below cycle high. That combination should push a base case higher over 12 months.

    But three things need to happen. ETF flows have to compound rather than plateau. Solana cannot steal the institutional L1 narrative outright. And macro needs to stay at least neutral. Miss on any one and the target compresses toward $10 to $14. Miss on two and the bear case is live.

    For monitoring, we track weekly VAVX net flows (Bloomberg or issuer disclosures), Avalanche L1 TVL (DefiLlama), and BTC’s hold of the $80k zone. That trio decides most of the AVAX story from here. If you want related coverage, see our Ethereum price prediction 2026 and Chainlink price prediction 2026 for context on the broader institutional-crypto trade.

    Disclaimer: This article is for informational and educational purposes only and should not be construed as financial, investment, or trading advice. Cryptocurrency markets are highly volatile, and past performance does not guarantee future results. The price predictions and analyses presented here are based on AI models, technical indicators, and available data at the time of writing. They are not guarantees. Always conduct your own research (DYOR) and consult with a qualified financial advisor before making any investment decisions. Pump Parade and its authors do not assume liability for financial losses incurred based on information provided in this article.
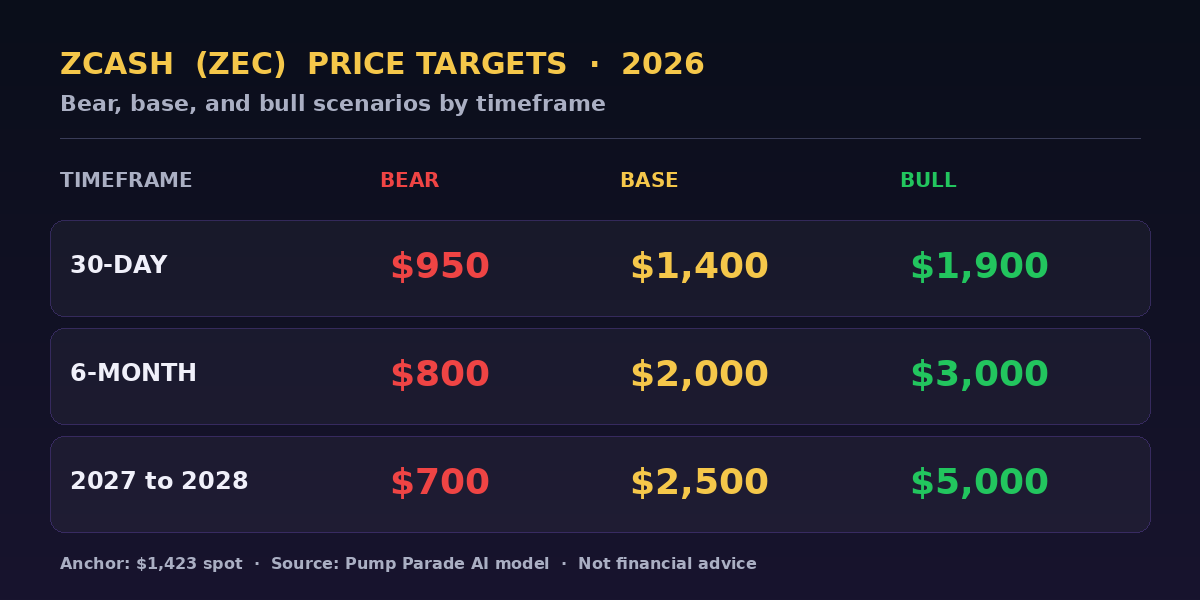
    Pump.fun Review 2026: Fees, Features & Verdict

    0

    Pump.fun review 2026 cover

    Two years after it turned Solana into the world’s memecoin casino, is Pump.fun still the best place to launch or trade a coin in 2026? The platform now processes over $115 million in daily DEX volume, has generated more than $1.23 billion in cumulative fees, and just crossed $364 million in cumulative buybacks for its own $PUMP token. But it also faces real competition from newer launchpads, new PumpSwap fee tiers, and a memecoin market that looks nothing like the frenzy of 2024.

    In this Pump.fun review we walk through the fees you actually pay, the features that matter (bonding curve, PumpSwap, Mayhem, holder rewards), the security track record, the user experience, and where Pump.fun still wins versus where it is starting to lag. Numbers below are pulled from Pump.fun’s official fee docs and DefiLlama, dated late September 2026.

    Quick verdict: is Pump.fun worth using in 2026?

    Rating: 4.2 / 5. Pump.fun is still the default launchpad on Solana. Nothing else comes close on liquidity, active addresses (154,813 in the last 24 hours) or graduation flow into a dedicated AMM. Total fees on the bonding curve are 1.25%, which is fair given the depth you get. The catch: the memecoin narrative has cooled since Q1 2025, PumpSwap fees on smaller-cap coins are still steep at 1.25% total, and creator payouts introduce their own gaming problems.

    Use Pump.fun if you want the deepest memecoin liquidity on Solana, a token that can graduate straight into an AMM pool with a fee rebate to the creator, and one of the strongest buyback programs in crypto. Skip it if you are launching a serious project with real utility, a vesting schedule or team allocations. That is not what Pump.fun is built for.

    What is Pump.fun?

    Pump.fun is a Solana-native memecoin launchpad that lets anyone create a fungible token in one click, with zero upfront cost and no presale, no team allocation, and no seeded liquidity. Every new coin is instantly tradable on a bonding curve. Once a coin’s bonding curve fills up (roughly the point where its market cap crosses the graduation threshold), the coin “graduates” to PumpSwap, Pump.fun’s own AMM, where it trades in a canonical pool with variable fees based on market cap.

    Official Pump.fun brand art featuring the platform mascot

    The platform launched in early 2024 on Solana, ran its $600 million public token sale in July 2025, and rolled out a series of new products through 2026: PumpSwap (its AMM), Mayhem mode (a faster, higher-fee trading track), Holder rewards for $PUMP stakers, GO (a discovery product), and Terminal (a pro trading interface routed through Padre). USDC-denominated launches went live in May 2026, so you can now pair new coins against USDC instead of only SOL.

    Key stats at a glance

    • DEX volume, 30 days: $2.715 billion
    • DEX volume, cumulative: $97.933 billion
    • Fees, 30 days: $46.03 million
    • Cumulative fees: $1.236 billion
    • Protocol revenue, 30 days: $33.26 million
    • Holders revenue (PUMP buybacks), cumulative: $364.44 million
    • Active addresses (24h): 154,813
    • Transactions (24h): 3.25 million
    • Chain: Solana only

    All figures via DefiLlama as of September 2026.

    Features deep dive

    Bonding curve launches

    Creating a coin costs zero SOL and zero USDC. You give it a name, a ticker, an image and an optional description, and the platform deploys the SPL token and seeds a bonding curve on Pump.fun’s own AMM logic. Anyone can buy from the curve immediately, prices rise as more SOL (or USDC) flows in, and there is no presale for the team, no lockup and no allocation.

    Once a coin’s market cap crosses the graduation threshold (roughly $69K in the SOL-denominated curve historically, though the specific number floats with SOL price), the bonding-curve liquidity is migrated to a canonical PumpSwap pool. The migration itself costs 0.015 SOL, paid out of the curve.

    PumpSwap AMM

    PumpSwap is Pump.fun’s in-house automated market maker. Every graduated coin gets a canonical pool where the fee schedule scales down as market cap grows. Small graduated coins pay 1.25% total fees, which drops in steps down to 0.30% for tokens above 98,240 SOL of market cap. On USDC-denominated tokens the schedule mirrors the same idea but calibrated in dollars, from 1.25% at launch to 0.30% above $20M market cap.

    Non-canonical pools (any PumpSwap pool that was not created via a graduation) charge a flat 0.3% total, of which 0.25% goes to LPs and 0.05% is protocol revenue. This makes PumpSwap surprisingly competitive with Raydium and Orca for pools that never touched the launchpad.

    Mayhem mode

    Mayhem is Pump.fun’s higher-intensity trading lane, launched in Q4 2025. It targets scalpers and bot traders who want faster execution and are willing to pay extra fees for it. In Q3 2026, Mayhem generated an estimated $671,790 in fees, small next to the main bonding curve but a useful revenue diversifier.

    $PUMP token and holder rewards

    Pump.fun raised $1 billion for the $PUMP token in July 2025, $600 million in a public ICO and $400 million in a private round. The token has one of the most aggressive buyback programs in crypto right now: Pump.fun uses protocol revenue to buy $PUMP off the open market and burn it. Cumulative buybacks through Q3 2026 stand at roughly $364.44 million, with $58.92 million bought back in the current quarter alone.

    Holder rewards, launched in 2026, let $PUMP holders stake into a rewards program that streams a slice of protocol revenue. If you believe Pump.fun’s fee machine keeps humming, holding and staking $PUMP is a way to compound alongside the platform.

    GO discovery and Terminal

    GO is Pump.fun’s discovery feed for finding new coins. Terminal, at trade.padre.gg, is a pro trader interface built on top of Pump.fun and PumpSwap that adds charting, hotkeys and better order flow.

    Revenue history: the boom, the correction, the rebuild

    Pump.fun gross protocol revenue by quarter from Q3 2024 to Q3 2026

    Pump.fun’s revenue arc tells you everything about the memecoin market. Revenue exploded from $63.5M in Q3 2024 to a peak of $263.8M in Q1 2025, on the back of the Solana memecoin mania. It then corrected hard as the market cooled, bottomed near $79.2M in Q2 2026, and is now rebuilding: Q3 2026 is already tracking above $108M, with the quarter not yet complete.

    Even at the trough, Pump.fun was still one of the most profitable protocols in crypto. Compare that revenue base to almost any L1 or DeFi protocol and it is remarkable how much cash a single memecoin launchpad throws off.

    Fees and pricing

    Here is a clean, no-nonsense breakdown of what you actually pay.

    Bonding curve trades (SOL or USDC)

    • Creator fee: 0.300%
    • Protocol fee: 0.950%
    • LP fee: 0.000%
    • Total: 1.250%

    PumpSwap canonical pool (post-graduation, SOL-denominated)

    • Total fee: 1.25% at launch, sliding down to 0.30% for tokens above 98,240 SOL market cap
    • Sweet-spot tier: at 4,420 to 9,820 SOL market cap, total fee is 1.00% (0.75% creator, 0.05% protocol, 0.20% LP)

    PumpSwap non-canonical pool

    • Creator: 0.00%
    • Protocol: 0.05%
    • LP: 0.25%
    • Total: 0.30%

    Other

    • Create a coin: 0 SOL / 0 USDC
    • Graduation fee: 0.015 SOL
    • The pump.fun web app, /advanced view and mobile app do not add any surcharge. Third-party frontends and bots may. See the official Pump.fun fee schedule for the full tier table.

    Pros

    • Deepest memecoin liquidity on Solana. $2.715B in monthly DEX volume, 154K daily active addresses. Nothing on Solana comes close.
    • Zero upfront cost to launch. No creation fee. No seeded liquidity requirement. You can go from an idea to a live tradable coin in under a minute.
    • Serious buyback program. $364M cumulative $PUMP buybacks give the token real, cash-backed demand.
    • Creator revenue share. Coin creators earn 0.30% on bonding-curve trades and up to 0.95% on graduated pools, aligning incentives.
    • USDC pairing. As of May 2026 you can launch and trade against USDC, which reduces SOL price exposure for coin creators.
    • Solid mobile app. Pump.fun’s iOS and Android apps are polished and let you trade in seconds from your phone.

    Cons

    • Memecoin-only. This is not a launchpad for serious projects. If you need vesting, team allocations or a proper tokenomics design, look elsewhere.
    • 1.25% bonding-curve fee is high. Especially for scalpers doing hundreds of trades a day. A round trip costs 2.5% before slippage.
    • Winner-take-all dynamics. Fewer than 1% of coins graduate. Most memecoins launched on Pump.fun go to zero within hours.
    • One historical security incident. May 2024 key-compromise exploit drained roughly $1.9M. Small in the scheme of things and long since patched, but worth noting.
    • Solana-only. No Ethereum, Base or L2 support. If you want cross-chain, Pump.fun is not the answer.

    Security and trust

    Pump.fun’s smart contracts are open source and have been battle-tested at extraordinary scale, processing over 3.25 million transactions in a single day. The platform has one recorded security incident: a private key compromise on May 16, 2024 that resulted in a $1.9M loss. The team patched the issue, rotated keys and has run cleanly since. Given the platform has processed nearly $98 billion in cumulative volume, that is a strong track record.

    The bigger risk is not smart-contract risk, it is trader risk. Memecoin markets are volatile, coins can rug or be abandoned by their creators, and the vast majority of tokens on Pump.fun lose money for buyers. Trade small, expect to lose it, and never chase.

    User experience

    Pump.fun’s web app is one of the best-looking product experiences in crypto. It is fast, dark-themed by default, and the “Explore” and “Live” feeds make finding new coins genuinely fun. The mobile app is even better if you trade quickly, with hotkey-style buys and sells, wallet-connect via Phantom or Backpack, and real-time notifications.

    Onboarding is friction-free. Connect a Solana wallet, fund it with SOL or USDC, and you are trading in under a minute. Compared to filling out KYC on a centralized exchange like Kraken or Coinbase, the difference is night and day.

    How Pump.fun compares to alternatives

    The launchpad category has fragmented in 2026. Pump.fun still commands the vast majority of Solana launchpad revenue, but newer entrants like Rise.rich, boop.fun and Token Mill have carved out niches. For raw volume and network effects, nothing on Solana touches Pump.fun. For Ethereum or Base memecoins, look at Believe, Virtuals or Moonshot.

    If you are choosing a trading tool to trade Pump.fun coins rather than the platform itself, we have covered several: see our Photon vs BullX comparison and our GMGN vs Trojan comparison for the best routing bots.

    Verdict: who should use Pump.fun in 2026?

    Rating: 4.2 / 5.

    Use Pump.fun if: you are a Solana-native trader hunting memecoins, a creator who wants to launch a coin with zero friction and no upfront cost, or a $PUMP holder who wants exposure to the leading launchpad’s fee flywheel and buyback program.

    Skip Pump.fun if: you are launching a serious project with utility, need vesting or team allocations, want cross-chain exposure, or are risk-averse. Memecoins on any platform are gambling, and Pump.fun does not pretend otherwise.

    Ready to try it? Visit Pump.fun and connect a Solana wallet. Start with a small amount, expect volatility, and treat every trade as a speculative bet, not an investment.

    FAQ

    Is Pump.fun safe to use?

    Pump.fun’s smart contracts have processed nearly $98B in cumulative volume with only one recorded exploit ($1.9M in May 2024). The platform itself is battle-tested. Individual coins are a different story: most memecoins on Pump.fun go to zero. Trade only what you can afford to lose.

    How much does it cost to launch a coin on Pump.fun?

    Zero. There is no creation fee. If your coin graduates from the bonding curve to PumpSwap, a 0.015 SOL graduation fee is deducted from the curve, not paid out of pocket.

    What are Pump.fun’s trading fees?

    1.25% total on bonding-curve trades (0.30% creator, 0.95% protocol). PumpSwap canonical pools scale from 1.25% down to 0.30% as market cap grows. Non-canonical PumpSwap pools are a flat 0.30%.

    Do creators earn fees from their coins?

    Yes. Creators earn 0.30% on all bonding-curve trades for coins launched after May 13, 2025, and can earn up to 0.95% on graduated PumpSwap pools depending on tier.

    Does Pump.fun work on Ethereum or Base?

    No. Pump.fun is a Solana-only platform. For memecoin launches on other chains, look at Believe, Virtuals or Moonshot on Base and Ethereum.

    Data current as of September 2026 via DefiLlama and Pump.fun’s official fee documentation. This article is educational and does not constitute financial advice.

    Bittensor (TAO) Price Prediction 2026: Can TAO Hit $500?

    Bittensor (TAO) price prediction 2026 is one of the hottest questions in AI x crypto right now, and the tape explains why. TAO trades at $309.86 as of September 23, 2026, up roughly 43% over the past seven days and 31% over the past 30 days, according to CoinGecko. The token is still 59% below its March 2024 all-time high of $757.60, which means there is real room to run if the setup holds.

    The rally is not random. The Dynamic TAO (dTAO) upgrade is now fully live across all subnets, the first halving cut daily emissions in half last December, and Grayscale and Bitwise have both filed for spot TAO ETFs. That is a rare combination of supply shock, product-market fit, and institutional on-ramp arriving in the same year.

    This is our updated Bittensor TAO price prediction 2026 outlook. We cover current market context, the bull case, the bear case, timeframe-based price targets, a comparison to Render (RENDER) as the closest peer, and the scenarios that would change our view.

    Key Takeaways

    • TAO trades at $309.86 with a $3.51 billion market cap, ranked #34 by CoinGecko.
    • The Dynamic TAO (dTAO) upgrade is the primary reason for TAO’s +43% weekly move.
    • Daily TAO emissions fell from about 7,200 to about 3,600 after the December 14, 2025 halving.
    • Grayscale and Bitwise have filed for spot TAO ETFs, adding a potential institutional catalyst.
    • Our base case for 2026 is $500. Bear case: $150. Bull case: $900.
    • Roughly 70% of circulating supply is staked, tightening liquid float.
    Bittensor (TAO) price prediction 2026 hero graphic, current price $309.86, dTAO and halving catalyst

    Where Bittensor Stands Today

    TAO is not the biggest AI token by market cap, but it is arguably the most fundamentally distinct. Instead of being a wrapper on a centralized AI service, Bittensor is a network of subnets, each a specialized machine-intelligence market where miners compete to produce the best output and validators score them. dTAO turned every subnet into its own micro-economy with an Alpha token and a liquidity pool.

    Here is the current snapshot from CoinGecko:

    Metric Value
    Price (Sep 23, 2026) $309.86
    24h change -1.4%
    7d change +43.3%
    30d change +31.2%
    Market cap $3.51 billion
    24h volume $362 million
    Market cap rank #34
    All-time high $757.60 (March 2024)
    % from ATH -59.1%

    Circulating supply is 11.34 million TAO against a hard cap of 21 million, the same Bitcoin-style scarcity model that anchors so much of TAO’s long-term thesis.

    Why is Bittensor rising right now?

    Three things are converging. First, dTAO shipped in February 2025 and is now doing what it was designed to do: route TAO emissions to the subnets the market actually values. That has produced measurable Alpha token appreciation for the top subnets and pulled fresh capital into the ecosystem, per OAK Research.

    Second, the December 14, 2025 halving cut daily issuance from about 7,200 TAO to about 3,600 TAO. Fewer new coins hitting the market while demand ticks up is the classic recipe for a supply squeeze.

    Third, roughly 70% of circulating TAO is staked. That is not passive holding, that is active participation in subnet validation. It removes float from exchanges and amplifies price sensitivity to any incremental demand.

    This is the same AI x crypto pattern we flagged in our NEAR Protocol price prediction, but TAO’s setup is tighter because the supply mechanics are more aggressive.

    The Bull Case for TAO

    1. dTAO is compounding subnet value

    The Dynamic TAO upgrade lets the market decide which subnets deserve emissions. Subnets scaling from 128 to 256 slots in 2026 means more experiments, more Alpha tokens, and more reasons to hold TAO as the base asset that mints them. It is a healthier flywheel than the pre-dTAO era, when a committee allocated rewards.

    2. Spot TAO ETF filings are live

    Grayscale and Bitwise have both filed for spot TAO ETFs with the SEC. Approval is not a given, but the filings themselves are a signal that institutional wrappers see enough demand to justify the paperwork. A single approval could unlock the same demand curve Solana experienced during its 2024 ETF speculation phase, similar to what we outlined in our Solana SOL price prediction.

    3. Halving supply mechanics are still early

    The first TAO halving only happened in December 2025. Bitcoin’s post-halving cycles have historically taken 9 to 18 months to fully play out in price. TAO is roughly 9 months in. If the historical pattern rhymes, the meaningful price impact is arriving now, not already priced in.

    The Bear Case for TAO

    1. AI narrative fatigue

    AI tokens as a sector have already seen one full hype cycle. If macro liquidity tightens or the AI narrative rotates, TAO could give back most of its recent gains. TAO is still 59% below its 2024 ATH, and there is no rule that says it has to reclaim that level.

    2. Subnet quality dispersion

    dTAO is elegant in theory, but in practice most of the value is concentrated in a handful of subnets. If those top subnets fail to deliver real AI utility, the entire capital allocation model looks like reflexive on-chain speculation rather than a productive machine-intelligence economy.

    3. Execution risk on ETF timing

    A delayed or denied ETF approval would remove one of the strongest institutional catalysts on the table. Regulatory outcomes for smaller-cap tokens like TAO are far less predictable than they were for Bitcoin or Ethereum.

    Bittensor Price Prediction 2026: Targets by Timeframe

    Bittensor (TAO) price prediction 2026 targets table, bear $150, base $500, bull $900

    Next 30 days

    After a +43% weekly move, some cooling is likely. Base case: $340. Bear case: $220 if broader crypto risk-off resumes and stakers rotate to Bitcoin. Bull case: $450 if ETF news or a major subnet launch keeps momentum alive.

    Next 6 months

    This is the window where post-halving supply mechanics meet potential ETF decisions. Base case: $420. Bear: $180. Bull: $620 if an ETF gets approved and dTAO-driven subnet flows continue compounding.

    2027 target

    Our base case for full-year 2026 into early 2027 is $500. For reference, Changelly has a range of $270 to $650 for 2026, and PricePrediction’s average sits near $577. Bear: $150 in a crypto winter scenario. Bull: $900 if TAO reclaims and breaks through its 2024 ATH.

    How TAO Compares to Render (RENDER)

    Render is the closest peer: a decentralized compute network in the AI x crypto sector with real utility and a fixed-ish supply model.

    Metric Bittensor (TAO) Render (RENDER)
    Sector Decentralized AI network Decentralized GPU compute
    Market cap rank #34 ~#70
    Max supply 21 million ~644 million
    Emission model Halving, subnet-weighted Burn-and-mint equilibrium
    Utility Machine intelligence subnets GPU rendering, AI inference
    Staking share ~70% staked Low native staking
    ETF filings Grayscale, Bitwise None

    TAO’s tighter supply schedule and active staking give it a stronger reflexive setup on the way up. Render has broader visible demand from studios and AI shops. Both can win. TAO’s asymmetry is higher if dTAO subnets scale.

    What Would Change Our View

    Three specific scenario triggers would force us to revise the $500 base case:

    1. ETF denial and TAO loses $220. That would signal both institutional rejection and technical breakdown of the current base. In that case we would drop the base to $260 and treat rallies as sell-the-rip.
    2. Top subnets deliver measurable AI revenue. If two or three flagship subnets report real, verifiable inference or training revenue by Q1 2027, the base case moves to $650 and the bull case to $1,200.
    3. Broader AI narrative rotation. If AI x crypto rotates out of favor for two consecutive quarters, our base drops to $220 with a bear tail toward $120.

    Frequently Asked Questions

    Is Bittensor a good investment in 2026?

    Bittensor has a genuine differentiator: it is one of the only crypto assets whose token directly funds a decentralized machine-intelligence market. That gives it real narrative and real utility. It is also volatile and 59% below its all-time high. It is a high-conviction, high-risk position rather than a core holding for conservative portfolios.

    Will TAO hit $500 in 2026?

    It is our base case. Reaching $500 requires TAO to hold above the $260 support zone, at least one credible ETF development, and continued Alpha token strength across the top subnets. If any of those fail, $500 slips into 2027.

    What is dTAO in Bittensor?

    Dynamic TAO (dTAO) is an upgrade that gives each subnet its own Alpha token and liquidity pool. TAO flowing into a subnet raises its Alpha token price, which increases that subnet’s share of emissions. It replaces committee-driven allocation with market-driven allocation.

    How does the TAO halving affect price?

    The December 14, 2025 halving cut daily emissions from about 7,200 to about 3,600 TAO. Historically, halving effects take 9 to 18 months to fully price in. TAO is roughly 9 months post-halving, so the meaningful supply-side impact is arriving now.

    Will there be a spot TAO ETF?

    Grayscale and Bitwise have both filed for spot TAO ETFs with the SEC. Approval is uncertain and timelines are unpredictable. A single approval would be a significant institutional catalyst. A denial would remove one leg of the bull case.

    What is the biggest risk to Bittensor?

    Concentration risk inside dTAO. If a small number of top subnets fail to deliver verifiable AI utility, the market may treat the whole model as reflexive speculation rather than a productive economy, which would compress the multiple that TAO trades at.

    The Honest Take

    TAO has one of the cleanest fundamental setups in crypto right now. The supply mechanics work, the product ships, and institutional wrappers are being filed. It also carries real risk: a sector that has already had one hype cycle, a token still deep below its ATH, and an ETF process with no guaranteed outcome.

    Our base case is $500 by end of 2026 or early 2027. That is not a promise. It is a probability-weighted view based on visible catalysts and the current on-chain picture. If you already hold TAO, this is a position to size sensibly and monitor closely. If you are considering an entry, waiting for a healthy pullback after the +43% weekly move is a reasonable approach. For a broader AI-oracle exposure comparison, our Chainlink price prediction covers a related angle. And for context on our earlier TAO outlook, see our previous Bittensor $300 target piece.

    Disclaimer: This article is for informational and educational purposes only and should not be construed as financial, investment, or trading advice. Cryptocurrency markets are highly volatile, and past performance does not guarantee future results. The price predictions and analyses presented here are based on AI models, technical indicators, and available data at the time of writing, they are not guarantees. Always conduct your own research (DYOR) and consult with a qualified financial advisor before making any investment decisions. Pump Parade and its authors do not assume liability for financial losses incurred based on information provided in this article.