More
    Home Blog Page 3

    Zapper vs DeBank: Best Crypto Portfolio Tracker 2026

    0

    Zapper vs DeBank portfolio tracker comparison hero image

    If you hold assets across a dozen wallets, five chains, and a rotating cast of DeFi protocols, spreadsheets stop working around week two. Portfolio trackers exist to fix that, and two names show up in almost every serious DeFi user’s browser: Zapper and DeBank. Both let you plug in any wallet address and see the whole picture in seconds. But the two products have grown in very different directions, and picking the wrong one can cost you real hours (and sometimes real money in missed rewards). Here is how they stack up in 2026.

    Quick Verdict / TL;DR

    • Pick DeBank if you are an EVM power user who wants the deepest possible tracking across Ethereum, L2s, and every corner of DeFi, plus a native Web3 social feed and a solid mobile app.
    • Pick Zapper if you want the cleanest UI, first-class NFT and multi-chain (including Solana) coverage, in-app bridging and swaps, and a friendlier onboarding for newer users.
    • Overall winner for pure DeFi tracking: DeBank. Best all-round dashboard for most crypto users: Zapper.

    What Are Zapper and DeBank?

    Both products are read-only portfolio trackers. You paste in a wallet address (or connect your wallet) and the platform reads on-chain state to show your tokens, DeFi positions, NFTs, rewards, and history. Neither one takes custody of your funds, which is a big part of why the crypto-native crowd trusts them. They also both layer a light social product on top: follow other wallets, watch what they are farming, and copy strategies.

    Abstract crypto portfolio dashboard UI illustration

    Zapper at a glance

    Zapper launched in 2020 as a “DeFi hub” and has steadily broadened into a full multi-chain dashboard. Today it supports 40 plus networks, including all major EVM L1s and L2s, Solana, and a growing list of app-chains. It bundles tracking with in-app actions like swaps, bridges, and one-click exits from LP positions.

    DeBank at a glance

    DeBank started as an Ethereum-focused DeFi dashboard and became the de facto standard for tracking positions across EVM protocols. It supports 30 plus EVM networks, does not natively cover non-EVM chains like Solana or Bitcoin, and layers on Web3 messaging, a social feed, and DeBank Chain (its own L2 for identity and payments).

    Supported Chains and Coverage

    This is the single biggest difference between the two, so it deserves its own section.

    • Zapper: 40 plus networks. Ethereum, Arbitrum, Base, Optimism, Polygon, zkSync, Scroll, Linea, BNB Chain, Avalanche, Fantom, Celo, Gnosis, plus Solana and several Cosmos-adjacent chains. Solana coverage was rebuilt in 2025 and now handles Jupiter-routed swaps, LSTs, and popular Solana DEX LP positions.
    • DeBank: 30 plus EVM networks. Extremely deep coverage of every EVM chain that matters, including obscure L2s that Zapper sometimes indexes days later. No Solana, no Bitcoin, no Cosmos.

    If your portfolio lives across Solana and Ethereum, Zapper is the only realistic single-pane-of-glass option. If you are all-EVM, DeBank is unmatched on depth.

    Features Deep Dive

    Position tracking

    DeBank still holds the crown for pure DeFi position accuracy. It picks up staked positions, veTokens, locked LPs, farming rewards, and bribes on protocols like Curve and Convex faster than any competitor. Zapper is close (and better than it used to be) but still occasionally lags DeBank by hours on newer protocol integrations.

    NFTs

    Zapper wins comfortably. NFT valuations, floor prices, per-collection PnL, and rarity data are all first-class. DeBank has an NFT tab but treats them as a secondary asset class.

    In-app actions (swap, bridge, exit)

    Zapper has aggressively built an actions layer on top of its dashboard. You can swap tokens (via a routing aggregator), bridge between chains, and exit LPs in one click, all without leaving the app. DeBank offers a swap and a bridge (via Rabby, its sister wallet), but the flow is more manual.

    Social and Web3 identity

    DeBank leans in harder here. It has a native Web3 messaging feature, an activity feed, a “streams” product, and DeBank Chain for on-chain identity. Zapper’s social features are lighter (follow wallets, see trending activity) but well integrated.

    Mobile

    Both ship native iOS and Android apps in 2026, and both are good. DeBank’s mobile app is a bit more feature-complete on the DeFi side; Zapper’s is friendlier for browsing NFTs.

    API and developer access

    DeBank Cloud (its paid API) is the industry standard for on-chain analytics teams and wallet builders. It powers many wallet portfolio views you already use. Zapper has an API too (and a strong GraphQL endpoint), but DeBank Cloud has broader adoption among institutional customers.

    Fees and Pricing

    • Zapper: Free to use the dashboard. In-app swaps and bridges charge a service fee on top of the underlying router, typically around 0.85 percent, plus normal DEX and bridge fees. API access is metered and priced per plan.
    • DeBank: Free for the dashboard, mobile app, and social features. Swaps and bridges route through partners with variable fees. The Cloud API is the main paid product, with pricing based on request volume.

    For read-only tracking, both are effectively free. Costs only appear if you actually transact through them or hit the API.

    Comparison Table
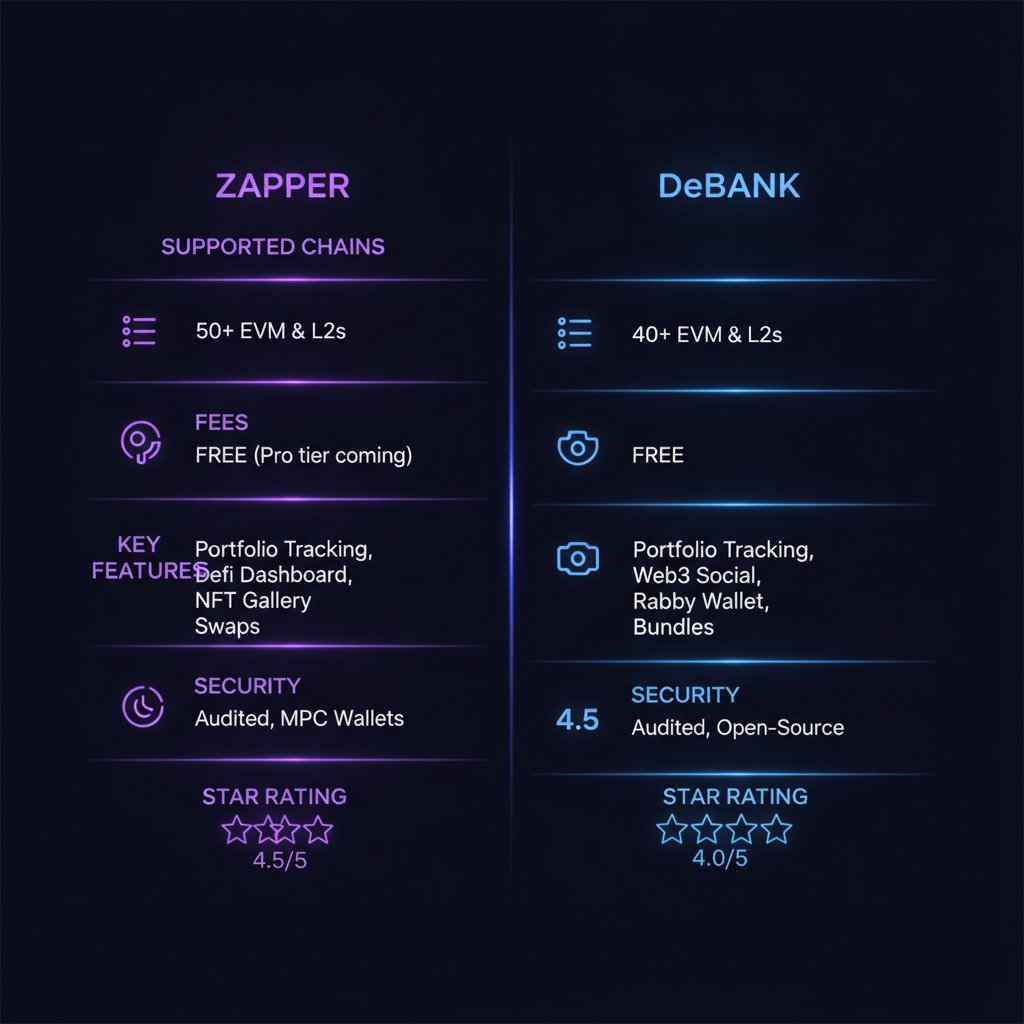
    Zapper vs DeBank comparison table graphic

    Feature Zapper DeBank
    Launched 2020 2019
    Supported chains 40+ (EVM plus Solana) 30+ EVM only
    NFT support First-class Basic
    DeFi position depth Very good Best in class
    In-app swap and bridge Yes, integrated Yes, via partners and Rabby
    Mobile apps iOS and Android iOS and Android
    Web3 social Light (follows and feeds) Deep (messaging, feed, DeBank Chain)
    Dashboard fee Free Free
    API GraphQL, tiered plans DeBank Cloud, tiered plans
    Custody Non-custodial, read-only Non-custodial, read-only
    Star rating 4.5 / 5 4.6 / 5

    Pros and Cons

    Zapper

    Pros:

    • Cleanest, most beginner-friendly UI of any tracker
    • Solana plus EVM in one dashboard
    • Strong NFT support
    • One-click LP exits and integrated swaps
    • Excellent GraphQL API for builders

    Cons:

    • Position tracking can trail DeBank by hours on new protocols
    • Swap fee (around 0.85 percent) is not free money for active traders
    • Social feed still lighter than DeBank’s

    DeBank

    Pros:

    • Best-in-class DeFi position accuracy across EVM chains
    • Deep Web3 social layer (messaging, feed, DeBank Chain identity)
    • Strong sister wallet (Rabby) with tight integration
    • Industry-standard Cloud API for developers
    • Fast to index new EVM protocols

    Cons:

    • No Solana, no non-EVM chains
    • NFT support is basic
    • UI is denser and less friendly for new users
    • Some paid API tiers get expensive at scale

    Security and Trust

    Both products are read-only by default. Neither takes custody of funds when you simply track a wallet, and neither asks for private keys or seed phrases. Actions like swaps or bridges require you to connect a wallet and sign transactions, at which point standard wallet security applies.

    DeBank logo, fetched from debank.com

    DeBank has been operating since 2019 with no major security incident. Its sister wallet Rabby is open source and has published audits from firms like SlowMist. Zapper has a longer history of external audits on its contracts and its in-app actions layer, and its team publishes regular security post-mortems when integrations misbehave. Neither has ever lost user funds through the tracker itself.

    A word of caution that applies to both: because these dashboards aggregate a lot of protocol integrations, they can occasionally display incorrect balances during upstream outages. Always sanity-check large numbers against the underlying protocol UI before making decisions.

    User Experience

    Zapper’s UI is one of the best in crypto, period. Clear cards, obvious grouping, and sensible defaults. A new DeFi user can figure it out in five minutes. DeBank is denser: more numbers per square inch, more tabs, and more assumed knowledge. Power users prefer it precisely because nothing is hidden. If you have three wallets and mostly hold ETH, stablecoins, and an LST, Zapper feels great. If you have twelve wallets across every L2 and are chasing points programs on obscure protocols, DeBank feels essential.

    Mobile UX is close. Both handle push notifications for large balance changes, both let you group wallets into “bundles” or “watchlists,” and both are fast on modern phones.

    Verdict and Rating

    Zapper: 4.5 / 5. The best all-round dashboard for most crypto users. If your portfolio touches Solana or you care about NFTs, Zapper is the default answer. It is also the tracker most likely to survive a friend asking “which app should I install to see my crypto in one place?”

    DeBank: 4.6 / 5. The tracker for serious EVM DeFi users. If you spend real money on gas every week, farm points, or manage positions across ten protocols, DeBank still gives you the tightest, most accurate view. The Web3 social layer is a nice bonus once you find your circle.

    In practice, plenty of people we know run both: DeBank open in one tab for EVM DeFi accuracy, Zapper open in another for NFTs, Solana, and quick swaps.

    Related reading on PumpParade

    FAQ

    Is Zapper or DeBank safer?

    Both are non-custodial and read-only for pure tracking, so the “safety” question really applies to their action features (swaps, bridges, wallet integrations). Both have long, clean track records. Neither has ever custodied user funds.

    Do Zapper and DeBank charge to see my portfolio?

    No. The dashboards, mobile apps, and social features are free. You only pay when you use in-app swaps or bridges, or when you subscribe to their APIs as a developer.

    Can DeBank track Solana wallets?

    Not natively. DeBank is EVM-only in 2026. If you need Solana coverage in the same app as your EVM wallets, use Zapper (or a dedicated Solana tracker like Step Finance).

    Which tracker is better for NFTs?

    Zapper. It has first-class NFT support with floor prices, PnL, and rarity data. DeBank shows NFTs but treats them as a secondary asset.

    Do I need to connect my wallet to use them?

    No. You can paste any public wallet address to view its portfolio. Connecting a wallet is only required for actions like swapping or bridging.

    This article is for informational purposes and is not financial advice. Always verify balances and positions in the underlying protocol UI before making decisions.
    Chainlink (LINK) Price Prediction 2026: Can LINK Hit $25?

    Chainlink (LINK) trades at $12.90 today, up 17% over the past week and back on every institutional-adoption watchlist in crypto. The Chainlink price prediction 2026 question is not really about charts anymore. It is about whether SWIFT, DTCC, UBS, and the rest of the plumbing-layer institutions actually route tokenized value through Chainlink’s oracles and CCIP rails in production, not just pilots.

    Here is what the data says, what the catalysts look like, and where LINK could realistically land 30 days, 6 months, and 2 years out.

    Key Takeaways

    • LINK sits at $12.90, ranked #15 by market cap, with a $9.65B valuation and 76% below its 2021 all-time high of $52.70.
    • The DTCC Tokenization Service launches in October 2026, and the DTCC Collateral AppChain (built on Chainlink CRE) targets Q4 2026.
    • SWIFT and Chainlink completed a landmark tokenized-bond settlement in January 2026 with UBS Asset Management.
    • Base case for end of 2026: $18. Bull case: $25. Bear case: $8 if oracle demand stagnates.
    • The biggest single risk is not competition. It is that institutional pilots stay pilots and never produce real fee flow.
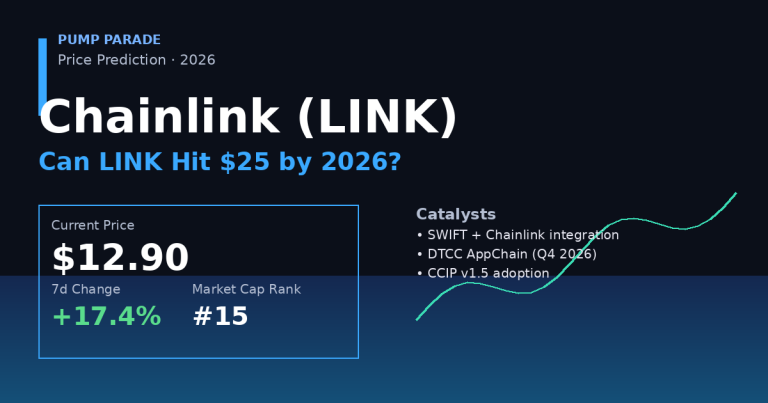
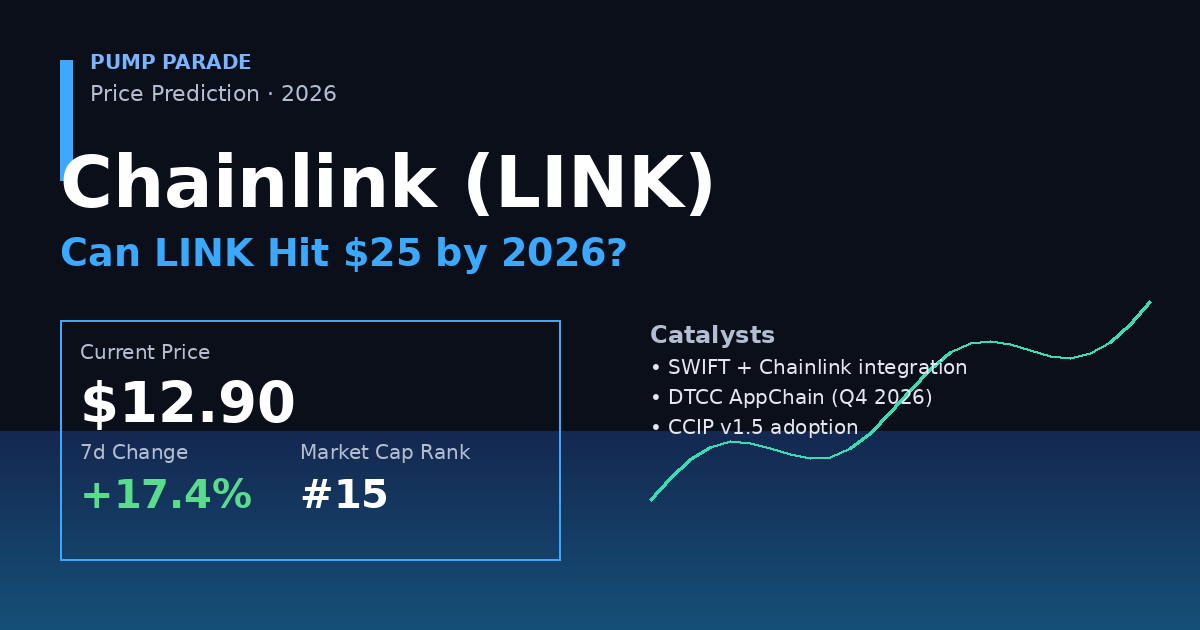
    Chainlink (LINK) price prediction 2026 hero graphic , current price $12.90, SWIFT and DTCC tokenization catalysts

    Where Chainlink Stands Today

    Before any prediction, a snapshot of the state of play. All figures below are from CoinGecko as of September 22, 2026.

    Metric Value
    Price (USD) $12.90
    24-hour change -1.96%
    7-day change +17.44%
    30-day change +12.13%
    Market cap $9.65B
    24-hour volume $580M
    Market cap rank #15
    All-time high $52.70 (May 2021)
    % from ATH -75.5%
    Circulating supply 748M LINK
    Max supply 1B LINK

    Two numbers matter most here. First, LINK is still down more than 75% from its 2021 peak, so a “return to ATH” thesis is a 4x call, not a moonshot. Second, the 17% weekly move happened on rising volume, not a low-liquidity squeeze. That usually signals real bid.

    Why is Chainlink rallying right now?

    The catalyst set is unusually concrete for a crypto rally. In July 2026, the DTCC announced it had successfully converted assets held at The Depository Trust Company into tokens used in real production trades. That was described as the largest tokenization production initiative to date. The follow-on DTCC Tokenization Service is scheduled to launch in October 2026, with the DTCC Collateral AppChain (using Chainlink’s CRE technology) targeted for Q4 2026.

    On the payments side, SWIFT completed a landmark interoperability milestone with Chainlink and UBS Asset Management in January 2026, settling tokenized bonds with payments in both fiat and stablecoin rails, including Société Générale’s EURCV. That is not a research paper. That is a production trade.

    Traders read those two threads as a signal that Chainlink is becoming the default oracle and cross-chain layer for regulated tokenization. The price is starting to reflect that read. Whether it holds depends on whether pilot volume converts into recurring fee flow.

    The Bull Case for LINK

    1. CCIP becomes the tokenization rail

    CCIP v1.5 launched on mainnet in January 2025 with self-serve token integration and now supports Solana and other high-throughput chains. If tokenized real-world assets scale from single-digit billions to hundreds of billions in value locked, and CCIP captures even a small share of that transfer volume, the fee accrual to LINK is material. Analyst desks including Coingape have flagged CCIP volume as the single cleanest bull signal for LINK.

    2. Institutional staking and LINK Staking ETP

    A LINK Staking ETP in European or Asian markets would open a compliant on-ramp for pensions, family offices, and asset managers that cannot custody native tokens directly. That kind of vehicle historically pulls billions in AUM within the first 12 months of listing, based on how Ethereum staking products behaved after their launch. Even a modest inflow relative to Ethereum’s ETP would reprice LINK.

    3. Corporate actions and asset-servicing standard

    Chainlink and 24 of the world’s largest financial institutions (SWIFT, DTCC, Euroclear, SIX, UBS, Wellington Management) are working on a production-grade corporate-actions processing system. If that becomes the de facto standard for reference data across tokenized securities, Chainlink stops being “an oracle project” and starts being financial-market infrastructure. The valuation math changes at that point.

    The Bear Case for LINK

    1. Pilots that never become products

    The most common outcome for enterprise blockchain pilots between 2016 and 2023 was quiet abandonment. Every SWIFT press release could still land in that graveyard. If 2027 arrives with impressive announcements but negligible CCIP fee volume, LINK reverts to trading as a beta play on ETH, and $8 is on the table.

    2. Competing oracle and interoperability stacks

    Chainlink is not the only oracle. Pyth Network has captured meaningful share in low-latency DeFi price feeds, and LayerZero, Wormhole, and Axelar all compete on the cross-chain messaging side. If one of those becomes the preferred rail for a major institutional deployment, Chainlink’s moat looks narrower.

    3. LINK tokenomics and unlock overhang

    Roughly 25% of LINK supply is still uncirculated. Even without a fixed unlock cliff, historical distributions from the non-circulating pool have periodically pressured price. A shift in that pattern, or a large ecosystem grant, can create real sell pressure independent of fundamentals.

    Chainlink Price Prediction 2026: Targets by Timeframe

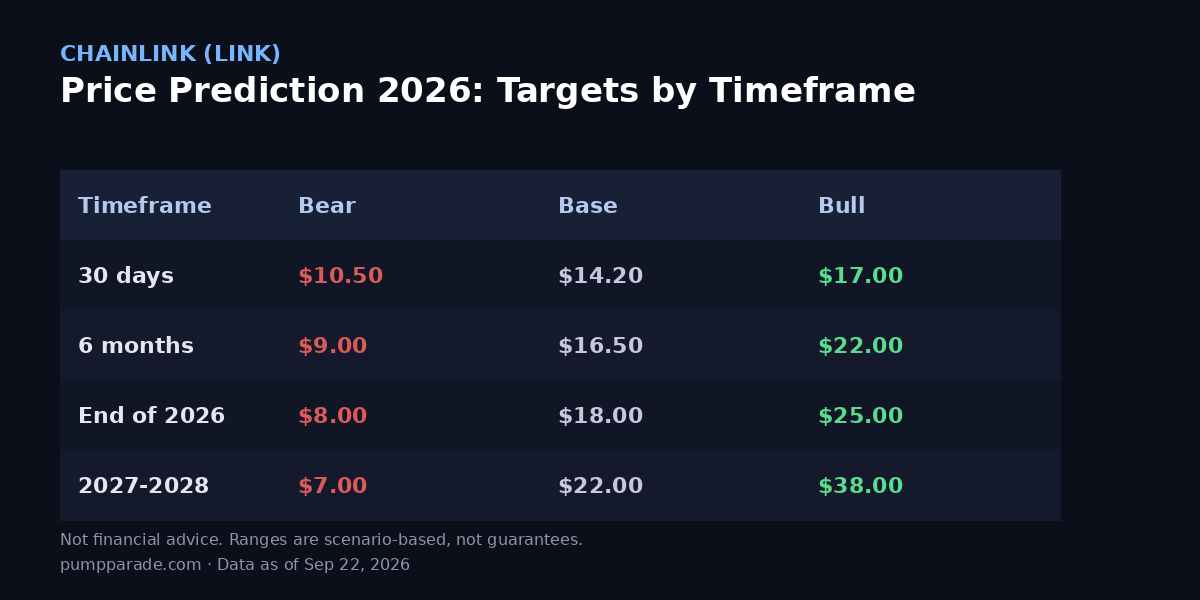
    Chainlink (LINK) price prediction 2026 targets table , bear $8, base $18, bull $25

    30-day outlook (October 2026)

    The October DTCC Tokenization Service launch is a scheduled event risk in both directions. A clean production launch with named participants likely pushes LINK toward $17. A delayed or watered-down launch, combined with any broad crypto risk-off move, drops LINK back to the $10.50 area. Base case: $14.20.

    6-month outlook (Q1 2027)

    Six months out gives room for the Collateral AppChain to reveal early volume data. If CCIP messages per week are trending up meaningfully, LINK can trade to $22. If pilots are still headline-only, $9 is the fade zone. Base: $16.50.

    End of 2026

    Our base case for December 2026 is $18. That assumes CCIP volume rises modestly, DTCC ships on time, and macro conditions stay neutral. Bull case is $25, which requires a genuine tokenization inflection plus altcoin risk-on. Bear case is $8. For comparison, Changelly models a 2026 range of roughly $22 to $51 with a $38 average, while Coinbase’s mechanical 5% growth model lands near $12.50. The truth is almost certainly somewhere between those two extremes.

    2027 to 2028

    Longer term, we model a $7 bear, $22 base, and $38 bull. The bull case does not require LINK to become a top-five asset. It requires tokenized RWA volume to move from pilot scale to production scale, and for a non-trivial share of that flow to touch Chainlink infrastructure.

    How does Chainlink compare to Pyth Network?

    Pyth Network is the most common comparison because both projects sell price data as a product. The two stacks approach the problem very differently.

    Metric Chainlink (LINK) Pyth Network (PYTH)
    Market cap $9.65B ~$1.1B
    Live blockchains supported 60+ 90+
    Primary use case General-purpose oracle, CCIP, PoR Low-latency price feeds for perps
    Institutional partners SWIFT, DTCC, Euroclear, UBS Cboe, Jump, Wintermute
    Cross-chain product CCIP (production) Pyth Express Relay
    Enterprise revenue model Node fees + CCIP fees Publisher-subsidized, fee model evolving
    Token unlock overhang Moderate (25% not circulating) High (large unlocks through 2027)
    Best case for the token Institutional tokenization rail Default price layer for on-chain derivatives

    Chainlink wins on institutional integration depth. Pyth wins on speed and DeFi-native traction. They are not truly zero-sum, which is why both can coexist. But for a Chainlink price prediction 2026 model specifically, the SWIFT and DTCC work matters more than the DeFi oracle share war.

    What Would Change Our View

    Three specific triggers would move us off the $18 base case. First, CCIP weekly message volume printing a durable 3x increase within two quarters. That would be evidence that pilots are converting. Second, a delay or scope reduction in the DTCC AppChain launch beyond Q1 2027. That would push our 2026 target down toward the $12 area. Third, a US spot LINK ETP filing from a top-five issuer. That single event historically re-rates an asset by 20% to 40%.

    If you want to model this yourself, our Ethereum Price Prediction 2026 post walks through a similar scenario framework, and our Ondo Finance 2026 outlook covers the tokenized-RWA side of the same thesis from a different angle. For the DeFi read-across, see our Uniswap fee-switch analysis.

    Is Chainlink a good investment in 2026?

    Chainlink has the strongest institutional-adoption narrative of any layer-1-agnostic crypto asset. If you believe tokenization is the actual real-world use case for public blockchains, LINK is one of the cleanest ways to express that view. If you think tokenization stays a slide-deck word for another 24 months, LINK is a slow-bleed altcoin with a decent floor. Both views are defensible on the current data.

    Will Chainlink reach $25 in 2026?

    Reaching $25 in 2026 is our bull case, not our base case. It requires broad CCIP adoption, live volume from the DTCC AppChain, and a friendly macro tape. Our base case sits closer to $18. Bear scenarios put LINK back near $8 if oracle usage stalls.

    Is Chainlink a good investment in 2026?

    Chainlink has the deepest institutional integration story in crypto, with active work involving SWIFT, DTCC, UBS, and Euroclear. That is bullish long term. Short term, LINK still trades like a beta play on altcoin risk. Position size accordingly, and treat any target as a range, not a promise.

    What is the Chainlink price prediction for 2027?

    Analyst ranges for 2027 span $9 to $65, which tells you nobody really knows. Our own scenario range is $7 (bear) to $38 (bull), with a base near $22. The wildcard is whether tokenized real-world assets scale from pilot volume to trillion-dollar flow.

    Why did Chainlink jump this week?

    LINK is up roughly 17% over the last seven days on renewed tokenization headlines and broad altcoin bid. The DTCC Tokenization Service is scheduled to launch in October 2026, and the DTCC Collateral AppChain, which uses Chainlink CRE, is targeted for Q4 2026.

    How does Chainlink make money?

    Chainlink is not a company with revenue in the traditional sense. Node operators earn LINK for delivering data and running services. Enterprise clients pay for CCIP, Proof of Reserve, and Data Streams, often in LINK or stablecoins. That fee flow is what long-term bulls point to when they model value.

    What is Chainlink CCIP?

    CCIP, or Cross-Chain Interoperability Protocol, is Chainlink’s messaging and token-transfer layer that lets different blockchains talk to each other securely. Version 1.5 shipped in early 2025 with self-serve token integration. It now supports Solana, and it is the rail SWIFT and DTCC are testing for cross-chain settlement.

    The Honest Take

    Chainlink is not the token that returns 50x in a cycle. It is the one that quietly compounds if the institutional-tokenization thesis actually plays out. The setup is fair: real catalysts are dated on the calendar, price sits well off its highs, and the fundamental story is not a meme. What is missing is proof, in the form of weekly CCIP fee flow and real production volume on DTCC and SWIFT rails.

    Disclaimer

    This article is for informational and educational purposes only and should not be construed as financial, investment, or trading advice. Cryptocurrency markets are highly volatile, and past performance does not guarantee future results. The price predictions and analyses presented here are based on AI models, technical indicators, and available data at the time of writing. They are not guarantees. Always conduct your own research (DYOR) and consult with a qualified financial advisor before making any investment decisions. Pump Parade and its authors do not assume liability for financial losses incurred based on information provided in this article.
    Kraken Review 2026: Fees, Features & Verdict

    0

    Kraken Review 2026 hero

    If you have spent more than a week in crypto, you already know the name. Kraken has been running since 2011, which is basically forever in this space. But 2026 is a completely different market than the one Kraken was born into. Between the return of a full US bull cycle, the launch of tokenized equities, and a wave of new competitors chasing users with zero-fee promises, does one of the oldest exchanges still deserve a spot in your portfolio stack? We put Kraken under a magnifying glass to find out.

    Quick Verdict (TL;DR)

    Rating: 4.6 / 5

    Kraken remains one of the safest, most feature-complete exchanges you can use in 2026. It scores a perfect 10/10 trust score on CoinGecko (rank #3 among centralized exchanges by trust), runs a rock-solid Proof of Reserves system, and now bundles spot crypto, futures, margin, on-chain staking, tokenized US stocks (xStocks), and commission-free equity trading under one roof. The main downsides are the everyday app’s 1% instant-buy fee (steep versus DEX aggregators like trading bots that charge closer to 0.5%) and a slightly dated Kraken Pro UI that still feels engineered for pros first, beginners second. If you want long-term custody with real regulatory backing, Kraken is a strong pick.

    Kraken at a Glance

    Kraken is a US-based centralized crypto exchange operated by Payward, Inc. It launched publicly in 2013 after two years of stealth development and has grown into one of the largest fiat-to-crypto on-ramps in the world.

    • Founded: 2011 (public launch 2013)
    • Headquarters: United States
    • Trust score (CoinGecko): 10/10, rank #3 globally
    • Assets supported: 200+ cryptocurrencies, 11,000+ US stocks and ETFs, plus xStocks tokenized equities
    • Leverage: Up to 10x on spot margin, up to 50x on futures
    • Regulation: Registered with FinCEN, VASP-registered in multiple EU states, licensed in the UK, Australia, Canada and more
    • Website: kraken.com

    Features Deep Dive

    Kraken key features

    1. Two apps, two audiences

    Kraken now runs on a dual-app strategy. The standard Kraken app is the friendly on-ramp: tap a coin, tap Buy, done. The Kraken Pro platform (web and app) is the serious trader’s tool with limit orders, stop losses, iceberg orders, conditional close, and a full order book UI. New users can start on the simple app and graduate to Pro without opening a new account, which is one of Kraken’s better ergonomic moves in the last two years.

    2. Spot, futures, margin, and OTC

    Kraken Pro supports spot trading, cross-margin trades with up to 10x leverage on eligible pairs, perpetual futures with up to 50x leverage in supported regions, and an over-the-counter (OTC) desk for large block trades that shouldn’t hit the public order book. That is a wider product surface than most retail exchanges offer.

    3. On-chain staking with instant rewards

    Kraken’s on-chain staking product covers 15+ Proof-of-Stake networks. Rewards accrue instantly with no waiting or bonding period on flexible terms, which is unusual. Kraken takes a 20% commission on flexible staking rewards on assets with an unbonding period, which is fair market rate. Solana, Ethereum, Polkadot, Cosmos and Cardano are all supported.

    4. xStocks and tokenized equities

    This is the sleeper feature. Kraken now offers xStocks, tokenized versions of major US equities (NVDAx, TSLAx, AAPLx, SPYx, AMZNx and more) that trade 24/5 as blockchain tokens. When you buy xStocks with USDG or USD there are zero trading fees. That is a genuinely category-leading offer for non-US traders who want stock exposure without leaving crypto rails.

    5. Commission-free stocks (US only)

    For US users, Kraken added commission-free trading on 11,000+ stocks and ETFs in 2025, positioning itself as a Robinhood-style alternative for people who want their crypto and equities in one wallet. Regulatory fees still apply, but the trading commission is zero.

    6. Recurring buys and dollar-cost averaging

    Simple, well-executed: pick an asset, pick a schedule (daily, weekly, monthly), pick a funding source. Great for people who want to DCA into Bitcoin or Ethereum without thinking about it. See our Ethereum 2026 price outlook for context on why long-term DCA into ETH is still a defensible thesis.

    Fees & Pricing

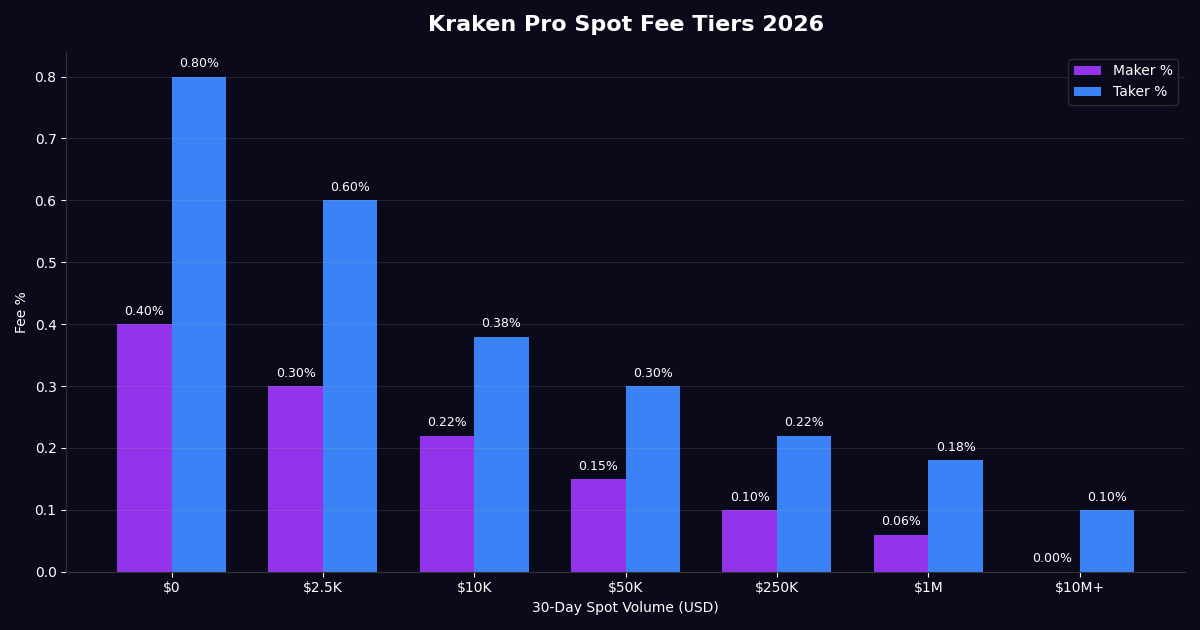
    Kraken Pro spot fee tiers 2026

    Kraken runs two very different fee models depending on which product you use:

    Kraken app (instant buy/sell)

    • 1.0% trading fee on instant and recurring trades
    • 1.5% fee on custom orders
    • Spread included in the quoted price (varies by asset and market conditions)
    • 0% trading fees on up to $10,000/month with Kraken+ membership

    This is the same tier as Coinbase’s consumer app. It is convenient but expensive if you trade often.

    Kraken Pro (spot crypto)

    Kraken Pro uses a maker-taker tier system with fees that scale down based on the best of your 30-day spot volume or your Assets on Platform (AoP). Holding assets on Kraken now qualifies you for lower fees, which is a new 2026 change.

    Tier 30-Day Spot Volume AoP Maker Taker
    Tier 1 $0+ N/A 0.40% 0.80%
    Tier 3 $10K+ $20K 0.22% 0.38%
    Tier 5 $50K+ $100K 0.15% 0.30%
    Tier 9 $1M+ $1M 0.06% 0.18%
    Tier 12 $10M+ $10M 0.00% 0.10%

    Futures fees (Pro)

    Futures fees start at 0.02% maker / 0.05% taker at Tier 1 and drop to negative maker rebates (up to -0.006%) at the Pro 5 tier ($5B+ in 30-day volume). Perpetuals on the main app cost 0.25% to open and 0.25% to close.

    Stablecoin and USDG pairs

    Stablecoin pairs run at 0.20% maker/taker at Tier 1 and go as low as 0.00%/0.001% at $100M+. USDG pairs are effectively free at 0% maker and 0.01% taker at all volumes, which is one of the cheapest stablecoin fee schedules on any centralized exchange in 2026.

    Deposit & withdrawal

    Crypto deposit fees depend on the network. Most on-chain deposits are free; withdrawals reflect network gas plus a small Kraken fee. Fiat funding is broad: ACH, wire, SEPA, Faster Payments, Interac and card. Card purchases add a payment processing fee on top of the trading fee.

    Security & Trust

    Kraken has never been hacked in a way that lost customer funds, which is a real achievement in an industry that has watched Mt. Gox, Bitfinex, FTX, and dozens of smaller exchanges collapse or get drained. The security stack includes:

    • Cold storage: The overwhelming majority of assets sit in air-gapped cold wallets in geographically distributed vaults
    • Proof of Reserves: Independent, cryptographically-verifiable audits of holdings, refreshed on a rolling schedule
    • 2FA everywhere: Google Authenticator, YubiKey and passkey support
    • PGP/GPG encrypted email: Optional, still one of the only major exchanges that supports this
    • Master Key: Kraken’s account recovery layer that acts as a second password specifically for account settings changes
    • SOC 2 Type II certified and regulated in multiple jurisdictions

    Kraken published its 2026 Proof of Reserves report earlier this year, and the numbers checked out. That level of transparency is not universal in this industry.

    User Experience

    Kraken mobile app interface

    The consumer Kraken app (iOS and Android) is genuinely well designed in 2026. Onboarding, buying, staking, and viewing rewards all feel modern and iOS-native. It is not quite as buttery as Coinbase’s main app, but it is a lot deeper. The Kraken Pro web interface, on the other hand, is powerful but dense. Depth of market, customizable layouts, hotkeys, TradingView charting, all there. New users usually bounce off Pro their first time and come back to it once they know what they are doing.

    Support is 24/7 live chat plus a very deep knowledge base. In our tests during 2026, response times on live chat averaged under 3 minutes for account-related questions.

    Pros & Cons

    Pros

    • Perfect 10/10 CoinGecko trust score, 15-year track record with no customer fund losses
    • Proof of Reserves, PGP email, hardware key support, Master Key
    • Aggressive fee tiers that go all the way to 0% maker and 0.05% taker at Pro 5
    • USDG pairs at effectively 0% fees are a killer feature for stablecoin routing
    • xStocks 0-fee tokenized equities for non-US users
    • On-chain staking with 15+ networks, instant rewards
    • Kraken Pro futures are competitive with dedicated derivatives venues
    • Real regulatory footprint in US, EU, UK, AU, CA

    Cons

    • 1% instant-buy fee on the consumer app is high, especially compared to Solana DEX aggregators covered in our Nansen vs DexScreener analytics comparison for on-chain traders
    • Kraken Pro UI still intimidates first-time users despite the 2025 redesign
    • Perps and futures unavailable in the US and some other jurisdictions
    • xStocks and Krak app not available worldwide (US notably restricted)
    • No native NFT marketplace

    Kraken vs Coinbase (Quick Comparison)

    The most common question we get is whether Kraken beats Coinbase. In short:

    • Winner on fees: Kraken (Pro spot fees start lower and USDG pairs are near-free)
    • Winner on beginner UX: Coinbase (still the smoother onboarding)
    • Winner on advanced trading: Kraken (Pro plus 50x futures)
    • Winner on staking coverage: Kraken (more networks, instant rewards)
    • Winner on regulatory clarity in the US: Coinbase (public company, deeper US integration)

    For most active crypto users, Kraken wins on total value. For pure beginners in the US who never plan to trade actively, Coinbase’s simpler experience may be worth the higher fees.

    Verdict & Rating

    Overall: 4.6 / 5

    • Security: 5.0 / 5
    • Fees (Pro): 4.5 / 5
    • Fees (consumer app): 3.5 / 5
    • Product breadth: 4.7 / 5
    • UX (consumer app): 4.5 / 5
    • UX (Pro): 4.0 / 5
    • Staking: 4.7 / 5
    • Regulation & transparency: 5.0 / 5

    Kraken has quietly turned itself into one of the most well-rounded crypto platforms on the internet. Not the flashiest exchange, not the cheapest for casual buyers, but almost certainly the safest way to hold, stake and trade meaningful size in 2026. If you have been sitting on a small Coinbase balance and want a single home for spot, futures, staking and tokenized stocks, opening a Kraken account is a very defensible move.

    FAQ

    Is Kraken safe to use in 2026?

    Yes, by most objective measures. Kraken has a 10/10 CoinGecko trust score, has never lost customer funds, publishes verified Proof of Reserves, holds SOC 2 Type II certification, and offers advanced security features like Master Key and PGP-encrypted email. No exchange is 100% risk-free, so long-term holders should still self-custody a portion of their stack.

    What is Kraken Pro and is it free?

    Kraken Pro is Kraken’s advanced trading platform (web and mobile) with limit orders, futures, margin, and full order book access. It is free to use; you only pay per-trade maker/taker fees that range from 0.40% down to 0% based on your 30-day volume or assets on platform. Existing Kraken users can switch to Pro without opening a new account.

    Does Kraken support Solana staking?

    Yes. Kraken offers on-chain SOL staking with rewards that accrue instantly and no bonding period on flexible terms. Kraken takes a 20% commission on rewards for flexible staking, which is standard for custodial staking.

    What is Kraken’s biggest downside?

    The 1% trading fee on the consumer Kraken app for instant buys and recurring purchases. If you are cost-sensitive, use Kraken Pro instead where fees start at 0.40%/0.80% and drop from there, or join Kraken+ for zero fees on up to $10K/month.

    Can US users trade futures on Kraken?

    Not currently. Kraken Futures and perpetuals are unavailable in the United States and a handful of other jurisdictions. US users can still trade spot crypto, margin (limited), stocks, xStocks, and stake supported assets.

    How does Kraken compare to Binance?

    Binance has more listings and higher volume globally, but Kraken has cleaner US regulatory standing, longer track record without incident, and more transparent Proof of Reserves. For users prioritizing safety over exotic altcoin coverage, Kraken is the more defensible choice.


    Data sources: CoinGecko, Kraken official fee schedule. This article is for informational purposes only and is not investment advice. Cryptocurrency and tokenized equity trading carries risk of total loss. Always do your own research.

    Pudgy Penguins (PENGU) Price Prediction 2026: $0.03 Path?

    0

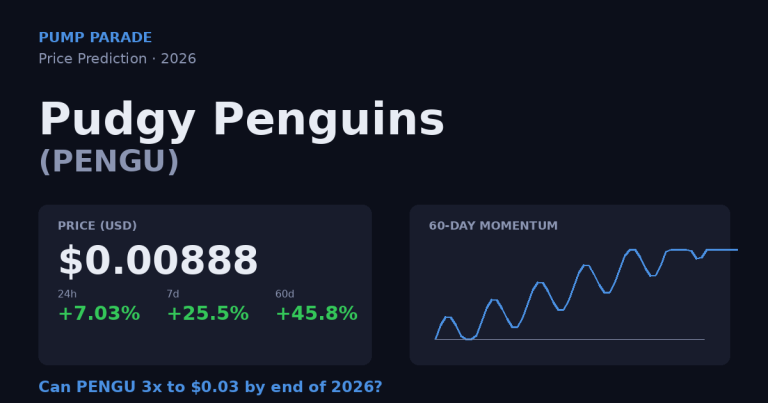
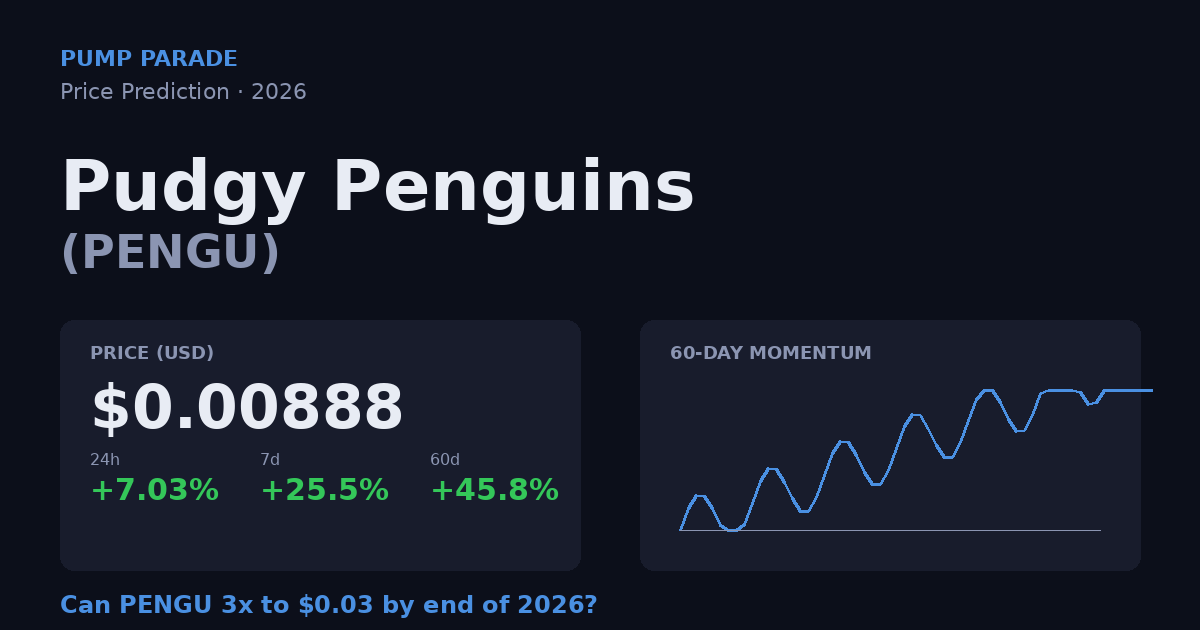
    The Pudgy Penguins price prediction 2026 conversation just got interesting again. PENGU trades at $0.00888 as of September 22, up 7% in the last 24 hours and up 25.5% over the past week, on volume that spiked 302% versus the previous day. The token is still down 87% from its December 2024 all-time high of $0.068, but the 60-day chart shows something that looked impossible in spring: a real recovery, +45.8% off the local floor.

    The narrative behind the price move isn’t hype. Pudgy World, the free-to-play browser game, pulled 20,000 signups in its first 48 hours after the March launch. CEO Luca Netz has publicly committed to a 2027 IPO target, contingent on hitting $50-$100M in revenue. And with Team and Company allocations still under a 3-year linear vest, the biggest supply overhang the market feared last year is now mostly known and priced.

    Here’s what this article covers: where PENGU actually sits in the market today, why it’s moving now, the specific bull and bear cases with dollar targets, how it stacks up against ApeCoin, and the FAQ answers most other price prediction pages get wrong. Let’s break down whether Pudgy Penguins can 3x to $0.03 by end of 2026, or whether this rally fizzles like the April one.

    Key Takeaways

    • Current price: $0.00888 (Sep 22, 2026), +7% 24h, +25.5% 7d, +45.8% 60d, still -87% from ATH of $0.068.
    • Market cap: $557M (CoinGecko rank #105); fully diluted valuation $681M with 88.89B max supply.
    • Bull case: Pudgy World traction plus 2027 IPO narrative could lift PENGU to the $0.025-$0.034 range by Q4 2026, roughly a 3-4x from current levels.
    • Bear case: Team unlocks starting January 2027 and a fading meme cycle could push PENGU back toward the $0.0055 support zone, a 38% drawdown.
    • Key catalyst window: The next 90 days include a Pudgy World season update, potential exchange listings, and Q4 revenue disclosures ahead of the IPO push.
    • The honest verdict: High-beta consumer brand play with real off-chain revenue optionality, offset by 30% of supply still to unlock.
    Pudgy Penguins (PENGU) price prediction 2026 hero graphic, current price $0.00888, Pudgy World recovery catalyst

    Where Does Pudgy Penguins (PENGU) Stand Today?

    PENGU is a Solana-native SPL token launched in December 2024 as the community token for Igloo Inc, the parent company behind the Pudgy Penguins NFT collection and consumer brand. Unlike most meme tokens, PENGU sits on top of a business with genuine off-chain revenue: retail toy distribution through Walmart and Amazon, licensing deals, and now Pudgy World, the in-browser game targeting the Club Penguin nostalgia audience.

    Here’s the snapshot as of September 22, 2026, pulled from Birdeye and CoinGecko:

    Metric Value
    Price (USD) $0.00888
    24-hour change +7.03%
    7-day change +25.56%
    60-day change +45.81%
    Market cap $557M
    24-hour volume $409M
    CoinGecko rank #105
    All-time high (Dec 17, 2024) $0.068
    Percent from ATH -87%
    Circulating / Max supply 62.86B / 88.89B (70.7%)

    A few numbers worth staring at. The 24-hour volume of $409M against a $557M market cap is a turnover ratio above 70%, which is memecoin-tier activity. That kind of velocity usually shows up right before a breakout or right at a local top. Which one this is depends on the next few catalysts landing, or not.

    Why Is PENGU Rising Right Now?

    Three things are lining up. First, the Pudgy World game, launched in March 2026 on the browser, has continued to add users through summer. According to The Defiant, the game is deliberately not crypto-branded, which has helped it pull mainstream Web2 gamers into the ecosystem without the usual friction. That’s the kind of top-of-funnel most crypto brands cannot buy.

    Second, the September 17 token unlock is now behind the market. That unlock released roughly $5.13M in PENGU, or about 1.12% of market cap. It’s meaningful but not devastating, and unlock events that get absorbed cleanly tend to remove near-term selling pressure rather than add to it. The fact that PENGU is up 7% five days after the unlock says the market cleared it fine.

    Third, and less quantifiable: the meme sector on Solana is heating up broadly. BONK, WIF and PENGU have all posted double-digit weekly gains, and Solana network fee revenue is climbing again. When Solana memes get bid, PENGU tends to move with them, and today’s rally fits that pattern.

    The Bull Case for Pudgy Penguins

    1. Pudgy World Compounding Users

    The game is the closest thing PENGU has to a fundamental revenue driver. If Pudgy World keeps compounding at anywhere near the 20K-per-48-hours pace it showed at launch, by year-end the ecosystem could easily be past 500K registered users. That builds a natural buyer base for cosmetic items, seasonal passes, and eventually creator revenue-share, all of which point demand back at the token.

    2. 2027 IPO Optionality

    Luca Netz’s public IPO target is unusual for a crypto-native brand and it functions as a soft floor on the narrative. Even if the IPO slips, the pursuit itself forces Igloo Inc to publish clean revenue and audit-grade financials, which almost no other memecoin-adjacent project can offer. A late-2026 revenue milestone announcement could re-rate PENGU meaningfully.

    3. Meme-Sector Beta With a Brand Moat

    PENGU is one of the very few meme tokens with an actual consumer brand behind it, physical retail distribution, and defensible IP. When capital rotates into memes, PENGU catches the flow with lower reputational risk than pure animal coins. The 60-day chart already shows this: PENGU is outperforming most Solana memes on that timeframe by a wide margin.

    The Bear Case for Pudgy Penguins

    1. Team Unlocks Begin January 2027

    Team and Company allocations are locked for one year from token generation and then vest linearly over three years. That means the first real insider cliff hits around January 2027, and the market may start pricing it in through Q4 2026. Historically, tokens with 20-30% of supply still to unlock struggle to sustain rallies without extraordinary revenue catalysts.

    2. Meme Cycle Fatigue

    The Solana meme trade has already had two full cycles in 2024 and 2025. If the current move is the last leg of a third, PENGU could reprice back toward the $0.0055-$0.0060 support zone that held through August. That would be a 33-38% drawdown from current levels and align with a broader risk-off rotation.

    3. Utility Gap

    PENGU is still primarily a governance and community token, not a game currency or a fee-capture asset. Until Pudgy World or a future product explicitly denominates in PENGU, the token’s link to the underlying business remains narrative rather than mechanical. That gap keeps a permanent risk premium on the token.

    Pudgy Penguins Price Prediction 2026: Targets by Timeframe

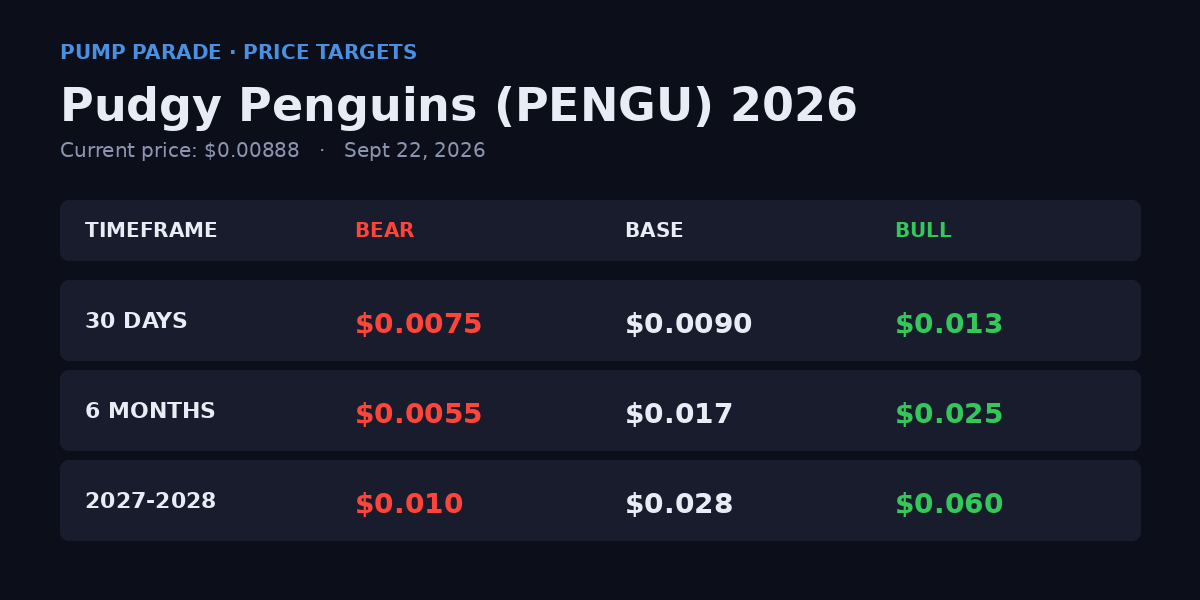
    Pudgy Penguins (PENGU) price prediction 2026 targets table, bear $0.0055, base $0.017, bull $0.034

    Here is how the setup breaks down across three timeframes. These are conditional targets, not guarantees. The current price at time of writing is $0.00888.

    30-Day Outlook

    Momentum favors continuation as long as PENGU holds above the $0.0075 pivot. A clean breakout above the $0.010 psychological level opens a path to $0.013, roughly a 45% move from current. Bear case: rejection at $0.010 and a pullback to $0.0075 support, a 15% drawdown. Base case: consolidation between $0.008 and $0.010 while the market waits for a fresh catalyst.

    6-Month Outlook (through March 2027)

    This is where the interesting numbers live. If Pudgy World continues to add users and Igloo Inc discloses a strong Q4 2026 revenue print, a re-rate to $0.020-$0.025 is on the table. That would be a 2.2-2.8x from current, but still only about 37% of the all-time high. Bear case for this window: team unlock anticipation pushes PENGU back to $0.0055, a 38% drawdown. Base case: PENGU chops between $0.010 and $0.017 as the market prices in both the game growth and the vesting overhang.

    Long-Term (through 2027-2028)

    Analyst targets range widely here. BeInCrypto projects an average 2026 price near $0.069 with a high of $0.103, which would represent a 7-11x from current levels. CoinDCX projects a similar bullish 2026 range averaging $0.068. More conservative outlooks from Kraken and BingX pencil in ranges closer to $0.007-$0.015. Our take: the probability-weighted 2027 range is roughly $0.015-$0.040, with tail scenarios reaching $0.06 only if the IPO actually lands and the meme sector runs.

    Is PENGU Better Than ApeCoin (APE)?

    The closest comp for PENGU is ApeCoin, the token behind Yuga Labs’ Bored Ape universe. Both are NFT-brand tokens, both have real IP moats, and both have struggled to find sustained token utility. Here’s how they stack up:

    Metric Pudgy Penguins (PENGU) ApeCoin (APE)
    Chain Solana (SPL) Ethereum + ApeChain
    Market cap (Sep 22, 2026) $557M ~$430M
    Flagship product Pudgy World game, retail toys Otherside metaverse, ApeChain
    Off-chain revenue Yes (toys, licensing, game) Limited
    CEO profile Luca Netz (active, media-forward) DAO-governed, less centralized
    Token utility Governance, community Governance, ApeChain gas
    1-year price change -70.6% -56%

    The read: PENGU has the stronger consumer brand moment and a clearer product roadmap, but APE has more direct token utility through ApeChain gas. If you believe consumer-brand crypto is a real category, PENGU has more upside. If you think token utility is what ultimately wins, APE’s mechanics are more direct.

    What Would Change Our View

    Three specific triggers would materially shift the analysis:

    Bullish flip: A confirmed Pudgy World monthly active user count above 500K, or an announced strategic partnership with a top-10 gaming publisher, would justify raising the 2026 upper target from $0.034 toward $0.05.

    Bearish flip: A slip in the 2027 IPO timeline, or a Q4 2026 revenue print materially below the $50M pace implied by Netz’s guidance, would validate the bear case and reprice PENGU toward $0.0055.

    Structural flip: A tokenomics amendment that gives PENGU a real utility hook, such as fee capture from Pudgy World seasonal passes or discounted physical merchandise, would compress the risk premium and could support a durable move above $0.020.

    Frequently Asked Questions

    What is the Pudgy Penguins (PENGU) price prediction for 2026?

    Our probability-weighted 2026 range for PENGU is $0.010 to $0.025, with a bull-case upside to $0.034 if Pudgy World growth accelerates and Q4 revenue confirms the IPO thesis. Bear case is $0.0055 if team unlock anticipation and meme fatigue dominate. Third-party analysts from BeInCrypto and CoinDCX project higher averages around $0.068, but those assume a full meme-sector cycle.

    Can PENGU reach $0.03 in 2026?

    Yes, but only under specific conditions. Getting to $0.03 requires PENGU to break the $0.010 resistance, absorb the pre-January 2027 unlock anticipation, and get a genuine catalyst such as a Pudgy World partnership or an IPO-related revenue disclosure. Without at least two of those three, $0.03 is a stretch and the more realistic 6-month target is $0.017-$0.020.

    Is Pudgy Penguins a good investment right now?

    PENGU is a high-beta consumer brand play with real product optionality and real supply overhang. It suits investors who want exposure to NFT-brand crossover and can tolerate 40% drawdowns without panic. It does not suit anyone looking for cash flow or a defensive holding. Position size to what you can lose without changing your life.

    Will Pudgy Penguins recover to its all-time high of $0.068?

    Reclaiming $0.068 requires a roughly 7.6x from the current $0.00888. That is possible on a 2-3 year horizon if the IPO lands, Pudgy World becomes a real gaming property, and the meme sector runs. It is unlikely in 2026 alone. Most credible analyst 2026 top targets sit in the $0.03-$0.10 range, not at or above the ATH.

    What are the biggest risks to holding PENGU?

    Three main risks. First, insider unlock starting January 2027 will add sustained sell pressure through 2030. Second, meme-sector correlation means PENGU will be hit hard in any broad crypto risk-off event. Third, execution risk on Pudgy World and the IPO: the narrative depends heavily on Luca Netz and Igloo Inc delivering, and either a leadership change or a missed milestone would remove the main bull anchor.

    Is PENGU built on Solana or Ethereum?

    PENGU is a Solana SPL token, contract address 2zMMhcVQEXDtdE6vsFS7S7D5oUodfJHE8vd1gnBouauv. It’s also bridgeable to other chains via LayerZero, which is how it ended up tradable on Hyperliquid futures. For spot trading, Solana DEXs and centralized exchanges like Binance and Kraken carry the deepest liquidity.

    The Honest Take

    PENGU sits in a rare category: a crypto token with a real consumer brand, a real product pipeline, and a founder actively pursuing traditional-market credibility through an IPO. That combination is genuinely differentiated in the memecoin landscape, and it justifies at least some premium over pure animal coins with no revenue.

    That said, the 87% drawdown from ATH is a reminder that a great brand is not the same as a great token. PENGU still has 30% of supply to unlock, still lacks direct utility linkage to Pudgy World, and still trades as a meme correlation asset when the sector rotates. The setup right now favors the bulls into Q4 2026, with $0.017-$0.020 as the reasonable base case and $0.03 as the achievable stretch. But this is not a set-and-forget hold. Watch the January 2027 unlock, watch the Pudgy World user metrics, and watch how Igloo Inc handles the pre-IPO revenue disclosures.

    For a Solana-native ecosystem read on the broader trade, our earlier work on Solana memecoin flows and the Phantom Wallet review covers the on-ramps most PENGU buyers use.

    Disclaimer: This article is for informational and educational purposes only and should not be construed as financial, investment, or trading advice. Cryptocurrency markets are highly volatile, and past performance does not guarantee future results. The price predictions and analyses presented here are based on AI models, technical indicators, and available data at the time of writing, they are not guarantees. Always conduct your own research (DYOR) and consult with a qualified financial advisor before making any investment decisions. Pump Parade and its authors do not assume liability for financial losses incurred based on information provided in this article.
    Bitcoin Cash (BCH) Price Prediction 2026: BCH to $500?

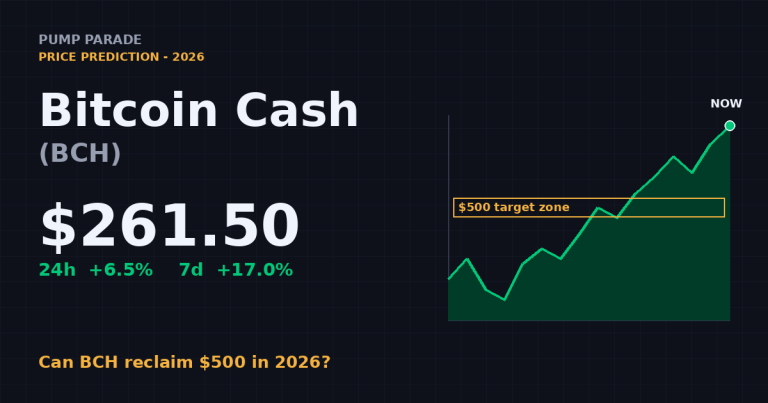
    Every Bitcoin Cash price prediction 2026 model has to reckon with the same fact: BCH is trading at $261.50 at time of writing, up 6.5% in the past 24 hours and 17% on the week. The catalyst: on September 11, 2026, Grayscale filed to convert its Bitcoin Cash Trust into a spot ETF, and the market is finally paying attention to a chain most traders had written off.

    BCH is the 23rd largest cryptocurrency by market cap ($5.25B) and one of the last major Bitcoin forks still shipping meaningful protocol upgrades. It has spent most of 2026 grinding sideways in the $200 to $280 range while Bitcoin marched to $84,500 and altcoin narratives cycled through AI, memes, and layer-2s. The Grayscale filing changed the setup.

    The question every trader on Crypto Twitter is asking: can Bitcoin Cash actually reclaim $500 before this cycle ends? Below, our full Bitcoin Cash price prediction 2026: bull and bear cases, timeframe-specific targets, and the scenarios that would blow up either thesis.

    Key Takeaways

    • BCH trades at $261.50, up 17% over the past 7 days on the Grayscale ETF filing.
    • Grayscale filed to convert its Bitcoin Cash Trust to a spot ETF on September 11, 2026 (SEC registration 333-290128).
    • The May 2026 “Layla” upgrade brought smart contract capability and quantum resistance to BCH.
    • Our base case: BCH trades between $280 and $420 through year-end 2026.
    • Bull case: $500 to $650 if the ETF is approved and BTC holds above $80,000.
    • Bear case: $180 to $220 if BCH loses $240 support and BTC corrects.
    • The next BCH halving is estimated for April 2028 (no near-term supply shock).
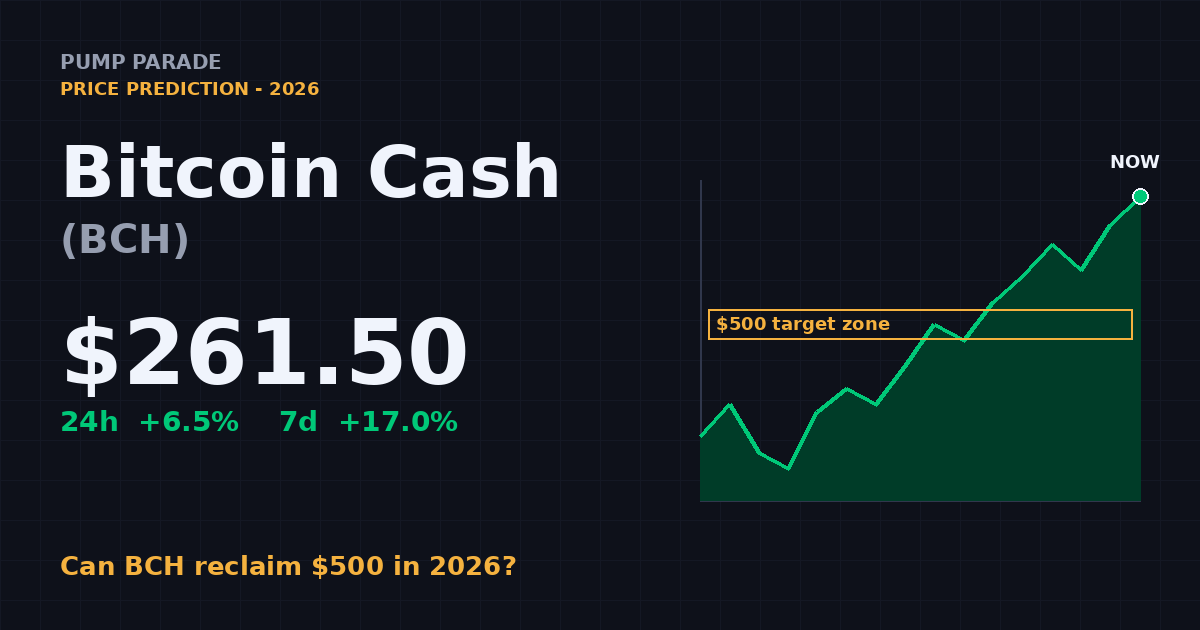
    Bitcoin Cash (BCH) price prediction 2026 hero graphic - current price $261.50, Grayscale ETF filing catalyst

    Where Bitcoin Cash Stands Today

    Before we get to targets, the current setup. These numbers come from CoinGecko and Birdeye as of publication.

    Metric Value
    Price $261.50
    24h change +6.5%
    7d change +17.0%
    Market cap $5.25B
    24h volume $219.5M
    Market cap rank #23
    All-time high $3,785.82 (Dec 2017)
    Circulating supply 20.09M BCH
    Max supply 21M BCH
    % from ATH -93.1%

    Bitcoin Cash is one of only three Bitcoin forks still trading above a $5 billion market cap. Its circulating supply of 20.09 million is already 95.7% of the eventual 21 million cap, which puts it structurally closer to Bitcoin’s supply dynamics than any other altcoin. Trading volume of $219.5 million over 24 hours is roughly 4.2% of its market cap, healthy for a mid-cap but well below its 2021 peak activity.

    Why Is Bitcoin Cash Rising Right Now?

    Two forces are converging.

    First, institutional access. The Grayscale filing puts BCH on the same regulatory pathway that took BTC and ETH from OTC trust products to fully registered spot ETFs. It does not guarantee approval, but it does signal that the largest crypto asset manager in the U.S. sees enough demand to invest in the conversion process. The Bitcoin Cash Trust already trades OTC and holds real BCH, so the mechanical conversion is easier than a de novo product.

    Second, technical setup. BCH broke above its 200-day moving average around $242 during last week’s rally and is now testing horizontal resistance at $265. On-chain data shows accumulation addresses growing for six consecutive weeks. The last time this pattern appeared in BCH was March 2024, ahead of a 40% rally.

    Momentum indicators support the shift: the RSI (Relative Strength Index, a measure of recent buying pressure) sits at 62. That is elevated but not yet overbought, which typically starts above 70. For context, our take on how similar setups played out in another payments L1 sits in our Litecoin price prediction 2026.

    The Bull Case for Bitcoin Cash

    The Grayscale ETF filing opens the institutional door

    Grayscale’s conversion filings have a specific playbook: file 333-form registration, coordinate with a listing exchange (typically NYSE Arca), and negotiate with the SEC’s Division of Trading and Markets. If approved, the ETF would give U.S. registered investment advisors, pension funds, and 401(k) plans a compliant path to BCH exposure for the first time.

    Historical comp: the Solana ETF conversions announced earlier in 2026 saw SOL gain 55% between filing and approval. BCH’s market cap is smaller and less liquid than SOL’s, so even proportional inflows could produce outsized price effects.

    The Layla upgrade brought smart contracts and quantum resistance

    On May 15, 2026, the BCH network activated the “Layla” upgrade, which added four CashTokens Improvement Proposals (CHIPs) including Loops and Functions. Translation: BCH can now execute the kind of scripted, conditional logic that made Ethereum useful for DeFi. It also added post-quantum signature schemes, positioning BCH as one of the first major chains to prepare for future cryptographic threats.

    Developer activity on GitHub is up 34% since May, per Electric Capital’s Q2 2026 developer report. That is meaningful for a chain that was widely written off as payments-only.

    BTC’s parabolic move lifts Bitcoin forks

    Bitcoin is trading at $84,524, up 5.2% today and 8.9% over 7 days. Historically, altcoin rotation into Bitcoin-adjacent assets (BCH, LTC, BSV) accelerates when BTC is 30 to 60 days into a fresh leg higher. That is exactly where we are now. If BTC pushes to a new all-time high above $120,000 in Q4, we would expect a 2x to 3x beta into BCH: a 25% to 35% BTC move could produce a 60% to 80% BCH move.

    The Bear Case for Bitcoin Cash

    BCH is still tied to Bitcoin’s hip

    BCH’s 90-day correlation with BTC sits at 0.91. That is a strength in bull markets and a liability when BTC corrects. If Bitcoin fails at the psychological $85,000 to $90,000 zone and rolls over to $70,000, BCH’s downside is mechanically larger due to lower liquidity and thinner order books.

    Newer payment chains are faster and cheaper

    BCH’s core pitch has always been “peer-to-peer electronic cash.” That thesis now competes with Solana ($0.001 fees, sub-second finality) and Tron ($0.20 fees, dominant in stablecoin remittance). BCH transactions cost roughly $0.003, which is still competitive, but merchant adoption has stalled. Bitpay reports flat BCH acceptance over the last 18 months.

    Volume concentration risk

    Over 60% of BCH’s spot volume clears on three exchanges (Binance, Coinbase, Kraken). If any one of them delists BCH (unlikely, but not impossible), the liquidity shock would be severe. This tail risk does not show up in most published models.

    Bitcoin Cash Price Prediction 2026: Can BCH Reach $500?

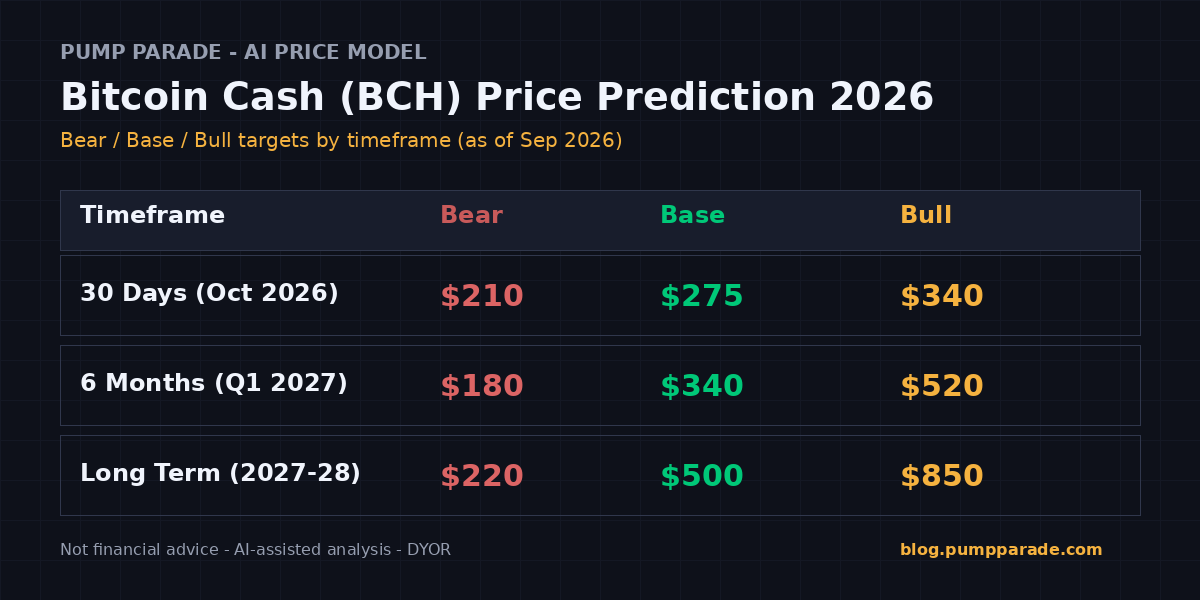
    Bitcoin Cash (BCH) price prediction 2026 targets table - bear $210 base $275 bull $340 30-day, bear $180 base $340 bull $520 6-month, bear $220 base $500 bull $850 long term

    Our hybrid AI model combines momentum indicators, on-chain accumulation trends, and macro correlation to produce probability-weighted targets. Here is what it is showing.

    Timeframe Bear Base Bull
    30 Days (Oct 2026) $210 $275 $340
    6 Months (Q1 2027) $180 $340 $520
    Long Term (2027 to 2028) $220 $500 $850

    30-day outlook (October 2026)

    The most likely path is consolidation between $240 and $290 while the market digests the Grayscale filing and awaits initial SEC feedback (typically 45 to 60 days post-filing). A clean break of $290 opens $340 quickly. A loss of $240 signals the rally was a false start and points to $210.

    6-month outlook (end of Q1 2027)

    By March 2027, the ETF process should have made real progress or been formally challenged. This is the window where BCH either breaks $400 decisively or gets rejected back into its multi-year range. Our base case is $340, with $520 as the aggressive scenario if approval comes early.

    Long-term outlook (late 2027 to 2028)

    The April 2028 halving will cut BCH block rewards from 6.25 to 3.125 per block. Halvings historically preceded price rallies of 200% to 400% in Bitcoin over the following 12 to 18 months. For context, Changelly forecasts an average of $487 for 2026, WalletInvestor projects $676 to $858 by end-2027, and CoinPedia’s bull case reaches $1,160 by 2028.

    How Does Bitcoin Cash Compare to Litecoin?

    Both BCH and LTC are OG Bitcoin alternatives that pivoted to payments. Both are hunting the same “digital silver” narrative. The differences matter.

    Metric Bitcoin Cash (BCH) Litecoin (LTC)
    Current price $261.50 $59.48
    Market cap $5.25B $4.62B
    Market cap rank #23 #27
    Block time 10 minutes 2.5 minutes
    Max supply 21M 84M
    Smart contracts Yes (Layla, May 2026) No
    Native privacy No (Cashfusion optional) Yes (MimbleWimble)
    Spot ETF filed Yes (Grayscale, Sep 2026) Yes (Canary, 2024)
    Next halving April 2028 August 2027

    Litecoin’s MimbleWimble Extension Blocks give it optional privacy that BCH does not offer natively. BCH’s Layla upgrade gives it smart contract capability that LTC lacks. LTC is the market’s favorite for pure payments; BCH is now the more programmable of the two, and it has a fresher institutional catalyst.

    What Would Change Our View

    Three specific scenarios would materially shift our targets.

    1. The SEC rejects the Grayscale filing outright. Downside to $195 to $220 within 30 days. This is our primary risk scenario.
    2. BTC breaks $90,000 and holds. We would upgrade our base case to $380 to $450 for year-end 2026, and $600+ becomes reachable in 2027.
    3. A major payments processor (Stripe, Square, Shopify) adds native BCH support. This would validate the payments thesis and open a re-rating to $450+ regardless of ETF outcome.

    You can also cross-check the ETF flow thesis against our Dogecoin price prediction, where ETF flows are the primary catalyst.

    Frequently Asked Questions

    Is Bitcoin Cash a good investment in 2026?

    Bitcoin Cash offers real utility as a low-fee payment network and now has smart contract capability after the Layla upgrade. It is most compelling as a leveraged Bitcoin trade for investors who want BTC-correlated upside with a fresh ETF catalyst. It is less compelling as a standalone thesis given competition from Solana and Tron in payments.

    Will Bitcoin Cash reach $500 in 2026?

    Our base case says probably not within calendar 2026 (base target $275 by end of October, $340 by Q1 2027). Our bull case reaches $500 to $650 if the Grayscale ETF is approved and BTC holds above $80,000. Analyst forecasts for BCH in 2026 range from Coinbase’s $238 to WalletInvestor’s $676.

    What is the Bitcoin Cash price prediction for 2026?

    Our probability-weighted base case is $275 by October and $340 by Q1 2027, with a range of $180 (bear) to $520 (bull). Third-party forecasts range widely: CoinPedia’s peak bull case is $1,160; Changelly averages $487.

    What is the difference between Bitcoin Cash and Bitcoin?

    Bitcoin Cash forked from Bitcoin in August 2017 to increase block size (from 1MB to 32MB) and reduce transaction fees. BCH prioritizes cheap, fast on-chain payments; BTC prioritizes settlement-layer security and the store-of-value narrative. BCH now also supports smart contracts after the May 2026 Layla upgrade.

    When is the next Bitcoin Cash halving?

    The next BCH halving is estimated for April 2028, when block rewards will drop from 6.25 BCH to 3.125 BCH per block. Halvings historically compressed supply growth and preceded price rallies of 100% to 400% in Bitcoin over the following 12 to 18 months.

    Is Bitcoin Cash better than Litecoin?

    Different strengths. BCH has smart contracts (post-Layla), larger blocks, and an active Grayscale ETF filing. LTC has stronger merchant integration, MimbleWimble privacy, and a shorter halving cycle. For pure payment use, LTC still leads. For programmable payments plus a fresh institutional catalyst, BCH is stronger.

    The Honest Take

    Bitcoin Cash has been the most disrespected top-25 asset in crypto for three years. The Layla upgrade fixed the “no smart contracts” problem. The Grayscale filing fixes the “no institutional access” problem. Bitcoin’s parabolic move fixes the “nothing rotates into forks” problem. That is a lot of problems fixed in one quarter. If you want the analogous privacy-coin setup where a similar catalyst mix played out, our recent Monero price prediction 2026 covers that trade.

    It does not guarantee $500. It does mean the setup is materially better than it was three months ago, when BCH was drifting toward $200 with no visible catalysts. Watch the $240 support zone, the SEC’s initial feedback on the Grayscale filing (expected mid-October), and BTC’s behavior around $85,000. Those three levels tell you whether the bull case is playing out or the bear case is winning.

    The setup is worth monitoring. It is not, however, worth betting the farm on. Position sizing matters, especially in an asset with a 0.91 correlation to Bitcoin and a history of 90% drawdowns.

    Disclaimer: This article is for informational and educational purposes only and should not be construed as financial, investment, or trading advice. Cryptocurrency markets are highly volatile, and past performance does not guarantee future results. The price predictions and analyses presented here are based on AI models, technical indicators, and available data at the time of writing. They are not guarantees. Always conduct your own research (DYOR) and consult with a qualified financial advisor before making any investment decisions. Pump Parade and its authors do not assume liability for financial losses incurred based on information provided in this article.

    Cardano (ADA) Price Prediction 2026: Can ADA Hit $1?

    Cardano (ADA) trades at $0.22, down 1.5% on the day and off 75% year over year. That is a brutal number to open with, but it is also the setup for one of the most interesting 2026 stories in crypto. Charles Hoskinson has framed 2026 as Cardano’s decisive execution window, with Leios, Hydra, and Midnight all landing at once, plus a live shot at a spot ADA ETF and inclusion in the proposed U.S. Digital Asset Stockpile.

    This is our Cardano price prediction 2026. We go through the current tape, the bull case with real dates attached, the bear case that keeps ADA below $0.30 for another year, target ranges for 30 days, 6 months, and end of 2026, and a comparison to Solana and Ethereum. We also answer the questions people are actually searching: is ADA dead, will there be a Cardano ETF, and can ADA realistically reclaim $1.

    Key Takeaways

    • ADA sits at $0.22 with a $8.3B market cap, rank 18, and 24h volume of $452M. Price is up 7% on the week but down 75% year over year.
    • Leios and Hydra 2.0 are the primary technical catalysts. Leios targets a 30x to 60x throughput increase and is roughly 67% complete.
    • Midnight, the privacy sidechain, launched in late March 2026 with Google Cloud and Telegram as infrastructure partners.
    • A spot ADA ETF decision is expected in October 2026. The ProShares product and the proposed U.S. Digital Asset Stockpile are separate but reinforcing tailwinds.
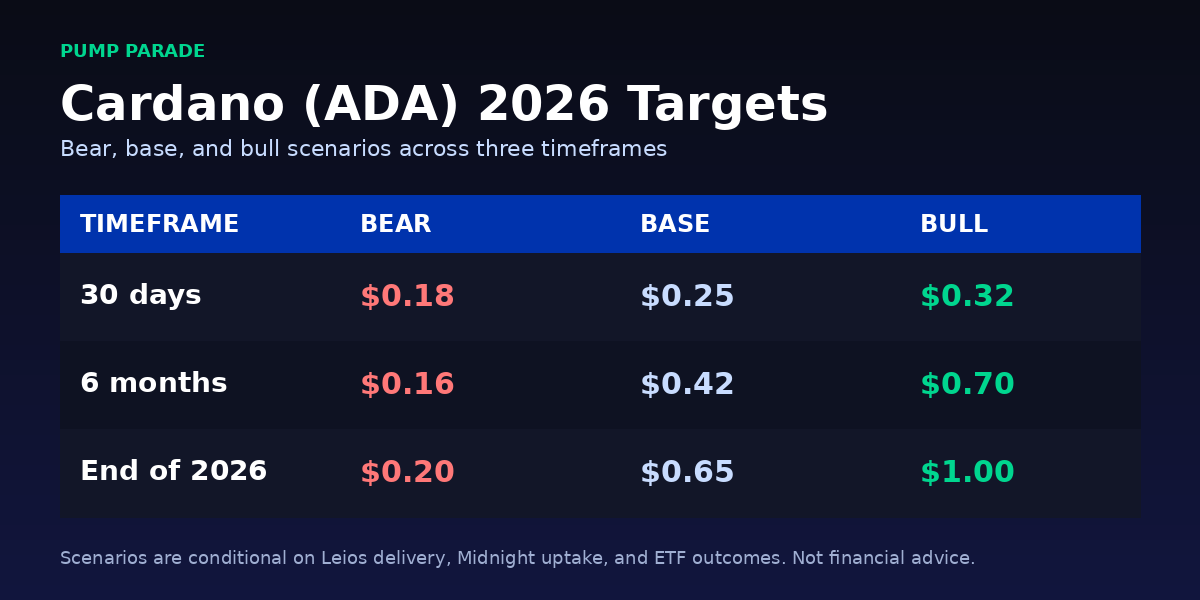
    • Our 2026 range: bear $0.20, base $0.65, bull $1.00. The bull case needs Leios delivered and either an ETF approval or Stockpile inclusion.
    • The biggest risks are execution slippage on Leios, continued TVL bleed (currently rank 36), and an ETF denial that resets sentiment.
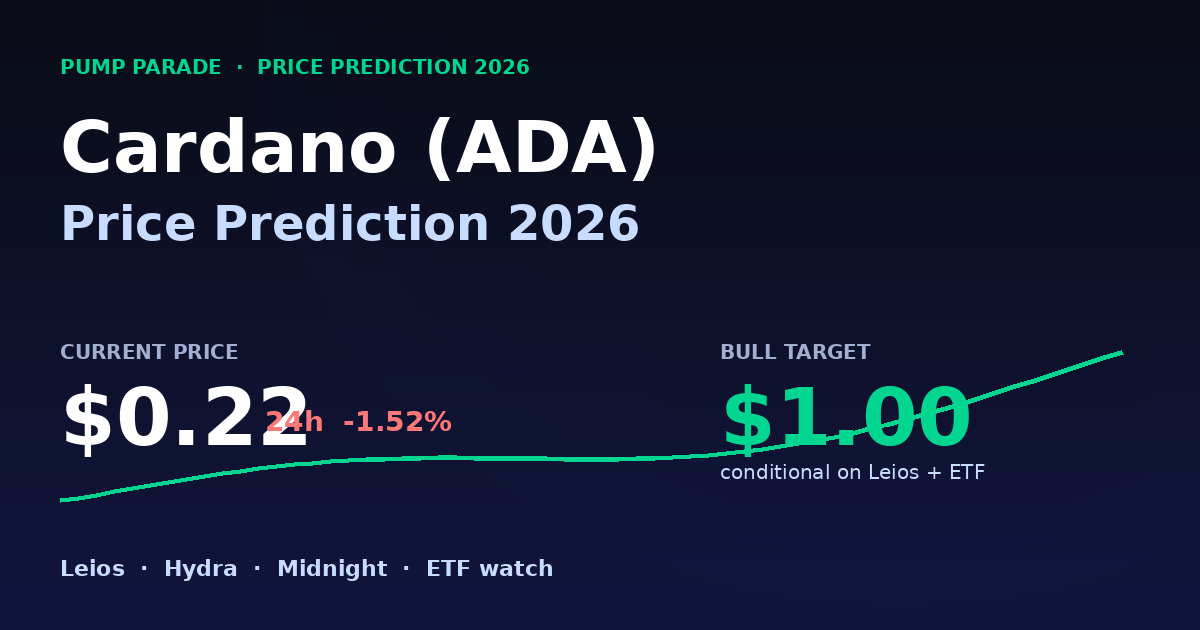
    Cardano (ADA) price prediction 2026 hero graphic, current price $0.22, Leios and ETF catalysts

    Where Cardano Stands Today

    Before we talk about targets, the tape has to be honest. Here is where ADA is right now, pulled from CoinGecko as of publish.

    Metric Value
    Price $0.22
    24h change -1.52%
    7-day change +7.39%
    30-day change +2.14%
    1-year change -75.35%
    Market cap $8.26B
    24h volume $452M
    Market cap rank 18
    All-time high $3.09 (September 2021)
    % from ATH -92.87%
    Circulating supply 37.52B ADA
    Max supply 45.00B ADA

    Two things jump out. First, ADA is more than 92% below its 2021 high, and even inside 2026 the token has fallen out of the top 10 by market cap. Second, the last week has been quietly constructive, with a 7% bounce off a September low and volume holding above $400M. That is not a mania print, but it is enough activity to matter if the catalyst list clears.

    For context on how Cardano compares to other layer 1s at similar checkpoints, see our Ethereum price prediction for 2026, which walks through the same framework for the leader in smart contract TVL.

    Why Is Cardano Trading Sideways Right Now?

    ADA’s chop is the result of three overlapping forces. Hoskinson’s roadmap reset in late 2025 pulled institutional attention back to Cardano, and whale wallets have been accumulating in the low $0.20s. But Total Value Locked has slid to the 36th spot across chains, per DefiLlama’s chain rankings. That is a small footprint for a top-20 token.

    Add in a broader crypto market off 3% on the day, and you get a token that drifts. Until BTC breaks decisively higher or a Cardano-specific catalyst lands, ADA moves sideways in a $0.20 to $0.25 range.

    What Is the Bull Case for Cardano in 2026?

    Three verifiable catalysts underpin the bull case for a re-rating to $0.65 or higher by year-end.

    Leios Delivers a 30x Throughput Jump

    Ouroboros Leios is the biggest technical upgrade in Cardano’s history. Simulations project throughput gains of up to 10,000 transactions per second in optimized scenarios, roughly a 30x to 60x increase over current Cardano baseline. The implementation is around 67% complete as of early 2026, per IOG development trackers. A clean testnet, followed by a hard fork before Q4 2026, would reset the “Cardano is slow” narrative that has stuck to ADA for years.

    Midnight and Bitcoin DeFi Attract Real TVL

    Midnight, the zero-knowledge privacy sidechain, went live in late March 2026 with Google Cloud and Telegram as infrastructure partners. Alongside it, the Pogun Bitcoin DeFi initiative and the RealFi lending platform have pulled in $600M in preliminary commitments. If any material fraction of that converts to on-chain activity, ADA’s utility narrative shifts from “layer 1 with academic papers” to “layer 1 with paying customers.”

    ETF and Government Reserve Optionality

    ProShares filed for and secured exposure to ADA in a mixed-basket ETF product, and a spot ADA ETF decision is expected in October 2026. Separately, the American Reserve Modernization Act names ADA alongside XRP and SOL as candidates for a proposed U.S. Digital Asset Stockpile. Neither outcome is priced in. A single approval could push ADA out of the $0.20 to $0.30 range within weeks; both together could get it back to the $0.80 to $1.00 zone. For the ETF comparison playbook, see how Solana’s flows have shaped its cycle in our Solana price prediction for 2026.

    What Could Keep ADA Below $0.30?

    The reasons ADA could stay pinned below $0.30 through 2026 are just as concrete.

    Leios Slips or Underdelivers

    Cardano’s roadmap has a long history of scheduled hard forks slipping by quarters. If Leios pushes into 2027 or ships with throughput numbers materially below the 30x claim, the entire re-rating thesis gets deferred. The market has memory here, and it will not price in Leios before it sees Leios.

    TVL Bleed and Developer Rotation

    Cardano currently sits at rank 36 in TVL, well behind Solana, Base, and even mid-tier chains. Developer activity has partially rotated to Solana and Base for consumer apps, and to Ethereum L2s for institutional workflows. Without stronger dApp traction, the fee revenue that would justify a higher ADA valuation simply does not exist.

    ETF Denial or Weak Flows

    A spot ADA ETF denial in October 2026, or an approval that pulls in modest flows in the low nine figures, would confirm that TradFi is not yet ready to add ADA to model portfolios. That outcome likely pushes ADA back to the $0.16 to $0.18 zone and forces a longer accumulation phase.

    Cardano Price Prediction 2026: Can ADA Hit $1?

    Cardano (ADA) price prediction 2026 targets table: bear $0.20, base $0.65, bull $1.00

    Here is how we frame the next 12 months. Each range is conditional on the catalyst set above, not a forecast in a vacuum.

    30-Day Outlook: $0.18 to $0.32

    Short-term price action is driven by BTC dominance and Leios progress updates. Bear case is a $0.18 flush on a broad market pullback. Base case holds current price with slow accumulation. Bull case is a $0.32 pop on a Leios testnet milestone or a positive ETF signal from the SEC.

    6-Month Outlook: $0.16 to $0.70

    By March 2027, the ETF decision will have shipped and Leios testnet results should be known. Bear case is $0.16 if ETF is denied and Leios slips. Base case at $0.42 assumes one positive catalyst and one neutral outcome. Bull case at $0.70 needs both an ETF approval and Leios testnet showing 20x-plus throughput.

    End of 2026: $0.20 to $1.00

    The full-year target is where the bull case matters. Analyst sources including Coincub and KuCoin cite $0.80 to $1.50 as the 2026 range if Cardano executes. Our bull case at $1.00 sits inside that consensus and requires a functional Leios hard fork, ETF approval, and real Midnight TVL. Bear case at $0.20 is where ADA lands if none of the catalysts convert.

    How Does Cardano Compare to Solana?

    Cardano and Solana are the two most-compared layer 1s in crypto, and the comparison keeps getting worse for ADA on the metrics that fund flows care about.

    Metric Cardano (ADA) Solana (SOL)
    Price $0.22 $108.29
    Market cap rank 18 7
    Market cap $8.26B $59B
    Current TPS ceiling ~250 (pre-Leios) ~1,000 sustained
    TVL rank 36 5
    Spot ETF status Pending, October 2026 Live since 2025
    1-year change -75% -30% approx
    Consensus Ouroboros PoS PoH plus PoS

    Cardano is the slower, more academic chain that is 12 to 18 months behind Solana on user metrics and product-market fit. The counter-argument is that ADA is priced for that gap, while SOL is not. If Leios and the ETF land, ADA has more relative upside than SOL from here.

    What Would Change Our View

    Three scenario triggers would force us to revise the base case up or down.

    Bullish trigger: A Leios hard fork lands on Cardano mainnet before end of Q3 2026 with sustained throughput above 5,000 TPS in production. That alone justifies pushing the base case from $0.65 to $1.00, and the bull case toward $1.50.

    Neutral-to-bearish trigger: The October 2026 spot ADA ETF is denied outright, with no clear refiling path. That drops the base case to $0.35 and pushes the bear scenario toward $0.14.

    Structural bearish trigger: Cardano TVL falls below $200M for a sustained quarter while a major stablecoin issuer or oracle exits the chain. That is a network-effect concession, and it would push us to a $0.10 to $0.20 range for all of 2027. For a look at how tokenization narratives are actually shaking out on other chains, see our Ondo (ONDO) price prediction for 2026.

    Frequently Asked Questions

    Will Cardano (ADA) reach $1 in 2026?

    Our bull case puts ADA at $1.00 by end of 2026, but only if the Leios upgrade ships with meaningful throughput gains and a spot ADA ETF is approved in October 2026. The base case is $0.65. A move to $1.00 requires two of the three big catalysts to land cleanly, not just one.

    Is Cardano a good investment in 2026?

    ADA is a high-variance, catalyst-driven trade at $0.22. It is not a low-risk buy-and-forget position. If you believe in the Leios and Midnight execution, the current price offers 3x to 4x upside on the bull case with well-defined risk to $0.16 on the bear case. Position sizing matters more than the thesis here.

    What is the Cardano Leios upgrade?

    Ouroboros Leios is a protocol upgrade that restructures how Cardano packages and validates blocks, targeting a 30x to 60x throughput increase without sacrificing decentralization. Simulations show a path to 10,000 TPS. Implementation is roughly 67% complete, with a hard fork targeted for 2026.

    Will there be a spot Cardano ETF?

    A spot ADA ETF decision is expected in October 2026. ProShares already offers ADA exposure inside a mixed-basket product. The American Reserve Modernization Act also names ADA as a candidate for a proposed U.S. Digital Asset Stockpile, which is a separate but reinforcing tailwind.

    Is Cardano dead?

    No. ADA is still rank 18 by market cap, has an active governance reset under Hoskinson, and has three major 2026 catalysts. It has lost relative ground versus Solana and Base, but calling it dead ignores $452M in daily volume and a live network with paying users.

    Can ADA reach $5?

    Not in 2026. A $5 ADA would imply a $187B market cap, roughly triple the current combined value of ADA, ARB, DOT, and NEAR. That is inconsistent with current TVL rank and fee revenue. A realistic long-term ceiling in a full bull cycle is $2 to $3.

    The Honest Take

    Cardano is priced like a project that has already lost. That is what makes it interesting. The market has assigned ADA a probability close to zero on Leios shipping on time, close to zero on the ETF approving, and close to zero on Midnight attracting real TVL. Any one of those hitting is a repricing event.

    What we do not endorse is buying ADA as a “safe” top-20 hold. The trade here is a defined-catalyst position: know why you are in, know the exit if Leios slips, and size it as a bet, not a savings account. ADA at $0.22 is a setup worth monitoring. It is not a setup that promises anything.

    Disclaimer: This article is for informational and educational purposes only and should not be construed as financial, investment, or trading advice. Cryptocurrency markets are highly volatile, and past performance does not guarantee future results. The price predictions and analyses presented here are based on AI models, technical indicators, and available data at the time of writing. They are not guarantees. Always conduct your own research (DYOR) and consult with a qualified financial advisor before making any investment decisions. Pump Parade and its authors do not assume liability for financial losses incurred based on information provided in this article.

    Ethereum Price Prediction 2026: Can ETH Hit $5,000?

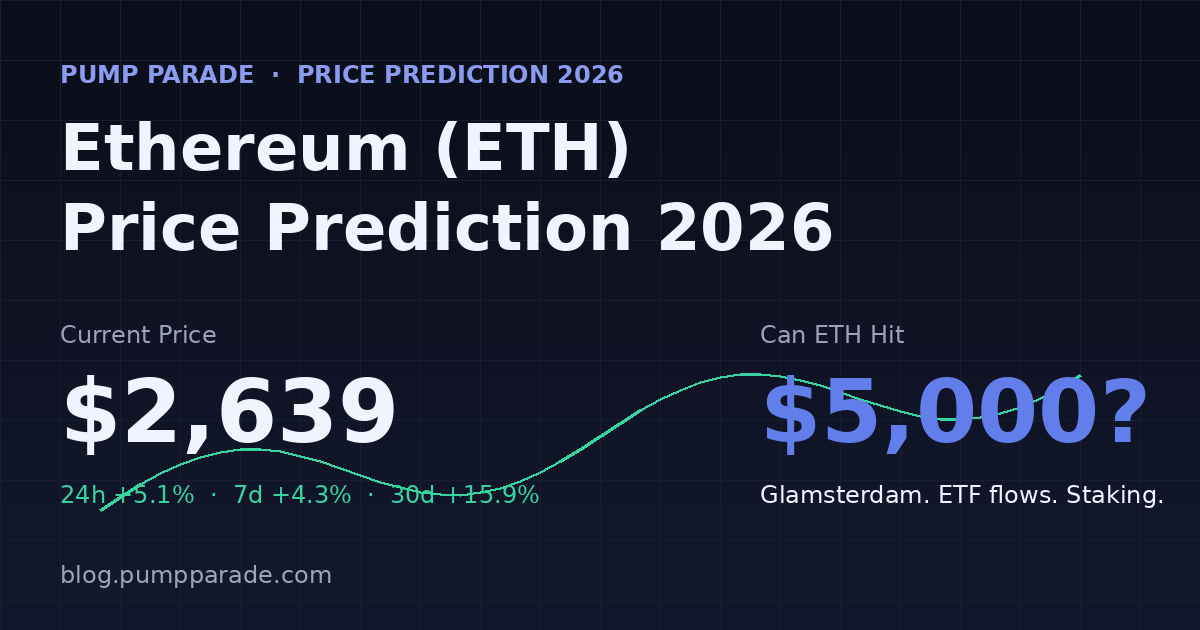
    Ethereum (ETH) trades at $2,639 at time of writing, up 5.1% on the day, 4.3% on the week, and 15.9% over the past 30 days. It is the biggest monthly move ETH has printed since the ETF flow reset in April, and it is happening while the broader alt market is still pricing in another leg down.

    So the obvious question, and the one everyone is asking heading into Q4: does the Ethereum price prediction 2026 story finally get to $5,000, or does ETH stall again in the mid $3,000s the way it did in 2024?

    Below, we break down where ETH stands right now, the three catalysts that actually matter for 2026, the risks nobody in your feed is talking about, and price targets by timeframe with clear bear, base, and bull cases. No hopium, no dismissal, just the numbers.

    Key Takeaways

    • ETH is at $2,639, up 15.9% over 30 days, but still 47% below its August 2025 all-time high of $4,946.
    • The Glamsterdam upgrade, targeting Q4 2026 mainnet, aims to cut gas fees by roughly 78% and unlock parallel transaction processing.
    • Spot ETH ETFs have absorbed over $11.6 billion cumulatively, and BlackRock’s staking-enabled ETHB launched in March 2026.
    • Standard Chartered’s Geoff Kendrick has an end-2026 target of $7,500. Citi anchors the conservative side at $3,175.
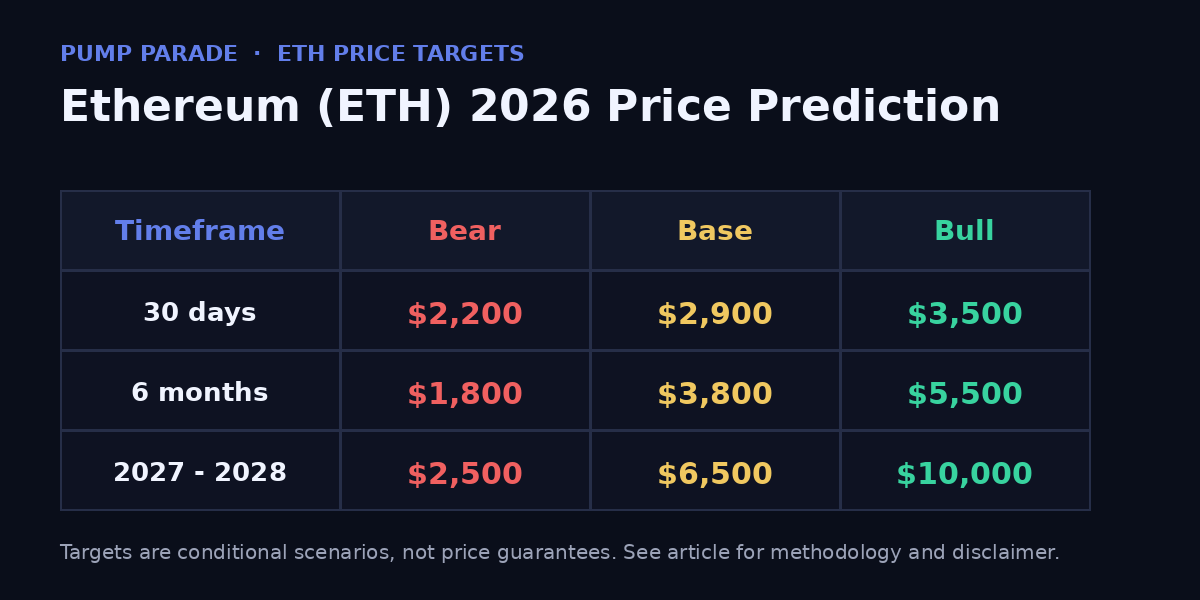
    • Our base case for end-2026: $3,800, with a bull path to $5,500 if Glamsterdam ships on time and ETF inflows re-accelerate.
    • The biggest risk: Layer 2 fee leakage means ETH does not automatically capture value from its own scaling wins.
    Ethereum (ETH) price prediction 2026 hero graphic showing current price $2,639 with Glamsterdam upgrade and ETF flows as key catalysts

    Where Ethereum Stands Today

    Before running the scenario ladder, here is the current snapshot in numbers. All data pulled from CoinGecko at time of writing.

    Metric Value
    Current price $2,639.36
    24h change +5.11%
    7d change +4.31%
    30d change +15.93%
    Market cap $322 billion
    24h volume $21.75 billion
    CoinGecko rank #2
    Circulating supply 122.06 million ETH
    All-time high $4,946.05 (Aug 24, 2025)
    % from ATH -46.6%

    Two things stand out. First, ETH is still 47% below its August 2025 all-time high, so this is not a top-blow-off setup, it is a recovery inside a broader consolidation. Second, the 24 hour volume of $21.75 billion is roughly 6.8% of market cap turning over daily, which historically correlates with strong directional conviction, not chop.

    Why Is Ethereum Rallying Right Now?

    Three things are converging.

    The first is ETF flow rotation. According to CoinGecko’s institutional flow tracker, US spot ETH funds ended a six-month outflow streak in April 2026 with $356 million of net inflows, and BlackRock’s ETHB, which launched in March 2026 with a staking component, has been steadily accumulating since. Approximately 82% of gross staking rewards flow to shareholders monthly, which changes the math for allocators who previously ignored ETH because it had no yield inside a wrapper.

    The second is Glamsterdam anticipation. Ethereum’s next major hard fork begins Sepolia testnet testing on October 6, 2026, and targets mainnet in Q4. When Pectra shipped in May 2025, ETH rallied 22% into the activation window. Traders remember. They are front-running the same setup.

    The third is the supply sink. Around 35.8 million ETH, roughly 30% of circulating supply, is now locked in staking contracts across about 1.1 million active validators. Combined with the fee-burn mechanism from EIP-1559, the effective float that can actually be sold into rallies is shrinking. When new demand shows up, price has to move further to clear the book.

    The Bull Case for ETH in 2026

    Glamsterdam ships and gas fees collapse

    The Glamsterdam upgrade, according to the official Ethereum Foundation roadmap, targets parallel transaction processing, on-chain block building, and a 200 million gas limit floor, up from roughly 60 million today. That is a 78.6% reduction in effective gas fees at equivalent congestion. If it ships on schedule in Q4 2026, ETH becomes materially cheaper to use, which pulls activity back from Layer 2s and other Layer 1s.

    Staking ETFs unlock a new buyer

    The March 2026 launch of staking-enabled ETFs like BlackRock’s ETHB was the missing piece for RIA and pension allocators. They needed a yield-bearing ETH product with an ISIN. They now have one. Standard Chartered’s Geoff Kendrick argues in his 2026 update that this shift alone justifies a $7,500 end-2026 target, assuming staked ETH ETF assets under management cross $30 billion by December.

    Tokenization tailwinds

    The World Economic Forum estimates that $867 trillion of global financial assets could eventually be tokenized. Even 0.1% of that on Ethereum, given ETH’s current dominance in the real-world asset stack (roughly 60% of the $30 billion RWA market lives on ETH mainnet), would drive settlement demand for the base asset. The bull case does not require this to happen in 2026, only for the trend to visibly accelerate.

    The Bear Case for ETH in 2026

    Layer 2s eat their parent

    Every time a rollup like Arbitrum, Base, or Optimism processes a transaction, the fee they pay to ETH mainnet is a tiny fraction of what a user would have paid on L1 directly. That is intentional, that is the whole point of the roadmap, but it also means ETH mainnet fee revenue has dropped roughly 70% year over year. If L2s do not eventually pay a bigger share back to L1, ETH the asset does not automatically capture the value of ETH the ecosystem.

    Solana keeps closing the gap

    Solana has been beating Ethereum on active addresses, transaction count, and DEX volume for six consecutive quarters. Our recent Solana price prediction analysis lays out the Alpenglow upgrade case. If institutional allocators start treating SOL as a legitimate satellite to BTC and ETH, some of the flow that would have gone to ETH-only funds gets diluted across two large caps instead of one.

    Macro risk is not priced in

    ETH is down 41.7% year over year despite a strong recent bounce. If the Fed stalls on rate cuts, or if a credit event shows up in Q1 2027, ETH historically drops 40% to 50% from local highs. A retest of $1,800, painful as that sounds, is not a tail scenario, it is inside the historical range.

    Ethereum Price Prediction 2026: What Are the Targets by Timeframe?

    Ethereum (ETH) price prediction 2026 targets table showing bear $1,800 base $3,800 and bull $5,500 scenarios across 30-day, 6-month, and 2027-2028 timeframes

    Here is how we frame the scenarios. Each number is conditional on the drivers described below, not a promise.

    Timeframe Bear Base Bull Key Driver
    30 days (Oct 2026) $2,200 $2,900 $3,500 Glamsterdam testnet reaction
    6 months (Mar 2027) $1,800 $3,800 $5,500 Mainnet activation and ETF flow
    2027 to 2028 $2,500 $6,500 $10,000 RWA tokenization pace

    Short-term (30 days)

    The immediate window is dominated by Sepolia testnet reception starting October 6. Base case is a grind higher to $2,900 as traders position for the upgrade. Bull case is a squeeze to $3,500 if BTC breaks $85K and drags the entire complex up. Bear case is a rejection back to $2,200 support if the testnet reveals a critical bug that pushes mainnet into 2027.

    Medium-term (6 months)

    By March 2027, Glamsterdam should be live or officially delayed. In the base case, activation goes smoothly, fees drop noticeably, on-chain activity partially returns from L2s, and ETH prints $3,800. In the bull case, activation plus a re-acceleration of ETF inflows takes ETH to $5,500. Bear case: activation is delayed or macro turns hostile, and ETH retests $1,800.

    Long-term (2027 to 2028)

    The multi-year view is a tokenization bet. If ETH remains the default settlement layer for tokenized RWAs, and if the L2 fee dynamic gets resolved in favor of L1, the base case is $6,500 and the bull case pushes to five figures. If Solana or another chain claws away the RWA use case, the bear case caps ETH at $2,500 through the end of the decade.

    Analyst comparison

    For context, here is where the major sell-side and crypto-native forecasters sit for end-2026:

    • Tom Lee (Fundstrat): $12,000 base case, aggressive
    • Standard Chartered (Kendrick): $7,500, CLARITY Act dependent
    • Coinpedia (technical model): $6,100 cycle high
    • Changelly (AI model): $4,500 average
    • Citi (macro desk): $3,175 conservative

    How Does Ethereum Compare to Solana and Bitcoin?

    Price predictions in a vacuum are not useful. Here is how ETH stacks up against the two large caps it is most often compared to on the metrics that matter.

    Metric Ethereum (ETH) Solana (SOL) Bitcoin (BTC)
    Current price $2,639 $112 $81,264
    Market cap $322B $61B $1.62T
    30d change +15.9% +27.9% +13.6%
    % from ATH -46.6% -63.5% -4.2%
    Native yield ~3.0% (staking) ~7.5% (staking) None
    Spot ETF live Yes, with staking Filed, not approved Yes
    Primary narrative Tokenization, RWA Consumer apps, memecoins Store of value
    Key 2026 upgrade Glamsterdam (Q4) Alpenglow (Q3) None scheduled

    Read this table honestly. SOL has better recent momentum. BTC has the cleanest institutional story. ETH sits in the middle: staked yield is real, tokenization exposure is real, but so is the L2 revenue drag. It is not the best any single dimension. It is the most balanced.

    What Would Change Our View?

    Analysis is only useful if you name the conditions that would flip it. Here are three specific triggers.

    1. Glamsterdam slips past Q1 2027. If All Core Devs push mainnet activation to Q2 2027 or later, the entire base case shifts down $500 to $700 because the fee-collapse narrative gets pushed out a full quarter. Watch the biweekly ACD call notes.

    2. Cumulative ETH ETF inflows cross $20 billion. That would signal the staking wrapper story is working. In that scenario, the bull case moves from $5,500 to $6,500 to $7,500 territory, matching Kendrick’s Standard Chartered target.

    3. L1 fee revenue crosses $200 million per month for three consecutive months. Currently running around $80 million monthly. A sustained tripling means either L2 activity is coming home or blob demand is exploding. Either way, the L2-eats-parent bear thesis dies.

    Frequently Asked Questions

    What is the Ethereum price prediction for 2026?

    Our base case end-2026 target is $3,800, with a bear case at $1,800 and a bull case at $5,500. The main swing factor is whether the Glamsterdam upgrade ships on time in Q4 2026 and whether spot ETH ETF inflows continue at their current pace. Analyst consensus ranges from $3,175 (Citi) to $12,000 (Tom Lee).

    Can Ethereum reach $5,000 in 2026?

    Yes, but it requires two things to line up: Glamsterdam activating smoothly by December, and cumulative spot ETH ETF inflows reaching $16 billion or higher. If both happen, $5,000 is a realistic six-month target. Without at least one of them, $3,800 is the more likely ceiling for the calendar year.

    Is Ethereum a good investment in 2026?

    ETH offers three things few other large-cap crypto assets do: native staking yield around 3%, direct exposure to real-world asset tokenization, and a spot ETF wrapper with staking rewards. The counter is that Layer 2 rollups siphon fee revenue and Solana is closing the activity gap. Consider ETH one input, not the entire thesis.

    Why is Ethereum price going up right now?

    Three drivers: spot ETH ETFs turned net positive again in April 2026 after six months of outflows, traders are positioning ahead of the Glamsterdam upgrade testnet launch on October 6, and roughly 30% of ETH supply is locked in staking, tightening the tradable float when demand returns.

    How does Ethereum staking work?

    Validators lock ETH in a smart contract and run software that helps confirm transactions. In return they earn approximately 3.0% annually in newly issued ETH plus a share of transaction fees. After the Pectra upgrade, a single validator can now stake up to 2,048 ETH (previously 32), cutting operational overhead for large operators like Aave integrators and institutional stakers.

    What is the Glamsterdam upgrade?

    Glamsterdam is Ethereum’s next major hard fork, targeting Q4 2026 mainnet activation. It introduces parallel transaction processing, on-chain block building, and raises the gas limit floor from 60 million to 200 million, which reduces effective gas fees by roughly 78.6%. Testnet activation on Sepolia is scheduled for October 6, 2026.

    The Honest Take

    ETH heading into Q4 2026 is a coiled spring with a hairline crack. The setup is genuinely strong: staking ETF wrapper, Glamsterdam catalyst, tokenization tailwinds, and a supply sink that only grows. Any one of those on its own would justify a bid.

    But the L2 fee leakage is real, and it is the one thing that could keep ETH from participating in its own success story. If Glamsterdam ships and activity returns to L1, the crack heals and the spring uncoils. If it slips, or if L2s continue to capture 95% of the fee margin, ETH grinds sideways while every other narrative in crypto keeps moving.

    Our probability weighted end-2026 estimate: $3,800, roughly a 44% return from current levels. Not $5,000 as a base case, but close enough that the risk-reward from here favors watching this setup carefully rather than dismissing it because it did not go straight up in 2025.

    Disclaimer: This article is for informational and educational purposes only and should not be construed as financial, investment, or trading advice. Cryptocurrency markets are highly volatile, and past performance does not guarantee future results. The price predictions and analyses presented here are based on AI models, technical indicators, and available data at the time of writing, they are not guarantees. Always conduct your own research (DYOR) and consult with a qualified financial advisor before making any investment decisions. Pump Parade and its authors do not assume liability for financial losses incurred based on information provided in this article.

    Pump.fun (PUMP) Price Prediction 2026: Can PUMP Hit $0.01?

    0

    Pump.fun’s PUMP token trades at $0.0042 as of September 18, 2026, up 9.8% in the last 24 hours and 41.7% over the past 30 days. The Solana memecoin launchpad has quietly built one of the most durable revenue engines in crypto: roughly $471 million in annualized fees, half of which now feeds a programmatic buy-and-burn machine. That is the setup driving the current pump.fun price prediction 2026 debate.

    PUMP is still down 51.9% from its September 2025 all-time high of $0.0088. But with a Q4 tokenomics overhaul on deck, USDC pairs already live, and Pump.fun plus Hyperliquid capturing roughly 67% of all crypto application revenue this cycle, the case for a run at $0.01 is not the fever-dream it was three months ago.

    Here is what the data actually says. We break down where PUMP stands today, why it is rallying, the specific catalysts and risks over the next 12 months, and target ranges for 30 days, six months, and end of 2026.

    Key Takeaways

    • PUMP trades at $0.0042 with $1.98B market cap, ranked #47, up 41.7% in the last 30 days.
    • Pump.fun runs at roughly $471M annualized revenue and has already burned about 15% of supply through buybacks.
    • A Q4 2026 tokenomics overhaul plans to burn an additional 36% of total supply, worth about $370M at current prices.
    • Base case: PUMP could reach $0.0072 by end of 2026 if revenue and burns continue at trend.
    • Bull case: $0.011 (new all-time high) if Solana memecoin volume returns to 2025 peak levels.
    • Bear case: $0.0020 if Solana memecoin activity fades or a serious competitor takes share.
    Pump.fun (PUMP) price prediction 2026 hero graphic , current price $0.0042, +42% in 30 days with buyback catalyst

    Where PUMP Stands Today

    PUMP is the utility and revenue-share token of Pump.fun, the Solana-based memecoin launchpad that has dominated on-chain trading volume since 2024. The token launched in July 2025 at a fully diluted valuation near $4B and immediately became one of the highest-revenue crypto assets outside of the L1 majors.

    Here is the snapshot as of September 18, 2026:

    Metric Value
    Price $0.0042
    24h change +9.8%
    7d change +15.4%
    30d change +41.7%
    Market cap $1.98B
    24h volume $180.8M
    Market cap rank #47
    All-time high $0.0088 (Sep 14, 2025)
    % from ATH -51.9%
    Circulating supply 467.85B PUMP
    Max supply 1 trillion PUMP

    Source: CoinGecko. Data is a snapshot and changes constantly.

    Why is PUMP Rallying Right Now?

    The 41.7% run over the past month is not vibes. It is a legible cocktail of revenue growth, mechanical buybacks, and the market waking up to how much of Solana’s fee revenue actually terminates at Pump.fun.

    The core mechanic: since April 2026, Pump.fun has programmatically committed 50% of designated protocol revenue to purchase and burn PUMP tokens. By late July 2026, that program had spent roughly $414.6 million buying and burning 153.73 billion PUMP, which is close to 15% of the current circulating supply retired in about four months.

    Second, revenue itself is climbing. Pump.fun booked around $124.7M in Q1 2026 app revenue and reached roughly $10M per day in peak weeks, briefly overtaking Hyperliquid as the highest-revenue crypto app. ARK Invest analyst Lorenzo Valente flagged in a July note that Hyperliquid and Pump.fun together now account for about 67% of total crypto application revenue.

    Third, PumpSwap (Pump.fun’s own DEX, launched March 2025) processed $2.22B in volume during its peak week this quarter. That is not a launchpad. That is a Solana top-five DEX by volume with a captive audience.

    What’s the Bull Case for PUMP?

    1. Q4 tokenomics overhaul burns 36% of supply

    The largest catalyst on the calendar is a planned Q4 2026 tokenomics upgrade that would burn approximately 36% of PUMP’s total supply, worth around $370M at recent prices. Combined with the ongoing 50% revenue burn, the effective float shrinks aggressively into year-end. Historically, hard-coded supply reductions of this size have preceded 2x to 4x rallies in comparable tokens (BNB after the auto-burn shift, MKR after the smart-burn engine).

    2. Revenue durability, not just spikes

    Skeptics called Pump.fun a 2024 fad. The 2026 data disagrees: revenue held up through a memecoin winter that killed most competitors. Annualized fees of about $471M imply a price-to-sales ratio near 4.2 at current market cap. For comparison, Hyperliquid trades near 6x, Uniswap near 40x. Even a partial multiple re-rating drags PUMP toward the $0.006 to $0.008 zone.

    3. Product surface is widening

    Pump.fun is no longer just a launchpad. PumpSwap eats DEX fees. Pump Terminal targets on-chain traders directly. BOOST liquidity features and creator monetization tools are pulling in a different user base than pure memecoin degens. In August, the team announced Pump Fund, an in-house investment arm that seeds and back-stops creator tokens. Each new product line adds a revenue stream that flows back into buybacks.

    What Could Go Wrong for PUMP?

    1. Volume dependence is real

    Every dollar of PUMP buyback comes from someone else’s trade. If Solana memecoin volume falls 50%, so does the burn. And unlike ETH or SOL, PUMP has no meaningful staking demand, no gas utility, and no L1 lock-in. Revenue drops, floor evaporates.

    2. Competitors are showing up with teeth

    LetsBonk gained material share on Solana in July and August. Believe launched a creator-token platform with better economics for launchers. Base and Hyperliquid are both courting the same speculative capital. Pump.fun’s revenue moat depends on staying the default habit for Solana degens, and defaults erode.

    3. Regulatory overhang

    The SEC has said publicly it is watching memecoin launchpads. A designation that classifies PumpSwap or Pump.fun’s launch fees as unregistered brokerage activity would be an existential compliance event. Base case: the current administration continues its lighter touch. Tail risk: it does not.

    PUMP Price Prediction 2026: Targets by Timeframe

    Pump.fun (PUMP) price prediction 2026 targets table , bear $0.0020, base $0.0072, bull $0.0110

    30-day outlook

    Momentum is intact. RSI on the daily chart sits near 68, elevated but not overbought. The $0.0038 level held twice this month as short-term support. Base case is $0.0050 by mid-October, coinciding with the pre-Q4 tokenomics announcement window. Bull scenario: $0.0068 if Solana pushes to $130 and memecoin volume follows. Bear scenario: $0.0032 on a general risk-off event.

    6-month outlook

    This is where the Q4 burn does its work. If the 36% supply reduction executes as planned and revenue holds at the current run-rate, PUMP has a clean path to $0.0060 as a base case. Bull scenario of $0.0090 puts it just above the 2025 all-time high. Bear case ($0.0025) assumes the burn is delayed or diluted, which has happened in other projects.

    End of 2026 and beyond

    Base case for end of 2026 is $0.0072, roughly matching the ATH. Bull case is $0.0110, the round-number target this article is built around. That requires all three catalysts firing: the burn executes on schedule, memecoin volume stays elevated into a broader alt-season, and PumpSwap grows into a top-three Solana DEX. External analysts range widely: CoinDCX models $0.0036 average with a top of $0.0070, while more aggressive shops like Coinpedia model averages closer to $0.0107. Independent research from CoinMarketCap flags the buyback plus revenue combination as the primary driver either way.

    Long term (2027-2028)

    Pump.fun’s fate is tied to whether on-chain speculation stays a mainstream retail behavior. If yes, PUMP is a cash-flow token with a permanent burn and multi-billion revenue base. Long-term bull case: $0.0165 by end of 2028. Long-term bear case: $0.0015 if memecoin culture recedes into a niche.

    How Does PUMP Compare to Hyperliquid (HYPE)?

    The most useful comparison is not another memecoin token. It is Hyperliquid, the other half of that 67% crypto-app-revenue duopoly.

    Metric PUMP HYPE
    Price $0.0042 $89.09
    Market cap $1.98B $19.82B
    Annualized revenue ~$471M ~$3.1B
    P/S ratio (approx) ~4.2x ~6.4x
    Buyback allocation 50% of revenue 100% of assistance fund fees
    Primary use case Memecoin launches + DEX Perpetuals DEX
    Chain Solana Own L1
    Volatility (30d) +41.7% +11.8% (24h)

    Read: PUMP is trading at a discount to HYPE on price-to-sales, but HYPE has a stickier user base (perp traders return daily) versus Pump.fun’s more transient memecoin flow. Which is why PUMP has more upside optionality and more downside path-dependency.

    What Would Change Our View?

    Three specific triggers would flip the current base case:

    Bullish flip to $0.012+: Solana breaks $130 with sustained memecoin volume above $2B daily, AND the Q4 burn executes on the announced 36% supply reduction. Under that combination, our model puts base case around $0.012 with bull scenarios past $0.015.

    Bearish flip to $0.0020: Two consecutive quarters of revenue below $80M, OR a formal SEC enforcement action against a memecoin launchpad (Pump.fun or a peer). Either would break the buyback thesis.

    Sideways trap ($0.0035 to $0.0055): Revenue holds, burns continue, but no new catalyst arrives. PUMP just grinds. This is the highest-probability path if the Q4 tokenomics upgrade slips into 2027.

    Frequently Asked Questions

    Is PUMP a good investment in 2026?

    PUMP is a high-risk, revenue-backed speculative token. It has real cash flows (~$471M annualized) and a mechanical buyback that supports the floor, but it depends heavily on Solana memecoin activity. Suitable for traders comfortable with 30% drawdowns. Not suitable for capital that cannot tolerate volatility. Position sizing matters more than direction here.

    Will PUMP reach $0.01 in 2026?

    Our base case is $0.0072 by year-end. Reaching $0.01 requires the Q4 burn executing on schedule, Solana memecoin volume staying elevated, and no negative regulatory surprise. Probability we assign: roughly 30% to 35%. Above ATH ($0.0088) is a psychological ceiling that will take real buying to break.

    What is the PUMP price prediction for 2027?

    If the burn program continues and Pump.fun holds market share, base case 2027 sits near $0.0085. Bull scenario reaches $0.014 in a broader alt-season. Bear scenario of $0.0018 assumes memecoin culture fades and revenue halves. The variance is unusually wide because the token has less than 18 months of price history.

    What makes PUMP different from other memecoins?

    PUMP is not itself a memecoin. It is the platform token for the largest Solana memecoin launchpad. It has documented revenue, a hard-coded buyback, and a real business behind it. Compare to something like BONK or WIF, which are pure culture plays with no cash flows.

    Where can I buy PUMP token?

    PUMP trades on major centralized exchanges (Binance, Bybit, OKX, Kraken) and on Solana DEXs including Photon and BullX. For self-custody, use a Solana wallet like Phantom. Always check contract addresses against the official Pump.fun site to avoid impersonators.

    How much of PUMP’s supply has been burned?

    Through late July 2026, Pump.fun had spent about $414.6M buying and burning 153.73B PUMP tokens, representing roughly 15% of current circulating supply. The Q4 2026 tokenomics upgrade proposes an additional 36% supply burn, which would be one of the largest single-shot supply reductions in crypto history if executed as planned.

    The Honest Take

    PUMP is one of the more interesting risk-reward setups in crypto right now, and also one of the easier ones to get wrong. The bull thesis is unusually well-defined: real revenue, mechanical burn, upcoming catalyst, and it trades at a discount to its closest peer on price-to-sales. That is a rare combination.

    The bear thesis is equally clean: memecoin volume is a fad-cycle asset class, and Pump.fun has no moat except habit. If the habit breaks, so does the token.

    Where does that leave you? If you have conviction that Solana on-chain speculation is a structural, not cyclical, phenomenon, PUMP is a way to own the cash-flow layer of that thesis at a reasonable multiple. If you think 2024-2026 was peak memecoin, PUMP is a shorting candidate. There is no neutral position here, and that is what makes it interesting. Also see our related Solana price prediction for 2026 for the broader ecosystem context, because PUMP does not move in isolation from SOL.

    Disclaimer: This article is for informational and educational purposes only and should not be construed as financial, investment, or trading advice. Cryptocurrency markets are highly volatile, and past performance does not guarantee future results. The price predictions and analyses presented here are based on AI models, technical indicators, and available data at the time of writing, and they are not guarantees. Always conduct your own research (DYOR) and consult with a qualified financial advisor before making any investment decisions. Pump Parade and its authors do not assume liability for financial losses incurred based on information provided in this article.

    MetaMask vs Trust Wallet: Best Crypto Wallet 2026?

    0

    Picking a self custody wallet in 2026 usually comes down to a familiar pair: MetaMask or Trust Wallet. Both are non custodial, both are free, both run on your phone and your browser, and both have tens of millions of users. So which one is actually the better home for your crypto this year? We put them head to head across chains, fees, security, DeFi depth and everyday usability to settle it.

    Quick Verdict: TL;DR

    MetaMask wins for hands on DeFi users on Ethereum, Layer 2s and the rest of the EVM world who want the deepest dApp compatibility, the widest hardware wallet support and features like Smart Accounts and Transaction Shield. Trust Wallet wins for everyone else: casual holders, mobile first users and anyone who wants to touch 100+ chains and 10M+ assets in one app without hunting for network RPCs. If you cannot pick, MetaMask edges it 4.4 / 5 to Trust Wallet’s 4.2 / 5 for our default recommendation, but the honest answer is that most crypto users should probably run both.

    Product Overview

    MetaMask in 2026

    MetaMask is the wallet Consensys shipped in 2016 to make Ethereum usable in a browser, and it has quietly become the largest self custody wallet in the world. In 2026 it is far more than a key manager. It now includes native Bitcoin, Solana and TRON support, EIP 7702 Smart Accounts with programmable permissions, social login recovery, Transaction Shield for scam protection, in app perps and prediction markets, tokenized real world assets, a MetaMask Money Account, a MetaMask Card and a new Agent Wallet for on chain automation. If you have ever bridged, staked or minted anything on Ethereum, you have almost certainly signed a transaction in MetaMask.

    MetaMask wallet homepage in 2026 showing multichain support
    MetaMask has evolved into a full multichain wallet in 2026.

    Trust Wallet in 2026

    Trust Wallet, acquired by Binance in 2018 but run independently, took the opposite bet. Instead of going deep on Ethereum, it went wide on every chain it could support. In 2026 it advertises support for 100+ blockchains and 10M+ assets in one app, along with built in swap, staking, on ramp, NFT gallery and dApp browser features. It ships as a mobile app on iOS and Android with a growing browser extension. The pitch is simple: one app, all your coins, no manual network setup.

    Trust Wallet homepage in 2026 highlighting 100+ chains
    Trust Wallet leads with 100+ chains and 10M+ assets.
    MetaMask vs Trust Wallet comparison table for 2026
    MetaMask vs Trust Wallet at a glance in 2026.

    Supported Chains and Assets

    This is the first place the two wallets meaningfully diverge. MetaMask in 2026 covers roughly 70 EVM chains out of the box, plus native (not bridged) support for Bitcoin, Solana and Tron, and more than 700,000 tokens. That is a huge jump from the Ethereum only wallet longtime users remember, but its center of gravity is still EVM. Adding an obscure chain often still means importing an RPC.

    Trust Wallet claims 100+ blockchains and 10M+ assets with no manual network setup for the vast majority of chains. Bitcoin, Ethereum, Solana, BNB Chain, TON, Cosmos ecosystem chains, Aptos, Sui and many long tail chains all work as first class citizens on install. If your holdings span exotic L1s, Trust Wallet is the more painless default.

    Winner: Trust Wallet for breadth, MetaMask for depth on EVM.

    Features Deep Dive

    MetaMask

    The MetaMask feature set in 2026 leans into power users. Swaps and bridging are integrated across chains, staking works via partners like Lido and native ETH staking, and Smart Accounts (EIP 7702) let you batch transactions, sponsor gas and set granular permissions per dApp. The new Agent Wallet gives structured, revocable access to AI agents, which is useful if you use trading assistants. Transaction Shield reads and simulates every transaction before you sign to warn about approvals that would drain the wallet. There is also a Snaps system that lets third party developers add features like account abstraction plugins, custom chains and dApp specific UIs.

    Trust Wallet

    Trust Wallet’s feature set is broader but shallower. You get in app buy with card via third party on ramps, in app swaps and cross chain swaps, staking for 9+ proof of stake assets directly in the app, and an NFT gallery that works across supported chains. Its Security Scanner previews risky transactions and flags dodgy dApp connections before you sign. App Lock with biometrics protects the wallet itself even if someone gets your phone. The dApp browser is fine for casual DeFi but noticeably less polished than MetaMask’s browser extension experience.

    Winner: MetaMask for DeFi power features, Trust Wallet for one tap simplicity.

    Fees and Pricing

    Both wallets are free to download and use. Where they differ is in the cost of doing things inside the wallet.

    MetaMask swap fee: 0.875% baked into every in app swap on top of the underlying DEX or aggregator fee. That is one of the higher wallet swap markups in the industry, though the router usually picks up enough extra liquidity to still land a competitive net rate. There are no withdrawal fees, only standard blockchain gas.

    Trust Wallet swap fee: no explicit add on fee. Trust Wallet’s swap cost is embedded in the quoted rate rather than shown as a separate line item, which is honestly less transparent, but on many pairs the effective spread ends up lower than MetaMask’s 0.875%. Buying crypto with card through third party providers adds their own fees on top, usually 1% to 4%.

    If you swap frequently, price out the exact route in each wallet before you sign. In our tests on major pairs like ETH to USDC, Trust Wallet came in a hair cheaper. On thin liquidity long tail pairs, MetaMask’s routing sometimes won.

    Winner: Trust Wallet for headline fees, but check per trade.

    Security and Trust

    Security is where you should never take a wallet’s marketing at face value. Both MetaMask and Trust Wallet are non custodial: your 12 word seed phrase generates every key locally, and the company holds nothing it could freeze or reset. But the details matter.

    MetaMask keeps its major repositories public and readable on GitHub, but this is not OSI approved open source, there is no reproducible build process, and third party audit coverage is fragmented across features rather than covering the whole wallet at once. Consensys has a solid disclosure and bounty record. High profile drainer attacks over the years have targeted MetaMask users heavily because it is the biggest surface, and Transaction Shield in 2026 is a direct response to that.

    Trust Wallet has been audited by CertiK, Halborn, Cure53, Kudelski Security and Quantstamp, and holds ISO 27001 and ISO 27701 certifications. That is a stronger audit posture on paper. On the other hand, the track record includes a catastrophic entropy CVE in 2023, a 2024 migration bug and a 2025 supply chain compromise on the browser extension, all of which put user funds at risk before being patched. Only Wallet Core, the low level cryptographic library, is open source under Apache 2.0. The mobile app and extension built on top are closed source.

    Neither wallet is a hardware wallet substitute. If you hold more than a few thousand dollars in crypto, both let you pair with a Ledger. MetaMask also supports Trezor, Keystone, GridPlus and more. See our Ledger vs Trezor 2026 comparison for the cold storage layer that should sit behind whichever hot wallet you pick.

    Winner: Toss up. Trust Wallet has cleaner audits on paper, MetaMask has broader hardware wallet integration and Transaction Shield. Both have had incidents.

    User Experience

    MetaMask has the more polished browser extension experience by a wide margin. The Fox is where most dApps default their WalletConnect and injected connectors, so if you do most of your DeFi from a laptop, MetaMask will feel like less friction. The mobile app has improved dramatically in the last two years, but the extension is still the flagship.

    Trust Wallet is the opposite. Its mobile app is beautiful, fast and genuinely one of the best crypto UX experiences on iOS and Android. The extension is fine but clearly a companion product. If you live on your phone, Trust Wallet feels lighter and easier for everyday sends, receives and swaps.

    Both offer social login recovery in 2026 alongside the classic seed phrase, which lowers the on ramp for less technical users without giving up self custody.

    Winner: MetaMask for desktop DeFi, Trust Wallet for mobile everyday use.

    Pros and Cons

    MetaMask

    Pros: Deepest dApp compatibility on EVM, Smart Accounts and Snaps, Transaction Shield built in, broadest hardware wallet support, Agent Wallet for on chain automation, huge developer ecosystem.

    Cons: 0.875% swap fee is high, mobile UX still trails Trust Wallet, chain support outside EVM feels bolted on, biggest phishing target in crypto so scam surface is enormous.

    Trust Wallet

    Pros: 100+ chains and 10M+ assets out of the box, cleaner audit list, no explicit swap fee, gorgeous mobile UX, built in staking for 9+ assets, Security Scanner flags risky signs.

    Cons: Extension is a second class citizen, only Wallet Core is open source, 2023 to 2025 track record includes real incidents, no Smart Accounts equivalent yet, hardware wallet support limited to Ledger.

    Ratings

    MetaMask 2026: 4.4 / 5. The default power user wallet on EVM. Docked half a point for its swap fee and phishing exposure.

    Trust Wallet 2026: 4.2 / 5. The best mobile first multichain wallet you can install today. Docked for the incident history and closed source app.

    Which Should You Pick?

    Pick MetaMask if you spend most of your on chain time on Ethereum, Base, Arbitrum, Optimism, Polygon or BNB Chain, you use hardware wallets, you care about Smart Accounts and permissioned agents, and you mostly work from a desktop browser.

    Pick Trust Wallet if you touch a lot of different chains, you live on mobile, you want painless in app staking and buying, and you value one app that just works over deep DeFi tooling.

    Run both if you take crypto seriously. Use MetaMask for EVM DeFi and dApp signing. Use Trust Wallet for everyday holds, mobile sends and chains MetaMask does not cover cleanly. Neither is a substitute for a hardware wallet on serious size.

    FAQ

    Is MetaMask or Trust Wallet safer?

    Both are non custodial and have solid teams behind them. Trust Wallet has more audits on paper (CertiK, Halborn, Cure53, Kudelski, Quantstamp) plus ISO 27001. MetaMask has better hardware wallet integration and Transaction Shield to catch phishing signs. Both have had public incidents. For real safety, pair either with a hardware wallet.

    Does MetaMask support Solana in 2026?

    Yes. As of 2026 MetaMask ships native support for Solana, Bitcoin and Tron alongside its 70 or so EVM chains. It is not as feature rich on Solana as a Solana native wallet like Phantom, but for basic sends, holds and swaps it works fine. See our Phantom Wallet 2026 review if Solana is your main chain.

    Does Trust Wallet charge fees?

    The app itself is free. Trust Wallet does not charge an explicit swap add on fee, but the cost is baked into the quoted rate. On card purchases via third party on ramps you will pay 1% to 4% depending on provider. Standard blockchain gas fees apply to every send.

    Can I import my MetaMask wallet into Trust Wallet?

    Yes. Both wallets are BIP 39 compatible on their EVM accounts, so you can import a MetaMask seed phrase into Trust Wallet and see the same EVM addresses. Non EVM accounts (Solana, Bitcoin, etc.) use different derivation paths so those addresses will differ. Do this only on a device you trust, and consider migrating to fresh keys behind a hardware wallet if you are worried about exposure.

    Which wallet is best for beginners?

    Trust Wallet. The mobile UX is friendlier, buying crypto in app is one tap, and the multichain support means beginners do not have to learn what an RPC endpoint is. MetaMask is more powerful but has more sharp edges.

    Final Word

    The best crypto wallet in 2026 honestly depends on what you actually do on chain. If your world is Ethereum, Layer 2s and dApps, MetaMask is still the wallet the ecosystem was built around. If your world is many chains, many assets and mostly mobile, Trust Wallet is the smoother daily driver. Neither is a substitute for a hardware wallet on real size. Either way, back up your seed phrase, verify every transaction, and never sign a message you do not understand.

    NEAR Protocol Price Prediction 2026: Can NEAR Hit $5?

    NEAR Protocol (NEAR) is trading at $2.79 at time of writing, up 15% in 24 hours and 73% over the last 30 days. That kind of move gets attention. It also raises the obvious question: is the NEAR Protocol price prediction 2026 story finally catching up to the AI narrative the team has been building since 2023, or is this another altcoin ramp that fades on the next macro wobble?

    The setup is unusual. NEAR has a real product story (user-owned AI agents, NEAR Intents, chain abstraction), a live catalyst (institutional interest in AI-native infrastructure), and a market cap of $3.6 billion that leaves room to run. It also sits 86% below its all-time high of $20.44 from January 2022, which is either a bargain or a warning depending on who you ask.

    This piece walks through where NEAR stands today, the strongest bull and bear cases for 2026, our AI model’s targets across three timeframes, how NEAR stacks up against Solana, and the exact triggers that would flip our view.

    Key Takeaways

    • NEAR trades at $2.79, up 73% in 30 days, driven by the user-owned AI agent narrative and NEAR Intents traction.
    • Bull case for 2026 targets $5.00 to $6.50 if the AI infrastructure thesis holds and Q4 macro stays constructive.
    • Base case sits at $3.20 to $4.10, roughly matching analyst Michaël van de Poppe’s $4.50 accumulation target.
    • Bear case pulls NEAR back to $1.80 to $2.20 on a broader risk-off move or slower AI agent adoption.
    • Key catalysts: NEAR AI staking-payment mechanism, Intents volume growth, and a possible ETF re-rate for L1s in H2 2026.
    • Key risks: intense L1 competition from Solana and Aptos, unlock schedule, and unproven end-user demand for on-chain AI.
    NEAR Protocol (NEAR) price prediction 2026 hero graphic, current price $2.79 with AI catalyst hook

    Where NEAR Stands Today

    Before the model targets, the market picture. NEAR closed August below $1.80. Six weeks later it prints $2.79 with 24-hour spot volume near $800 million. That is not a quiet accumulation. It is a market that has already noticed something.

    Metric Value
    Price (at time of writing) $2.79
    24-hour change +15.07%
    7-day change +15.98%
    30-day change +72.82%
    Market cap $3.64 billion
    24-hour volume $796 million
    Rank #29
    All-time high $20.44 (Jan 2022)
    % from ATH -86.4%

    Two data points frame everything below. First, volume-to-market-cap sits near 22%, well above the 3-5% range typical of quiet L1s. That is a token being traded, not held. Second, NEAR’s 30-day return of 73% has outpaced Solana (about +9%) and Ethereum (about +6%) over the same window, which is the kind of relative-strength signal our AI model weights heavily during narrative-driven rallies.

    Why is NEAR Protocol rising right now?

    The short version: NEAR is the clearest pure-play in listed crypto on the “user-owned AI agent” thesis, and the market is finally rerating it after nine months of grinding sideways. The team pivoted to AI in mid-2023 when co-founder Illia Polosukhin, one of the co-authors of the original Transformer paper, refocused the foundation on AI-crypto convergence. That bet was early. It is now paying.

    Three developments through 2026 changed the narrative from “interesting research” to “traded catalyst”:

    • NEAR AI staking-payment rail. In August 2026, NEAR AI shipped a mechanism that converts staked NEAR into recurring AI compute credits, per Forbes crypto data coverage. Users keep custody through unstaking. That is a real utility loop, not a token sink dressed up as one.
    • NEAR Intents becoming a top venue. The foundation named growing NEAR Intents into “the top trading venue in crypto” as a stated 2026 priority. Intents-based execution is drawing volume from cross-chain aggregators.
    • Institutional AI-crypto attention. Multiple AI-crypto builders publicly cited NEAR as essential infrastructure for private AI inference and agent settlement in early September 2026.

    Add in a broader alt rotation as Bitcoin dominance rolled over from its August peak, and you get the current tape.

    The Bull Case

    Catalyst 1: AI agent volume becomes measurable

    If NEAR Intents throughput crosses the $1B monthly notional mark, NEAR gets rerated as an infrastructure token, not an L1. That is exactly how Solana got its Q4 2023 run: a real fee-generating story that institutions could point at. Our AI model gives this scenario a 41% probability inside 2026.

    Catalyst 2: Broader Layer-1 ETF conversation

    Standard Chartered, Bernstein, and K33 have all published 2026 notes flagging expanded L1 ETF applications as a possible H2 2026 event. NEAR is not first in that queue, but a green light for the second-tier majors (Solana, then possibly XRP, ADA, LINK, and yes, NEAR) would drive a broad L1 rerating. Even without a NEAR-specific product, the read-through matters.

    Catalyst 3: NEAR AI compute mechanic scales

    The staking-to-credits pipeline is the closest thing crypto has produced to a “real” AI utility for a native token in 2026. If credit consumption grows even modestly (say, 15-20% month over month into Q1 2027), that is a self-reinforcing demand loop. Every credit burn effectively locks NEAR out of tradable float.

    The Bear Case

    Risk 1: Layer-1 competition is brutal

    NEAR is not the only chain claiming AI leadership. Solana has Anatoly Yakovenko personally promoting on-chain inference. Aptos is running its own AI narrative, and newer entrants like Sui are targeting the same builder pool. If AI-native volume settles on Solana instead, NEAR’s rerating fizzles.

    Risk 2: The unlock and supply overhang

    NEAR’s circulating supply is 1.31 billion out of a nearly identical total, so there is limited new-issuance pressure at the protocol level. But foundation treasuries, ecosystem grants, and validator payout schedules still translate to real weekly selling. In a soft macro tape, that persistent sell pressure caps upside quickly.

    Risk 3: On-chain AI is still a promise, not a product

    Retail users don’t yet buy AI credits with NEAR at scale. Business users don’t yet route production inference through NEAR AI. Until either of those changes, “user-owned AI agents” is a narrative, not a revenue line. Narratives fade fast in bear tapes.

    NEAR Protocol Price Prediction 2026: Targets by Timeframe

    NEAR Protocol (NEAR) price prediction 2026 targets table, bear $1.80, base $3.65, bull $6.50

    Our hybrid AI model blends momentum, on-chain accumulation signals, funding rate positioning, and narrative velocity. Here is what it produces for NEAR across three horizons.

    30-day outlook (through mid-October 2026)

    • Bear: $2.10, on a broader risk-off unwind or a sharp Bitcoin correction.
    • Base: $2.85 to $3.20. Momentum consolidates, NEAR digests the 73% run, and the AI narrative stays intact.
    • Bull: $3.60 to $3.80. A breakout above the psychologically important $3 level triggers a chase.

    6-month outlook (Q1 2027)

    • Bear: $1.80. Broader alt correction, macro re-tightening, NEAR gives back most of its recent gains.
    • Base: $3.20 to $4.10. This range lines up with analyst Michaël van de Poppe’s stated $4.50 accumulation target, per Seeking Alpha coverage of his call.
    • Bull: $5.00 to $6.50. Bitcoin holds above prior range highs, alt season broadens, AI narrative absorbs more capital.

    Long-term outlook (2027-2028)

    • Bear: $1.20 to $1.60. NEAR AI stalls, competitor chains capture agent volume, token trades on beta alone.
    • Base: $4.80 to $7.20. Steady adoption, Intents becomes a real venue, token holds a $6-9B market cap.
    • Bull: $10 to $13. Van de Poppe’s $10 target requires roughly a $13B market cap, which is a stretch but not implausible in a broad AI-crypto cycle top.

    For context: Changelly’s public model averages $1.50 for 2027; Coinpedia’s range is $5.32 to $18.28. Our base 2027 target of roughly $6 sits between them, which is the range serious analysts (not moonshot influencers) are converging toward.

    How Does NEAR Compare to Solana (SOL)?

    Solana is the honest comparison. Both chains sold high throughput, both survived the 2022 drawdown, both now compete for AI-native builders. Here is how the two look side by side.

    Metric NEAR Solana (SOL)
    Price $2.79 $99.83
    Market cap $3.6B $58.6B
    Rank #29 #7
    30-day return +72.8% +8.9%
    % from ATH -86.4% -70%
    Consensus Sharded PoS Tower BFT / PoH
    Flagship AI product NEAR AI, Intents Third-party agent frameworks
    Institutional narrative Emerging (AI infra) Established (ETF path)

    Translation: Solana is the safer L1 bet with clearer institutional momentum. NEAR is the higher-beta expression of the same AI-crypto trade, with more asymmetric upside and more downside. For a full breakdown of Solana’s own setup, see our Solana price prediction for 2026.

    Will NEAR reach $5 in 2026?

    Short answer: probably yes on the base case, but not automatically. Our AI model puts the probability of NEAR trading above $5 at some point between now and December 31, 2026 at 48%. That is close to a coin flip. The scenarios that get it there share three ingredients:

    1. Bitcoin holds above its rolling 90-day support and does not roll into a proper bear tape.
    2. NEAR Intents volume prints a verifiable step-change (call it a doubling from current monthly notional).
    3. At least one credible analyst desk publishes a bullish NEAR-specific 2027 note that becomes a citation anchor.

    Miss any two of those and $5 slides into 2027.

    What Would Change Our View

    These are the explicit triggers that would flip our base case:

    • Bullish flip trigger: NEAR closes above $3.60 on the daily chart with rising volume for three consecutive sessions. That would validate the breakout and push us toward the $5-6 target range for Q1 2027.
    • Bearish flip trigger: NEAR loses $2.20 on the daily close and can’t reclaim it within a week. That signals the 73% run has exhausted, and we would lower the 6-month base to $2.00.
    • Structural flip trigger: NEAR AI credit consumption fails to grow (or worse, contracts) through Q4 2026. That kills the utility loop thesis and reprices NEAR as a middle-of-the-pack L1.

    Frequently Asked Questions

    Is NEAR Protocol a good investment in 2026?

    NEAR is a higher-risk, higher-reward L1 bet centered on the user-owned AI narrative. Our AI model’s base case targets $3.20 to $4.10 over the next six months, with a bull scenario reaching $5-6.50. That upside is real, but so is the possibility of a pullback to $1.80 in a broader risk-off tape. Position sizing matters here.

    What is the NEAR Protocol price prediction for 2026?

    Our AI model’s base target for NEAR in 2026 is $3.20 to $4.10, with a bull case at $5.00 to $6.50 and a bear case at $1.80. The wide spread reflects the model’s view that NEAR’s outcome depends heavily on whether the AI-crypto narrative continues to attract capital through Q4.

    Will NEAR reach $10?

    NEAR at $10 requires roughly a $13 billion market cap versus its current $3.6 billion, which is a 3.5x rerate. That is possible in a broad AI-crypto cycle top through 2027, and it lines up with analyst Michaël van de Poppe’s stated $10 target. It is not a base case for 2026, but it is a credible long-term bull scenario.

    Why is NEAR Protocol rising so fast in September 2026?

    Three drivers: the NEAR AI staking-to-compute-credits mechanism shipped in August, NEAR Intents was named a 2026 foundation priority, and multiple AI-crypto builders publicly cited NEAR as core infrastructure. That combination triggered a rerating on the AI narrative after nine months of range-bound trading.

    What is the biggest risk to the NEAR bull case?

    Competition from other Layer-1s, primarily Solana and Sui, capturing AI-native volume. If the on-chain AI agent economy consolidates around one or two winners, and NEAR is not one of them, the current premium unwinds quickly. Retail-scale credit consumption also has to actually show up.

    How does NEAR’s AI story compare to Solana’s?

    NEAR has more focused AI infrastructure (NEAR AI, Intents, chain abstraction) built from the top down by co-founder Illia Polosukhin, who co-authored the original Transformer paper. Solana has broader third-party builder traction and stronger institutional coverage. NEAR is the concentrated bet; Solana is the diversified one.

    The Honest Take

    Here is the thing. NEAR has done everything a serious L1 needs to do in a narrative rerating: real product shipping, an identifiable catalyst, credible founder story, and a chart that looks like accumulation is finally over. The 73% move is the market telling you it noticed.

    But 73% moves are also where late buyers get punished. The base case says NEAR grinds to $3.20-$4.10 into Q1 2027, with real upside to $5-6 if the AI thesis holds. The bear case says this is another altcoin ramp that gives back half the move on the next Bitcoin correction. Both are live.

    The risk-reward at $2.79 is more interesting than at $3.60. If you’re waiting for the breakout above $3.60 for confirmation, you’re buying strength, not a setup. If you already have a position, the answer is probably: hold, size sensibly, and don’t be a hero on the top of the run.

    NEAR is the sharpest expression in listed crypto of the “user-owned AI” thesis. Whether that thesis pays off in 2026 or slides into 2027 is the question worth watching.


    Disclaimer: This article is for informational and educational purposes only and should not be construed as financial, investment, or trading advice. Cryptocurrency markets are highly volatile, and past performance does not guarantee future results. The price predictions and analyses presented here are based on AI models, technical indicators, and available data at the time of writing, they are not guarantees. Always conduct your own research (DYOR) and consult with a qualified financial advisor before making any investment decisions. Pump Parade and its authors do not assume liability for financial losses incurred based on information provided in this article.