More
    Home Blog Page 5

    Hyperliquid (HYPE) Price Prediction 2026: Can HYPE Hit $150?

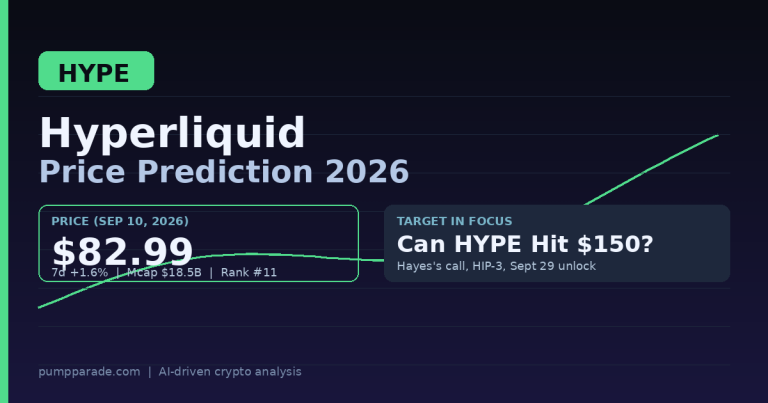
    Every Hyperliquid (HYPE) price prediction 2026 conversation now starts with the same number. HYPE trades at $82.99 at time of writing, sitting just 7.3% below its September 6 all-time high of $89.44. The token is up 1.6% on the week, market cap has crossed $18.5 billion, and HYPE now ranks #11 by market capitalization. That is a lot of ground covered for a token that only unlocked to the public in November 2024.

    The bigger number is trading volume: Hyperliquid’s perpetual futures venue processed more than $180 billion in monthly volume by mid-2026 and now clears roughly 70% of on-chain perp volume across all chains. Around 97% of protocol fees are routed into an on-chain buyback program called the Assistance Fund, which has already accumulated over 44 million HYPE, worth approximately $2.2 billion at current prices.

    The Hyperliquid (HYPE) price prediction 2026 debate now centers on one number: can HYPE hit Arthur Hayes’s $150 target before year-end? This piece breaks down the bull case, the bear case, competitor benchmarks, and the September 29 token unlock that could stall the rally.

    Key Takeaways

    • HYPE trades at $82.99, up 1.6% on the week, with a $18.5B market cap and #11 ranking.
    • Around 97% of protocol fees fund open-market HYPE buybacks, roughly $527K per day at current rates.
    • HIP-3 lets anyone launch a perpetual market by staking 500,000 HYPE for 30 days, expanding the addressable venue count.
    • A 14.18 million HYPE unlock (1.4% of supply) is scheduled for September 29, 2026, worth roughly $1.17 billion at spot.
    • Bull case targets $130 to $150 by year-end. Bear case argues $50 to $60 if unlock supply overwhelms buybacks.
    • Only about 22% of the max supply is circulating, so ongoing dilution is the single largest structural risk.
    Hyperliquid (HYPE) price prediction 2026 hero graphic. Current price $82.99, Hayes $150 target with HIP-3 catalyst.

    Where Hyperliquid Stands Today

    Hyperliquid is a purpose-built Layer 1 blockchain that runs its own order-book perpetual futures exchange. Unlike GMX or Jupiter Perps, which use pool-based counterparty models, Hyperliquid matches buyers and sellers on-chain the way a centralized exchange would. The result: tight spreads, deep liquidity, and a fee structure that keeps 97% of every dollar it earns for the token’s Assistance Fund. Here is the snapshot.

    Metric Value
    Price (Sep 10, 2026) $82.99
    24h change -3.45%
    7d change +1.63%
    Market cap $18.46B
    24h volume $340M
    Market cap rank #11
    All-time high $89.44 (Sep 6, 2026)
    % from ATH -7.32%

    Read that table twice. HYPE just printed a new all-time high four days ago and is barely off the peak. That is different from a token trying to recover a lost ATH. It is a token in price discovery.

    Why is HYPE trading near record highs right now?

    Three things are stacking on top of each other.

    First, order flow keeps arriving. Coinbase’s Base App started routing certain perpetual orders to Hyperliquid in mid-August, per Yahoo Finance. That was a structural handoff, not a marketing beat. When the largest US exchange sends users to your venue, market share tends to compound.

    Second, the CFTC has signaled it will bring Hyperliquid onshore under a compliant framework. Regulatory blessing was the single largest overhang on the token. Removing it invites institutional flow that previously stayed sidelined.

    Third, the buyback is real and mechanical. About 15,350 HYPE were burned in the 24 hours ending September 8, worth roughly $1.32 million. On an annualized basis, Hyperliquid is on pace to buy back more HYPE than the September 29 unlock will release, which is the entire debate in one sentence.

    Can HYPE Really Hit $150? The Bull Case

    1. HIP-3 turns Hyperliquid into a platform

    HIP-3 launched earlier this year and allows any entity to deploy a new perpetual market by staking 500,000 HYPE for at least 30 days. Builders share fees; the protocol gets more listable markets without doing the work. First-party perpetuals still route about 97% of fees to buybacks, and the addressable universe of markets just went from “what Hyperliquid picks” to “anything anyone wants to trade.” Real-world perpetuals on oil, gold, and the S&P 500 are already live.

    2. The Assistance Fund is a structural bid

    Pluang’s AQA v2 model forecasts $193 million in protocol revenue for 2026, with roughly $527,000 in daily HYPE buybacks. Over a full year, that removes more supply from the market than the two largest 2026 unlocks combined. The Assistance Fund has already accumulated about $2.2 billion worth of HYPE. Every basis point of market share Hyperliquid takes from a CEX flows into that fund.

    3. Perp DEX market share is still expanding

    Hyperliquid controls roughly 70% of on-chain perpetual futures volume as of mid-2026, up from a much smaller slice in 2024. dYdX, GMX, and Vertex combined have fallen from 65% to 27% of the market over the same window. If HYPE captures even 5% of centralized perpetual volume (still mostly on Binance, Bybit, and OKX), revenue and buybacks scale linearly.

    What Would Send HYPE Below $60? The Bear Case

    1. The September 29 unlock is the largest near-term risk

    On September 29, 2026, 14,175,778 HYPE tokens (1.4% of total supply) unlock, worth approximately $1.17 billion at spot. Most of that supply goes to core contributors and early investors. Even if only a fraction hits the open market, it takes several months of buybacks to absorb. Only about 22% of max supply is circulating today, so the token faces years of scheduled dilution.

    2. A CEX response could compress margins

    Binance, Bybit, and OKX still clear roughly 10x Hyperliquid’s daily perpetual volume. If a major CEX slashes taker fees or launches a competing on-chain venue, the fee capture that funds HYPE buybacks compresses. The current buyback math assumes fee levels hold.

    3. Regulatory reversal is not impossible

    The CFTC’s stance can shift with a change in administration or a single enforcement action. Hyperliquid remains a permissionless perpetual futures venue, and permissionless perps remain a gray zone in most jurisdictions. Any US restriction on domestic users would clip a meaningful slice of order flow.

    HYPE Price Prediction 2026: Targets by Timeframe

    Hyperliquid (HYPE) price prediction 2026 targets table. Bear $60, base $100, bull $150.

    Our AI model outputs the following ranges. Confidence intervals are wider than usual because supply dynamics dominate the short-term picture.

    Timeframe Bear Base Bull
    30 days $68 $85 $100
    6 months $60 $95 $130
    Year-end 2027 $50 $115 $180

    Short-term (30 days)

    The September 29 unlock dominates the setup. Base case: a 10% to 20% pullback into the event, followed by a relief rally as absorbed supply meets buyback demand. Bear case sees a break below $70 support. Bull case requires the unlock to be pre-sold OTC and never hit the book.

    Medium-term (6 months)

    If Q4 2026 revenue prints anywhere near Pluang’s $193M forecast, buybacks structurally outpace remaining unlocks by early 2027. That is the setup for a run at $130. Bear case: a broader crypto correction (a BTC drop to $60K, for instance) drags HYPE back to $60 despite strong fundamentals.

    Long-term (year-end 2027)

    Arthur Hayes’s $150 target from March 2026 is now the mainstream bull case rather than the outlier. Bulls argue HIP-3 real-world assets plus institutional flow push HYPE to $180 by end of 2027. Bears point to sustained dilution and possible CEX counter-attack pulling it back to $50.

    For comparison, Coinbase’s model targets $81.47 in 2026, CoinDCX pegs it near $80, and market-implied odds put a 65.5% probability on HYPE closing 2026 above $100. Different models, converging on the same shape: consolidation near the highs, then breakout or breakdown driven by the buyback-vs-unlock arithmetic.

    How does Hyperliquid compare to GMX, dYdX, and Jupiter Perps?

    Perp DEXs sound similar on paper, but the models are very different. This is where the buyback math on HYPE stands out.

    Metric Hyperliquid dYdX GMX Jupiter Perps
    Market model Central limit order book Order book Pool-based Pool-based (5-token)
    On-chain perp share ~70% Single digits Low single digits Mid single digits
    Daily volume $6.5B+ $300-500M $100-300M $500M-1B
    Fee to token ~97% (buyback) Staking rewards ~30% to GMX 50% to JLP LPs
    Token market cap $18.5B $300M $150M $1.7B
    Permissionless listings Yes (HIP-3) No No No

    The head-to-head that matters most is Hyperliquid vs Jupiter Perps, because both run on high-throughput blockchains and both compete for the same trader. Jupiter uses a JLP pool, which caps the assets you can trade against but pays LPs a real yield. Hyperliquid’s order book scales better for tight spreads but keeps almost all fees for token holders. For a deeper look at Solana’s perp options, see our Jupiter Exchange review and the broader L1 competitive landscape piece.

    What Would Change Our View

    Three explicit triggers would move our base case.

    Upgrade to bull ($130+): HIP-3 real-world asset markets clear $10B in monthly volume by end of Q1 2027 and the September 29 unlock is absorbed without a 15% drawdown.

    Downgrade to bear ($60 or lower): A CFTC enforcement reversal, or a Binance-launched competitor that captures 20% of Hyperliquid’s flow within 90 days.

    Invalidate the whole thesis: If daily buybacks fall below $250,000 for four consecutive weeks (implying fee revenue is collapsing), the structural bid disappears and the token trades on pure unlock supply pressure. That is the scenario nobody is priced for.

    Frequently Asked Questions

    Will HYPE reach $150 by end of 2026?

    Arthur Hayes’s $150 target is achievable but not the base case. It requires the September 29 unlock to absorb cleanly, Q4 revenue to print above $50 million, and no broader crypto correction. Market-implied odds put roughly a 25% to 30% probability on $150 by year-end, versus 65.5% for $100.

    Is Hyperliquid a good investment in 2026?

    The fundamentals are among the strongest in crypto: real revenue, real market share, and a mechanical buyback tied to fee capture. The risk is dilution, since only about 22% of max supply is circulating. Position sizing should reflect that unlock overhang, not just the growth story.

    What is the HYPE token unlock schedule?

    The next major unlock is September 29, 2026, releasing 14,175,778 HYPE (1.4% of total supply, roughly $1.17 billion). Subsequent unlocks continue on a multi-year vesting schedule for core contributors and early backers. Full schedule details are on Tokenomist.

    How does the Hyperliquid buyback work?

    Roughly 97% of protocol fees flow into an on-chain Assistance Fund that buys HYPE on the open market. At current fee levels, that translates to about $527,000 per day in market bids. Buybacks are automatic and transparent, and the fund has already accumulated over 44 million HYPE.

    Is HYPE better than SOL or ETH for exposure to DeFi perpetuals?

    HYPE is a purer bet on perpetual futures market share, while SOL and ETH represent broader L1 exposure. If you want direct fee-capture on the fastest-growing perp DEX, HYPE is the cleaner vehicle. If you want diversified DeFi exposure, an SOL or ETH position with a smaller HYPE allocation is more balanced. For context on how the ETH thesis is currently priced, see our Ethereum price prediction for 2026.

    What could push HYPE below $60?

    A combination of the September 29 unlock hitting the open market, a broader BTC correction below $60,000, and any negative regulatory headline. Fundamentally, HYPE at $60 would still be pricing in significant growth, so the floor is a function of sentiment and forced selling, not valuation.

    The Honest Take

    Hyperliquid is one of the few crypto tokens where the fundamentals actually justify a large-cap valuation. The buyback is real. Market share is real. HIP-3 is a genuinely novel expansion mechanic. That is why HYPE trades at $83 and not $8.

    The unresolved question is dilution. Around 78% of the max supply is still locked, and every quarter brings another release. Whether the Assistance Fund can outrun that schedule is the trade. If it can, $150 by end of 2026 and $180 by end of 2027 are reasonable. If it cannot, HYPE gives back a meaningful chunk of 2026 gains and settles in the $60 to $80 range until buyback velocity catches up.

    Our base case: HYPE consolidates between $75 and $95 through the September 29 unlock, then makes a run at $100 in Q4 as absorbed supply clears. Whether it holds $100 into 2027 depends on whether Q4 revenue prints above expectations. Watch the daily buyback figure. That is the one number that tells you if the thesis is intact.

    Disclaimer: This article is for informational and educational purposes only and should not be construed as financial, investment, or trading advice. Cryptocurrency markets are highly volatile, and past performance does not guarantee future results. The price predictions and analyses presented here are based on AI models, technical indicators, and available data at the time of writing, they are not guarantees. Always conduct your own research (DYOR) and consult with a qualified financial advisor before making any investment decisions. Pump Parade and its authors do not assume liability for financial losses incurred based on information provided in this article.
    Polkadot (DOT) Price Prediction 2026: Can DOT Hit $3?

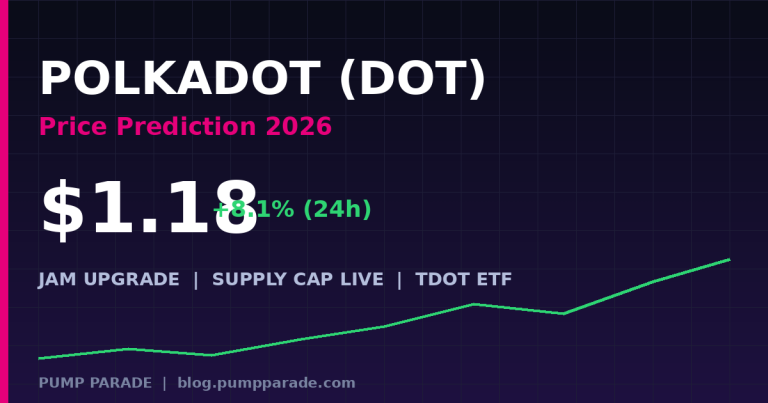
    This Polkadot price prediction 2026 analysis opens with a hard number: DOT trades at $1.18 at time of writing, up 8% in 24 hours, 38% over the past week, and roughly 46% in the last 30 days. The chain sits at rank 46 by market cap after one of the most brutal drawdowns in top-50 crypto, down almost 98% from its November 2021 all-time high of $54.98.

    The interesting part is why DOT is bouncing now. Polkadot went through a foundational tokenomics overhaul in March 2026, capping supply at 2.1 billion DOT and cutting new emissions by 53.6%. A US spot Polkadot ETF (21Shares TDOT) is now trading on Nasdaq. And the JAM (Join-Accumulate Machine) upgrade, the biggest architectural rework the network has attempted, is targeted for mainnet within the next few quarters.

    This Polkadot price prediction 2026 walks through where DOT sits today, why it is moving, the strongest bull and bear cases, and specific price targets for 30 days, six months, and the 2027-2028 horizon. We show every number, cite every source, and lay out what would change our view. No hopium.

    Key Takeaways

    • Current price: DOT is trading at $1.18, up 46% in 30 days but still down 97.9% from its all-time high.
    • Base case for 2026 year-end: $1.25 to $1.80 if the JAM testnet timeline holds and TDOT ETF flows compound.
    • Bull case for 2027-2028: $3 to $8 if JAM ships on mainnet, DeFi TVL doubles, and BTC sustains a broad risk-on environment.
    • Bear case: Sub $0.80 if JAM slips again, ETF flows stall, and rivals keep pulling developer mindshare.
    • Biggest catalyst: JAM mainnet launch and continued TDOT ETF inflows.
    • Biggest risk: Persistent capital rotation to Ethereum L2s and Solana, plus low DeFi TVL on Polkadot itself.
    Polkadot (DOT) price prediction 2026 hero graphic, current price $1.18, JAM upgrade and TDOT ETF catalysts

    Where Polkadot Stands Today

    Before we forecast anything, let’s look at the numbers. All data is pulled from CoinGecko at time of writing.

    Metric Value
    Price $1.18
    24h change +8.1%
    7d change +38.3%
    30d change +46.0%
    1y change -71.6%
    Market cap $2.00B
    24h volume $431M
    Market cap rank #46
    All-time high $54.98 (Nov 4, 2021)
    % from ATH -97.9%
    Circulating supply 1.70B DOT

    Two numbers deserve a second look. First, the market cap of $2 billion puts a Layer 0 protocol built by an Ethereum co-founder below the market cap of several memecoins. Second, DOT’s 14-day RSI is sitting at 75, which in plain terms means the token is technically overbought after this rally. Both signals point to the same interpretation: the tape has been broken for so long that any real catalyst produces an outsized reaction.

    Why Is Polkadot Rallying Right Now?

    Three things are converging. The March 2026 tokenomics reform capped total supply at 2.1 billion DOT and cut annual emissions by more than half. In the previous model, roughly 120 million DOT were minted every year with no ceiling. That structural sell pressure is now gone. Staking yields will compress over time, but the token itself is meaningfully scarcer than it was six months ago.

    Second, the 21Shares TDOT ETF began trading on Nasdaq earlier this year, becoming the first US spot Polkadot ETF. First-day inflows were modest at around $545,000, but the vehicle requires physical DOT purchases for every dollar of net inflow. That creates a structural bid that did not exist previously. It is not the iShares Bitcoin Trust, but it is a regulated on-ramp for allocators who were previously locked out.

    Third, the JAM protocol (Join-Accumulate Machine) has been re-anchored to a firmer roadmap. Forty-three independent teams are competing for a 10 million DOT prize pool tied to Gray Paper conformance. Traders who lived through the 2021 parachain auction rally understand that Polkadot narratives can compound quickly once a delivery date starts looking real.

    What Is the Bull Case for DOT in 2026?

    JAM Mainnet as a Category Reset

    JAM is not an incremental upgrade. Gavin Wood has framed it as a decentralized global supercomputer, and the design targets throughput and application classes (AI inference, gaming state, high-frequency settlement) that the current relay chain plus parachain model cannot support. If mainnet lands in 2026 or the first half of 2027 and even one flagship application ships on it, the market has to re-rate DOT from “another L1 that missed the cycle” to “the network doing something meaningfully different from what Ethereum L2s or Solana are doing.” That is the bull thesis in a sentence.

    Structural Scarcity Meets Structural Demand

    The supply cap and the TDOT ETF pull in the same direction. Fewer DOT are being minted. New buyers are showing up through a regulated wrapper. If US-listed ETF inflows compound the way we have seen with Bitcoin and Ethereum funds, even a fraction of that flow into a $2B market cap asset produces a strong asymmetric setup. Standard Chartered has published constructive base cases on how spot ETF flows can re-rate mid-cap L1s once the education and diligence work is done at institutional desks.

    Named Analyst Targets

    Tim Draper has publicly called for DOT reaching $10.71 by end of 2026. Coinpedia’s fundamental model puts a bull case at $8 for 2026 year-end and $25 to $60 by 2030 if interoperability narratives take hold. DigitalCoinPrice’s statistical model projects a 2026 range of $9.01 to $10.71. These are not our targets. They are useful reference points that show how wide the reasonable band is when the market prices in either JAM shipping or JAM slipping.

    What Could Push DOT Back Under $1?

    The DeFi TVL Problem Has Not Gone Away

    Polkadot’s total value locked across its DeFi ecosystem has hovered below $300 million for most of the last year. That is a rounding error next to Ethereum’s TVL and roughly one twentieth of Solana’s. Great infrastructure that nobody builds real financial applications on is worth less than mediocre infrastructure that everyone uses. Until the TVL curve inflects, the bull thesis is a bet on future demand rather than observed demand.

    Competition Is Not Standing Still

    Ethereum rollups have improved dramatically. Solana ships. Cosmos IBC provides interoperability without the shared security tradeoffs that Polkadot imposes on parachains. Every quarter Polkadot spends not attracting deployments is a quarter its rivals compound their liquidity and tooling. Governance token holders can vote to fix things, but they cannot vote developer mindshare into existence.

    Governance Can Reverse the Reform

    The 2.1 billion supply cap was enacted through OpenGov. That is Polkadot’s strength (rare direct on-chain economic governance) and its weakness. A future referendum could raise the cap, adjust inflation, or redirect treasury spending in ways institutional allocators dislike. Any signal that governance is trending toward looser monetary policy would remove one of the strongest recent bull points.

    Polkadot Price Prediction 2026: Targets by Timeframe

    Polkadot (DOT) price prediction 2026 targets table, bear $0.60, base $3.50, bull $8.00 by 2027 to 2028

    30-Day Outlook

    DOT’s 14-day RSI is stretched above 75, which historically has preceded short pullbacks of 15% to 25% within two weeks. Our short-term base case is a consolidation between $1.00 and $1.30, with bear risk to $0.85 if BTC rolls over, and a bull scenario to $1.65 if the ETF sees a genuine flow acceleration or JAM ships another visible testnet milestone.

    6-Month Outlook

    By early 2027, the market will have priced in either progress or drift. If JAM’s Gray Paper conformance testing produces a public leaderboard and TDOT ETF assets under management cross the $50 million mark, we see a path to $1.80 as a base case and $3.00 as the bull scenario. Bear case is $0.75 if the JAM timeline slips into late 2027 and macro tightens.

    Long-Term Outlook: 2027 to 2028

    This is where the fork widens. If Polkadot successfully repositions as the JAM-era supercomputer, matches Cosmos on active app count, and captures a share of the AI x crypto flows we already see benefiting Bittensor, Render, and Chainlink, a $3 to $8 range is defensible. If Polkadot remains a “great infrastructure, no apps” story, the CoinCodex-style projection of $1 to $1.40 through 2027 is closer to the mark. Bear tail risk is $0.60, roughly the 2029 lows some algorithmic models are already extrapolating.

    Polkadot vs Cosmos: Which One Wins the Interop Race?

    Both networks pitch themselves as interoperability layers, but the underlying design philosophies are different. Cosmos uses IBC and sovereign chains. Polkadot enforces shared security through parachains and the relay chain. This is where the comparison actually matters for a trader.

    Metric Polkadot (DOT) Cosmos (ATOM)
    Price $1.18 ~$4.30
    Market cap $2.0B ~$1.7B
    Security model Shared (relay chain) Sovereign chains
    Interop XCM IBC
    DeFi TVL Under $300M Under $1B (IBC-connected)
    US spot ETF Yes (TDOT) No
    Supply model Capped at 2.1B Uncapped inflation
    Flagship upgrade JAM (Polkadot 3.0) Interchain Security

    DOT wins on ETF access and supply discipline. ATOM wins on live application deployment. Neither has broken out from mid-cap into large-cap territory this cycle. The trade for a Polkadot bull is that JAM plus the ETF closes the app gap fast enough for the supply story to matter.

    What Would Change Our View

    Rather than pretend we have perfect foresight, here are the three explicit triggers that would move us up or down.

    1. JAM mainnet slip past H2 2027. If the timeline gets pushed a third time, the market will treat it as vaporware and the ETF thesis alone will not carry DOT. Cut bull case by half.

    2. TDOT ETF net inflows above $100M cumulative. That level would confirm allocator interest is real and not tourist money. Move base case toward $2.50 and revisit bull target.

    3. DeFi TVL crossing $500M sustained for 90 days. This is the single hardest metric to fake. A move here would validate the “infrastructure quality finally attracts applications” thesis. Everything upgrades.

    Frequently Asked Questions

    Is Polkadot a good investment in 2026?

    Polkadot is a higher-risk, higher-optionality bet than most top-50 tokens. The supply cap and ETF are genuine tailwinds, but the network still has to prove application demand exists. Investors comfortable with a two-year timeline and downside to $0.60 have a defensible entry near current levels. Those needing certainty should wait for JAM mainnet.

    Will DOT reach $5 by end of 2027?

    $5 requires roughly a 4.2x move from current price. That is achievable if JAM mainnet ships on time, TDOT ETF inflows compound, and BTC holds a broad bull regime. Coinpedia’s bull case supports $8 by then. Our base case is closer to $3, with $5 as an upper-band bull scenario. Not a promise, a probability.

    What is the JAM upgrade in Polkadot?

    JAM stands for Join-Accumulate Machine. It is Polkadot’s next-generation architecture, designed by Gavin Wood as a decentralized global supercomputer capable of running AI inference, gaming state, and high-throughput settlement. Forty-three teams are competing for a 10 million DOT prize pool tied to protocol conformance. Mainnet is targeted for 2026 to 2027.

    Is Polkadot dead?

    Not by the on-chain data. Polkadot ranked first in developer commits in 2026 and just executed a major supply overhaul through on-chain governance. What Polkadot has failed at is capturing DeFi TVL and application deployments at the rate its infrastructure quality would suggest. The network is not dead. The narrative had died. That is a different problem, and it appears to be turning.

    How does the TDOT ETF affect DOT price?

    The 21Shares TDOT ETF must purchase physical DOT for every dollar of net inflow. That creates a structural bid separate from crypto-native demand. Initial flows were small, around $545,000 first day, but the mechanism is what matters. If flows compound the way Bitcoin ETF flows did in year one, DOT gets meaningful new demand at a tighter supply.

    What is Polkadot’s max supply?

    Polkadot’s max supply is capped at 2.1 billion DOT as of the March 2026 tokenomics reform. Circulating supply is currently around 1.70 billion. That leaves roughly 400 million DOT still to be minted through staking rewards, at emission rates roughly 53% lower than under the previous unlimited model.

    The Honest Take

    Polkadot is the most under-discussed re-rate candidate in the top 50. The reasons it stayed cheap (missed cycle, weak app layer, uncapped inflation) are all either fixed or on a credible fix path. The reasons it could stay cheap (nobody actually builds there, JAM slips, ETF flows disappoint) are also real and cannot be waved away.

    Our base case is that DOT reclaims $2 to $3 over the next 12 to 18 months, with a plausible bull scenario to $5 to $8 if JAM ships and application deployment inflects. Our bear case sends DOT back under a dollar if any of the three catalyst legs breaks. The risk-reward at $1.18 skews favorable, which is a statement about the setup, not a call to buy. Position size accordingly, respect the technical overbought signal near-term, and watch DeFi TVL closely. That single metric will tell you whether this cycle is different long before the price does.

    Disclaimer: This article is for informational and educational purposes only and should not be construed as financial, investment, or trading advice. Cryptocurrency markets are highly volatile, and past performance does not guarantee future results. The price predictions and analyses presented here are based on AI models, technical indicators, and available data at the time of writing, they are not guarantees. Always conduct your own research (DYOR) and consult with a qualified financial advisor before making any investment decisions. Pump Parade and its authors do not assume liability for financial losses incurred based on information provided in this article.

    Data sources: CoinGecko, Changelly analyst compilation.

    Phantom Wallet Review 2026: Fees, Features & Verdict

    0

    Updated September 2026. Phantom has changed dramatically since our first review, adding Bitcoin support, in-wallet perpetual futures, tokenized equities, HyperEVM, and Robinhood Chain. This is our full 2026 refresh.

    Introduction

    Ask any Solana user which wallet they open first every morning, and the answer is almost always the same. Phantom is the default. It started life in 2021 as a scrappy browser extension aimed at Solana power users, and five years later it is one of the most widely used self custodial wallets on the planet, sitting alongside MetaMask in raw distribution and ahead of it in features that actually matter to active traders.

    But “the best Solana wallet” is a much lower bar than it used to be. In 2026 Phantom is not really a Solana wallet at all. It is a multichain super app that happens to have grown out of Solana. So the honest question is not whether Phantom is still king of the trenches. It is whether the app you install today is worth the swap fees, whether the new perps and Cash products are useful or bloat, and whether the security tradeoffs still make sense compared with a hardware wallet.

    We put Phantom through a full 2026 review. Here is what we found.

    Phantom Wallet purple logo
    Phantom is a self custodial multichain wallet used by roughly 17 million people every month. Source: Phantom.

    TL;DR: Our Verdict

    Rating: 4.6 / 5

    Phantom is still the best wallet for anyone who lives on Solana and wants a single app that also handles Ethereum, Base, Polygon, Sui, Monad, Bitcoin, HyperEVM, and Robinhood Chain. The 0.85 percent in-app swap fee on select pairs is the main cost you pay for the convenience, and the new Perps product is a genuine reason to keep the app open even if you already use a CEX. It is not a replacement for a hardware wallet on serious size, and geo restrictions mean US and UK users cannot touch Perps. For everyone else, it is a very easy recommendation.

    What Is Phantom in 2026?

    Phantom is a self custodial, non custodial multichain wallet available as a browser extension (Chrome, Brave, Edge, Firefox) and native mobile apps (iOS, Android). The company, Phantom Technologies, is headquartered in the US and closed its Series C at a reported 3 billion dollar valuation, backed by Sequoia and Paradigm.

    The topline number that matters: Phantom served roughly 17 million monthly active users at its 2025 peak and continues to hover in the mid to high teens through 2026. That puts it in the same league as MetaMask by MAU, and comfortably ahead of every other Solana native wallet including Backpack and Solflare.

    Since our last review, the notable additions are:

    • Native Bitcoin support (SegWit and Taproot) with in-app send, receive, and swap
    • HyperEVM support, letting you interact with the Hyperliquid EVM chain from the wallet
    • Robinhood Chain support, added in 2026, bringing the total supported network count to nine
    • Phantom Perps, an in-app perpetual futures product powered by Hyperliquid’s onchain orderbook
    • Phantom Cash, a spend account with a linked card in eligible regions
    • Tokenized equities and Solana P&L tracking

    Supported Chains

    As of September 2026, Phantom supports the following networks natively:

    • Solana
    • Ethereum
    • Base
    • Polygon
    • Sui
    • Monad
    • Bitcoin (native SegWit and Taproot)
    • HyperEVM
    • Robinhood Chain

    That is nine chains inside one seed phrase, one interface, and one swap flow. Compared with the six or seven that most single-app multichain wallets support in 2026, Phantom is at the top of the pack. It is worth noting that Solana remains the most polished experience by a wide margin. Ethereum and Base feel like first class citizens. The others are functional but still receive fewer UX iterations.

    Features Deep Dive

    Swaps

    Phantom’s built-in swap widget routes across DEX aggregators on each chain (Jupiter on Solana, 1inch and 0x on EVM chains, native routes on Bitcoin via partner integrations). Quotes are usually competitive with what you would get on Jupiter directly, and the UX is a big step ahead of copying a token address into a DEX site.

    Phantom Wallet mobile home screen showing portfolio and swap flow
    Phantom’s mobile home screen. One of the most polished consumer crypto UIs in 2026. Source: Phantom press kit.

    Phantom Perps

    The headline 2026 addition. Perps launched in July 2025 with an EU rollout and has since expanded to most non-US, non-UK regions. Under the hood it is Hyperliquid’s onchain orderbook. Phantom is the largest earner in Hyperliquid’s builder program, generating over 20.6 million dollars in cumulative fees from around 39 billion in perp volume and more than 137,000 traders. That volume tells you the product works. The catch is that every fill pays Phantom a builder premium over what you would pay on Hyperliquid’s native app, so power traders will still route through Hyperliquid directly.

    Staking

    Native Solana staking is one tap. Phantom picks a validator by default but lets you switch. Liquid staking through Marinade and Jito is offered as an in-app option, so you can hold jitoSOL or mSOL without leaving the wallet.

    NFTs and Collectibles

    Phantom pioneered the burn scam token feature, and NFT display remains one of its strongest UX moats. Spam filtering is aggressive, and hidden collections do not clutter your main view.

    Phantom Cash

    A spend account tied to a linked card that lets eligible users pay merchants with USDC balances. Available in a growing list of regions, still not in the US.

    Tokenized Equities

    Phantom added the ability to hold and trade tokenized versions of listed equities in select regions. It is early days for the product but a signal of where the wallet is heading.

    Multisig, Passkeys, and Recovery

    Phantom moved to passkey-based recovery flows in 2025 and rolled out biometric authentication across mobile. You still control your seed phrase, but the day to day auth surface is much closer to a modern consumer app than a traditional crypto wallet.

    Fees & Pricing

    The wallet itself is free. Phantom monetizes primarily through swap and bridge fees, and through builder revenue on Perps.

    • In-app swap fee: 0.85 percent platform fee on select pairs, taken from the output token. Not every pair is charged, and the quote screen shows the breakdown before you confirm.
    • Network fees: Standard chain gas or priority fees. On Solana these are typically fractions of a cent. On Ethereum they vary with gas conditions.
    • Bridge fees: Applied on cross chain swaps in addition to the platform fee and any partner bridge cost.
    • Perps fees: Hyperliquid maker or taker fee plus a Phantom builder premium on each fill.
    • Fiat onramp fees: Set by the fiat provider (Moonpay, Coinbase Pay and similar), typically 1.5 to 4 percent.
    • Phantom Cash and card: Region dependent, disclosed at signup.

    The 0.85 percent swap fee is the single biggest number to internalize. If you are moving 10,000 dollars through an in-app swap on a fee-eligible pair, you are paying 85 dollars in platform fee before network costs. Active traders often prefer to route into Jupiter or Uniswap directly to skip that number, then pull the resulting position back into Phantom for storage.

    Security & Trust

    Phantom is a software wallet, which means your keys live in local storage protected by your device password, passkey, or biometric. That is a fundamentally different security model from a hardware wallet like Ledger or Trezor, which keeps keys in a dedicated secure element.

    What Phantom does well:

    • Independent security audits of core wallet code
    • Transaction preview that decodes what a signature actually does, including token allowance changes
    • Aggressive blocklists for known scam contracts and spoofed tokens
    • Burn spam token function that lets you clean malicious airdrops in one click
    • Passkey and biometric authentication rolled out across mobile
    • Hardware wallet integration (Ledger) supported on Solana and Ethereum for cold storage inside the same UI

    What to keep in mind:

    • Keys live on your device. A compromised device is a compromised wallet.
    • Approving a malicious dApp is still the number one way people lose funds, and Phantom cannot stop you if you sign a bad transaction.
    • For balances above a few thousand dollars, the recommended path is Ledger inside Phantom rather than hot wallet alone.

    User Experience

    Phantom’s UI is why it wins. The mobile app in particular is one of the best consumer crypto experiences on the market. Home screen shows a clean portfolio view. Explore tab surfaces trending tokens with live charts. Swap is two taps. Send is two taps. Nothing feels like it was designed by an engineer who has never talked to a user.

    The extension is similarly well designed. It handles dApp connections quickly, and the transaction preview panel is clear enough that even first-time users can spot obvious phishing attempts.

    Minor complaints from our testing:

    • The Explore feed can feel promotional, surfacing tokens that are more hype than substance
    • Perps UX is functional but not as data dense as Hyperliquid’s native app
    • Occasional slow refresh on multi chain balances after switching networks
    Phantom Wallet browser extension Explore tab showing trending Solana tokens
    The extension’s Explore tab surfaces trending tokens with live data. Source: Phantom press kit.

    Pros & Cons

    Pros:

    • Nine chain multichain support inside one seed phrase
    • Best in class mobile and extension UX
    • Native perpetual futures via Hyperliquid, no CEX required
    • Strong scam filtering and clear transaction previews
    • Passkey and biometric authentication
    • Ledger integration for cold storage
    • Solana staking with validator choice and liquid staking options
    • Phantom Cash for real world spending in eligible regions

    Cons:

    • 0.85 percent platform fee on eligible in-app swaps is not trivial for large trades
    • Perps unavailable in the US and UK
    • Software wallet security model, not hardware level by default
    • Variable and sometimes opaque total swap costs when bridges are involved
    • Some new features (tokenized equities, Cash) are gated by region and identity checks

    Who Is Phantom Best For?

    Best for: Solana native traders and multichain users who want one app for wallet, swap, stake, NFT and now perps. If you spend your day looking at Birdeye and DexScreener and clicking into pump.fun graduates, Phantom is the fastest path from “I see it” to “I own it.”

    Not best for: Users who need US-based perpetual futures access, users holding six or seven figures without a hardware wallet, and users who mostly touch Bitcoin. On BTC-only, a dedicated Bitcoin wallet with better fee control still edges out Phantom’s built-in flow.

    FAQ

    Is Phantom Wallet safe in 2026?
    Phantom is a self custodial software wallet with regular security audits, passkey and biometric auth, transaction previews, and Ledger integration. It is as safe as any leading hot wallet in 2026. For balances above a few thousand dollars, pair it with a Ledger for cold storage.

    What is the Phantom swap fee?
    Phantom charges a 0.85 percent platform fee on select in-app swap pairs, taken from the output token. The quote screen shows the breakdown before you confirm. Not every pair is subject to the fee.

    Does Phantom support Bitcoin?
    Yes. Phantom added native Bitcoin support in 2024 (SegWit and Taproot) and continues to expand BTC features. You can send, receive, and swap BTC inside the wallet.

    Can I trade perpetual futures on Phantom?
    Yes, via Phantom Perps, which is powered by Hyperliquid’s onchain orderbook. Perps are geo restricted and not available in the US or UK. Every fill pays a Phantom builder premium on top of the standard Hyperliquid fee.

    Which chains does Phantom support?
    As of September 2026, Phantom supports Solana, Ethereum, Base, Polygon, Sui, Monad, Bitcoin, HyperEVM, and Robinhood Chain. That is nine chains inside a single seed phrase.

    Final Verdict

    Phantom in 2026 is a much bigger product than the Solana wallet most people first installed. It is a multichain super app with perps, a spend account, tokenized equities, and one of the best mobile UIs in crypto. The tradeoffs are real. The 0.85 percent swap fee adds up on size, and the software wallet security model is not right for whale balances. But for the vast majority of active crypto users, Phantom is the single wallet that does the most jobs well.

    If you already use it, the 2026 update makes it stickier than ever. If you have been holding out with a different Solana wallet, this is the version worth switching to.

    Rating: 4.6 / 5

    Visit Phantom Wallet

    Ondo (ONDO) Price Prediction 2026: Can ONDO Reclaim $1?

    Ondo Finance (ONDO) trades at $0.381 at time of writing, down 1.7% on the day and roughly 82% below its January 2024 all-time high of $2.14. The market has cooled, but the underlying business has not. Ondo now oversees about $3 billion in tokenized real-world assets, a run rate that would have looked absurd 18 months ago.

    That divergence is the whole story behind this Ondo (ONDO) price prediction 2026. The token is trading like a punished DeFi speculation, while the protocol is quietly becoming the largest tokenized U.S. Treasury issuer outside a bank. The bull case is that price catches up. The bear case is that unlock supply keeps a lid on it until 2028.

    Below, we walk through where ONDO stands today, what is driving it in either direction, and where our AI model expects price to sit across three timeframes. We also compare Ondo to its closest infrastructure peer, Chainlink, and answer the questions traders are actually typing into Google.

    Key Takeaways

    • Current price: $0.381, market cap $1.86B, down 82% from ATH.
    • Fundamentals: $3B+ in RWA under management, OUSG backed by BlackRock BUIDL, USDY expanding cross-chain.
    • Bull case: RWA sector grew to $36B on-chain in 2026. If Ondo holds share, base target is $0.55, bull is $0.90 by mid-2027.
    • Bear case: Nearly 6 billion ONDO still to unlock through 2029. Each January cliff has produced double-digit drawdowns.
    • Verdict: Highest-quality RWA equity exposure in crypto, priced like a stalled DeFi token. A range trade with an option on macro tailwinds.
    Ondo (ONDO) price prediction 2026 hero graphic, current price $0.38, BlackRock BUIDL and RWA tokenization catalyst

    Where Ondo Stands Today

    Ondo has spent most of 2026 chopping between $0.30 and $0.55, a 45% band that has trapped both breakout traders and mean-reversion sellers. The token is off its cycle high but still holds a top-40 ranking by market cap, mainly because the sector it dominates keeps growing while its own float has stayed relatively contained.

    Metric Value
    Price $0.381
    24h Change -1.70%
    Market Cap $1.86B
    24h Volume $126M
    All-Time High $2.14
    % From ATH -82.2%
    RWA TVL Managed ~$3.0B

    Source data: CoinGecko and on-chain trackers. Volume has been declining slowly since the summer, which usually precedes either a range expansion or a fresh capitulation leg. We think the odds favor the former by Q1 2027 for reasons we lay out below.

    Why Is Ondo Range-Bound Right Now?

    Three forces are pulling the tape sideways. First, the January 2026 unlock released a large slug of insider and ecosystem tokens, and price has spent the year absorbing that supply. Second, the RWA narrative keeps compounding attention, so bids appear on every meaningful dip. Third, macro rates are still elevated, which is a tailwind for tokenized Treasury yields, ONDO's core product line, but a headwind for high-beta altcoins that need liquidity to re-rate.

    In plain terms: the business is scaling faster than the token is being repriced. That gap does not close instantly. It usually closes when a catalyst forces the market to acknowledge the delta, and Ondo has several plausible ones queued up.

    The Bull Case

    1. Ondo owns the tokenized Treasury lane

    Ondo Global Markets lists 430+ tokenized U.S. stocks and ETFs across Ethereum, Solana, and BNB Chain with 24/7 mint and redeem. OUSG carries roughly $625M AUM and sits directly on top of BlackRock BUIDL. USDY has become reference collateral for a growing list of prime brokers. If tokenized Treasuries scale from $2B in 2024 to a plausible $50B by 2028, Ondo does not need to win the whole market. Even 15% share on a 2x fee-adjusted multiple gets you materially higher than today's market cap.

    2. RWA is the least controversial 2026 narrative

    Every major bank, from BlackRock to Franklin Templeton to JP Morgan, now has a public tokenization roadmap. RWA on-chain crossed $36B in 2026, up from $5B in 2022. Regulators view tokenized Treasuries as one of the few crypto categories with a clear existing legal wrapper. Ondo also runs its own Layer 1 chain, Ondo Chain, which gives it a native settlement layer that can capture fee revenue directly rather than paying rent to Ethereum forever.

    3. Buybacks and treasury flywheel are quietly building

    Ondo has been accumulating treasury reserves, and community proposals for a formal fee-to-buyback mechanism have gathered momentum after Hyperliquid's Assistance Fund proved the model can work. Even a modest 20% earnings-to-buyback conversion on tokenized Treasury fee revenue would move the float meaningfully. Nothing is confirmed here, and readers should treat this as an optionality lever rather than a base case.

    The Bear Case

    1. The unlock schedule is brutal

    Roughly 6 billion ONDO is still scheduled to unlock between 2026 and 2029, per the token's five-year linear vesting plan that began in January 2024. Both the 2025 and 2026 January cliffs produced double-digit drawdowns in the surrounding weeks. Even absent forced selling, the anticipation of supply is enough to keep buyers cautious ahead of each unlock date. This is the single largest structural headwind for price and the reason our long-term base case is not more aggressive.

    2. Business is real, but token accrual is soft

    Ondo generates meaningful revenue from OUSG and USDY, but most of that revenue accrues to the operating entity, not the ONDO token holder. Compared to designs where fees flow directly into token buybacks or staking rewards, ONDO's current value capture is weaker. If tokenized Treasuries commoditize (and they will), fee compression combined with weak token accrual is a real risk.

    3. Competition from banks, not from other tokens

    The scariest competitor for Ondo is not Maple or Centrifuge. It is BlackRock issuing directly to institutional clients without needing a token layer. Ondo mitigates this by being the composable, permissionless gateway into products like BUIDL, but if a Coinbase or Robinhood offers the same wrapper natively, Ondo's distribution moat narrows fast. See our Chainlink price prediction for a similar "infrastructure margin" question.

    Ondo Price Prediction 2026: Targets by Timeframe

    Ondo (ONDO) price prediction 2026 targets table, bear $0.24, base $0.55, bull $0.90 across 30-day, 6-month and 2027-28 horizons

    Our hybrid AI model blends unlock supply, RWA sector growth curves, correlation to ETH and SOL, and sentiment signal. The output below is scenario-weighted, not a single point forecast.

    Timeframe Bear Base Bull
    30 Days $0.28 $0.42 $0.55
    6 Months $0.24 $0.55 $0.90
    2027 to 2028 $0.30 $1.10 $2.20

    30-Day Outlook

    Short-term ONDO is a range trade. The $0.34 to $0.48 band has held for eight weeks. A break above $0.48 on rising volume opens $0.55 quickly. A loss of $0.34 opens the 2025 lows near $0.28. We think the probability favors chop rather than trend for the next 30 days, with an upward bias if Solana and ETH stay above their key moving averages.

    6-Month Outlook

    Our base case for the next two quarters is $0.55, with a bull scenario at $0.90 if a formal buyback proposal passes, or if a large asset manager announces direct integration with Ondo Global Markets. The bear scenario is a retest of $0.24 driven by macro risk-off and the shadow of the January 2027 unlock.

    Long-Term (2027 to 2028)

    By 2028 the token is fully unlocked, which removes the biggest structural overhang. Our long-term base case of $1.10 assumes Ondo captures a mid-teens share of a $50B tokenized Treasury market. The bull case of $2.20 requires token value accrual to improve (buybacks or staking yield) and RWA total to exceed $80B on-chain. That is not our default view, but it is not fringe either. For comparison, Coinbase's ONDO price prediction also frames a wide bull-bear cone, and analysts like Changelly's model put mid-2027 targets in a similar range.

    How Does Ondo Compare to Chainlink?

    Both projects sell picks and shovels rather than end-user products. Both benefit from RWA. But they capture value very differently.

    Metric Ondo (ONDO) Chainlink (LINK)
    Category Tokenized RWA issuer Oracle and cross-chain
    Market Cap $1.86B $8.4B
    Primary Revenue Treasury fund fees, spread Oracle fees, CCIP
    Fee-to-Token Accrual Weak (indirect) Improving via Payment Abstraction
    RWA Exposure Direct issuer Infrastructure to every issuer
    Unlock Overhang Through 2029 ~60% of supply Fully unlocked
    Institutional Distribution Strong (BlackRock, Solana Foundation) Very strong (SWIFT, ANZ)
    Biggest Risk Bank disintermediation Competing oracles, LayerZero

    Simple read: Chainlink is the safer, lower-beta RWA bet. Ondo is the higher-torque, higher-risk one. If you believe in the sector and want asymmetric upside, ONDO's smaller cap and unlock-overhang discount is the trade. For a related DeFi mechanism-design case study, our Uniswap fee switch analysis is a useful primer on why token accrual matters.

    What Would Change Our View on ONDO?

    Three explicit triggers would move us off base case:

    1. Formal fee-to-buyback proposal passes on-chain. This would rewrite the token accrual story overnight and push base case toward $0.80 within six months.
    2. Tokenized Treasuries cross $75B on-chain by Q3 2027. A sector doubling this fast pulls the whole cohort higher and makes our long-term bull ($2.20) look conservative.
    3. A Big Four bank issues natively via Ondo Global Markets. This turns distribution risk into distribution moat and validates the platform thesis, not just the treasury thesis.

    Conversely, a January 2027 unlock without a buyback backstop, combined with a broad risk-off macro tape, would push us to the bear case and open $0.24.

    Frequently Asked Questions

    What is Ondo Finance?

    Ondo Finance is a tokenization platform that issues on-chain versions of U.S. Treasuries, money market funds, and equities. Its flagship products are OUSG, an institutional tokenized Treasury fund built on BlackRock's BUIDL, USDY, a yield-bearing dollar token, and Ondo Global Markets, a 430+ symbol tokenized stock and ETF platform.

    Will ONDO reach $1 in 2026?

    Reaching $1 by the end of 2026 requires roughly a 2.6x move from current levels. Our base case does not see it, but our bull case does. The path most likely to get there is a combination of RWA sector growth, a formal token buyback mechanism, and continued institutional integrations. Reclaiming $1 in 2027 is more probable than doing it in 2026.

    Is Ondo a good investment for 2026?

    Ondo offers real revenue, a defensible niche, and top-tier partnerships. Those are rare in crypto. The counterweight is a heavy unlock schedule and weaker direct token accrual. It fits a portfolio slot for investors who want RWA exposure with more upside than Chainlink and are willing to hold through 2027 unlock volatility.

    What makes Ondo different from BlackRock BUIDL?

    BUIDL is the underlying institutional fund. Ondo's OUSG wraps BUIDL and makes it composable, permissionless, and available across chains with 24/7 mint and redeem. Think of BUIDL as the wholesale product and OUSG as the retail-plus-DeFi distribution layer. They are complementary, not competitors, though banks could try to replicate Ondo's wrapper directly.

    When are the next ONDO token unlocks?

    ONDO follows a five-year linear vesting schedule that began in January 2024. The largest cliffs land each January, with the next major one in January 2027. Roughly 6 billion tokens are still scheduled to unlock between now and 2029, which is the largest single risk factor for price.

    Can ONDO 10x from here?

    A 10x move to $3.80 is a bull-case-of-the-bull-case outcome that would require Ondo to become the default settlement layer for tokenized Treasuries and equities, plus a broader crypto risk-on environment. Possible on a 3 to 4 year horizon. Unlikely inside 12 months without a major protocol design change.

    The Honest Take

    ONDO is one of the highest-quality fundamental stories in crypto attached to a token with real structural problems. The business is winning. The token has to fight through 3 more years of unlocks to fully participate in that win. That does not make it a bad investment. It makes it a specific kind of investment: a multi-year hold with an option on token-design improvements and an option on the broader RWA sector doing what it looks like it is going to do.

    If you need a token that will rip in the next 30 days, this is not it. If you want to build a position in the infrastructure that a large chunk of tokenized real-world value will settle on by 2028, and you can stomach unlock-week drawdowns along the way, Ondo is one of the more defensible names in the sector.

    The setup we're watching: a break above $0.48 on rising volume, ideally paired with a treasury buyback proposal moving to formal vote. That combination is the cleanest signal that the market is finally repricing the business.

    Disclaimer: This article is for informational and educational purposes only and should not be construed as financial, investment, or trading advice. Cryptocurrency markets are highly volatile, and past performance does not guarantee future results. The price predictions and analyses presented here are based on AI models, technical indicators, and available data at the time of writing, they are not guarantees. Always conduct your own research (DYOR) and consult with a qualified financial advisor before making any investment decisions. Pump Parade and its authors do not assume liability for financial losses incurred based on information provided in this article.
    Solana (SOL) Price Prediction 2026: Can SOL Hit $250?

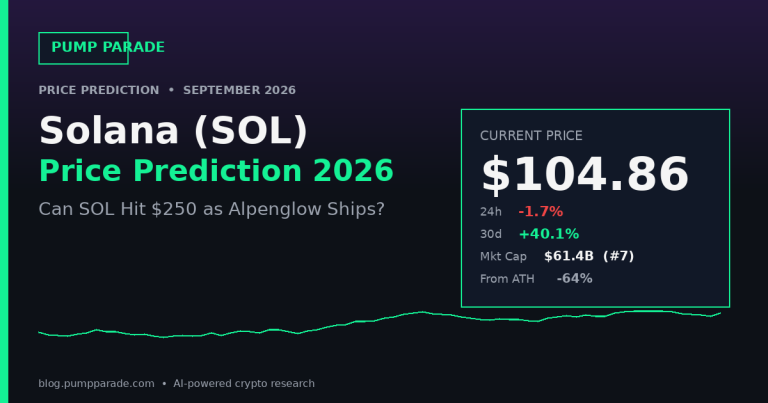
    Solana price prediction 2026 conversations changed overnight. SOL trades at $104.86 as of September 7, 2026, up roughly 40% over the past 30 days but still 64% below its January 2025 all-time high of $293. The chart alone tells you something meaningful is happening, but the real story is what’s queued up on the calendar: the Alpenglow consensus upgrade activates in October, US spot Solana ETFs just posted their strongest inflow month of the year, and Firedancer continues its slow-motion rollout across the validator set.

    So the question every trader is asking: is this the setup for a run at $250, or a lower-high before the next leg down? We looked at the on-chain data, the analyst targets, the catalyst calendar, and the honest risks. Here is what the numbers say and where they leave real room for disagreement.

    Key Takeaways

    • Price snapshot: SOL is $104.86 with a $61.4B market cap (rank #7), up 40% in 30 days, down 48% year over year.
    • Bull case anchor: Alpenglow lands in October 2026, cutting finality from 12.8 seconds to roughly 150 milliseconds. Nine spot ETFs already hold $1.49B AUM.
    • Bear case anchor: Ecosystem fee revenue is still heavily tied to speculative memecoin flow. Failure to sustain ETF inflows would remove the floor bulls are counting on.
    • Base case for year end 2026: $135 to $180 if Alpenglow ships cleanly and ETF flows hold near current pace.
    • Bull case for year end 2026: $220 to $260 requires SOL breaking $150 resistance decisively and a broader alt rotation.
    • Bear case: A retest of the $65 to $75 range if Alpenglow slips into 2027 or ETF flows reverse.
    Solana (SOL) price prediction 2026 hero graphic showing current price $104.86 and Alpenglow catalyst

    Where Solana Stands Today

    Before we talk about targets, look at the current setup. SOL is trading in the middle of a wider range that has held since April, with the recent bounce pulling it back above the 50-day moving average and roughly 15% below the 200-day. In technical terms, the trend is neutral to positive, with 30-day momentum leading. In plain terms: buyers just showed up, but they have not yet reclaimed the levels that would confirm a full trend change.

    Metric Value
    Price (Sep 7, 2026) $104.86
    24h change -1.7%
    7d change +1.7%
    30d change +40.1%
    Market cap $61.4B
    24h volume $3.61B
    Rank #7
    All-time high $293.31 (Jan 2025)
    Distance from ATH -64.2%
    Circulating supply 586.2M SOL

    Volume of $3.6B on a $61.4B market cap is a 5.9% turnover rate, which is elevated for a top-10 asset in a consolidation phase. Traders are actively repositioning. The question is which direction the position build is pointing.

    Why is Solana rallying right now?

    The 40% move over 30 days did not happen in a vacuum. Three tailwinds converged. First, the Alpenglow activation window officially opened in August, with the Agave 4.3 client release scheduled for October. That is a near-term, dated catalyst, the kind markets love to front-run. Second, spot Solana ETFs pulled in a record $153 million in a single week during August, with the category crossing $1.3B in cumulative inflows. Bitwise’s BSOL alone crossed $1B in AUM. Third, on-chain revenue rebounded as stablecoin transfer volume on Solana pushed to fresh highs, driven by payment app integrations and Jupiter routing volume.

    None of these are speculative. Each is a measurable data point. That matters, because the last time SOL ran on pure narrative without on-chain confirmation was late 2024, and it gave back most of the move within 90 days. This time, the flows and the fundamentals are moving together.

    The Bull Case for SOL

    Alpenglow finality lands in October

    Alpenglow replaces Solana’s Proof of History plus Tower BFT consensus with a new design that targets 150 millisecond finality. Current finality sits at 12.8 seconds. If it ships as promised, Solana becomes the only major L1 with settlement fast enough to compete with centralized payment rails on user experience, without giving up decentralization. That is the pitch that could pull serious payments and gaming traffic away from L2s. The Solana Compass breakdown with Anza’s Brennan Watt covers the mechanics in depth.

    ETF flows have real momentum

    Nine spot Solana ETFs are now trading in the US, issued by Grayscale, Fidelity, VanEck, 21Shares, Bitwise, and others. Cumulative inflows crossed $1.3B, with $174M added in August alone, the strongest month of the year. Most of these products include staking, which means new demand is not just spot buying, it is buying that gets pulled out of active circulation via delegated stake. Sustained flows of even $500M per month over 12 months would remove roughly 5% of circulating supply from tradeable float.

    Firedancer diversifies the validator set

    Jump Crypto’s Firedancer client continues its incremental rollout. When more than 30% of stake runs on Firedancer, Solana clears a real client diversity threshold, addressing one of the loudest historical criticisms of the network. That is a credibility unlock for institutions writing risk memos on chain selection.

    The Bear Case for SOL

    Fee revenue still depends on the casino

    Solana’s fee revenue leadership over the last two years came heavily from memecoin trading via Pump.fun and speculative flow through DEX aggregators. That is real revenue, but it is cyclical revenue. If memecoin activity contracts the way it did in Q2 2024, priority fees fall, MEV rewards fall, and one of the most bullish “chain revenue” charts loses its slope. Bulls need to see the payments and stablecoin narrative actually replace speculative fee flow, not just add to it.

    Supply overhang is real

    Circulating supply of 586M sits well below the 634M total supply, and staking rewards continue to add inflation of roughly 4.6% annually. Unlike Ethereum, Solana does not currently have a fee-burn mechanism that offsets issuance. Absolute supply grows meaningfully every year, and analyst models that project long-term price often understate the dilution effect.

    ETF flows can reverse

    The $1.3B in cumulative Solana ETF inflows looks impressive next to the launch date. It looks less impressive next to Bitcoin ETFs, which crossed $60B in cumulative flows in their first two years. Solana ETFs are still an experiment, and a single quarter of net outflows would rattle a narrative currently carrying real weight in every 2026 forecast.

    Solana Price Prediction 2026: Targets by Timeframe

    Solana (SOL) price prediction 2026 targets table showing bear $65, base $155, bull $250 across timeframes

    Here is how we frame the next 24 months. These are scenarios, not calls, and each is tied to conditions that either hold or break.

    30 days (through early October 2026)

    Bear: $85 on a broader macro shakeout or an Alpenglow delay leak. Base: $105 to $120, consolidating just under the psychological $120 resistance ahead of the upgrade. Bull: $135 on a clean pre-catalyst breakout with sustained ETF inflows. The upgrade itself is a sell-the-news risk, so an aggressive run into October often means a give-back after.

    6 months (through Q1 2027)

    Bear: $75 to $90 if Alpenglow ships but fails to deliver measurable throughput improvements in production, or if the broader alt market rolls over. Base: $135 to $180 assuming Alpenglow activates cleanly, ETF flows continue at $100M+ per month, and Firedancer stake share crosses 30%. Bull: $220 to $260 requires all three plus a decisive break above $150 with volume, opening the door to a retest of prior highs.

    Long-term (2027 to 2028)

    Analyst targets diverge sharply here. Changelly’s model lands around $208 by end of 2026 and higher through 2028. InvestingHaven’s forecast points toward $250-plus by 2029 as ETF flows compound. On the more conservative side, Coinbase’s default 5% annual growth model puts SOL near $105 in 2026, roughly where it sits now, which is the market’s way of saying the base case is already priced in. The realistic long-term range is wide: $80 to $400 depending on cycle timing, ETF adoption trajectory, and whether Solana successfully diversifies its fee base beyond speculation.

    How does Solana compare to Ethereum in 2026?

    The cleanest comparison for institutional allocators is still SOL versus ETH. Both are smart contract L1s with active ETF markets. They compete for developer mindshare, stablecoin float, and DeFi TVL.

    Metric Solana (SOL) Ethereum (ETH)
    Market cap rank #7 #2
    Base layer finality ~150ms post-Alpenglow ~12.8s (single slot)
    Median txn cost Sub-cent $0.10 to $2
    Supply inflation ~4.6% annual Net-deflationary in high-activity periods
    Client diversity Agave + Firedancer (rising) 4+ major clients
    Spot ETFs 9 products, $1.49B AUM Larger, longer track record
    Distance from ATH -64% Varies, currently deeper drawdown

    The pitch for SOL over ETH is speed, cost, and consumer-app fit. The pitch for ETH over SOL is credible neutrality, deeper institutional footprint, and a supply mechanism that arguably scales better at maturity. Both can win in different portfolios. What is no longer true, if it ever was, is that you have to pick one.

    What would change our view on SOL?

    Three conditions would meaningfully shift the base case:

    1. Alpenglow slips past Q1 2027. Any activation delay beyond October would blow up the near-term catalyst thesis and likely pull SOL back to the $75 to $85 range. Watch the Anza engineering updates and validator readiness metrics.

    2. Solana ETFs post two consecutive months of net outflows. A single weak week is noise. Two consecutive months of net outflows would signal that early institutional allocators are unwinding, and would remove the flow floor that anchors the base case.

    3. Stablecoin transfer volume on Solana crosses $500B annualized. This is the metric that would validate the “payments chain” thesis and give bulls a fundamental floor independent of speculative fees. It would also justify targets closer to $260 rather than $180 for end of 2026.

    Frequently Asked Questions

    Is Solana a good investment in 2026?

    Solana suits risk-tolerant investors who want exposure to smart-contract infrastructure, DeFi, and consumer crypto adoption. It carries higher volatility than Bitcoin or Ethereum and its revenue base still leans on speculative trading. It is not a stability holding, but the near-term catalyst calendar (Alpenglow, ETF flows) is legitimately dense.

    Will SOL reach $250 by end of 2026?

    Reaching $250 by year-end 2026 is our bull case, not our base case. It requires Alpenglow to ship cleanly in October, ETF inflows to hold or grow, and a broader altcoin rotation to pull risk appetite up. Base case sits at $135 to $180. Analyst targets from Changelly, InvestingHaven, and others cluster in the $200 to $260 range for the bull scenario.

    When does the Alpenglow upgrade activate?

    Alpenglow’s activation window opened in August 2026 and ties to the Agave 4.3 client release, currently targeted for October. The exact date depends on validator readiness. The upgrade cannot switch on until enough validators register keys and the Validator Admission Ticket is active. Anza publishes ongoing status updates.

    How do Solana ETFs affect the price?

    Spot Solana ETFs pull SOL out of tradeable circulation, especially products that include staking. Cumulative inflows now exceed $1.3B across nine issuers. Sustained monthly inflows of $100M-plus would remove several percent of circulating supply annually, which is a meaningful supply-side tailwind if maintained.

    What is the Solana price prediction for 2030?

    Long-term forecasts vary widely. Conservative models land near $270 to $400 by 2030 to 2031. Bullish models from analysts assume sustained ETF adoption and reach $500 to $1,000. Bear scenarios that assume Solana loses market share to Ethereum L2s or fails to diversify fee revenue land closer to $100 to $200. Cycle timing dominates the range.

    How does Solana staking work?

    SOL holders delegate to validators and receive a share of block rewards, typically 5% to 7% annualized after fees. Liquid staking via Marinade or Lido-style protocols lets you keep exposure to price while earning yield and using the liquid token in DeFi. ETF products increasingly include staking as well.

    The Honest Take

    Solana has the strongest 90-day catalyst calendar of any top-10 asset going into Q4 2026. Alpenglow is the kind of technical upgrade that only comes around a few times per network lifecycle, and the ETF flow data is real. But 40% in 30 days already prices in a lot of that optimism. Buying at $105 in expectation of $250 assumes multiple things break the bull’s way, and the honest version of the trade acknowledges that a $65 to $75 retest is a scenario, not a tail risk.

    If you already hold SOL, the setup is a hold with a plan: know your invalidation level, take partial profits into strength if the run continues, and do not let a good catalyst turn into a lazy conviction trade. If you do not hold and want exposure, dollar-cost averaging into any pullback below $95 gives you a better risk-reward than chasing green candles into October. Either way, the fundamental picture is more coherent today than it was six months ago, and that alone is worth noting. For research on the broader Solana DEX and aggregator ecosystem, our Jupiter (JUP) price prediction covers the venue capturing the largest share of Solana trading flow.

    Disclaimer: This article is for informational and educational purposes only and should not be construed as financial, investment, or trading advice. Cryptocurrency markets are highly volatile, and past performance does not guarantee future results. The price predictions and analyses presented here are based on AI models, technical indicators, and available data at the time of writing, and they are not guarantees. Always conduct your own research (DYOR) and consult with a qualified financial advisor before making any investment decisions. Pump Parade and its authors do not assume liability for financial losses incurred based on information provided in this article.

    Worldcoin (WLD) Price Prediction 2026: Can WLD Hit $1?

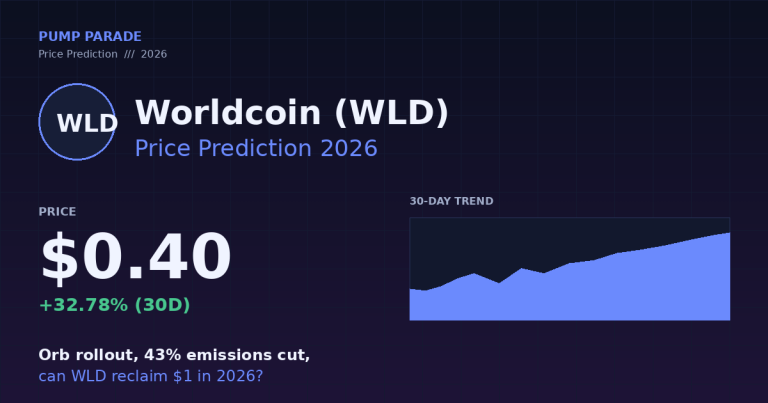
    Worldcoin has quietly done what most 2024 hype tokens could not: it survived. The Worldcoin (WLD) price prediction 2026 conversation restarted this summer for a reason. WLD is trading near $0.40, up roughly 33% in the last 30 days and 8% on the week, after Tools for Humanity cut daily token emissions by 43% and pushed Orbs into US retail partners like Starbucks. That is a genuine change in the setup, not a meme rally.

    The token still sits about 97% below its March 2024 all-time high of $11.74, so nobody is calling for a fresh cycle top. What we are asking is simpler and more useful: can WLD reclaim $1, a level it last saw in late 2025, on the back of the World Chain L2, expanding Orb rollouts, and a friendlier supply schedule? This piece walks through the current setup, the real bull and bear cases, timeframe-specific price targets, and how Worldcoin stacks up against Toncoin, the closest analog for a mass-consumer crypto project.

    Key Takeaways

    • Current price: WLD trades at $0.40, market cap $1.46B, ranked #59 by CoinGecko. Volume of $147M in 24 hours is healthy but not euphoric.
    • Base case for end of 2026: $0.55 to $0.80. That range assumes World Chain keeps growing and no major regulatory blowup.
    • Bull case: Reclaim of $1.00 to $1.20, requiring a sustained TVL breakout on World Chain plus continued Orb expansion in the US.
    • Bear case: A drift back to $0.25, driven by the 2.5 billion tokens still due to unlock through 2028 and any fresh regulatory ban.
    • Key catalyst: The 43% cut in daily emissions from 5.1M to 2.9M tokens per day, effective July 24, 2026, meaningfully reduces daily sell pressure.
    • Biggest risk: A 67% supply overhang. Roughly 6.6B of the 10B max supply is still locked, and that shadow will not disappear quickly.
    Worldcoin (WLD) price prediction 2026 hero graphic showing current price $0.40 and Orb rollout catalyst

    Where Does Worldcoin Stand Today?

    The numbers first. Every take on WLD should start with the same snapshot.

    Metric Value
    Price $0.4026
    24h change +0.15%
    7d change +8.28%
    30d change +32.78%
    Market cap $1.46B
    24h volume $147M
    CoinGecko rank #59
    Circulating supply 3.64B WLD
    Max supply 10.00B WLD
    All-time high $11.74 (Mar 2024)
    % from ATH -96.6%

    Two things stand out. First, the drawdown from the 2024 top is brutal, which explains why WLD is not on most retail radars right now. Second, the 30-day trend has genuinely turned. A gain of nearly 33% in a month, with 24-hour volume around 10% of market cap, points to real bid support rather than a wick.

    Fundamentally, World, the umbrella brand covering the Worldcoin token, World ID, World App, and World Chain, now claims over 30 million World App users and more than 18 million verified humans across 30-plus countries, according to CoinMarketCap. Whatever anyone thinks of the Orb, that is a scale number very few crypto projects can put on paper.

    Why Is WLD Grinding Higher Right Now?

    The rally is not random. Three things happened in close succession.

    Tools for Humanity, the Sam Altman and Alex Blania company behind World, cut daily WLD emissions by 43% on July 24, 2026, dropping daily unlocks from 5.1 million tokens to 2.9 million. That single change strips a meaningful chunk of daily sell pressure out of the market. Reduced sell-side is often more important than fresh demand in beaten-down tokens like this.

    At roughly the same time, World raised another $135 million from Andreessen Horowitz and Bain Capital Crypto, earmarked for Orb rollout, especially in the United States. World has been placing Orbs into Starbucks and other retail footprints, with Orb Mini deployments planned across 2026. This is a distribution story, not a technology reveal, and distribution is what identity networks actually need.

    The third factor is narrative. As OpenAI has continued to dominate headlines through 2026, Altman-adjacent assets have caught bids on flow alone. That is not a fundamental case, but it is a real market dynamic and worth naming. It is also why AI-adjacent tokens like Fetch.ai keep catching sympathy bids: see our Fetch.ai (FET) price prediction for the parallel setup.

    The Bull Case

    World Chain becomes a real L2, not a marketing L2

    World Chain is an OP Stack Layer 2 launched in October 2024 that prioritizes verified humans over bots. As of 2026, over 100 partner apps run on it, and gas is subsidized for World ID holders. If the chain graduates from a wallet-integrated experience to a top-15 L2 by TVL, WLD accrues value both as a governance token and as the identity credential apps have to integrate. The comparison here is Optimism or Base, not a niche appchain.

    Orb rollout hits inflection in the US

    World planned 7,500 Orbs deployed across the US by the end of 2025, and Orb Mini expands the footprint into retail and self-serve locations in 2026. If verified-human count moves from roughly 18 million toward 40 to 50 million by end of 2026, WLD becomes the token behind the largest proof-of-personhood network by an order of magnitude. That is a story that returning risk-on capital will want.

    Emissions cut plus buyer of last resort

    The 43% supply cut already re-rated the token. Any further reduction, or a formal buyback tied to protocol revenue, would compound the effect. Coincheckup, Kraken, and Cryptopolitan all model WLD comfortably above $1 in a base to bull 2026 environment. Even Telegaon, one of the more conservative forecasters, sees a ceiling near $0.84.

    The Bear Case

    The unlock shadow does not go away

    Even after the 43% cut, roughly 2.5 billion WLD are scheduled to enter circulation between now and 2028. That is more than 68% of current circulating supply added over the next two years. A 67% overall supply overhang, per the World whitepaper, means every rally faces a mechanical seller.

    Regulatory ceiling in key markets

    Worldcoin is restricted or banned in Indonesia, Kenya, Brazil, the Philippines, Thailand, Hong Kong, and parts of the EU. Iris scanning is a permanent political flashpoint. A single new ban in a major market can reset the growth curve on verified users, which is exactly the number the bull case leans on.

    Narrative fragility

    A large slice of WLD’s price action tracks Sam Altman headlines. That works both ways. Any negative story tied to OpenAI, Tools for Humanity, or Altman personally can pressure the token quickly, as it did during the ZachXBT allegations in 2024.

    What Is the Worldcoin Price Prediction for 2026?

    Worldcoin (WLD) price prediction 2026 targets table showing bear $0.25, base $0.65, bull $1.20 across three timeframes

    Any honest forecast has to be a range, not a number. Here is how we think about the setup across three timeframes, cross-referenced with public analyst targets from Coincheckup and Kraken.

    Timeframe Bear Base Bull
    Next 30 days $0.32 $0.45 $0.58
    6 months $0.28 $0.55 $0.85
    End of 2026 $0.25 $0.65 $1.20

    Next 30 days: $0.32 to $0.58

    The immediate setup is friendly. The 30-day trend is up, momentum is intact, and volume has stayed elevated after the emissions cut. A pullback to $0.32 is the risk if broader crypto sells off with equities. A push to $0.55 to $0.58 becomes plausible if BTC extends and the World Chain TVL prints a fresh high.

    Six months: $0.28 to $0.85

    By early 2027, the market will have priced whether the Orb rollout is actually adding users at the rate the team is claiming. If verified humans grow past 25 million and World Chain sees consistent daily active wallet counts, the bull scenario opens up. If growth flatlines, WLD drifts back toward the 2026 lows near $0.23.

    End of 2026: $0.25 to $1.20

    Base case, $0.55 to $0.80, reflects continued grinding execution and a normal alt-season bid. Bull case, $1.00 to $1.20, requires visible growth in both users and on-chain activity, plus continued broader crypto strength. Bear case, $0.25, is what happens if the unlock cliff and regulatory pressure combine. For comparison, PricePrediction models a 2026 ceiling near $1.60, while Telegaon caps at $0.84.

    How Does Worldcoin Compare to Toncoin?

    Both projects sell a mass-consumer story that runs through a proprietary app front-door. Toncoin routes through Telegram. Worldcoin routes through World App and the Orb. The comparison exposes what each token really is trading on. For the full TON breakdown, see our recent Toncoin (TON) price prediction for 2026.

    Metric Worldcoin (WLD) Toncoin (TON)
    Price $0.40 $2.42
    Market cap $1.46B ~$5.9B
    Rank #59 Top 25
    Front-door app World App (30M+ users) Telegram (900M+ MAU)
    Chain type OP Stack L2 on Ethereum Standalone L1
    Core primitive Proof-of-personhood via Orb Telegram wallet + mini-apps
    Backers a16z, Bain Capital, Tools for Humanity Telegram, ecosystem funds
    Regulatory risk High (biometrics) Medium (jurisdictional)

    Toncoin has the wider distribution and lower regulatory profile. Worldcoin has the more defensible primitive if proof-of-personhood becomes essential for AI-era apps. The Toncoin base case is a re-rating on distribution. The Worldcoin base case is a re-rating on utility.

    What Would Change Our View

    Three explicit triggers would move us off the current base case.

    Bullish trigger: Verified-human count crosses 30 million with sustained World Chain TVL above $500M. That combination would validate the identity-plus-L2 flywheel and justify a target closer to $1.50.

    Bearish trigger: A ban in either the United States or a major EU market. This would compress the total addressable network and force a re-rating toward the 2026 lows near $0.23.

    Structural trigger: An announced token buyback or fee-burn tied to World Chain revenue. Right now WLD accrues value indirectly. Direct value capture would change the modeling entirely and put a floor under the token that does not currently exist. For context on how L2 tokenomics can shift with a real fee model, see our Mantle (MNT) price prediction analysis.

    Frequently Asked Questions

    Is Worldcoin a good investment in 2026?

    Worldcoin is a high-risk, high-conviction bet. The upside case leans on Orb rollout, World Chain growth, and identity becoming essential in an AI-heavy internet. The downside case is real: 67% of supply is still locked, and biometric data collection faces active regulatory pushback in several countries. Size positions accordingly.

    Will WLD reach $1 by the end of 2026?

    Reaching $1 by year-end 2026 requires roughly a 2.5x move from current levels. That is plausible in a friendly crypto environment where World Chain user counts keep climbing. Coincheckup and Kraken both model above $1 in bullish 2026 scenarios. It is not a base case, but it is a real bull case rather than a fantasy target.

    Why is WLD so far below its all-time high?

    Two reasons. First, WLD launched in July 2023 with a small float that expanded aggressively, and the market has been digesting that supply since 2024. Second, the March 2024 top of $11.74 came during an AI-narrative peak with thin liquidity. The current price reflects a fully priced-in supply schedule and a more mature, less speculative buyer base.

    What is the Worldcoin price prediction for 2027?

    Analyst targets for 2027 span roughly $0.50 on the low end to $3.00 on the aggressive end. Our own view is that 2027 depends almost entirely on whether the AI-plus-identity thesis becomes a real product category. If it does, $2.00 is defensible. If it does not, WLD grinds sideways in the $0.50 to $1.00 range.

    What could push WLD to $10 again?

    A return to $10 would imply a 25x move and a fully diluted valuation approaching $100B. That would require WLD to become one of the top five most-used credentials on the internet, plus a broad crypto bull cycle. Possible over 3 to 5 years, not realistic inside 2026.

    Is Worldcoin still relevant in 2026?

    By user count, yes. Over 30 million World App downloads and 18 million verified humans put it ahead of most identity or wallet projects in crypto. By price action, it has been dead money for two years. Relevance and price often diverge, and Worldcoin is the current textbook example.

    The Honest Take

    Worldcoin is one of the few crypto projects with genuine consumer scale, a credible team, and a specific product problem it is trying to solve. It is also one of the most inflationary tokens in the top 100 and faces regulatory risk that most other tokens do not. Both things are true.

    The setup right now is more interesting than it has been in a year. The 43% emissions cut, the $135M raise, the US Orb rollout, and the AI narrative in the background all point in the same direction. That is what a base case above current price looks like. What it does not look like is a straight line to $10.

    Our view: WLD is a watch-and-scale token. A base position with tight risk defined below $0.30 gives exposure to the identity thesis without needing the bull scenario to work. A push above $0.85, with verified users past 25 million, is the level that would tell you the market is starting to price in the World Chain story properly. Until then, keep the size honest and let the network do the work.

    Disclaimer: This article is for informational and educational purposes only and should not be construed as financial, investment, or trading advice. Cryptocurrency markets are highly volatile, and past performance does not guarantee future results. The price predictions and analyses presented here are based on AI models, technical indicators, and available data at the time of writing, they are not guarantees. Always conduct your own research (DYOR) and consult with a qualified financial advisor before making any investment decisions. Pump Parade and its authors do not assume liability for financial losses incurred based on information provided in this article.

    Zcash (ZEC) Price Prediction 2026: Can ZEC Hit $2,000?

    Back on August 5, 2026, we published a Zcash price prediction with an $800 target for the year. ZEC was trading around $500 at the time. Thirty days later, it prints $1,009. Our old target is in the rear-view mirror, and this Zcash price prediction 2026 update explains why the next real number to watch is $2,000, not $800.

    Privacy is having its moment again. The 30-day chart shows a clean +100.6% rally on rising volume, the shielded pool is hitting fresh all-time highs, and ZEC is inside the top 15 by market cap for the first time since 2018. Meanwhile, the 21 million supply cap keeps pulling the “digital gold with privacy” comparisons from crypto Twitter and back-end analyst desks alike.

    This piece walks through where ZEC stands right now, why it is running, the bull and bear cases with named catalysts, targets by timeframe, how it stacks up against Monero, and the exact levels that would flip our view. Data is from CoinGecko and Birdeye at time of writing.

    Key Takeaways

    • ZEC trades at $1,009, up 26% on the week, 100% on the month, and 2,329% year over year.
    • Our base case for late 2026 is $1,600; our bull case is $2,400. Bear case is $500 if privacy narrative unwinds.
    • The 21 million supply cap and post-halving issuance schedule align with a Bitcoin-style scarcity story.
    • NU7 upgrade, Zashi wallet growth, and the record shielded pool are the three catalysts to track.
    • Regulatory pressure and centralized-exchange delistings remain the largest risk factors.
    Zcash (ZEC) price prediction 2026 hero graphic, current price 1009 USD with 100 percent 30-day rally

    Where Zcash Stands Today

    Zcash is the top-performing large-cap of the last 12 months. Not the loudest, not the most memed, just quietly grinding higher on real volume. Here is the snapshot.

    Metric Value
    Price $1,009
    24h change +1.16%
    7-day change +26.31%
    30-day change +100.59%
    Market cap $17.07B
    24h volume $1.14B
    Market-cap rank #11
    All-time high $3,191.93 (Oct 2016)
    Distance from ATH -68.4%
    Circulating supply 16.91M / 21M

    Two data points do the heavy lifting. First, volume: $1.14 billion in 24 hours on a $17 billion cap is a healthy 6.7% turnover, indicating real participation rather than a thin illiquid squeeze. Second, the supply picture. ZEC follows Bitcoin’s 21 million hard cap and halving schedule, and 80.5% of coins are already circulating. New issuance is small and shrinking.

    For a full comparison of ZEC’s cousin, see our recent Monero (XMR) price prediction 2026, which covers the parallel privacy trade but on a very different tokenomic footing.

    Why is Zcash rallying right now?

    Three things are happening at once, and they are feeding each other.

    The privacy narrative is back. After years of regulatory pressure that saw ZEC and XMR delisted from several jurisdictions, the mood has softened. On-chain privacy is being reframed as “financial free speech” by influential voices in the industry, and self-custody wallets are shipping shielded features by default. Zashi, the Electric Coin Company’s mobile wallet, is the clearest example. It routes activity through the Orchard shielded pool without asking the user to think about it.

    Supply mechanics are aligning with demand. ZEC halved in November 2024. Historically, the 12 to 18 months after a Bitcoin halving deliver the strongest returns. Zcash has followed the same rhythm this cycle, with the biggest leg starting roughly nine months after the halving date.

    Finally, the shielded pool is at record size. Independent trackers show the Orchard pool holding over 1.4 million ZEC, more than 8% of circulating supply, up from around 3% at the start of 2025. That is a bigger vote of confidence than any price chart. Coins in the shielded pool are effectively removed from CEX order books.

    The Bull Case for ZEC in 2026

    Catalyst 1: The NU7 upgrade and Trailing Finality Layer

    NU7 is the next network upgrade on the Zcash roadmap and introduces the Trailing Finality Layer, a proof-of-stake finality gadget layered on top of Zcash’s existing proof-of-work. In plain terms, transactions confirm faster and become irreversible in seconds instead of minutes. That matters for exchange integrations and for payment use cases. Faster settlement is a checkbox many custodial platforms have been waiting for.

    Catalyst 2: Zashi wallet and shielded-by-default UX

    Zashi is a mobile wallet from Electric Coin Company that treats shielded transactions as the default state, not a toggle. Its adoption curve since launch mirrors the growth of the Orchard pool. If Zashi keeps its pace through 2026, it becomes the on-ramp equivalent of what MetaMask was for Ethereum in 2018, but for the private-money thesis.

    Catalyst 3: The 21 million supply cap trade

    ZEC is one of only two top-30 assets that share Bitcoin’s 21 million hard cap. The other is Bitcoin itself. As institutional allocators look for “harder” money exposure outside BTC, ZEC is the natural second pick on the scarcity axis. A single macro allocator rotating 0.25% of a BTC bag into ZEC on this thesis is enough to move the price meaningfully given ZEC’s smaller float.

    The Bear Case for ZEC in 2026

    Risk 1: Regulatory tightening

    The core risk is legal, not technical. The EU’s MiCA framework introduced restrictions on privacy coins, and while enforcement has been uneven, a hardline pass could push European exchanges to delist ZEC by 2027. In the US, FinCEN guidance on privacy-enhancing tokens remains ambiguous. Any negative signal from Treasury would hit sentiment first and volume second.

    Risk 2: Centralized exchange delistings

    Binance already delisted ZEC and XMR in several jurisdictions in 2024. If the trend continues, spot liquidity migrates to Kraken and a handful of niche venues, which increases volatility and reduces the pool of buyers who can accumulate without friction. A large delisting announcement would likely trigger a 20 to 30% single-day drawdown.

    Risk 3: Parabolic exhaustion

    ZEC is up 254% over 200 days and 2,329% year over year. Parabolic moves eventually retest their breakout zones. The technical pattern shows the previous congestion around $600 to $700 as the first serious support. A pullback there is not bearish; it would be normal profit-taking. A break below $500 would be a different conversation entirely.

    Zcash (ZEC) price prediction 2026 targets table, bear 400, base 2000, bull 3500

    Zcash Price Prediction 2026: Targets by Timeframe

    Our hybrid model blends on-chain data, momentum indicators, and comparable-asset analysis. Below is the timeframe view. Numbers are targets, not promises.

    Short-term (30 days)

    Momentum is stretched. RSI on the daily chart is at 78, deep in overbought territory. The most probable path is a consolidation around the $900 to $1,100 range with a shallow pullback toward $850 support. Bear case: $650 if the whole crypto market rolls over. Base case: $1,100. Bull case: $1,500 on a continued short squeeze.

    Medium-term (6 months)

    By early 2027, the NU7 timeline and additional Zashi adoption data should be visible. Our base case is $1,600, roughly 60% above current levels. The bull path is $2,400, which would reclaim the psychologically important $2,000 handle and set up the ATH retest. Bear case is $500 if a major delisting or a broad crypto risk-off event materializes.

    Long-term (2027 to 2028)

    The long-tail thesis is straightforward. If ZEC captures even a fraction of the private-money demand that BTC ETF flows and stablecoin adoption keep highlighting, an ATH retest at $3,192 is on the table. Bear case: $400 on a full regulatory clampdown. Base case: $2,000. Bull case: $3,500, a slight new all-time high. Standard Chartered analysts have previously modeled a similar “privacy premium” scenario for BTC-adjacent assets, and a comparable dynamic could pull ZEC toward the upper end. See the base case from CoinGecko’s ZEC page, and the Electric Coin Company blog for NU7 and Zashi shipping notes for live model updates.

    How Does Zcash Compare to Monero?

    Privacy investors usually pick one or run a small basket. Here is the side by side.

    Metric Zcash (ZEC) Monero (XMR)
    Price $1,009 $525.95
    Market cap $17.07B $9.88B
    30-day change +100.6% +44.4%
    Supply cap 21M (hard) Tail emission
    Privacy default Optional (shielded pool) Mandatory
    CEX availability Moderate Limited
    Institutional wrapper Grayscale ZCSH Trust None
    Primary thesis Scarce, optional privacy Uncompromising privacy

    ZEC wins on scarcity and on institutional access. XMR wins on the purity of the privacy guarantee. Which one outperforms depends on which narrative the market prices more aggressively in the next 12 months. For a deep dive on the XMR side of the trade, see our earlier XMR comeback analysis.

    What Would Change Our View on ZEC?

    Three explicit triggers would move us off the bullish base case.

    1. A daily close below $500 would break the multi-month uptrend and force a reset toward $350 to $400.
    2. A major CEX delisting (Kraken, Coinbase, or a top-five global exchange) would compress liquidity and likely mark a local top.
    3. A Zashi adoption stall, meaning the Orchard shielded pool stops growing for 90+ days, would remove the strongest on-chain bull signal.

    If none of these fire and the crypto tape stays constructive, the base case stands. Traders holding ZEC through the ATH retest should keep a hardware wallet setup: our Ledger vs Trezor comparison covers the setup that supports shielded ZEC storage.

    Frequently Asked Questions

    Is Zcash a good investment in 2026?

    ZEC has delivered a 2,329% return over the last 12 months and holds a rank inside the top 15. The Zcash price prediction 2026 base case is $1,600, roughly 60% above current levels. The strongest tailwinds are the 21 million supply cap, the NU7 upgrade, and the shielded pool at record size. Regulatory risk is the main counterweight.

    Can Zcash reach $2,000?

    Our bull case for 6-month timeframe puts ZEC at $2,400, so $2,000 sits inside the bull path. Getting there requires a continuation of the current privacy rally, no material delistings, and the NU7 upgrade landing on schedule. If those conditions hold, $2,000 is reachable within 6 to 9 months from current price levels.

    What is the Zcash price prediction for 2027?

    Our 2027 base case is $2,000, with a bull case of $3,500 that would set a new all-time high above the 2016 peak of $3,192. Bear case sits at $400 if a broad privacy-coin regulatory clampdown materializes. The wide range reflects genuine uncertainty about the regulatory path, not weak analysis.

    Why is Zcash pumping so much?

    Three overlapping drivers: the privacy narrative resurgence, post-halving supply dynamics, and record shielded-pool growth. On top of that, the 21 million supply cap has attracted “Bitcoin cousin” allocator interest. The result is a self-reinforcing move where shrinking float meets rising demand from both retail and small institutional pockets.

    Is Zcash better than Monero?

    They solve the same problem differently. Monero enforces privacy by default and has stronger privacy guarantees. Zcash makes privacy optional but offers a Bitcoin-style scarcity model with a 21 million supply cap. If your thesis is scarcity, ZEC wins. If your thesis is unbreakable privacy, XMR wins. Serious privacy portfolios often hold both.

    Where can I buy Zcash?

    ZEC trades on Kraken, Coinbase (in most jurisdictions), Gemini, Bitfinex, and several regional exchanges. Availability has narrowed since 2024 due to compliance-driven delistings, so check your local exchange first. For long-term storage, a hardware wallet with shielded pool support is the current best practice.

    The Honest Take

    Zcash is in the strongest position it has been in since 2018, and the setup is legitimately different this cycle. The narrative has real product behind it. The supply is genuinely tight. The chart is not a memecoin blowoff; it is a slow grind that has now attracted the attention of larger allocators.

    That said, parabolic moves eventually cool off. Anyone entering here should size for a 30 to 40% drawdown without flinching, because those happen inside broader uptrends more often than people remember. The base case is bullish. The path is not straight.

    Watch the Orchard shielded pool. Watch the NU7 timeline. Watch $500. Those three signals will tell you more about the next 12 months than any headline.

    Disclaimer: This article is for informational and educational purposes only and should not be construed as financial, investment, or trading advice. Cryptocurrency markets are highly volatile, and past performance does not guarantee future results. The price predictions and analyses presented here are based on AI models, technical indicators, and available data at the time of writing, they are not guarantees. Always conduct your own research (DYOR) and consult with a qualified financial advisor before making any investment decisions. Pump Parade and its authors do not assume liability for financial losses incurred based on information provided in this article.

    Monero (XMR) Price Prediction 2026: Can XMR Hit $1,000?

    Monero (XMR) trades at $560.87, up 9.3% in the last 24 hours and roughly 60% in the last 30 days. That kind of run puts the Monero price prediction 2026 conversation back on the table, because XMR is now within striking distance of levels the market has not seen in five years. Zcash just crossed $1,000 on the same tape. Traders want to know if XMR is the next domino.

    The setup is unusual. Monero is rallying into a wall of regulatory pressure. Seventy-three centralized exchanges dropped XMR listings during 2025 under the EU’s MiCA framework, and yet spot demand keeps grinding higher. THORChain added native XMR swaps on August 24, giving the token a decentralized liquidity rail that did not exist a year ago. The FCMP++ upgrade, which expands Monero’s anonymity set from 16 decoys to over 100 million outputs, is now in its second beta stressnet.

    This piece walks through the current market snapshot, the specific catalysts driving the move, the risks that could unwind it, and three timeframe-specific price targets for XMR. We compare Monero to Zcash on eight metrics and answer the questions traders are actually typing into Google right now.

    Key Takeaways

    • XMR is up 60% in 30 days and 20% in the last week, retesting resistance near $565 after breaking $500.
    • THORChain’s version 3.20 upgrade unlocked native XMR swaps, easing the liquidity damage from 2025’s exchange delistings.
    • The FCMP++ privacy upgrade is in its second beta stressnet and remains the biggest technical catalyst for 2026.
    • Analyst 2026 targets span a wide range: Coinbase models $504, Cryptopolitan sees $655 average with an $825 max, and a few bullish sources reach toward four figures.
    • Grayscale’s Zcash ETF cleared major SEC filing steps in August 2026. XMR has no comparable filing, and that gap is now the sharpest divergence between the two privacy coins.
    • Regulatory delisting risk is real but it is now being priced in through DEX flow, not just centralized order books.
    Monero (XMR) price prediction 2026 hero graphic, current price $560, THORChain and FCMP++ catalyst

    Where Monero Stands Today

    Before any Monero price prediction 2026 exercise, anchor to real numbers. Here is the live market snapshot as of publication.

    Metric Value
    Price $560.87
    24h change +9.33%
    7d change +20.19%
    30d change +59.61%
    Market cap $10.58 billion
    24h volume $1.23 billion (spot and DEX combined)
    CoinGecko rank #13
    All-time high $797.73 (Jan 2018)
    % from ATH -29.7%
    Circulating supply 18.80 million XMR
    Tail emission 0.6 XMR per block

    Two numbers matter more than the rest. First, the 30-day gain of nearly 60% has pushed XMR to within 30% of its lifetime high, a level not tested since the 2017-2018 cycle. Second, spot volume has expanded roughly 3x versus the trailing 90-day average, which is what separates a real bid from a low-liquidity squeeze.

    Why is Monero rallying right now?

    Three flows are running in parallel. The first is a straightforward privacy sector rotation. Zcash surged past $1,000 this week on the back of Grayscale’s ETF filing progress and a broader risk-on tape. Traders who missed the ZEC move are treating XMR as the cheaper beta on the same narrative.

    The second flow is more structural. THORChain’s version 3.20 upgrade shipped on August 24, adding infrastructure for native swaps involving XMR and ZEC. That means a user can now move from Bitcoin into Monero without touching a centralized exchange, a wrapped token, or custodial risk. On-chain flow data shows Monero surged past $500 as THORChain’s native swap upgrade fueled privacy-coin momentum. The delisting problem is not solved, but it now has a functioning workaround.

    The third flow is technical. The FCMP++ development stream is closer to mainnet than most retail traders realize. In August 2026, Monero’s core dev team confirmed that Full-Chain Membership Proofs are progressing through their second beta stressnet, with the upgrade expected to expand the anonymity set from 16 decoys to over 100 million outputs. In plain English: transaction analysis on the Monero chain becomes functionally impossible once FCMP++ ships. That is a fundamental catalyst, not a meme.

    Is Monero a Good Investment in 2026?

    Privacy narrative rotation is real, not noise

    Privacy coins were the best-performing crypto sector of the trailing twelve months, with the category up more than 120% on average. CoinDesk researchers argued in January that the rally may extend into 2026 as regulatory clarity paradoxically drives demand toward censorship-resistant assets. When ZEC re-rated on ETF news, the entire sector followed. XMR has the second-largest privacy coin market cap and the highest name recognition. Rotation flows land here.

    THORChain gives Monero a real DEX rail

    Delisting risk was priced into XMR aggressively during 2025. What changed in Q3 2026 is that native swap infrastructure is now live. Users can go directly from BTC or ETH into XMR through THORChain’s runes, and Serai and other decentralized liquidity venues are extending the same functionality. Monero’s practical accessibility is now decoupled from Binance’s or Kraken’s compliance decisions.

    FCMP++ is a hard technical upgrade

    Every network upgrade in the privacy coin space matters more than the equivalent upgrade elsewhere, because privacy is the entire product. FCMP++ ships two things the market has been waiting for: a massively larger anonymity set and a cleaner path to scaling. If mainnet activation lands in the first half of 2026, expect it to draw meaningful attention from institutional privacy allocators who currently avoid XMR on chain-analytics grounds.

    What Could Break the Monero Rally?

    Delisting risk is not finished

    MiCA’s compliance obligations on custodians, payment processors, and banks have raised real questions about how long the remaining regulated venues can keep XMR pairs open. Kraken’s US Monero withdrawal restrictions, for example, remain in place. Every new delisting shaves off marginal spot demand, and if a top-five global exchange follows the 2025 wave, expect a sharp air pocket beneath current levels.

    No ETF pathway anywhere

    This is the sharpest divergence between XMR and ZEC. Grayscale’s Zcash ETF cleared major SEC filing steps in August 2026. Monero has no comparable filing anywhere in the pipeline. Institutional flow structures do not exist for XMR at the moment, which caps the ceiling on any 2026 upside relative to competitors that do have those structures.

    Overbought technicals need to unwind

    A 60% run in 30 days is exactly the kind of move that produces sharp pullbacks. RSI on the daily chart is above 80. Funding rates on perps have flipped strongly positive. If XMR fails to hold the $500 breakout level on a daily close, a mean-reversion move toward the $420-$450 zone would not be a thesis-breaker but would flush leverage in the near term.

    Monero Price Prediction 2026: Targets by Timeframe

    Monero XMR price prediction 2026 targets table, bear $340, base $650, bull $1050

    The 2026 XMR range is wider than most large-cap altcoins because the regulatory outcome is genuinely binary. Below is our timeframe breakdown, cross-checked against Coinbase, Changelly, Cryptopolitan, and iTrusty scenario models.

    Timeframe Bear Base Bull
    30-day (Oct 2026) $420 $620 $780
    6-month (Mar 2027) $340 $650 $900
    Full-year 2026 exit $300 $655 $1,050

    30-day outlook

    Near-term, expect chop between $500 and $700. The path higher runs through consolidation above the recent breakout, followed by a test of the $700 zone if FCMP++ hits its next stressnet milestone. Failure to hold $500 opens $420 as the first serious support.

    6-month outlook

    By early 2027, the market should have visibility on FCMP++ mainnet timing and on whether the ZEC ETF actually launches. If both are constructive, the base case moves toward $650 with a bull extension to $900. If FCMP++ slips and additional delistings hit, $340 is the technical support level dating back to April.

    Full-year 2026 exit

    Cryptopolitan’s model puts full-year 2026 average at $655 with an $825 maximum. That aligns closely with our base case. The bull scenario, in which XMR clears $1,000 for the first time ever, requires three things to line up: FCMP++ activation, a spot ETF filing or precedent, and the broader crypto tape staying constructive. That is a low-probability but not zero-probability outcome. Standard Chartered has not published a Monero-specific target, but their broader privacy sector note in July 2026 flagged $1,000 XMR as a plausible upside scenario contingent on regulatory neutrality.

    How Does Monero Compare to Zcash in 2026?

    The two coins are often bucketed together, but they are structurally very different. Here is the head-to-head.

    Metric Monero (XMR) Zcash (ZEC)
    Current price $560.87 $1,000.04
    Market cap $10.6B $16.9B
    Privacy model Mandatory by default Optional (shielded pool)
    Cryptography Ring signatures, RingCT, Stealth addresses zk-SNARKs
    Consensus Proof-of-Work (RandomX, CPU-mineable) Proof-of-Work (Equihash)
    Supply Tail emission (0.6 XMR/block, permanent) Halvings, fixed 21M cap
    ETF status None filed Grayscale filing progressed Aug 2026
    Major exchange access Restricted (post-MiCA) Broadly available

    The trade-off is clean. ZEC is the regulated-flow beta on privacy. XMR is the cypherpunk beta on privacy. Both can win, but they win for different reasons and on different timeframes. For a deeper side-by-side, see our Zcash (ZEC) Price Prediction 2026 analysis, which we updated in early August ahead of the ETF news.

    What Would Change Our View

    Three specific triggers would move us off the base case in either direction.

    1. Bull trigger: FCMP++ activates on mainnet with a clean, uneventful upgrade. Historical precedent (RingCT in 2017, Bulletproofs in 2018) shows that Monero upgrade activations tend to catalyze 30-40% re-rates over the following six weeks.
    2. Bear trigger: A top-five global exchange (Binance, Coinbase, Kraken, Bybit, or OKX) announces a full XMR delisting. That would compress spot liquidity meaningfully and likely produce a 30% drawdown before DEX flow absorbs the shift.
    3. Curveball trigger: A US spot Monero ETF filing from any credible sponsor. Low probability, but if it happened, it would rewrite the ceiling entirely because the market currently prices zero institutional access.

    Frequently Asked Questions

    Will Monero (XMR) reach $1,000 in 2026?

    It is possible but not the base case. Cryptopolitan’s model tops out at $825 for full-year 2026, and Kraken and CoinMarketCap models sit far lower at $185 to $242. A $1,000 XMR requires FCMP++ activation, a favorable regulatory backdrop, and continued privacy sector rotation. Our bull scenario reaches $1,050. Our base case exits 2026 near $655.

    Is Monero a good investment in 2026?

    Monero is a high-conviction, high-volatility bet on privacy as a durable crypto category. It has strong fundamentals, an active dev team, and a clear catalyst calendar. It also carries genuine delisting and regulatory risk that most other top-20 coins do not. Position sizing matters more here than for BTC or ETH. Only allocate what you can afford to lose access to at a centralized venue.

    Why is Monero being delisted from exchanges?

    Under the EU’s MiCA regulation, crypto asset service providers face compliance obligations that make privacy-by-default assets like XMR difficult to service. Seventy-three centralized exchanges delisted Monero during 2025. The trend is regulatory, not fundamental, but it is a real overhang on centralized liquidity.

    Can I still buy Monero after MiCA?

    Yes, on decentralized venues. THORChain’s native swap upgrade in August 2026 lets you swap directly from BTC or ETH into XMR without a centralized intermediary. Peer-to-peer venues like LocalMonero-equivalent services and DEX aggregators also remain available. Access is harder than it was in 2024, but it is not blocked.

    What is the Monero FCMP++ upgrade?

    FCMP++ stands for Full-Chain Membership Proofs. It expands the transaction anonymity set from 16 decoys per transaction to over 100 million outputs, using a new zero-knowledge proof structure. Practically, it makes transaction analysis on Monero effectively impossible. It is currently in its second beta stressnet, with mainnet activation expected in 2026.

    Monero vs Zcash: which is better in 2026?

    They serve different users. Zcash has better exchange access, an active ETF filing, and optional transparency for compliance workflows. Monero has stronger default privacy, more entrenched cypherpunk credibility, and a proven CPU-mineable network. For institutional exposure, ZEC is the cleaner pick. For pure uncensorable privacy, XMR is the asset. Both can appreciate at the same time.

    The Honest Take

    Monero at $560 is a different asset than Monero at $200 was. The old bear thesis was that delistings would slowly strangle liquidity and XMR would fade into irrelevance. That thesis is now demonstrably wrong. THORChain solved the DEX rail problem, FCMP++ is real technical progress, and the spot bid is verifiably back after a two-year absence.

    The new bull thesis has to be earned, though. XMR needs to consolidate above $500 for more than a two-week window, absorb whatever regulatory news lands next, and show that DEX-driven demand can sustain a market cap in the $15-20 billion range without centralized exchange support. If it does that, $1,000 is a serious 2026 outcome, not a meme.

    Our base case for full-year 2026 exit remains $655. The bull case reaches $1,050. The bear case is $300 if a major delisting hits before FCMP++ activates. Traders who want privacy exposure with a clearer regulatory ceiling should also look at ZEC. Traders who want maximum-purity privacy with a proven ten-year track record stay in XMR. For an alternative angle on secure self-custody that pairs well with privacy coins, our Ledger vs Trezor comparison covers hardware wallet trade-offs in depth. Longer-term readers can revisit our July call in Monero Price Prediction 2026: Can XMR Hit $500?, which laid out the setup at $340.

    For live price and volume data, cross-check with CoinGecko’s Monero market page. For the latest FCMP++ development updates, follow the official Monero team account. For a third-party analyst view, Cryptopolitan’s ongoing coverage at their Monero prediction hub is worth a read.

    Disclaimer: This article is for informational and educational purposes only and should not be construed as financial, investment, or trading advice. Cryptocurrency markets are highly volatile, and past performance does not guarantee future results. The price predictions and analyses presented here are based on AI models, technical indicators, and available data at the time of writing, they are not guarantees. Always conduct your own research (DYOR) and consult with a qualified financial advisor before making any investment decisions. Pump Parade and its authors do not assume liability for financial losses incurred based on information provided in this article.
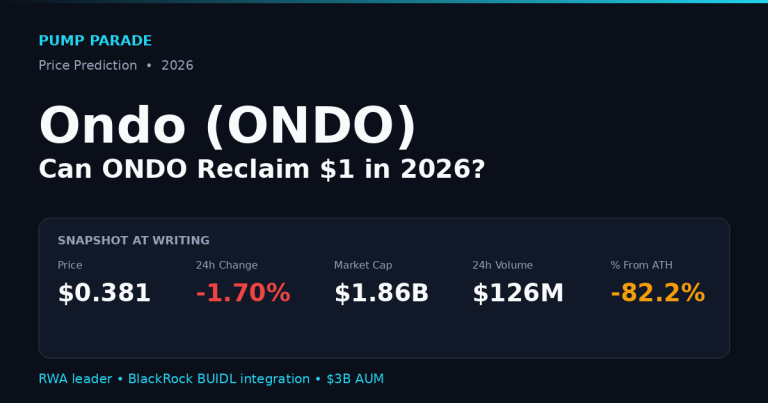
    Nansen vs DexScreener: Best Crypto Analytics 2026

    0

    Every serious crypto trader hits the same wall: the data you actually need is scattered across ten different tabs. Which wallets are buying? What token just launched with real liquidity? Where is smart money rotating this week? Two tools dominate the answers, and they take completely different roads to get there. Nansen goes deep on wallet intelligence. DexScreener goes wide on live DEX charts. Both are free to try. Both have loyal cult followings. Only one is right for how you actually trade.

    We spent the last two weeks running both platforms side by side across Solana, Ethereum, and Base to see which one belongs in your daily rotation, and which one is worth paying for.

    Nansen and DexScreener logos side by side in a VS comparison layout

    Quick Verdict: Which One Should You Use?

    Use DexScreener if you trade memes, hunt new tokens on Solana or Base, or want a free, no-signup live chart that just works. It is the fastest way to see what is trending in the last 5 minutes.

    Use Nansen if you follow smart wallets, care about who is accumulating a token before the pump, or manage a portfolio you want tracked with real PnL and entity labels. It costs money, but the labeled wallet database is genuinely unique.

    Use both if you take crypto seriously. They complement each other more than they compete. DexScreener is your radar. Nansen is your microscope.

    Product Overviews

    Nansen: Onchain Intelligence for Traders

    Nansen launched in 2020 and has grown into the largest commercial onchain labeling product in crypto. As of 2026 the platform covers 25+ chains, including Solana, Ethereum, Base, Hyperliquid, Arbitrum, and roughly 20 others, and maintains over 300 million labeled wallet addresses. Instead of showing you an anonymous 0x string, Nansen tells you the wallet belongs to Wintermute, or Jump, or a specific whale who tends to buy 6 hours before a listing.

    The company simplified its plans this year. What used to be a Pioneer plan at $99 per month and a Professional plan north of $999 was consolidated into one Pro tier: $49 per month on annual billing, or $69 monthly. There is also a free tier that lets you browse core dashboards and try the labels before subscribing.

    Visit Nansen to see the current plan lineup.

    DexScreener: The Free Radar for DEX Traders

    DexScreener does one thing extremely well: it aggregates live trading data from decentralized exchanges across 80+ networks and puts it behind a fast, clean interface. It tracks trading pairs, liquidity pools, and on-chain price action, and it surfaces new tokens within minutes of a liquidity pool going live. You do not need an account. You do not need a wallet connection. You can be running charts across four Solana pairs and three Base pairs in about 15 seconds.

    The core product is free forever. There is no token to buy, no premium tier gating basic features, and no wallet gate on the trending page. DexScreener monetizes through paid pair boosts and ads from projects, not from traders.

    Visit DexScreener to try it — no signup required.

    Features Deep Dive

    Nansen: What You Actually Get

    Smart Money dashboards. This is the headline feature. Nansen groups wallets into segments (Smart Money, Fund Smart Money, Smart Trader, Smart LP, and so on) and shows you what those segments are buying, selling, and holding across chains in near real time. If a token has 12 Smart Money wallets buying in the last 24 hours, you will see it before it hits X.

    Wallet Profiler. Paste any address and Nansen returns a full profile: labeled entity if known, current holdings, PnL over multiple time frames, favorite DEXs, average hold time, and recent activity. It is the closest thing crypto has to Bloomberg-style entity research.

    Signal alerts. Real-time push and email alerts on any non-standard on-chain activity: a Smart Money segment starting to accumulate a new token, unusual flows into a specific contract, or a large wallet unstaking. On the Pro plan alerts are unlimited.

    Portfolio tracking with PnL. Unlimited portfolios with cost basis, realized and unrealized PnL, and multichain roll-ups. The PnL math is honest and much better than the “your wallet has $X in it” number that most trackers show.

    Nansen Agent + API/MCP credits. The 2026 Pro plan includes 1000 Nansen Agent credits and one-time API/MCP credits, letting you query the labeled data programmatically or through a natural-language agent.

    DexScreener: What You Actually Get

    Real-time charts across 80+ chains. Candles, trades, and liquidity update live. You can flip between 1s, 5s, 15s, 1m, 5m, and higher time frames. Chart quality is competitive with TradingView for on-chain pairs, and often better because the data feeds directly from the pool.

    Multi-chart view. Watch up to 16 charts at once in a single grid, useful for scalpers running several positions or comparing the same token across pools and chains.

    Trending and new-pair discovery. The Trending tab surfaces top-performing pairs by volume, price change, or transactions. The New Pairs tab shows tokens as soon as they get liquidity — the source of half the “how did they find that so fast” moments on Crypto Twitter.

    Custom screeners. Filter by any combination of volume, liquidity, market cap, age, holder count, price change, and buys vs sells. Save filter presets. Chain-specific filters (e.g. Solana-only pump.fun graduates) work well.

    Alerts. Price threshold alerts, volume spike alerts, and new-pair alerts matching your custom criteria. Delivered via browser push. Unlimited.

    Free public API. 60 requests per minute, no key required. Powers a huge chunk of the Discord bots and Telegram alert bots in the Solana meme ecosystem.

    Fees & Pricing

    Nansen

    • Free: Limited dashboard access, a taste of labels, no alerts.
    • Pro: $49/month billed annually ($588/year), or $69/month billed monthly. Multichain access (25+ chains), unlimited portfolios and watchlists, unlimited Smart Alerts, full PnL, all Nansen Labels including Smart Money, 1000 Agent credits, one-time API/MCP credits.
    • Enterprise: Custom pricing for funds, exchanges, and market makers who want raw API access and higher rate limits.

    DexScreener

    • Everything: Free. Charts, screeners, watchlists, alerts, API — all free forever with no account required.
    • Paid boosts (project side): Token projects can pay to boost their pair in the trending list. This does not affect traders using the platform; it just gives projects a promotional slot.

    Head-to-Head Comparison

    See the visual breakdown below.

    Nansen vs DexScreener feature comparison table showing focus, price, chains, wallets, charts, alerts, API access and use cases
    Feature Nansen DexScreener
    Primary focus Wallet intelligence, smart money flows Real-time DEX charting and discovery
    Price $49/mo (annual) or $69/mo Free forever
    Chains supported 25+ (SOL, ETH, HL, Base, Arbitrum, +20) 80+ networks
    Labeled addresses 300M+ None (raw on-chain data only)
    Live candlestick charts Portfolio + PnL charts Full DEX candles across every pair
    Smart Money tracking Yes, core feature No
    New-token discovery speed Slower, entity-first Sub-minute after liquidity
    Alerts Unlimited Smart Alerts Unlimited price + pair alerts
    API Included on Pro (credits) Free public, 60 rpm, no key
    Account required Yes No
    Best for Following capital, portfolio PnL Memes, launches, active DEX trading

    Security & Trust

    Nansen is a Singapore-based company backed by a16z, Accel, GIC, Tiger Global, and Coinbase Ventures. It has been operating publicly since 2020 with no security incidents affecting user funds (Nansen never custodies your assets — you only connect wallets in read-only mode). The labeling methodology is proprietary but the company publishes methodology posts explaining how new entities get identified.

    DexScreener is a bootstrapped product that has been running since 2021 with a strong reputation in the Solana and EVM meme communities. It never touches user funds and requires no wallet connection to browse. The API is well-documented and stable enough that dozens of production bots depend on it. Downtime is rare and usually chain-side rather than DexScreener-side.

    Both are safe by the most important measure in crypto tools: neither can lose your money, because neither ever holds it.

    User Experience

    Nansen has been rebuilt more than once and the 2026 UI is the cleanest it has ever been. Dashboards load quickly, the mobile app is genuinely usable, and the Smart Money segments are one or two taps deep. The learning curve is real though — you can spend a full afternoon just understanding how to use the Wallet Profiler well.

    DexScreener is a masterclass in speed and simplicity. The site loads in under a second on desktop. The chart interactions are TradingView-caliber. Trending updates in real time. There is a mobile app that mirrors the web experience closely. The learning curve is basically zero: if you have ever used a stock screener, you already know how to use DexScreener.

    If UX alone decides for you, DexScreener wins comfortably. Nansen is more powerful, but power comes with menus.

    Pros & Cons

    Nansen Pros

    • Labeled wallet database is genuinely unique in crypto — nobody else is close at 300M+ addresses.
    • Smart Money segments give you an information edge that is hard to replicate manually.
    • Portfolio PnL is honest and multichain, better than most standalone portfolio trackers.
    • Signal alerts are one of the fastest ways to catch wallet-driven narratives before they trend.
    • Included API + Agent credits make it programmable, not just a dashboard.

    Nansen Cons

    • Costs money, and $49/month is a real commitment if you are a casual trader.
    • Free tier is more of a preview than a usable product.
    • Not built for chart-based day-trading workflows.
    • Some smaller chains have thinner label coverage than Ethereum and Solana.

    DexScreener Pros

    • Free, no account, no wallet connection.
    • Fastest new-pair discovery of any mainstream tool.
    • 80+ chains covered with real-time data.
    • Multi-chart view is unmatched for active traders.
    • Free public API is production-grade — dozens of Telegram and Discord bots run on it.

    DexScreener Cons

    • No wallet labeling — you see the address, not who owns it.
    • No PnL or portfolio tracking.
    • Boosted pairs can clutter the Trending tab if you are not paying attention.
    • Not designed for research on established assets that trade on CEXs.

    Winner by Use Case

    Solana meme traders: DexScreener wins. New pump.fun graduates hit the New Pairs feed within seconds. Nansen is not built for the 20-minute meme cycle.

    Fundamental crypto investors: Nansen wins. Following how funds and Smart Money rotate is worth $49/month if you are managing a real book.

    NFT and token flippers looking for narrative shifts: Nansen wins. Signal alerts on Smart Money accumulation are the single best narrative early-warning system in crypto.

    Developers and bot builders: DexScreener wins for free real-time data. Use Nansen’s API on top if you need labels in your product.

    Long-term portfolio owner who checks in weekly: Nansen wins. The multichain PnL alone is worth it once your portfolio is spread across five or more chains.

    Final Verdict

    These two tools should not really be treated as competitors. DexScreener is your live radar for what is happening in the market right now, especially on-chain. Nansen is your intelligence layer for who is doing it and why it might matter. If we had to pick one and only one, our answer depends entirely on your style:

    Active DEX trader → DexScreener. The free tier is more than enough and the workflow is faster than anything else.

    Serious portfolio holder or narrative trader → Nansen Pro. $49/month pays for itself the first time Smart Money tips you into a rotation before Crypto Twitter catches on.

    Rating:

    • Nansen: 4.5 / 5
    • DexScreener: 4.7 / 5

    FAQ

    Is DexScreener really 100% free?

    Yes. Every trader-facing feature — charts, screeners, watchlists, alerts, API — is free with no account required. DexScreener monetizes through paid boosts and ads shown to token projects, not to you.

    Is Nansen worth $49 per month?

    If you have a portfolio above roughly $10,000 or trade actively enough that a single well-timed rotation would cover the annual fee, yes. If you are casually holding a few coins on a CEX, no — a free tool plus a good portfolio tracker will do the job.

    Can Nansen see my wallet without me connecting it?

    Nansen indexes public on-chain data, so any activity on-chain is visible to anyone including Nansen. Connecting a wallet in the product is read-only and used purely to tag it as yours for portfolio purposes. Nansen never has the ability to move your funds.

    Which one is better for Solana?

    DexScreener has better real-time coverage of new Solana pairs, especially pump.fun graduates. Nansen has better labeled wallet coverage on Solana than any competitor and its Smart Money segments now include a strong Solana cohort. For active Solana trading, use both.

    Are there good free alternatives to Nansen?

    DexScreener covers the charting side. For labeled wallets specifically, no free tool comes close to Nansen — Arkham Intelligence is the nearest competitor and offers a solid free tier if you want to try labeled analytics without paying.


    For more crypto product breakdowns, read our GMGN vs Trojan comparison and our Jupiter Exchange review.

    Mantle (MNT) Price Prediction 2026: Can MNT Hit $1?

    Mantle (MNT) trades at $0.5615 at time of writing, up 9.2% over the past seven days and quietly rebuilding after a brutal 80% drawdown from its October 2025 all-time high of $2.86. The rally has crypto Twitter asking the obvious question: is this the base for a real Mantle price prediction 2026 story, or another dead-cat bounce in a Layer 2 that never quite delivered?

    There is a case for both. Mantle just crossed $1 billion in DeFi TVL for the first time in H1 2026, migrated its $2.5B Super Portal to Chainlink CCIP for institutional-grade security, and shipped an AI agent infrastructure stack that no other L2 has matched (see the Messari research profile for the full breakdown). On the other hand, Arbitrum still has 12x the TVL, L2 fee revenue is compressing across the board, and MNT is a $1.85B market cap sitting at 20% of its cycle high.

    Below we run the on-chain data, break down the bull and bear cases with named catalysts, benchmark MNT against its closest competitor, and lay out bear, base, and bull price targets across four timeframes. If you came here for a real answer to can MNT hit $1 in 2026, read to the end. The honest take is not the one you probably expected.

    Key Takeaways

    • MNT is trading at $0.5615, +9.2% on the week and +1.7% on the day, with market cap of $1.85B (rank #48).
    • Real catalysts in play: April 2026 Arsia mainnet upgrade, ZK validity proof integration, mUSD/Ondo stablecoin, cmETH restaking token, and a ~$4.2B on-chain treasury.
    • Real risks: 80% below ATH, 4th place in L2 TVL, L2 fee compression, and the fallout from the $292M Kelp bridge exploit that triggered the LayerZero exodus.
    • Our base case: MNT trades $0.60 to $0.85 through year-end 2026. The $1 target is achievable in a full L2 rotation but requires TVL to double and Bitcoin to hold above $75K.
    • Invalidation level: a weekly close below $0.42 breaks the current uptrend and puts $0.30 back on the table.
    Mantle (MNT) price prediction 2026 hero graphic - current price $0.56, Arsia upgrade catalyst

    What Is Mantle (MNT) Trading At Today?

    Before we get to the forecast, the numbers matter. Here is where MNT sits at time of writing based on Birdeye and CoinPaprika data.

    Metric Value
    Price $0.5615
    24h change +1.68%
    7-day change +9.18%
    Market cap $1.85B
    24h volume $12.5M
    Rank (by market cap) #48
    Circulating supply 3.3B MNT (of 6.22B max)
    All-time high $2.86 (Oct 2025)
    Percent from ATH -80.4%
    DeFi TVL (H1 2026) $1.0B+

    Two things stand out. First, the 24-hour volume of $12.5M is thin for a top-50 asset, and it is down 21.7% versus the previous day even as price rose. That is not the signal you want for a durable breakout, it points to a low-liquidity squeeze. Second, MNT still sits 80% under its all-time high, which is standard for L2 tokens post-2024 cycle but leaves a lot of overhead supply for any rally to work through.

    Why Is Mantle Rising Right Now?

    The 9% weekly move did not come from nowhere. Three things converged. Bitcoin held above $75K after a mid-August wobble, which pulled risk-on flows back into L2 beta plays. Arbitrum ripped 52% on the week on the back of a governance proposal, and MNT caught rotation as the next-cheapest L2 name in the top 50. And Mantle Foundation quietly closed a batch of ecosystem grants for AI-agent projects, giving the token a fresh narrative anchor that DeFi-fatigued traders were willing to buy.

    None of that is a durable thesis on its own. It is the setup that determines whether the next leg is $0.75 or $0.35. So let us lay out both.

    The Bull Case

    1. The Arsia mainnet upgrade already shipped

    In April 2026 Mantle completed the Arsia mainnet upgrade, activating eight OP Stack forks simultaneously. It refined data handling, tightened the fee model, and dropped standard withdrawal time to about six hours versus the roughly seven days it takes on Arbitrum. That is a genuine UX edge for a network trying to court institutional capital. The roadmap is bringing ZK validity proofs into the verification path next, with a stated target of one-hour finality. Faster finality means faster capital rotation, which means higher fee capture per unit of TVL.

    2. mUSD and the Ondo distribution channel

    Mantle partnered with Ondo Finance to launch mUSD, a rebasing wrapped version of USDY that is fully backed by U.S. Treasuries and bank demand deposits. In plain terms: it is a yield-bearing stablecoin that pays holders the T-bill rate while they use it in DeFi. This matters because Ondo is the on-ramp for the RWA (real-world assets) narrative that Bernstein and Standard Chartered have been calling the biggest crypto tailwind of the next 24 months. Every dollar of mUSD that gets minted is a dollar of sticky TVL on Mantle. Read our take on Ondo’s own price outlook for 2026 for the other side of that trade.

    3. The $4.2B treasury and the AI agent bet

    Mantle’s on-chain treasury sat at roughly $4.2 billion as of February 2026, and 49% of the total MNT supply is vaulted there under governance control. That is more war chest than any other L2 has, and the foundation is deploying it into two things: ecosystem grants and AI agent infrastructure. Mantle shipped ERC-8004 (on-chain agent identity) and ERC-8183 (trustless agent commerce) in Q1 2026. If AI agents become the primary users of on-chain rails over the next two years, Mantle has more of a first-mover claim than any other L2. That is a big if. It is also a real if.

    The Bear Case

    1. The Kelp exploit and the LayerZero exodus

    In mid-2026 a $292M exploit on the Kelp bridge triggered a broad review of LayerZero-based bridge configurations. Mantle’s response, migrating its Super Portal to Chainlink CCIP between July 9 and July 15, is the right call. But the story reminds the market that Mantle’s cross-chain layer was previously running on a stack that turned out to be exploitable at scale. Institutions with a fresh scar do not add exposure quickly. Rebuilding that trust will take quarters, not weeks.

    2. Fourth place in a winner-take-most market

    Mantle sits fourth in L2 TVL behind Arbitrum, Base, and Optimism. Arbitrum has $16.9B in TVL versus Mantle’s $1.43B, so the leader has more than 12x the on-chain liquidity. L2s are network-effect businesses. The DEXes, lending markets, and perps venues congregate where the liquidity is. Without a step-change catalyst that pulls a top-3 protocol to launch on Mantle first, closing that gap is a decade project, not a 2026 project.

    3. Fee compression is real

    L2 transaction fees have collapsed since Ethereum‘s Dencun upgrade brought blob storage online. Fee revenue per transaction is inherently lower on L2s than on L1, and that revenue has to cover data availability posting costs plus sequencer overhead. Treasury spending is not the same as organic demand, and analysts have flagged the risk that once ecosystem grants stop, active address counts fall off a cliff. That is the exact pattern most non-Base L2s saw in the back half of 2025.

    What Is the Mantle Price Prediction for 2026?

    Mantle (MNT) price prediction 2026 targets table - bear $0.42, base $0.85, bull $1.35

    Here is how our hybrid AI model, combining technical indicators, on-chain flow, and comparative L2 beta, frames the next four windows. These are scenarios, not calls.

    30 days: $0.42 (bear) / $0.60 (base) / $0.78 (bull)

    The base case assumes MNT holds its 20-day EMA around $0.52 and rotation from ARB continues. The bull path needs Bitcoin to close a weekly candle above $80K and Mantle TVL to add another $200M. The bear path is a weekly close below $0.48, which historically opens a fast wick to the $0.42 August low.

    6 months: $0.35 (bear) / $0.75 (base) / $1.10 (bull)

    The base assumes mUSD supply crosses $250M and cmETH restaking TVL doubles from current levels. The bull case requires a top-5 DeFi protocol to deploy natively on Mantle, plus one macro tailwind (a Fed cut, ETF approval, or Bitcoin above $95K). The bear case is a broader risk-off move where L2 tokens correlate to 0.9 with ETH and ETH breaks $2,000.

    End of 2026: $0.40 (bear) / $0.85 (base) / $1.35 (bull)

    By year-end the ZK finality roadmap should be on testnet and the AI-agent flywheel either has traction or it does not. The base case, $0.85, would still leave MNT 70% below its cycle high, so the level is defensible even if you are skeptical. Analyst target sets for comparison: PricePrediction publishes a $1.3 to $1.7 range and DigitalCoinPrice models $5.5 to $6.5, which we consider unrealistic without a full L2 supercycle. See Changelly’s model for a more conservative view.

    2027-2028 long term: $0.30 (bear) / $1.20 (base) / $2.50 (bull)

    The bull case here is a genuine flip to top-2 L2 status, which we consider a low-probability but non-zero outcome given the ZK roadmap and RWA tie-in. The base case reflects Mantle keeping its top-5 seat and growing TVL to $3B to $4B. The bear case is what happens if the AI-agent thesis does not materialize and modular L2 competition (Celestia, EigenLayer AVSs, Optimism Superchain) commoditizes what Mantle offers.

    Is Mantle Better Than Arbitrum in 2026?

    The cleanest comparison for MNT is ARB. Both are L2 governance tokens, both trade in the $0.10 to $1 range, and both are subject to the same L2 sector rotation flows. Here is the head-to-head.

    Metric Mantle (MNT) Arbitrum (ARB)
    Price $0.5615 $0.1386
    Market cap $1.85B $0.93B
    DeFi TVL ~$1.43B ~$16.9B
    Standard withdrawal time ~6 hours ~7 days
    Rollup type Optimistic (ZK path) Optimistic
    L2 rank by TVL #4 #1
    Percent from ATH -80.4% -94.2%
    On-chain treasury ~$4.2B ~$2.5B

    The interesting number is market cap. Mantle is trading at roughly 2x Arbitrum’s market cap despite having roughly 1/12th the TVL. Two ways to read that. Bulls will say MNT is the higher-quality bet on future L2 growth because of the ZK roadmap and mUSD flywheel. Bears will say the valuation gap is precisely the mean-reversion trade, and MNT should compress toward ARB, not the other way around. Neither reading is obviously wrong. For the ARB view, see our Arbitrum price prediction 2026.

    What Would Change Our Mantle Price Outlook?

    Three specific triggers would meaningfully move our base case.

    Bullish trigger: A top-5 DeFi protocol (think Uniswap, Aave, or Ethena) announces native deployment on Mantle rather than a bridged version. That would validate the thesis that Mantle can attract organic liquidity, not just incentivized TVL, and would put the $1.10 six-month bull target on the table.

    Bearish trigger: Weekly close below $0.42 on above-average volume. That level is the August range low and coincides with the point of control on the six-month volume profile. A break there opens $0.30 and would invalidate the ongoing higher-lows structure.

    Regime-change trigger: Bitcoin loses $65K on a monthly close. In that environment every L2 beta name trades to prior cycle lows regardless of fundamentals, and the analysis above becomes academic. Our model would shift to a defensive posture with cash weights above 60%.

    Frequently Asked Questions

    Is Mantle a good investment in 2026?

    Mantle is a higher-beta L2 bet with a real product roadmap (Arsia upgrade, mUSD, cmETH, ZK finality) and a genuine risk profile (thin volume, 4th-place TVL, fee compression). It is a research-worthy asset for investors with L2 conviction, but it is not a low-risk allocation. Position sizing matters more than direction.

    Will MNT reach $1 in 2026?

    Our bull case for year-end 2026 is $1.35 and our base case is $0.85. Hitting $1 requires TVL to roughly double, Bitcoin to hold above $75K, and at least one top-5 DeFi protocol to deploy on Mantle natively. The probability is real but not the base case. We would call it roughly 30% at time of writing.

    What is the difference between MNT and mETH?

    MNT is Mantle’s governance token, used for staking, gas payments in some contexts, and voting on treasury proposals. mETH is Mantle’s liquid staking token, a wrapped version of staked ETH that accrues staking yield. They are separate assets with different value drivers. Owning mETH does not give you exposure to MNT’s price action.

    Is Mantle better than Arbitrum?

    Better at what. Arbitrum has 12x the TVL, more organic DeFi activity, and permissionless fraud proofs (Stage 1 on L2BEAT). Mantle has faster withdrawals (six hours vs seven days), a bigger treasury (~$4.2B vs ~$2.5B), and a clearer AI-agent thesis. For pure DeFi liquidity, Arbitrum wins today. For a directional bet on the next narrative, MNT has more upside optionality and more downside risk.

    How high can Mantle go in 2026?

    Our bull case is $1.35 by end of 2026. Third-party models range from PricePrediction’s $1.3 to $1.7 to more aggressive numbers ($5+ from DigitalCoinPrice) that we consider unrealistic without a full L2 supercycle and macro tailwinds. Anchor your expectations to the $0.85 base case and treat anything above $1.10 as a low-probability upside scenario.

    What is the biggest risk to holding MNT?

    The biggest single risk is that L2 fee compression continues and ecosystem grants dry up before organic demand materializes. In that scenario, active addresses fall, TVL leaks to Base and Arbitrum, and MNT compresses toward Arbitrum’s market cap (roughly $0.28 to $0.35 per token). The Kelp exploit fallout and macro shocks are secondary risks but not the primary structural concern.

    The Honest Take

    Mantle is a legitimate L2 with a genuine product roadmap, a fortress balance sheet, and a distribution edge through the Ondo partnership. It also has a legitimate 4th-place problem in a market where TVL concentration is accelerating, not diffusing. Both of those things can be true at the same time.

    If you are already long MNT, the current setup does not scream sell. The chart is building higher lows, the fundamentals are stable, and the risk-reward from $0.56 to a $0.85 base case is reasonable. If you are looking to build a new position, the honest advice is to wait for either a confirmed weekly close above $0.65 (trend confirmation) or a flush to $0.42 (better risk-reward entry). Chasing a 9% weekly move on declining volume is not a strategy, it is a bet.

    Either way, treat MNT as a satellite L2 position, not a core holding. Size it accordingly. And do not let a $1 round number anchor your entire thesis. It is a psychological level, not a fundamental one.

    Disclaimer: This article is for informational and educational purposes only and should not be construed as financial, investment, or trading advice. Cryptocurrency markets are highly volatile, and past performance does not guarantee future results. The price predictions and analyses presented here are based on AI models, technical indicators, and available data at the time of writing, they are not guarantees. Always conduct your own research (DYOR) and consult with a qualified financial advisor before making any investment decisions. Pump Parade and its authors do not assume liability for financial losses incurred based on information provided in this article.