More
    Home Blog Page 6

    Uniswap (UNI) Price Prediction 2026: Can UNI Hit $10?

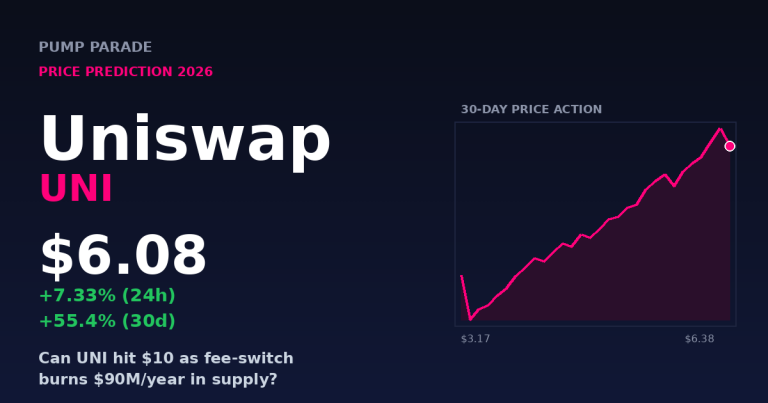
    Uniswap (UNI) is trading at $6.08 at time of writing, up 7.3% today and up roughly 55% over the past 30 days. That is a notable divergence: while Bitcoin sits down 1.7% on the day and Solana is down 3.7%, UNI is one of the few large-cap tokens ripping higher against a red tape. The proximate cause is not a mystery. Uniswap’s fee switch on Robinhood Chain went live on July 27, and daily UNI burns have doubled to $200,000-$300,000 a day since. That works out to roughly $90 million a year in structural buy pressure at current prices, or about 4.1% of circulating supply removed annually.

    The Uniswap price prediction 2026 question is being asked more frequently for a reason. This is the first time UNI has had a direct, measurable link between protocol activity and token value. Standard Chartered’s Geoff Kendrick recently said his $100 UNI target for 2030 now looks too low. That is the kind of quote that moves search demand, and it is worth taking seriously, because Kendrick has been one of the more accurate mainstream crypto analysts through the last two cycles.

    This article walks through where UNI sits today, what changed with the fee switch, the bull case for a $10 reclaim by year-end, the bear case that still deserves respect, and specific price targets across three timeframes. Then a comparison with Curve, an honest read of the risks, and a full FAQ.

    Key Takeaways

    • UNI is at $6.08, up 55% in 30 days, driven by the Robinhood Chain fee switch that went live July 27, 2026.
    • Roughly $90M/year in UNI burns is now active, removing about 4.1% of circulating supply annually if activity holds.
    • Robinhood Chain DEX volume hit $1.58B as of September 1, and Uniswap captures 78.8% of the chain’s fees.
    • Base case for end-2026: $8.50-$10.50, with a bull case toward $14 if burn rates hold and DeFi TVL keeps expanding.
    • Main risk: a regulatory reversal on DeFi or a Robinhood Chain volume rug would compress the value-accrual story fast.
    Uniswap (UNI) price prediction 2026 hero graphic, current price $6.08, fee-switch burn catalyst

    Where Uniswap Stands Today

    Here is the snapshot at time of writing, drawn from Binance spot data and public on-chain sources:

    Metric Value
    Price $6.08
    24h change +7.33%
    30d change +55.4%
    24h high / low $6.38 / $5.57
    24h volume (Binance USDT) ~$106.5M
    30d high / low $6.38 / $3.17
    All-time high (May 3, 2021) $45.02
    % from ATH -86.5%
    UNI burned to date 100M+ (about 10% of total supply)

    Two things stand out. First, UNI is still down roughly 86% from its 2021 peak, which is important context: the token spent most of the last three years underperforming its own protocol’s fundamentals. Second, the 30-day range is wide, from $3.17 to $6.38, which tells you volatility has expanded meaningfully as the fee-switch narrative took hold.

    Why Is UNI Rising Right Now?

    Three things converged. The Robinhood Chain fee switch, which routes 78.8% of chain fees into UNI buy-and-burn, went live on July 27. DEX volume on that chain then ripped to $1.58 billion by September 1 according to DefiLlama’s Uniswap dashboard. And Standard Chartered publicly said its old $100 target looked too conservative, which pulled more traders into the story.

    What matters is the mechanic. Before December 2025, UNI was a governance token with no direct claim on protocol revenue. Now it is a token where roughly $90 million per year in fees, at current volumes, gets used to permanently remove supply. In plain terms: for the first time, UNI has a fundamental floor that scales with usage. That is a different asset than the UNI of 2023.

    What Is the Bull Case for UNI Hitting $10?

    1. Structural buy pressure from fee-driven burns

    The Robinhood Chain switch pushed annualized UNI burns to about 4.1% of supply. Analysts at The Block have noted that if governance approves the v4 fee switch across mainnet, that number could double again. Standard Chartered’s revised model assumes UNI catches even part of the $2-3 trillion in tokenized-asset flow the firm expects by 2030. Under that framework, $10 is a stop, not a destination.

    2. DEX dominance is compounding, not eroding

    Uniswap still processes roughly 60-70% of total DEX volume across all EVM chains. Competitors like Aerodrome and PancakeSwap have taken share in specific niches, but Uniswap’s v4 hooks and the Robinhood integration have restarted the flywheel. When the biggest venue captures the biggest fee stream and that stream now buys back the token, the reflexivity works in UNI’s favor for the first time.

    3. The tokenized-assets narrative has a real backer

    Robinhood Chain is not a speculative L2. It is backed by a public company with 25 million funded accounts. If Robinhood routes any meaningful percentage of its tokenized-equity trading through Uniswap pools (which is the current design), UNI becomes one of the few tokens with a direct claim on TradFi order flow migrating on-chain. That is not a 2030 story. It is a 2027 story that markets will start pricing in this year.

    What Could Cause UNI to Fall?

    1. Regulatory reversal is not off the table

    The SEC formally closed its Uniswap investigation in early 2025, but a Columbia Law School piece flagged that the reprieve was procedural, not principled. A future administration could reopen the same theory: that early UNI liquidity mining constituted an unregistered securities offering. Any renewed enforcement action would compress UNI’s multiple immediately. This is the single biggest tail risk.

    2. Robinhood Chain volume is not guaranteed

    DEX volume on the chain went from near zero to $1.58 billion in weeks. That growth curve was driven by incentives and novelty. If Robinhood pulls back on liquidity mining, or if a competing chain (Base, Solana) captures the tokenized-equity narrative, the burn rate could halve within a quarter. The whole bull thesis assumes the fee stream compounds. It might not.

    3. UNI has bled through every prior rally

    Historically, UNI has underperformed its own protocol. Even after real fee burns started in December 2025, UNI printed a cycle low in early Q2 2026 below $3.20. The token has a well-documented pattern of failing to hold breakouts. Anyone bullish here needs to account for that muscle memory.

    Uniswap (UNI) Price Prediction 2026: Targets by Timeframe

    Uniswap (UNI) price prediction 2026 targets table, bear $5.20, base $9.50, bull $14.00

    Short-term (next 30 days)

    UNI just tagged $6.38 and pulled back to $6.08. The setup favors a consolidation between $5.60 and $6.80 while the market digests the recent move. A daily close above $6.80 opens $7.50 as the next resistance shelf. A break below $5.20 would invalidate the near-term bull structure and put $4.60 back in play.

    • Bear: $4.60
    • Base: $6.20-$6.80
    • Bull: $7.80

    Medium-term (6 months, through Q1 2027)

    This is where the burn narrative matters. If Robinhood Chain fees hold at current rates through year-end, cumulative burns of another 4-5 million UNI will hit the market as reduced float. Combined with typical Q4 seasonality in crypto and the potential v4 mainnet fee-switch vote, a base case in the $8.50-$10.50 range is defensible. The bull case, if the v4 fee switch passes and Robinhood volume doubles, is $14. The bear case, if regulatory noise returns, is a retest of $4.20.

    • Bear: $4.20
    • Base: $8.50-$10.50
    • Bull: $14.00

    Long-term (2027-2028)

    Long-horizon targets rest almost entirely on whether Uniswap becomes the settlement rail for tokenized assets. If it does, Standard Chartered’s revised framework points to $25-$40 as reasonable, with $100 possible on a hyperbullish RWA scenario. If it does not, UNI likely trades as a “high-quality DeFi index” name in the $8-$15 range. The downside case, in which a competing chain or a regulatory action fractures the fee stream, is a return to the low single digits.

    • Bear: $3.00-$5.00
    • Base: $12.00-$20.00
    • Bull: $30.00-$50.00

    Comparison points worth noting: Changelly’s 2027 model currently averages around $9-$11 for UNI. Coincub’s fee-switch-adjusted framework flags $12-$18 by end of 2027. Coinbase’s more conservative model sits around $7. Our base case sits in the middle of that pack, which is where a balanced read should sit given current data.

    How Uniswap Compares to Curve Finance

    Curve is UNI’s most-searched competitor and the second-largest DEX by TVL. A side-by-side comparison shows why UNI has more upside asymmetry right now.

    Metric Uniswap (UNI) Curve (CRV)
    Price $6.08 ~$0.42
    DEX volume share (all EVM) 60-70% 7-9%
    Fee accrual to token Yes (burn model, live) Yes (veCRV lock)
    Annualized fee revenue ~$1.1B ~$95M
    Primary use case General AMM, RWA Stableswap, LSTs
    Robinhood Chain integration Native (78.8% fee share) None
    Regulatory exposure High-profile SEC history Lower profile, similar risk

    Curve is a great business, but its addressable market is narrower (mostly stableswaps and liquid-staking derivatives). Uniswap is playing for the whole tokenized-asset pie, and it now has the token-economic wiring to benefit if that pie grows. Different bets. If you believe tokenized equities will scale, UNI is the higher-beta expression. If you believe stablecoin flows will scale, CRV is the more direct exposure.

    For a broader view of the DeFi lending and staking landscape, our Marinade vs Lido comparison covers the parallel dynamics in the LST market.

    What Would Change Our View

    Three specific triggers would force a rewrite of this thesis:

    • Bearish trigger: Robinhood Chain daily DEX volume drops below $300M for two consecutive weeks. That would signal the fee-switch narrative is not compounding, and the base case would compress to $6-$7.50.
    • Bullish trigger: Uniswap governance passes the v4 mainnet fee switch, or Robinhood announces a formal tokenized-equity product routed through Uniswap. Either would push base-case targets toward $12-$14 within weeks.
    • Reset trigger: A new SEC or CFTC enforcement action targeting Uniswap Labs, or a court ruling that reclassifies UNI as a security. This would trigger an immediate 30-40% derating.

    For related coverage on the broader Ethereum-based DeFi ecosystem, see our Ethereum price prediction and our Chainlink analysis.

    Frequently Asked Questions

    Will Uniswap (UNI) reach $10 in 2026?

    Reaching $10 by end of 2026 is plausible but not guaranteed. Our base case is $8.50-$10.50 by Q1 2027, which puts $10 in the middle of the target range. The two things that need to happen: Robinhood Chain fees hold at current rates, and the v4 mainnet fee switch either passes or looks likely to pass before year-end.

    Is Uniswap a good investment in 2026?

    Uniswap has the strongest fundamental setup it has had in three years, thanks to the live fee switch and burn mechanic. That said, it carries real regulatory tail risk and has a history of underperforming its own protocol. It is a defensible position for someone who wants DeFi exposure with a clear value-accrual story, but it should not be sized as a low-risk holding.

    What is the Uniswap fee switch?

    The fee switch is a governance-controlled mechanism that routes a portion of trading fees into UNI buy-and-burn transactions rather than paying them out to liquidity providers alone. It went partially live in December 2025 and expanded to Robinhood Chain on July 27, 2026. It creates a direct link between protocol activity and UNI supply reduction.

    Why is UNI pumping right now?

    Three reasons: burns doubled to about $90M annualized after the Robinhood Chain switch went live, DEX volume on that chain hit $1.58B in five weeks, and Standard Chartered publicly said its $100 UNI target for 2030 now looks too conservative. The combined signal moved traders back into the story.

    How much UNI has been burned?

    More than 100 million UNI, or roughly 10% of the total supply, has been permanently burned since the burn contract went live. Current burn rates run around $200,000-$300,000 per day, equivalent to roughly 57,000 tokens at spot prices, or about $90 million annualized.

    Uniswap vs Curve: which is better?

    They serve different niches. Uniswap dominates general AMM volume and now has native Robinhood Chain integration. Curve is optimized for stablecoin and LST swaps. UNI has higher beta to the tokenized-asset narrative right now; CRV is a more direct bet on stablecoin flow growth.

    The Honest Take

    UNI has the best setup it has had in three years. Real burns, real fee stream, real institutional integration through Robinhood. Standard Chartered upgrading their view publicly is a genuine signal, not a marketing quote. Our base case for end-2026 is $8.50-$10.50, and the path to $14 exists if the v4 mainnet fee switch passes.

    But UNI has burned bulls before. Even after the burn contract went live in late 2025, the token still printed a cycle low in Q2 2026. Regulatory risk is not zero. And Robinhood Chain volume is still young enough that a slowdown is a real scenario, not a tail risk. This is not a “close your eyes and buy” thesis. It is a “the fundamental story finally matches the price potential, and the risk-reward has flipped” thesis. Size accordingly.

    The setup worth monitoring: Robinhood Chain daily DEX volume, the v4 mainnet fee-switch vote timeline, and any SEC posture change on DeFi. Those three data points will drive the next 90 days of UNI price action more than macro or BTC beta.

    Disclaimer: This article is for informational and educational purposes only and should not be construed as financial, investment, or trading advice. Cryptocurrency markets are highly volatile, and past performance does not guarantee future results. The price predictions and analyses presented here are based on AI models, technical indicators, and available data at the time of writing, they are not guarantees. Always conduct your own research (DYOR) and consult with a qualified financial advisor before making any investment decisions. Pump Parade and its authors do not assume liability for financial losses incurred based on information provided in this article.
    Jupiter Exchange Review 2026: Fees, Features & Verdict

    0

    If you have swapped a token on Solana in the last three years, chances are the trade routed through Jupiter. What started in 2021 as a scrappy DEX aggregator has grown into the default liquidity layer for the entire Solana ecosystem, handling roughly 95 percent of DEX aggregator volume on the chain and pushing over $1.27 trillion in cumulative swap volume through its routing engine. But being the biggest does not automatically mean being the best. So the question worth answering in 2026 is simple: is Jupiter Exchange still the swap venue Solana traders should default to, or has the “DeFi superapp” push diluted what made it great?

    Jupiter Exchange official homepage banner
    Jupiter Exchange, the home of onchain finance on Solana. (Source: jup.ag)

    TL;DR: Our Verdict on Jupiter in 2026

    Rating: 4.7 / 5. Jupiter is the strongest all-round DeFi experience on Solana and, for most spot swaps, the cheapest path to best execution. Fees on standard swaps remain effectively zero at the aggregator layer, its Metis routing engine consistently beats single-venue quotes, and the recent expansion into perps, lending, and JupUSD makes it a legitimate one-stop shop. The main tradeoffs are complexity creep and reliance on Solana network conditions during congestion. If you trade on Solana at all, you should have a Jupiter tab open.

    Visit Jupiter Exchange

    What Is Jupiter Exchange?

    Jupiter is a DEX aggregator and DeFi superapp built on Solana. Instead of running its own liquidity pools, its Metis routing engine scans across dozens of Solana AMMs and order-book venues, including Raydium, Orca, Meteora, Phoenix, Lifinity, and many long-tail sources, then splits each order across the paths that deliver the best net price after slippage and fees. That is the core value proposition: you get a single interface that quietly hunts down cheaper liquidity than you would find on any one DEX.

    On top of that base layer, Jupiter has stacked a growing product suite: perpetuals with up to 100x leverage, limit orders, dollar-cost averaging, a lending market, liquid staking through JupSOL, portfolio tracking, a browser-extension wallet, and JupUSD, a Solana-native stablecoin. Governance sits with holders of the JUP token, who vote through the Jupiter DAO on things like fee changes, DEX integrations, and treasury allocation.

    By the numbers, Jupiter is the largest Solana DEX aggregator by a wide margin. According to DeFiLlama data, the aggregator has processed about $438M in 24-hour volume, $3.6B over the past week, and $14.3B in the last 30 days. Cumulative all-time aggregator volume sits above $1.27 trillion, which is closer to CEX territory than most DeFi venues get.

    Quick Stats

    • Category: DEX Aggregator, Perps, Lending, LST, Wallet
    • Chain: Solana
    • Token: JUP
    • 24h Aggregator Volume: ~$438M
    • 30d Aggregator Volume: ~$14.3B
    • All-Time Volume: ~$1.27T
    • Solana DEX Aggregator Market Share: ~95%
    • Standard Swap Fee: 0% platform fee (Ultra Mode up to 0.1%)

    Features Deep Dive

    Jupiter Exchange product ecosystem diagram
    Jupiter is a full DeFi stack: swap, perps, DCA, limit, lend, LST, portfolio.

    1. Swap and the Metis Routing Engine

    The swap interface is Jupiter’s flagship product and where most users spend their time. You pick an input token, an output token, and Jupiter’s Metis engine returns a quote assembled from split routes across every meaningful liquidity source on Solana. For popular pairs, most of the routing is invisible; for long-tail memecoins, Jupiter will happily walk you through a three-hop or four-hop path that would be tedious to construct manually.

    Two modes matter here. Manual Mode gives advanced users direct control over slippage tolerance, priority fees, Jito tips for MEV protection, and route selection, with zero Jupiter platform fee. Ultra Mode automates all of that behind a single toggle and charges a variable fee between 0 and 0.1 percent depending on order size and execution quality. For casual users, Ultra is the safer default; for anyone routing five-figure swaps regularly, Manual pays for itself.

    2. Perpetuals Exchange

    Jupiter Perps is a spot-backed perpetual futures venue that lets you long or short SOL, ETH, BTC, and a rotating set of altcoins with up to 100x leverage. Liquidity is provided by the JLP pool, a basket of SOL, ETH, BTC, USDC, and USDT, which earns yield from trader fees and funding. Fees are 0.06 percent on position open and close, plus price impact and hourly borrow rates that scale with pool utilization. Compared to Hyperliquid or GMX, Jupiter Perps is less feature-rich for pro traders but tightly integrated with the rest of the Jupiter stack.

    3. Limit Orders and DCA

    Limit orders let you set a target price and Jupiter executes when the market crosses it, charging 0.2 percent on taker executions. DCA is the same idea over time: buy a fixed dollar amount of a token every N hours or days, with a 0.1 percent platform fee. Both features are simple to set up and remove one of the most legitimate complaints about DeFi trading, which is that you have to babysit charts to catch entries.

    Jupiter Triggers limit orders feature
    Jupiter Triggers let you lock in a price before your trade fires. (Source: jup.ag)

    4. Lend, LST (JupSOL), and JupUSD

    Jupiter has quietly become a full DeFi stack. Jupiter Lend is a money market where you can supply or borrow SOL, USDC, and blue-chip Solana assets. JupSOL is Jupiter’s liquid staking token, which stakes SOL to a validator that runs Jupiter’s own MEV strategies and rebates yields to holders. JupUSD is a newer Solana-native stablecoin integrated across the Jupiter stack, aimed at reducing reliance on USDC and USDT for on-chain settlement.

    5. Wallet, Portfolio, and Developer APIs

    The Jupiter Wallet browser extension is Jupiter’s answer to Phantom and Backpack. It is competent, integrated with Jupiter Swap by default, and adds native support for Jupiter Perps and Lend. The Portfolio view aggregates balances, open orders, LP positions, and P&L in one dashboard. On the developer side, Jupiter’s Swap API and Terminal SDK are used by hundreds of Solana apps, from trading bots to games, which is a large part of why Jupiter’s aggregator volume dwarfs everyone else’s on Solana.

    Fees and Pricing

    Fees are where Jupiter shines. Here is the full breakdown as of September 2026:

    • Standard Swap (Manual Mode): 0% Jupiter fee. You pay Solana base fees, priority fees, and any optional Jito tip.
    • Ultra Mode Swap: 0% to 0.1% Jupiter fee depending on route quality and size.
    • Limit Orders: 0.2% taker fee on execution. No fee if the order expires unfilled.
    • DCA: 0.1% per executed leg.
    • Perpetuals: 0.06% base fee on open and close, plus price impact and hourly borrow.
    • Lend and JupSOL: Standard money-market spreads and validator commission; no additional Jupiter surcharge.

    For context, most centralized exchanges charge 0.1 percent per side on spot, and standalone Solana DEXs like Raydium or Orca charge 0.2 to 0.3 percent per pool hop. Because Jupiter routes across those same pools without adding a fee of its own on Manual Mode, you almost always get a better all-in price by going through Jupiter than by trading directly on the underlying DEX.

    User Experience

    Jupiter’s UI has evolved from a bare-bones swap page into one of the cleanest interfaces in DeFi. The default swap screen is minimalist. Advanced controls, route visualization, and slippage settings are one click away rather than shoved in your face. Mobile support is solid through the web app, and the Jupiter Wallet extension covers desktop use well.

    The main UX complaint in 2026 is complexity creep. Perps, Lend, DCA, Limit, Portfolio, and Studio all live under the same roof, which is powerful but can feel busy for a first-time visitor who just wants to swap USDC for SOL. The team has done a reasonable job hiding advanced features under expandable sections, but casual users may still find the sheer surface area intimidating. Compared to a single-purpose DEX like Orca, Jupiter feels like an ecosystem rather than a product.

    Security and Trust

    Jupiter has one of the strongest security track records on Solana. The core routing contracts have been audited by OtterSec and Neodyme, two of the more respected Solana-focused audit firms, and the code is open source on GitHub. The perps and lending contracts have separate audits and undergo continuous monitoring.

    There has been no major exploit of Jupiter’s core routing engine to date, though users have occasionally lost funds to phishing sites impersonating jup.ag or to malicious tokens whose contracts were interacted with via Jupiter’s frontend (a risk inherent to any DEX, not specific to Jupiter). The team is doxxed at the leadership level, with founder Meow highly active on X and in DAO governance. JUP holders have voted on major fee changes, treasury moves, and product launches, which gives the protocol a meaningful decentralization story compared to venues that are DAO-in-name-only.

    Pros and Cons

    Pros

    • Best execution on Solana thanks to the Metis routing engine splitting across dozens of venues
    • Zero platform fee on standard Manual Mode swaps
    • Deep product suite: swap, perps, DCA, limits, lend, LST, wallet, portfolio
    • Strong audit history and no core-contract exploits
    • Active DAO governance with real fee and product decisions
    • Best-in-class developer APIs used across the Solana ecosystem

    Cons

    • UI complexity has grown as more products ship
    • Reliant on Solana network conditions; congestion can still cause failed swaps
    • Perps liquidity is thinner than Hyperliquid or Binance for large positions
    • JupUSD and Jupiter Lend are newer and have less battle-tested track records
    • MEV protection is opt-in and requires Jito tips to be effective

    Who Should Use Jupiter?

    Solana spot traders: Yes, unconditionally. There is no reason to swap directly on a single Solana DEX when Jupiter will route your trade through that same DEX at the same or better price.

    Memecoin hunters: Yes. Jupiter is the fastest way to swap into and out of long-tail SPL tokens, and Ultra Mode with MEV protection is a real defense against sandwich bots.

    Passive investors: Yes for DCA and JupSOL. Set-and-forget DCA into SOL or majors is one of the cleanest ways to build a Solana position over time.

    Perp traders: Mixed. If you already live on Solana, Jupiter Perps is convenient. If you trade size and want the deepest orderbooks, Hyperliquid is still ahead.

    Total beginners: Yes with a caveat. Stick to the swap tab and ignore everything else until you are comfortable, or the surface area will overwhelm you.

    FAQ

    Is Jupiter Exchange safe to use?

    Jupiter’s core routing contracts have been audited by OtterSec and Neodyme and have no history of exploits. The main risks are the usual DeFi ones: phishing sites, malicious tokens, and wallet compromise. Always verify you are on jup.ag and use a hardware wallet for larger balances.

    Does Jupiter charge fees on swaps?

    Manual Mode swaps carry zero Jupiter platform fee. Ultra Mode charges between 0 and 0.1 percent depending on route quality. You always pay Solana network fees and optional priority fees or Jito tips on top of that.

    What is the JUP token used for?

    JUP is Jupiter’s governance token. Holders vote through the Jupiter DAO on fee structures, treasury allocation, DEX integrations, and product launches. For a deeper look at token dynamics see our JUP price prediction for 2026.

    Is Jupiter better than trading directly on Raydium or Orca?

    Almost always, yes. Jupiter routes across Raydium, Orca, and many other Solana venues without adding its own fee on Manual Mode, so you get equal or better prices than trading directly on any single DEX. For a comparison between two of the DEXs Jupiter aggregates, see our Orca vs Meteora review.

    Can I use Jupiter without connecting a wallet?

    You can browse quotes and prices without a wallet, but any actual swap, perp position, or lend action requires a connected Solana wallet like Phantom, Backpack, Solflare, or Jupiter’s own extension.

    Final Verdict

    Jupiter is not just the biggest DEX aggregator on Solana in 2026, it is the default liquidity layer for the chain. The combination of zero platform fees on standard swaps, best-in-class routing, and a full DeFi product stack makes it the most useful single tool a Solana user can have open in a tab. The complexity of the growing product surface is a real critique, but it is the kind of critique that gets leveled at every platform that becomes essential.

    If you trade on Solana in any serious way, Jupiter should be your default swap venue. If you have not tried Ultra Mode with MEV protection on volatile pairs, or set up a DCA into SOL, both are five-minute exercises that will change how you think about Solana DEX trading. Visit Jupiter Exchange and see for yourself.

    Sources: DeFiLlama protocol and aggregator data (September 2026); Jupiter official documentation at jup.ag; audit reports from OtterSec and Neodyme.

    Disclosure: This review is for informational purposes only and does not constitute financial advice. Do your own research before interacting with any DeFi protocol.

    Algorand (ALGO) Price Prediction 2026: Can ALGO Hit $0.20?

    0

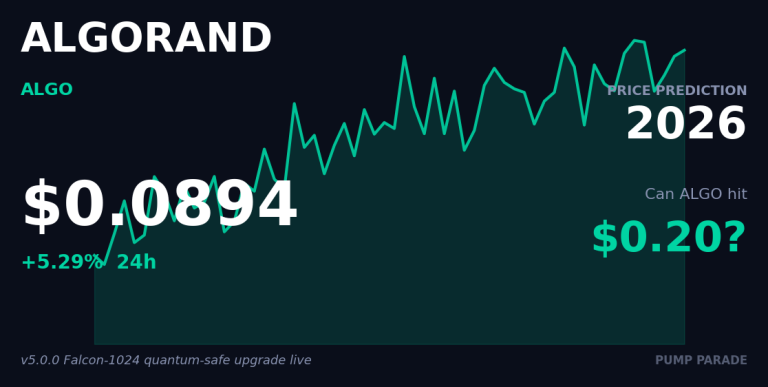
    Algorand (ALGO) trades at $0.0894 on September 1, 2026, up 5.29% in 24 hours after the network went live with a quantum-resistant upgrade that most chains are still years away from shipping. Volume is running at $17.7 million per day, market cap sits at $808 million, and validator count just crossed 1,540, making ALGO the fourth most decentralized proof-of-stake network by node count.

    Yet ALGO is still down 96.6% from its November 2021 peak of $2.65. So the honest question is not whether Algorand has good technology. It clearly does. The question this Algorand price prediction 2026 tries to answer is whether the current stack of catalysts, v5.0.0 quantum accounts, the new AC2 AI Agent Protocol, and the Flow Traders institutional liquidity deal, is enough to double ALGO to $0.20 in the next 12 to 18 months.

    Below: current market context, bull and bear cases, specific price targets by timeframe, a Hedera comparison, and three explicit triggers that would change our view.

    Key Takeaways

    • ALGO trades at $0.0894, up 5.29% today, down 3.3% on the week, and 96.6% below its 2021 all-time high.
    • v5.0.0 mainnet shipped Falcon-1024 post-quantum accounts on August 22, 2026, moving quantum resistance from optional add-on to protocol default.
    • Flow Traders partnership and the AC2 AI Agent Protocol are the two institutional and narrative catalysts most likely to drive re-rating in the next 6 months.
    • Base case: $0.115 by mid-2027. Bull case $0.225. Bear case $0.045 if BTC breaks to a new cycle low and DeFi TVL keeps bleeding.
    • Analyst consensus range for ALGO in 2026 sits between $0.15 and $0.40, per Changelly, CoinCodex, and CryptoRank.
    • Watch three triggers: AC2 developer adoption metrics, ETF filings from Grayscale or Bitwise, and a break of the $0.11 supply zone on volume.
    Algorand (ALGO) price prediction 2026 hero graphic, current price $0.0894, post-quantum v5.0.0 upgrade catalyst

    Where Algorand Stands Today

    ALGO is a low-single-digit cent asset again, and that is the first thing any honest analysis has to sit with. The token peaked at $2.65 in late 2021 during the last full-cycle euphoria and has spent the four years since grinding lower alongside most non-mega-cap Layer 1s. The current print of $0.0894 puts market cap at roughly $808 million and pushes ALGO down to the 84th spot by capitalization, which is a jarring rank for a project that at one point ran a serious pitch to be the settlement layer for tokenized assets.

    Here is the on-chain snapshot as of writing:

    Metric Value
    Price (USD) $0.0894
    24h Change +5.29%
    7d Change -3.30%
    Market Cap $808M
    24h Volume $17.7M
    Market Cap Rank #84
    All-Time High (Nov 2021) $2.65
    % From ATH -96.62%
    Max Supply 10,000,000,000
    Validator Count ~1,540 (4th most decentralized)

    What jumps out is the mismatch between fundamentals and price. Validator counts on this scale usually correlate with multi-billion market caps. ALGO is priced like a decaying experiment while the network ships code most peers cannot match. That gap is either an inefficiency, or the market is signaling adoption still is not there. Both readings deserve weight.

    Why is Algorand rising right now?

    The 24-hour bounce is not random. Three things converged in a two-week window and traders started pricing them in on Monday.

    First, the v5.0.0 mainnet upgrade activated on August 22, 2026. It delivered native Falcon-1024 post-quantum accounts, doubled the smart contract size limit, and introduced a resource-based pricing model that better aligns costs with actual computation. Quantum resistance stopped being a talking point and became a protocol default, which is a real technical differentiator in a year when Google’s Willow chip has kept quantum-computing risk in institutional risk memos.

    Second, on August 26 the Algorand Foundation released AC2, the AI Agent Protocol, giving developers a native framework for autonomous agents that transact on-chain. This maps directly onto the narrative that pulled NEAR and Bittensor into their 2024 runs. Whether AC2 gets meaningful developer adoption is still open, but the story is now in the room.

    Third, Flow Traders, one of the largest global market makers, announced a partnership to provide 24/7 institutional liquidity on ALGO with fiat and stablecoin settlement. That is the kind of plumbing story that does not move price on day one, but it starts to matter when the next round of ETF and structured-product conversations happen. ALGO gained close to 14% over the seven days following the news.

    The Bull Case

    1. Post-quantum first-mover advantage

    Most Layer 1s treat post-quantum cryptography as a “we will get to it” item. Algorand shipped Falcon-1024 signatures as a native account type at the protocol level. If quantum threat perception rises even modestly among enterprises and sovereigns, ALGO becomes a natural default for treasury and settlement pilots that need to survive a decade-plus horizon. This is a slow-burn thesis, but slow-burn theses are what re-rate infrastructure tokens.

    2. AI agent narrative rotation

    Autonomous on-chain agents were the dominant altcoin theme in late 2024 and again through mid-2026. AC2 gives Algorand a credible seat at that table with a low-fee, high-finality settlement layer that agents actually need. If TAO, FET, and NEAR run again on any macro dovish surprise, ALGO now sits close enough to that basket to catch flows. For context on how the AI-crypto narrative has moved similar assets, see our NEAR Price Prediction 2026: AI Resharding Catalyst breakdown.

    3. Institutional liquidity plus ETF optionality

    Flow Traders will not talk publicly about future products, but professional liquidity providers do not integrate a chain for fun. The precondition for a spot ETF filing, deep two-sided institutional liquidity, is now in place. Grayscale and Bitwise both filed for Cardano ETFs earlier in 2026 after CME futures went live. ALGO does not have CME futures yet, but the sequence for how these ETF conversations unfold is now visible and repeatable.

    The Bear Case

    1. DeFi TVL and developer mindshare have not returned

    Algorand’s DeFi TVL remains a rounding error next to Solana, Ethereum L2s, and even Sui. Great cryptography does not, by itself, attract stablecoins, DEX volume, or perps traders. The network needs a killer app, and the honest read is that after several years of grants and hackathons, one has not landed. Until it does, ALGO trades on narrative, not usage.

    2. Unlock and supply overhang

    ALGO has a fixed max supply of 10 billion, most of which is already in circulation, but a chunk of that is Foundation and ecosystem allocation that continues to reach the market. In a market where similar-sized L1s such as APT and SEI have persistent unlock-driven selling pressure, ALGO’s remaining supply is not a tailwind. Any rally into $0.15 or $0.20 will meet supply from wallets that bought at $1 to $2 and are still under water.

    3. Cycle timing risk

    Bitcoin trades near $77,900, well off the mid-cycle highs, and the four-year halving cycle is arguably over as institutional flows now dominate the marginal bid. If BTC breaks below $70,000 and holds, the entire alt complex, ALGO included, prints new lower lows regardless of upgrade catalysts. Buying an infrastructure token into a broad-market drawdown is a lesson every crypto veteran has paid tuition for.

    Algorand Price Prediction 2026: Targets by Timeframe

    Algorand (ALGO) price prediction 2026 targets table, bear $0.045, base $0.145, bull $0.225

    The scenarios below assume BTC trades in a $65,000 to $110,000 range through 2027, ETH holds above $2,000, and total crypto market cap does not lose the $2.5 trillion floor. Break those assumptions and the entire table needs redrawing.

    Timeframe Bear Base Bull
    30 days $0.070 $0.095 $0.115
    6 months $0.055 $0.115 $0.170
    12 to 18 months $0.045 $0.145 $0.225

    30-day outlook

    ALGO has cleared short-term resistance at $0.085 and is now testing $0.092. A weekly close above $0.095 opens a run at the $0.11 supply zone from late 2024. The bull case here is a Fed dovish surprise at the September 15 to 16 meeting combined with continued AI-agent flows, which could push ALGO to $0.115. The bear case is a rejection at $0.095 that sends price back to the $0.070 shelf.

    6-month outlook

    By March 2027, the base case assumes AC2 shows genuine developer traction (say, 50-plus live agent projects) and BTC holds $80,000. That gets ALGO to $0.115. The bull case requires a formal ETF filing from Grayscale or Bitwise, which we think has better than 30% probability given the Cardano precedent and the Flow Traders liquidity setup. That takes ALGO to $0.170. The bear case, $0.055, plays out if BTC breaks $70,000 and DeFi TVL keeps bleeding.

    12 to 18 month outlook

    This is the horizon where $0.20+ becomes realistic. Our bull case of $0.225 assumes three things converge: an ETF actually launches, AC2 wins one big enterprise pilot, and BTC reclaims six figures on a sustained basis. Analyst comps sit in the same neighborhood. Changelly’s 2026 average is $0.148, CryptoRank models a 2026-2030 range with $0.20 as a mid-cycle target, and CoinCodex’s algorithm currently prints a 2027 high near $0.24. Our base $0.145 is deliberately below the analyst mean because we discount for supply overhang and slow DeFi recovery.

    How does Algorand compare to Hedera (HBAR)?

    Both are enterprise-focused, non-EVM L1s trying to win institutional workflows. Both trade well below their previous cycle highs. The comparison is the cleanest one available for a reader deciding where to allocate a small enterprise-L1 sleeve.

    Metric Algorand (ALGO) Hedera (HBAR)
    Price $0.0894 ~$0.12 range
    Consensus Pure PoS (Ouroboros-style) Hashgraph aBFT
    Governance model Foundation + on-chain vote Governing Council (39 firms)
    Time to finality ~2.8 seconds ~3-5 seconds
    Post-quantum Native Falcon-1024 (live) On roadmap, not live
    AI narrative AC2 Agent Protocol (live) HCS-10 agent standard
    Institutional MM Flow Traders (2026) Multiple, longer-standing
    Max supply 10B 50B

    The read: HBAR has the deeper enterprise book (Google, IBM, Boeing on the Council) and better established liquidity. ALGO has the cleaner technical story right now and a smaller float, which cuts both ways: less supply pressure at the top but thinner order books on the way up. For our full take on HBAR, see our Hedera 2026 outlook. Cardano remains the third comparable, and we covered its ETF-window setup in our ADA price prediction.

    What would change our Algorand view?

    Three specific triggers would move our base case up or down materially.

    Trigger 1 (bullish, +30% to base): A Grayscale or Bitwise S-1 filing for a spot ALGO ETF within the next four months. The Cardano playbook took about eight months from CME futures to filing, and Flow Traders integrating institutional liquidity is the analog precondition. If this lands, base case moves from $0.145 to roughly $0.19.

    Trigger 2 (bullish, +20% to base): Verified AC2 agent transaction volume of 100,000+ daily by year-end. That would put Algorand in the same conversation as NEAR and Bittensor for AI-agent settlement and pull in narrative-driven flows.

    Trigger 3 (bearish, -35% to base): BTC weekly close below $68,000. Any full-cycle break in Bitcoin drags every non-mega-cap L1 back to prior-cycle support. For ALGO, that support is roughly $0.045.

    Frequently Asked Questions

    Will Algorand reach $1 in 2026?

    Reaching $1 in 2026 would require ALGO to rise more than 1,000% from current levels of $0.0894. That is not the base case in any credible model. Even the most bullish 2026-2030 forecasts from Changelly and CoinCodex place $1 as a 2028 or later target, contingent on a full crypto bull cycle plus meaningful DeFi and AI-agent adoption on Algorand. Realistic 2026 upside is in the $0.15 to $0.25 range.

    Is Algorand a good investment in 2026?

    Algorand fits investors who want long-duration exposure to enterprise blockchain infrastructure, post-quantum security narratives, and the AI agent thesis. It is not a good fit for traders chasing near-term momentum, since liquidity is thinner than mega-caps and price action is choppier. Size any position accordingly, and remember ALGO has dropped 96% from its all-time high, which shows how volatile the downside can be.

    What is the highest ALGO can go?

    ALGO’s all-time high is $2.65 from November 2021. Getting back to that level would require roughly a 30x from current prices, which is only realistic in a full bull cycle with genuine ecosystem breakout. A more useful ceiling to think about for 2026-2027 is $0.30 to $0.40, which is where multiple analyst models cluster their bull scenarios and where the 2024 resistance zone sits.

    Why has Algorand fallen so much?

    ALGO fell for the same reasons most 2021-cycle L1s fell: fading DeFi TVL, a shift in developer attention to Ethereum L2s and Solana, and steady token unlocks against weak demand. Fundamentals kept improving, but market attention moved elsewhere. The v5.0.0 upgrade and AC2 launch are the first catalysts in years that give traders a fresh story to buy.

    What is the Algorand v5.0.0 upgrade?

    The v5.0.0 mainnet upgrade activated on August 22, 2026. It introduced native Falcon-1024 post-quantum signatures at the account level, doubled the maximum smart contract size, and moved to a resource-based fee model. In plain terms, Algorand became one of the first live L1s where the default account type is resistant to attacks from a future quantum computer.

    Does Algorand have an ETF?

    No ALGO spot ETF exists yet in the United States. The precondition list is starting to fill in, though: CME futures are the missing piece, Flow Traders now provides institutional 24/7 liquidity, and the SEC’s Generic Listing Standards approved in 2025 shortened the review process. A filing at some point in 2027 is plausible but not confirmed.

    The Honest Take

    Algorand in September 2026 is a low-market-cap, well-engineered network with a legitimate post-quantum technical edge, a fresh AI-agent story, and a real institutional liquidity partner. It is also a token that has lost 96% of its peak value and still has to prove that the on-chain economy will show up. Both things are true.

    The reasonable trade setup is this: base case is a slow re-rating to $0.11 to $0.15 as the v5.0.0 and AC2 narratives are absorbed, with genuine upside to $0.20 or higher if an ETF path materializes or AC2 wins visible enterprise adoption. Sizing matters. This is not a core Bitcoin or Ethereum allocation. It is a satellite position with a defined thesis and a clear invalidation level (a monthly close below $0.055).

    If you cannot articulate why you own it beyond “it is cheap,” you probably should not. If you can articulate the quantum-plus-AI-agent thesis and can hold through 30% drawdowns, ALGO at $0.09 is one of the more asymmetric setups in the mid-cap L1 basket. Cross-reference live data on CoinMarketCap and the Algorand Foundation site for v5.0.0 release notes.

    Disclaimer: This article is for informational and educational purposes only and should not be construed as financial, investment, or trading advice. Cryptocurrency markets are highly volatile, and past performance does not guarantee future results. The price predictions and analyses presented here are based on AI models, technical indicators, and available data at the time of writing. They are not guarantees. Always conduct your own research (DYOR) and consult with a qualified financial advisor before making any investment decisions. Pump Parade and its authors do not assume liability for financial losses incurred based on information provided in this article.

    Avalanche (AVAX) Price Prediction 2026: Can AVAX Hit $15?

    0

    Avalanche (AVAX) trades near $7.21 as of August 31, 2026, down about 1.5% on the day and 5% on the week. The token is 95% below its 2021 all-time high of $146, yet the fundamental story keeps getting louder. Charles Schwab just added AVAX to its retail crypto brokerage. Real-world assets on the network passed $1.93 billion, up almost eightfold in a year. And Kenya moved more than 15 million student records onto the Avalanche C-Chain, with a runway to 30 million.

    So the obvious question people are typing into Google right now: can Avalanche (AVAX) hit $15 in 2026? That would be a clean 2x from today, well inside historical altcoin volatility, and it lines up with the range some analysts (including Standard Chartered, aggressively) are modelling. But nothing in crypto is that clean. This Avalanche (AVAX) price prediction 2026 breakdown walks through where AVAX sits today, the real bull and bear catalysts, targets by timeframe, how AVAX stacks up against Solana, and the exact scenario triggers that would change our view.

    Key Takeaways

    • Current AVAX price: $7.21. Rank 28 by market cap ($3.05B), down 5% on the week and about 46% year-over-year in a broad altcoin drawdown.
    • Base case 2026 target: $9-$12. Assumes RWAs on Avalanche grow to $3-$4B, no major regulatory shock, BTC holds above $70K.
    • Bull case: $15-$22. Requires Schwab flows to translate to real spot demand, Avalanche L1 count to double, and an ETF filing to gain traction.
    • Bear case: $4-$5.50. If BTC breaks $65K and subnet liquidity keeps splintering, AVAX has room to fall another 30-40%.
    • Watch these triggers: Standard Chartered’s $100 AVAX target for 2026, Progmat’s securities migration progress, and any spot AVAX ETF filing from VanEck or Grayscale.
    Avalanche (AVAX) price prediction 2026 hero graphic  current price $7.21, Schwab listing and Etna upgrade catalysts

    Where Avalanche (AVAX) Stands Today

    Here are the numbers, straight from Coinbase spot and Coinlore as of publication:

    Metric Value
    Price (USD) $7.21
    24h change -1.54%
    7d change -5.16%
    Market cap $3.05B
    24h volume $140.7M
    Rank 28
    Circulating supply 422.3M AVAX
    Max supply 715.7M AVAX
    All-time high $146.22 (Nov 2021)
    % from ATH -95.1%

    Translation: AVAX is deep in a multi-year drawdown, but with real network usage growing underneath the price. That gap between fundamentals and price is exactly the setup that either mean-reverts hard, or grinds sideways until sentiment finally catches up. The interesting part is figuring out which.

    Why is AVAX price stuck in the single digits right now?

    Three things, in order of impact.

    First, macro. Bitcoin is trading around $78,300, roughly 30% below its early-2026 highs. Ethereum is at $2,441. When the majors bleed, mid-cap alts like AVAX get sold harder, because they sit further out on the risk curve. This isn’t Avalanche-specific pain. Look at Solana at $103 or Cardano hovering under $0.20 and you’ll see the same pattern.

    Second, the subnet problem. Avalanche’s core scaling pitch is that any team can spin up its own Avalanche L1 (formerly called a subnet) for near-zero cost after the Etna upgrade slashed launch fees from 2,000 AVAX to just 1 AVAX. That’s great for developer adoption. It’s less great for AVAX price capture, because each L1 can define its own gas token. Liquidity fragments. Fees don’t always route back to the base asset.

    Third, unlocks. Avalanche’s max supply is 715.7M against 422.3M circulating, meaning roughly 293M AVAX remain to be issued, largely via staking rewards. That’s a persistent headwind on price even when demand is strong.

    Here’s the thing though: the fundamentals aren’t just holding, they’re accelerating. That brings us to the bull case.

    The Bull Case for AVAX in 2026

    1. RWAs on Avalanche crossed $1.93B, and Securitize is the anchor tenant

    Real-world assets tokenized on Avalanche jumped from roughly $242M a year ago to $1.93 billion as of August 2026, per CoinMarketCap data. Securitize alone accounts for more than half of that value, and Japanese fintech Progmat completed a $2.7B securities migration to its Avalanche L1. This is the kind of quiet, non-hype infrastructure win that historically precedes price moves. RWA is now Avalanche’s second-largest narrative behind subnets, and it’s genuinely working.

    2. Charles Schwab added AVAX to its retail crypto trading platform

    In August 2026, Schwab announced it will expand Schwab Crypto (which launched with just BTC and ETH in May) to include SOL, LINK, and AVAX. Schwab has roughly 36 million active brokerage accounts. Even if a fraction of those accounts allocate 1-2% to AVAX over the next 12 months, that’s meaningful spot demand hitting a token with a $3B market cap. This is the closest thing to a traditional-finance on-ramp AVAX has ever had.

    3. Standard Chartered’s Geoff Kendrick sees $100 AVAX in 2026

    Standard Chartered analyst Geoff Kendrick, one of the more crypto-forward bank analysts on Wall Street, published a note projecting AVAX at $55 by end-2025, $100 in 2026, $150 in 2027, and $250 by 2029. His thesis rests on subnet scaling and post-Etna developer migration. Coming from a name that also correctly called much of the ETH ETF flow story, that target is worth respecting even if you don’t fully believe it. Compare that to more conservative models: Changelly pegs 2026 average AVAX at around $6, and Coinpedia models a range of $8-$16.

    The Bear Case for AVAX in 2026

    1. Subnet liquidity keeps fragmenting away from AVAX

    Every Avalanche L1 that launches with its own gas token pulls activity away from the base C-Chain. The Etna upgrade made this problem worse, not better, from AVAX’s perspective. If the top 20 L1s all end up with independent economies, AVAX becomes a settlement token that captures a tiny slice of the total value flowing through the ecosystem. This is a similar risk to the one Cosmos ATOM has struggled with for years.

    2. AVAX unlocks are structural, not cyclical

    Staking-based emissions add sell pressure every single month, regardless of market conditions. Combine that with venture and team unlocks still trickling through 2026-2028, and AVAX faces a persistent supply headwind that peers like SOL (with a much larger circulating float relative to max supply) don’t.

    3. Competition from Solana and Ethereum L2s is brutal

    Solana is winning the retail memecoin and consumer app narrative. Base and Arbitrum are winning DeFi TVL. Even Aptos and Sui, both smaller than Avalanche, are grabbing mindshare on high-throughput narratives. Avalanche’s institutional and RWA angle is real, but it’s a slower-burn story than the retail-driven pumps that move altcoin prices.

    What is the Avalanche price prediction for 2026 by timeframe?

    Avalanche (AVAX) price prediction 2026 targets table  bear $4.50, base $10.50, bull $16 for 6-month timeframe

    Here’s how our AI model, informed by the catalysts above and current market structure, frames AVAX price prediction 2026 across three timeframes.

    30-day outlook (September 2026)

    Base case: $6.80-$8.20. AVAX is coiling in a tight range with RSI neutral and low volume. Expect chop between the $6.50 support zone and $8 psychological resistance. Bear: a break of $6.50 opens $5.20. Bull: a reclaim of $8.50 with volume targets $10, but that requires BTC to hold $78K+.

    6-month outlook (Q1 2027)

    Base case: $9-$12. Assumes the Schwab listing drives measurable retail inflows by Q4 2026, RWA TVL crosses $3B, and BTC grinds back toward $90K. Bear: $4.50-$6 if the broader altcoin market makes a lower low. Bull: $14-$18 if a spot AVAX ETF filing is confirmed and Progmat expands its Avalanche L1 deployment.

    Long-term outlook (2027-2028)

    Base case: $18-$28. A cyclical recovery plus continued RWA growth. Bull: $45-$70, only if institutional flows compound and Avalanche captures 5%+ of the tokenized asset market. Bear: $3-$5 in a scenario where L1 fragmentation permanently caps AVAX value capture. Standard Chartered’s $100 remains an outlier bull case that requires almost everything to go right.

    Timeframe Bear Base Bull
    30 days $5.20 $7.50 $10
    6 months $4.50 $10.50 $16
    2027-2028 $4 $22 $55

    Is AVAX better than Solana in 2026?

    Both chains sell high throughput and low fees. But the go-to-market strategies could not be more different. Here’s a side-by-side that matters more than the price tag.

    Metric Avalanche (AVAX) Solana (SOL)
    Price $7.21 $102.79
    Market cap $3.05B $60.4B
    Architecture Multi-chain (C, P, X + L1s) Monolithic single chain
    Consensus Snowman/Avalanche Proof of History + Tower BFT
    Best for Institutional RWA, custom L1s Consumer apps, memecoins, DEXs
    Notable win $1.93B RWA TVL, Schwab listing Retail activity, Firedancer client
    Key risk L1 fragmentation dilutes AVAX Network outages, MEV extraction

    Not a competition, in practice. They’re solving different problems. For a deeper look at SOL’s own setup, our recent Solana price prediction 2026 breaks down the SOL side of the trade. Also worth reading if you’re weighing RWA plays: our Chainlink price prediction covers the oracle infrastructure that most tokenized RWA products, including many on Avalanche, actually rely on.

    What would flip our AVAX price prediction?

    Three scenario triggers that would meaningfully shift the outlook:

    1. A confirmed spot AVAX ETF filing. If VanEck, Grayscale, or Bitwise files an S-1 for a spot AVAX product, the base case flips to $12-$16 quickly. AVAX is one of the few remaining top-30 tokens without a filed ETF, and the Schwab listing suggests institutional pipes are being built.

    2. Progmat expands to $10B+ on its Avalanche L1. Progmat’s initial $2.7B securities migration proves the model works. If they scale to $10B or bring on other Japanese banks, RWA becomes the dominant AVAX narrative and price capture becomes easier to justify.

    3. BTC breaks $65K and holds. Reverses our base case immediately. AVAX has a 90-day beta of roughly 1.6 to BTC, meaning a further 20% BTC drawdown likely maps to a 30-35% AVAX drawdown. That would put the bear case ($4.50 area) in play fast.

    Frequently Asked Questions

    Will Avalanche (AVAX) reach $15 in 2026?

    Possible, but not our base case. AVAX would need to roughly 2x from current levels of $7.21. That requires the Schwab retail flow to materialize, RWA TVL to grow to at least $3B, and BTC to hold above $75K through year-end. Our base case for 2026 exit is $9-$12, with $15+ as the bull scenario. A confirmed ETF filing would meaningfully shift the odds.

    Is Avalanche a good investment in 2026?

    It depends on your thesis. If you believe institutional RWA tokenization is the next major crypto adoption wave, AVAX has better positioning than most peers at a market cap that leaves room to grow. If you’re betting on retail-driven altcoin rotations, SOL and smaller L1s have historically moved faster. AVAX suits patient investors who care about fundamentals over 12-24 month horizons.

    What is the Avalanche price prediction for 2026?

    Analyst forecasts for AVAX in 2026 range widely: Standard Chartered’s Geoff Kendrick projects $100, Coinpedia models $8-$16, Cryptopolitan sees an average of $18.89 with a range of $6-$22, and Changelly forecasts a more conservative $5.97-$6.31. Our own model splits the difference: base case $9-$12, bull case $15-$22, bear case $4-$5.50.

    Why is AVAX price dropping?

    AVAX is down about 5% on the week largely because Bitcoin sold off from the $85K area to $78K, dragging the entire altcoin complex lower. AVAX also faces structural sell pressure from ongoing staking emissions and the fact that new Avalanche L1s can use their own gas tokens, which dilutes demand for AVAX itself. Fundamentals like RWA growth and the Schwab listing remain positive.

    Is AVAX better than Solana?

    Neither is strictly better, they’re built for different use cases. Avalanche’s subnet architecture and Snowman consensus favor institutional deployments, custom L1s, and RWA tokenization. Solana’s monolithic single-chain design favors high-frequency retail apps, DEXs, and memecoins. Portfolio-wise, they can complement each other rather than compete directly.

    What is the Avalanche 9000 upgrade?

    Avalanche9000 was activated via the Etna hard fork on December 16, 2024. It slashed the cost of launching an Avalanche L1 from 2,000 AVAX (roughly $100K+ at prevailing prices) to just 1 AVAX, and decoupled L1 validators from having to also validate the Primary Network. This dramatically lowered the barrier for enterprises and developers to build custom chains on Avalanche.

    The Honest Take

    AVAX at $7.21 is not the story of a broken project. It’s the story of a project whose fundamentals are clearly improving while the price waits for macro to cooperate. RWA growth is real. Schwab access is real. Standard Chartered’s $100 target is aggressive, but the direction is defensible.

    The bear case is equally real: L1 fragmentation, persistent emissions, and competition from every direction on the L1 landscape. If BTC keeps sliding, AVAX will slide with it, catalysts or no catalysts.

    Our honest read: $15 by end of 2026 is a stretch bull case, not a base case. The base case is $9-$12, which still represents a ~40-65% upside from here. That’s a reasonable risk-reward for patient capital that believes in the institutional adoption thesis. If you’re chasing 10x, look elsewhere. If you’re building a longer-dated altcoin basket, AVAX at these levels earns a small allocation and a plan to add on a break of $6 or a break above $10 with volume. For a broader read on the RWA narrative also playing out on other chains, our Aptos APT price prediction is worth a look, and HBAR price prediction covers the enterprise-blockchain angle from a different vantage.

    Disclaimer: This article is for informational and educational purposes only and should not be construed as financial, investment, or trading advice. Cryptocurrency markets are highly volatile, and past performance does not guarantee future results. The price predictions and analyses presented here are based on AI models, technical indicators, and available data at the time of writing, they are not guarantees. Always conduct your own research (DYOR) and consult with a qualified financial advisor before making any investment decisions. Pump Parade and its authors do not assume liability for financial losses incurred based on information provided in this article.

    Toncoin (TON) Price Prediction 2026: Can TON Reclaim $3?

    Toncoin (TON) just printed one of the year’s cleanest breakouts. At time of writing TON trades at $1.78, up 31% in the last 24 hours and 25% on the week, with market cap crossing back above $4.5 billion. Any serious toncoin price prediction 2026 now has to account for a token that is both technically inflecting and structurally tied to the largest Web3 messenger on earth.

    Volume is the tell. Perpetual funding just flipped positive, open interest is climbing, and TON’s staking APR has settled near 18.8%, the highest of any top-50 asset. That combination is what separates a real leg from a dead-cat bounce.

    Here is what this article covers: where TON stands today, the specific catalysts driving the pump, the bull and bear cases with named risks, our 30-day, 6-month, and long-term price targets, and how TON stacks up against Solana as the closest utility comparison.

    Key Takeaways

    • TON is at $1.78, +31% in 24h and +25% over 7 days, with market cap of $4.5B and rank 22.
    • Bull case: Telegram validator ramp, TON Pay 2.0 rollout, and 18.8% staking APR locking supply.
    • Bear case: Emissions dilution, macro correlation with BTC, and unlock overhang from foundation vesting.
    • Base case 2026 target: $3.10 by year end, with a bull case near $5.00 and a bear floor of $0.95.
    • All-time high: $8.23 (June 2024). Current price is 78% below the peak, leaving room for mean reversion.
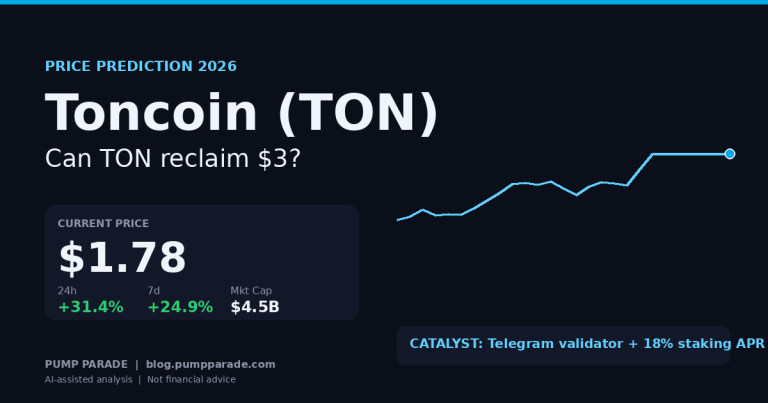
    Toncoin (TON) price prediction 2026 hero graphic, current price $1.78, +31% on Telegram validator catalyst

    Where Toncoin Stands Today

    Let’s start with the numbers. TON has been rebuilding since Q1, when the token bottomed near $1.10 after a brutal 2025. The last 30 days have been a slow grind followed by an explosive week, and the technical picture now looks constructive for the first time since the Catchain 2.0 upgrade landed in April 2026.

    Metric Value
    Price $1.78
    24h change +31.4%
    7d change +24.9%
    Market cap $4.53B
    Circulating supply 2.54B TON
    Total supply 5.05B TON
    Rank #22
    All-time high $8.23 (Jun 2024)
    % from ATH -78.4%
    Staking APR ~18.8%

    Two things stand out. The 50% circulating-to-total ratio means unlock pressure is real but not catastrophic versus newer L1s. And the -78% drawdown from ATH is deeper than SOL’s or ETH’s from their respective peaks, which makes TON a mean-reversion candidate as much as a growth story.

    Why is Toncoin rising right now?

    Three forces are compounding. The first is Telegram itself. In May 2026, Telegram staked 2.2 million TON to become the network’s largest validator, and Pavel Durov’s team has been quietly onboarding messenger features to on-chain rails. The most recent push involves TON Pay 2.0, an upgraded payment layer designed to bring native crypto checkout to Telegram’s 950 million monthly active users.

    The second is staking economics. When an asset offers 18.8% APR while T-bills yield 4%, yield-seeking capital rotates in. LDO, TIA, and ATOM have all seen 40%+ rallies triggered by APR arbitrage, and TON’s supply lockup ratio is now the highest since launch.

    The third is derivatives positioning. TON perpetual funding just flipped positive, and open interest is climbing on spot-led volume. When leverage leads, squeezes unwind. When spot leads and leverage follows, trends stick. This looks like the second setup.

    What is the bull case for TON in 2026?

    Telegram integration hits inflection

    Telegram is not a partner. It is effectively the sponsor. The company routes user-facing crypto features through TON, and every upgrade to TON Pay, Fragment (its NFT marketplace), and mini-app payments funnels volume back to validators. If even 5% of Telegram’s 950 million MAUs use TON, that is a user base larger than Ethereum’s daily active addresses. The closest parallel is TRON, which built a $30B+ market cap primarily on USDT flow. TON has a similar shot at capturing messenger-driven payment volume.

    Staking APR is a supply sink

    At 18.8% APR, TON pays more than any top-50 asset for held supply. Roughly 40% of circulating TON is already staked, and that ratio has climbed weekly since Catchain 2.0 dropped finality to 0.6 seconds. Locked supply plus rising demand equals price pressure. This is the same dynamic that carried NEAR, SUI, and TIA through 2024. Our NEAR Protocol price prediction breaks down the same validator-economics mechanic.

    Fee cuts are widening the moat

    TON cut fees six-fold in late April 2026, from $0.0023 to $0.0005 per transaction, undercutting Solana, Sui, and most L2 rollups. Cheap fees plus fast finality plus a captive user base is the recipe that made Solana the memecoin capital of 2024. TON is running the same playbook for payments.

    What are the biggest risks to TON?

    Emission dilution is real

    Only 50% of total supply is circulating. The rest unlocks through validator rewards and foundation vesting. Annualized inflation is roughly 0.6%, low versus newer L1s but it compounds against price. If demand does not outpace supply, TON flatlines even in a good tape. This is why Coinbase and Kraken published such conservative 2026 targets ($1.42 to $1.48).

    BTC correlation is a two-way street

    TON’s 90-day correlation with BTC sits at 0.72, enough to drag it down 40%+ in any BTC drawdown. With Bitcoin at $78,000 and struggling to reclaim $80K, any macro shock (Fed pivot, ETF outflows, geopolitics) drags TON with it. A retest of the $1.10 lows is in play if BTC breaks $70K.

    Regulatory overhang from Durov’s legal exposure

    Pavel Durov remains under judicial supervision in France after his 2024 arrest. Any escalation in that case, or any regulatory action against Telegram in the EU or US, hits TON directly. This is a tail risk that ETH and BTC do not carry.

    Toncoin Price Prediction 2026: Targets by Timeframe

    Toncoin (TON) price prediction 2026 targets table, bear $0.95, base $3.10, bull $5.00 by 12 months

    Below are our targets across three horizons. All are conditional, not guaranteed. Each range assumes BTC stays in a $70K to $110K band and no major regulatory shock lands on Telegram.

    30-day outlook

    Immediate resistance sits at $2.00, a psychological level that also aligns with the 200-day moving average. Above that, $2.60 is the next supply zone from the March 2026 breakdown. Base case is $2.05, bull tag $2.60 if momentum holds and BTC stays above $75K. Bear case is $1.45.

    6-month outlook

    By February 2027, TON Pay 2.0 should be rolled out to a meaningful subset of Telegram users, and the second wave of institutional validator delegation is expected. Base case $2.40, bull case $3.50, bear case $1.20. The bull case needs daily active addresses above 3M (currently 1.6M) and daily TON Pay transactions above 500,000.

    12-month outlook (end of 2026)

    The headline number: base case $3.10, bull case $5.00, bear case $0.95. The $5 bull case sits at the top of the analyst consensus range. Changelly’s Toncoin forecast caps at $3.91 and flags $5 as reachable only under strong Telegram-driven demand. Standard Chartered has not published a TON target, but their utility-L1 framework implies 2.5x TON’s current FDV if messenger volume materializes.

    Long-term (2027 to 2028)

    Two to three years out, the range widens. Base case $4.20, bull case $7.50, bear case $1.10. Reaching the June 2024 ATH of $8.23 requires sustained user growth and a full crypto bull market. Achievable, not the median.

    How does TON compare to Solana?

    Solana is the closest utility comparison. Both are non-EVM L1s, both prioritize speed and cheap transactions, and both have real user bases. Here is how they stack up on the metrics that matter.

    Metric Toncoin (TON) Solana (SOL)
    Price $1.78 $104.60
    Market cap $4.53B $60.8B
    Block time ~5 seconds ~0.4 seconds
    Finality 0.6 seconds (Catchain 2.0) ~12.8 seconds
    Tx cost ~$0.0005 ~$0.0007
    Staking APR ~18.8% ~7.2%
    Active addresses (24h) ~1.6M ~2.9M
    Distribution channel Telegram (950M MAU) Wallets, DEX aggregators

    TON wins on finality, staking yield, and distribution moat. Solana wins on market cap, ecosystem depth, and active users. The question is whether TON can compound faster from a smaller base. Smaller-cap L1s with clear catalysts historically outperform larger peers in risk-on windows. Our Solana price prediction for 2026 puts SOL’s upside near 2x from here, while TON’s base case implies 75% upside and the bull case implies 180%. Risk-adjusted, TON offers more asymmetry.

    What Would Change Our View

    Three scenario triggers would push us out of the base case.

    Bearish invalidation: A weekly close below $1.40 breaks the uptrend structure and puts $1.10 back on the table. If that happens on rising volume with negative funding, base case moves to $1.50 for year end.

    Bullish acceleration: A weekly close above $2.60 with sustained spot volume above $1.5B per day would confirm a full trend change. 12-month base case moves from $3.10 to $4.00, bull case extends to $6.50.

    Structural shift: Any public commitment from Telegram to route a specific percentage of Stars (its in-app currency) through TON on-chain justifies a re-rating to the $6 to $8 range within 6 months.

    Frequently Asked Questions

    Will Toncoin reach $5 in 2026?

    Reaching $5 in 2026 is possible but sits at the top of most analyst ranges. Our base case puts TON near $3.10 by year end. A $5 tag would require sustained Telegram user growth, TON Pay 2.0 volume in the eight figures daily, and BTC holding above $80,000 through Q4. Outcomes below $1 remain plausible if Telegram slows integration.

    Is TON a good investment right now?

    TON has one of the clearest utility stories in crypto thanks to Telegram, but it is highly correlated with BTC and carries emission risk from validator rewards. It suits investors comfortable with volatility who want exposure to a Web3 messenger thesis. Size positions accordingly and never risk more than you can lose.

    What is Toncoin’s all-time high?

    TON reached an all-time high of $8.23 on June 15, 2024, during the peak of the Notcoin and Telegram mini-app hype cycle. The current price of $1.78 is roughly 78% below that peak. Recovering the ATH would require a market cap north of $20 billion at current supply.

    Why is Toncoin pumping today?

    TON is up 31% in 24 hours and 25% on the week. The driver is a mix of renewed Telegram validator activity, staking APR near 18.8% (highest of the top 50), and a positive funding-rate flip on perpetuals. Open interest has climbed sharply, signaling leverage is being added, not closed.

    How high can TON go by 2030?

    Long-term forecasts vary widely. Conservative models from Coinbase and Kraken sit near $1.50 to $2. Cryptopolitan and Flitpay put 2030 in the $5 to $12 range. The realistic 2030 band, assuming Telegram monetizes even 5% of its 950 million users through TON, is $6 to $15.

    What is TON staking APR and how does it work?

    TON offers roughly 18.8% APR through delegated validator staking, the highest of the top 50 assets. Rewards come from block issuance plus transaction fees. Most users stake through pools such as Tonstakers or Ton Whales, which lower the 300,000 TON solo-validation minimum. Rewards compound every 18 hours.

    The Honest Take

    TON is doing what a healthy Layer 1 should at this stage of the cycle. Clear utility narrative (Telegram), real supply sink (18.8% APR), and price action that suggests the base is in. The 31% pump is not the story. The story is what caused it: staking demand, validator ramp, and derivatives repositioning firing at once.

    Still, this is crypto. TON’s -78% drawdown from ATH is a reminder it can move violently in both directions. Our previous Toncoin Telegram catalyst analysis flagged the setup in May, and this move fits that framework. Base case is $3.10 by year end, but size positions for the bear case first.

    The smart move is to watch $2.00 as the near-term pivot and $1.40 as the invalidation. For real-time data check CoinGecko’s TON page or the TON Foundation site for network metrics.

    Disclaimer: This article is for informational and educational purposes only and should not be construed as financial, investment, or trading advice. Cryptocurrency markets are highly volatile, and past performance does not guarantee future results. The price predictions and analyses presented here are based on AI models, technical indicators, and available data at the time of writing. They are not guarantees. Always conduct your own research (DYOR) and consult with a qualified financial advisor before making any investment decisions. Pump Parade and its authors do not assume liability for financial losses incurred based on information provided in this article.
    Aptos (APT) Price Prediction 2026: Can APT Reclaim $1?

    Aptos (APT) is trading at $0.534 right now, down roughly 7% in the last 24 hours and a brutal 97% off its January 2023 all-time high of $20.39. If you bought the Meta-alumni Move VM hype in late 2022, this chart has been a slow-motion education in what “well-designed tokenomics with a heavy unlock schedule” actually feels like.

    But something in the setup is changing. The Aptos price prediction 2026 conversation now hinges on one specific date: October 11, 2026, when the monthly APT unlock cliff drops by nearly 60%, according to Tokenomist. Combine that with a $50 million Aptos Foundation institutional push, live PYUSD volume, and Ondo Global Markets picking Aptos as its base chain, and the “APT is dead” narrative starts looking lazy.

    Here’s the full breakdown: current market context, the bull case, the bear case, three timeframe price targets, how Aptos stacks up against its Move-VM cousin Sui, and the concrete triggers that would flip our view.

    Key Takeaways

    • APT trades at $0.534, down 7% in 24h and 97% off its ATH of $20.39.
    • October 11, 2026 is the pivot: monthly token unlocks drop ~60% after the final large cliff, materially reducing chronic sell pressure.
    • Real catalysts on deck: PYUSD live on Aptos, Ondo Global Markets base chain integration, $50M institutional grant program, and the Shelby AI-storage testnet conclusion.
    • Base-case 2026 target: $0.85, with a bull case at $1.35 if unlock relief coincides with a broader alt rotation.
    • Bear case is real: a Fed-driven risk-off month or a fresh Move VM exploit could retest $0.38 before any unlock relief hits.
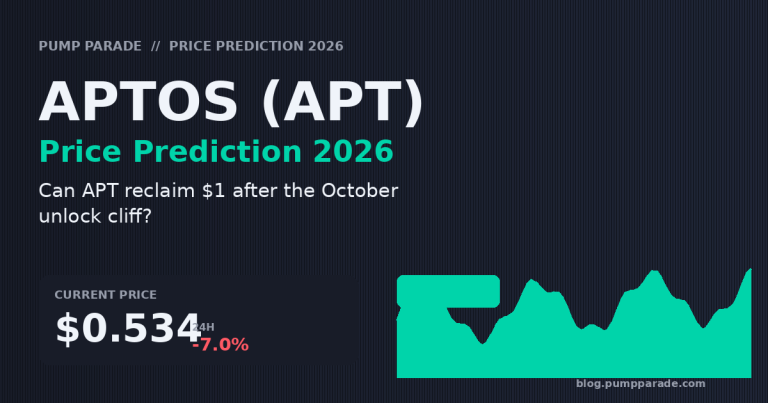
    Aptos (APT) price prediction 2026 hero graphic - current price $0.53, October unlock cliff catalyst ahead

    Where Aptos Stands Today

    Before the forecast, the receipts. Here is the live snapshot for APT as of publication, pulled from CoinGecko and cross-checked against Coinbase and Kraken spot data.

    Metric Value
    Price $0.534
    24h change -7.0%
    Market cap ~$460M
    24h volume ~$50M
    Circulating supply ~860M APT (40.3% of hard cap)
    Hard supply cap 2.1 billion APT
    All-time high $20.39 (Jan 26, 2023)
    % from ATH -97.4%

    The volume-to-market-cap ratio sits near 11%, which is healthy for an L1 of this size and suggests real trading interest rather than a shell of a chart. What is not healthy: the six-month grind lower, driven in part by predictable monthly supply expansion. That is the exact dynamic the October cliff is designed to break.

    Why is Aptos falling right now?

    Three pressures are stacked on APT at the same time. First, the broader altcoin tape is weak. Bitcoin dominance is climbing, which historically drains liquidity from mid-cap L1s first, and APT sits squarely in that bucket alongside Sui, Sei, and Near. Second, the monthly unlock schedule keeps adding roughly 11.31M APT to circulating supply on the 11th and 12th of every month, per the DeFiLlama unlock tracker. That is chronic supply overhang, and short-term traders front-run it.

    Third, sentiment is soft. Move-VM chains lived through a rough Q1 2026 when the ecosystem’s shared narrative faltered. Even our own Sui (SUI) price prediction from earlier this month flagged similar structural weight. When peers bleed, correlation trades punish everyone in the cohort.

    None of this is a thesis-breaker. It is a positioning story. Sellers are exhausted, but buyers need a catalyst to show up in size.

    The Bull Case for APT

    1. The October 11 unlock cliff

    This is the single biggest structural shift. According to Tokenomist and DeFiLlama, October 11, 2026 marks the final large monthly unlock in the original vesting schedule. After that, monthly emissions drop by approximately 60%. In plain terms: the chronic seller pressure that has capped every rally for eighteen months meaningfully weakens. Markets tend to price this in ahead of time, so a September rally on anticipation is the base case, not the tail scenario.

    2. Institutional distribution is quietly working

    PayPal’s PYUSD stablecoin went live on Aptos in mid-2024 and the deployment is now doing real transaction volume, not vanity metrics. Ondo Finance picked Aptos as a base chain for its Global Markets tokenized-security platform, giving APT direct exposure to the RWA narrative that our Ondo price prediction covered in depth. Franklin Templeton has expanded its on-chain money market fund footprint to Aptos as well. This is a tradFi-first distribution playbook that competitors did not run early enough.

    3. The $50 million Aptos Labs grant and the Shelby testnet

    In May 2026, Aptos Foundation and Aptos Labs committed $50 million to expand the stack for institutional trading and AI workloads, per official disclosures. The grant targets encrypted mempools (a real MEV defense), external trading firm onboarding, and the Shelby testnet focused on decentralized AI storage. If Shelby closes and moves to mainnet inside the 90-day window, it opens a second narrative for APT beyond “just another Layer 1.”

    The Bear Case for APT

    1. Structural supply is still enormous

    Even after the October cliff, only about 40% of the 2.1B hard cap is circulating. That means roughly 1.25B APT still lives in team, foundation, and community allocations. If prices rip, some of that supply finds ways to reach the market, whether through OTC deals, foundation grant recipients, or team member exits. Anyone modeling APT above $2 needs to explain what happens to that overhang under a bullish tape.

    2. Layer-1 fragmentation is brutal

    Aptos competes with Solana, Sui, Sei, Near, TON, and now a wave of app-specific rollups. Standard Chartered analysts flagged in a mid-2025 note that most non-top-five L1s will struggle to justify their fully diluted valuations by 2027. APT is not top five. It has to earn its shelf space every quarter, and TVL growth has been choppy.

    3. Macro tail risk

    If the Fed’s rate-cut path stalls, or the crypto market gets hit with an unexpected regulatory shock, mid-cap L1s are the first casualties. APT has beta greater than 1 against Bitcoin, meaning a 15% BTC drawdown could easily produce a 25-30% APT drop, right back to the $0.38 zone we tag as bear case.

    What are the Aptos price prediction 2026 targets by timeframe?

    Aptos (APT) price prediction 2026 targets table - bear $0.38, base $0.55, bull $0.72 for 30 days; long-term bull $3.20

    Next 30 days (through September 2026)

    Base case: $0.55, essentially chopping sideways ahead of the October catalyst. Bear case: $0.38, a full retest of the summer low if Bitcoin cracks $50K on a macro shock. Bull case: $0.72, an anticipation move if positioning gets aggressive into the unlock relief. The 30-day tape typically overreacts in the two weeks before major tokenomics events.

    6 months (through February 2027)

    Base case: $0.85. This assumes the October cliff plays out cleanly, Ondo Global Markets launches on Aptos as scheduled, and BTC holds above $60K. Bear case: $0.42, if unlock relief gets absorbed by a broad alt-market slump. Bull case: $1.35, which would require APT to reclaim the $1 psychological handle plus a full monthly close above the 200-day moving average.

    For context, Changelly’s model puts APT’s 2026 peak in a $0.55 to $0.63 range, and Coinbase’s conservative growth-model forecast lands at $0.61. Coincodex has a wider range that reaches $10 at the tail. Our base case sits above the conservative herd and well below the euphoric outliers, which is exactly where a data-driven forecast should live.

    Long-term (2027-2028)

    Base case: $1.20. Bear case: $0.30, the “L1 fatigue” scenario where Aptos becomes a top-40 chain by TVL and nothing more. Bull case: $3.20, which requires Aptos to become a genuine top-three settlement layer for tokenized RWAs and institutional stablecoin flow. That is not a moonshot, but it is a specific narrative bet on the RWA thesis playing out on Move-VM rails rather than EVM ones.

    Is Aptos better than Sui in 2026?

    The Sui comparison is unavoidable. Both chains were spun out of the Meta Diem project, both use Move, and both are competing for the same “Solana alternative” mindshare. Here is a side-by-side snapshot.

    Metric Aptos (APT) Sui (SUI)
    Consensus AptosBFT (leader-based) Mysticeti (DAG-based)
    Move VM flavor Aptos Move Sui Move (object model)
    TPS (realistic sustained) 4,000-6,000 6,000-9,000
    Institutional partnerships PayPal PYUSD, Ondo GM, Franklin Templeton Grayscale trust, Circle integration
    Consumer / gaming traction Moderate Higher (SuiPlay, native gaming)
    Circulating / max supply ~40% of 2.1B ~35% of 10B
    Big-catalyst window Oct 2026 unlock cliff CME futures listing

    The honest read: Sui has better raw performance and stronger consumer traction. Aptos has better institutional distribution and, as of October, a materially cleaner supply picture. If you are picking one, you are picking a story, not a chain. Institutions today, or consumers today.

    What Would Change Our View

    Three concrete triggers that would move us off the base case:

    1. The October unlock passes without a sustained rally. If APT is below $0.50 by mid-November 2026, the “supply relief drives price” thesis is broken. We flip bearish and cut our 6-month target to $0.45.
    2. A major PYUSD or Ondo migration off Aptos. The institutional distribution story is the single strongest bull leg. Losing either integration would kill the RWA-on-Aptos narrative.
    3. BTC sustained close above $85K with APT lagging the alt rotation. If mid-cap L1s ex-APT rally 40%+ and APT stalls, the market is telling us something specific about this chain’s competitive position. We would lower conviction and let price confirm.

    Frequently Asked Questions

    Will Aptos (APT) reach $1 in 2026?

    Reaching $1 in 2026 is our base-case ceiling, not our expected outcome. It would require the October unlock cliff to trigger meaningful buying pressure, plus a supportive Bitcoin tape holding above $60K. Under our 6-month base case, APT targets $0.85. Under the bull case, $1.35, which puts $1 firmly in play but not guaranteed.

    Is Aptos a good investment in 2026?

    APT is a higher-risk mid-cap L1 bet with a specific supply-side catalyst on October 11, 2026. It is not a set-and-forget holding. If you understand the tokenomics and are comfortable with 40-60% drawdown risk, a small allocation ahead of the unlock cliff is defensible. If you need stability or predictable growth, this is not it.

    What is the Aptos October 2026 unlock?

    October 11, 2026 marks the final large monthly APT unlock under the original vesting schedule. After that date, monthly emissions drop by roughly 60%, dramatically reducing the chronic supply overhang that has weighed on price since 2024. It is the single most important structural event on the APT calendar this year.

    Is Aptos better than Sui?

    Neither chain is objectively better. Aptos wins on institutional distribution: PayPal PYUSD, Ondo Global Markets, and Franklin Templeton all chose Aptos first. Sui wins on raw performance and consumer or gaming adoption. Pick based on which thesis you believe pays out faster. Institutional RWA rails favor APT; consumer apps and gaming favor SUI.

    What is the Aptos price prediction for 2030?

    Long-term forecasts vary widely. Coincodex and Cryptopolitan sit in a $3 to $8 range for 2030 under a moderately bullish scenario. Our own long-term bull case reaches $3.20, contingent on Aptos becoming a top-three settlement layer for tokenized assets. Under a bearish “L1 fatigue” scenario, $0.30 is the floor.

    What could push APT above $2 in 2027?

    Three conditions need to line up: the October 2026 unlock relief needs to catalyze a durable rally, Ondo Global Markets needs to hit critical mass on Aptos rails, and Bitcoin needs to sustain above $80K into 2027. If any one of those fails, $2 stays out of reach. If all three hit, $2 is the base case, not the ceiling.

    The Honest Take

    Aptos is one of the most misread charts in the top 100. Everyone sees the 97% drawdown and the endless monthly unlocks and writes it off. What they miss: the unlock schedule has an end date, the institutional distribution has quietly become real, and the Move-VM RWA thesis has one credible chain running it at scale, which is APT.

    Under our base case, APT ends 2026 in the $0.80 to $1.00 zone, not $2, not $10. Under our bull case, we see $1.35, contingent on the October cliff and a supportive macro tape. Under our bear case, $0.38 is realistic. That is a setup with defined asymmetry, and that is exactly the kind of setup that rewards patience over conviction.

    The setup is worth watching. Not chasing, watching. If APT breaks $0.72 with volume before October 11, that is your signal that the market has started to front-run the cliff. Until then, this is a story trade, not a momentum trade. For a broader view of how mid-cap L1s are pricing this cycle, our Solana price prediction covers the closest large-cap comp.

    Disclaimer: This article is for informational and educational purposes only and should not be construed as financial, investment, or trading advice. Cryptocurrency markets are highly volatile, and past performance does not guarantee future results. The price predictions and analyses presented here are based on AI models, technical indicators, and available data at the time of writing. They are not guarantees. Always conduct your own research (DYOR) and consult with a qualified financial advisor before making any investment decisions. Pump Parade and its authors do not assume liability for financial losses incurred based on information provided in this article.

    Dogecoin (DOGE) Price Prediction 2026: Can DOGE Hit $0.15?

    Dogecoin trades at $0.0862 as of August 28, 2026, down 2.7% on the day but up nearly 2% on the week. That flat tape hides what actually matters for the Dogecoin price prediction 2026 conversation: after a stretch of near-zero volume, the three US spot DOGE ETFs printed positive net inflows on August 20, 24, and 25. Small numbers, real signal.

    Whales agree. On-chain data show 890 million DOGE (about $62 million) scooped up by large addresses in the last two weeks, and weekly active addresses jumped 16%. The market briefly kissed $0.10 on August 21 during a White House pro-crypto policy push, its first three-month high.

    The question every buyer is now asking: can Dogecoin actually reclaim $0.15 in 2026, or is this another rally that dies at the resistance line? Below, we lay out the data, the bull case, the bear case, and target ranges by timeframe.

    Key Takeaways

    • Current price: $0.0862, market cap $12.86B, ranked #11 by market capitalization.
    • Fresh catalyst: Spot DOGE ETF inflows turned positive on August 20 after weeks of stagnation, hinting at returning institutional interest.
    • Whale activity: Large wallets have absorbed roughly 890M DOGE ($62M) in the last two weeks; weekly active addresses up 16%.
    • Base-case 2026 target: $0.15 by year-end if ETF flows compound and the altcoin market exits its slump.
    • Downside risk: $0.05-$0.06 if issuance dilution dominates and institutional demand stays flat.
    • ATH context: DOGE sits 88.5% below its May 2021 peak of $0.7528, so the $1 dream still requires a full cycle repeat.
    Dogecoin (DOGE) price prediction 2026 hero graphic, current price $0.0862, spot ETF inflows return catalyst

    Where Dogecoin Stands Today

    Before the forecast, the snapshot. All figures pulled from live market data on August 28, 2026.

    Metric Value
    Price (USD) $0.0862
    24-hour change -2.70%
    7-day change +1.96%
    Market cap $12.86 billion
    Market cap rank #11
    24-hour volume $600 million
    Circulating supply 148.3 billion DOGE
    All-time high $0.7528 (May 2021)
    Percent from ATH -88.5%

    The story in one line: an $12.86B asset trading at 11.5% of its cycle high, with volume finally starting to lift again. That is the setup a lot of long-term holders have been waiting for, and it is also the setup that has trapped many of them for the last two years.

    Why is Dogecoin showing signs of life right now?

    Three forces are pushing at the same time, which is rare for DOGE.

    First, the ETF wrappers finally exist. Grayscale, Bitwise, and 21Shares launched spot DOGE products between late 2025 and mid-2026, with 21Shares even switching its reference benchmark to the FTSE Dogecoin Index on August 27. That is plumbing work that only matters once flows arrive, and after months of dead-flat volume, flows are arriving.

    Second, on-chain activity is repricing. A 16% jump in weekly active addresses is not a stampede, but it is the first meaningful acceleration since Q1. Combined with the whale accumulation, the pattern looks less like distribution and more like the quiet part of a base being built.

    Third, the macro tape helps. Bitcoin above $79,000 gives altcoins room to breathe, and pro-crypto policy signals from the White House summit in late August spared the sector another regulatory scare. DOGE, as the highest-beta major, tends to rally hardest when policy risk fades.

    The Bull Case for DOGE

    The bull thesis is not “meme go up.” It rests on three concrete drivers, each of which is measurable.

    1. Compounding ETF demand

    Total spot DOGE ETF assets sit around $12.2M as of August 21, well below the late-2025 peak. That is actually the point. The base is low. If daily net inflows return to even $2-5M steadily, AUM doubles quickly and the market impact grows non-linearly because DOGE’s real free float is much smaller than its 148B circulating supply suggests. The SEC’s formal approval of the 21Shares Dogecoin ETF also opens the door to more issuers filing in Q4.

    2. Whale accumulation into a supply overhang

    Cohort tracking shows large addresses absorbed 890M DOGE in the last two weeks, and separate flows show whales positioning 680M DOGE for a trendline breakout. Whales do not always front-run rallies, but they rarely accumulate this aggressively during distributional tops. Combined with rising active addresses, it suggests real demand rather than pure recycling.

    3. Culture and payments optionality

    Dogecoin Core 1.14.9 rolled out in August with security patches and RPC optimizations aimed at payment processors, and X-based tipping infrastructure keeps DOGE culturally in the retail conversation. This is not a valuation model, but it is why DOGE keeps outperforming other legacy memecoins during risk-on windows. For comparison, see how FLOKI’s Valhalla catalyst plays out differently for a smaller-cap meme.

    The Bear Case for DOGE

    Every bull thesis has a mirror. Here is what would break the setup.

    1. Issuance dilution never stops

    DOGE mints roughly 5B new coins per year, a fixed 10,000 per block. At current prices that is about $430M of annual supply pressure. Unless demand grows faster, the price bleeds by construction. This is the single most under-discussed headwind, and it is why long stretches of sideways price action have historically ended lower, not higher.

    2. ETF inflows stall out again

    The August recovery in flows is fragile. If the next two weeks show a return to the zero-flow days that dominated August 5-13, the “institutional demand” narrative dies quickly. Retail alone has not been able to push DOGE above $0.10 for months.

    3. Altcoin rotation stays weak

    Bitcoin dominance remains elevated. Every altcoin, including DOGE, needs BTC dominance to roll over before it can outperform meaningfully. If BTC keeps taking market share and ETH stays capped, DOGE has no macro tailwind to ride, and $0.06 becomes the more likely test than $0.15.

    Dogecoin (DOGE) price prediction 2026 targets table, bear $0.055, base $0.150, bull $0.220

    Dogecoin Price Prediction 2026: Targets by Timeframe

    These are our internal scenario bands, not point forecasts. Each range assumes the corresponding demand and macro conditions materialize.

    30-day outlook (through late September 2026)

    Bear $0.070, base $0.095, bull $0.120. The near-term tape is dominated by whether ETF flows extend the August recovery. A breakout above $0.10 with holding volume opens $0.12 fast; failure to reclaim that level puts $0.07 back on the table. September is historically weak for crypto, which is why our base case does not stretch further.

    6-month outlook (through February 2027)

    Bear $0.062, base $0.115, bull $0.170. This band assumes at least one clean altcoin rotation window, a continued (if modest) ETF drip, and no fresh macro shock. The bull case requires ETF AUM to more than triple from current levels and BTC dominance to soften.

    Year-end 2026 outlook

    Bear $0.055, base $0.150, bull $0.220. The base case aligns roughly with the analyst consensus. Coinbase’s forecast model centers on a similar $0.13-$0.16 zone, and Changelly’s Dogecoin 2026 forecast puts the annual midpoint at $0.117. Our bull case at $0.22 requires the ETF flywheel to actually turn, similar to how newer memecoin infrastructure like Pump.fun pulled fresh capital into the sector.

    How Does Dogecoin Compare to Litecoin and Shiba Inu?

    DOGE sits in an odd category: too old to be a pure memecoin, too small to be Bitcoin. The two closest peers are Litecoin (historical fork cousin) and Shiba Inu (the memecoin that briefly threatened DOGE’s throne). Here is the side-by-side.

    Metric DOGE LTC SHIB
    Price $0.0862 $48.75 $0.0000053
    Market cap $12.86B $3.68B $3.11B
    Rank #11 #32 #36
    7-day change +1.96% -4.13% +0.52%
    % from ATH -88.5% -88.1% -94.0%
    Spot ETF live Yes (3 issuers) Yes (limited) No
    Supply model Inflationary, ~5B/yr Halving-based cap Deflationary burn

    DOGE’s edge is size and ETF access. Its weakness is the endless issuance schedule that LTC does not carry and SHIB partially offsets with burns. If you want a deeper comparison on the meme side, our Shiba Inu price prediction 2026 breaks down SHIB’s own catalyst path.

    What Would Change Our View?

    Three specific triggers would force us to revise the base case in either direction.

    Bullish revision trigger: If cumulative net inflows across the three spot DOGE ETFs exceed $50M inside any 30-day window, our year-end base moves from $0.15 to roughly $0.19, and the bull case extends toward $0.28. That level of flow signals the wrapper is finally attracting the mainstream advisor allocation that the ETFs were built for.

    Bearish revision trigger: If DOGE loses $0.075 on a weekly close with expanding volume, the base case slips to $0.09 and the bear case extends to $0.045. Structurally, $0.075 is the pivot that has caught every dip since June.

    Regime-change trigger: A confirmed Fed rate cut cycle plus BTC dominance rolling below 55% would flip DOGE from range trade to trending market. In that regime, our bull case becomes the base and the $0.30-$0.40 zone from 2024 comes back into scope.

    Frequently Asked Questions

    Can Dogecoin reach $0.15 in 2026?

    Yes, it is achievable but not guaranteed. Our base case puts DOGE at $0.15 by year-end 2026 if spot ETF flows compound at least modestly and BTC dominance eases. That requires roughly a 75% rally from today’s $0.086 level, which is within DOGE’s historical volatility range.

    Is Dogecoin a good investment in 2026?

    DOGE is a high-risk, high-beta position. It benefits from real infrastructure (three spot ETFs, exchange listings, payment integrations) but carries permanent dilution from its uncapped supply. It suits investors who want memecoin-style upside with slightly more institutional plumbing, not those seeking capital preservation.

    Will DOGE hit $1 in 2026?

    Almost certainly not. Reaching $1 would require a market cap of roughly $148B, larger than XRP at its recent peak. That would need a full memecoin cycle revival plus sustained ETF flows plus BTC above $150K, all at once. Possible in 2027-2028; extremely unlikely in 2026.

    What is driving Dogecoin’s price in August 2026?

    Three overlapping forces: returning spot ETF inflows after weeks of near-zero volume, whale accumulation of roughly 890M DOGE, and a 16% jump in weekly active addresses. Macro tailwinds from a firmer Bitcoin and softer regulatory tone add support.

    Are Dogecoin ETFs approved?

    Yes. As of August 2026, three US spot DOGE ETFs are live: products from Grayscale, Bitwise, and 21Shares. The SEC formally greenlit the 21Shares Dogecoin ETF in 2026, and 21Shares switched its reference benchmark to the FTSE Dogecoin Index on August 27, 2026.

    Is Dogecoin dead?

    No, but it is transitioning. Rank #11 with $12.86B market cap and $600M daily volume is a functional top-tier asset, not a dead project. The concern is not death but drift: without fresh demand, the fixed 5B annual issuance keeps chipping at the price. Recent ETF inflows push against that pressure for the first time in months.

    The Honest Take

    Dogecoin at $0.086 is neither cheap nor expensive on any traditional metric, because there is no traditional metric. What it is, right now, is a coiled spring with better plumbing than it has ever had and a set of small but genuine demand signals showing up for the first time this quarter.

    Our base case of $0.15 by year-end 2026 assumes the ETF flywheel keeps turning, whales keep accumulating, and Bitcoin does not implode. If those hold, DOGE performs. If any one breaks, the range trade continues, and $0.06 is the more likely destination than $0.20.

    The setup is worth watching. It is not yet a setup worth chasing. Wait for a weekly close above $0.10 with expanding volume before treating this as anything more than a base build.


    Disclaimer: This article is for informational and educational purposes only and should not be construed as financial, investment, or trading advice. Cryptocurrency markets are highly volatile, and past performance does not guarantee future results. The price predictions and analyses presented here are based on AI models, technical indicators, and available data at the time of writing. They are not guarantees. Always conduct your own research (DYOR) and consult with a qualified financial advisor before making any investment decisions. Pump Parade and its authors do not assume liability for financial losses incurred based on information provided in this article.

    GMGN vs Trojan: Best Solana Trading Bot 2026?

    0
    GMGN vs Trojan Solana trading bot comparison 2026

    Solana trading bots have quietly turned into the most competitive category in crypto tooling. Every week another terminal promises faster fills, cheaper fees, or smarter analytics, and for the traders who actually live in these apps the difference between a good bot and the wrong bot can be measured in real money.

    Two of the biggest names in that fight right now are GMGN and Trojan. They started from opposite ends of the market. GMGN grew up as a research and copy-trading brain with a web terminal and a slick token discovery flow. Trojan built its reputation as the Telegram sniper, obsessed with execution speed and non-custodial keys. In 2026 they are increasingly stepping on each other’s turf, and picking one over the other has real consequences for your PnL, your workflow, and your comfort with counterparty risk.

    This review compares the two on the things that actually matter: fees, execution, copy trading, safety, mobile experience, and value for high-volume traders. If you only have a minute, jump to the verdict at the bottom.

    Quick verdict (TL;DR)

    Winner for smart-money copy trading and discovery: GMGN. Its wallet-tracking database and AI-flavored smart-money views remain the best in the category.

    Winner for pure speed and Telegram-native execution: Trojan. BOLT execution and a mature Telegram flow make it the tool of choice when you are trying to be first through a launch.

    Winner on fees: Trojan, narrowly. Its published 0.9% base fee with a 10% referral discount lands under GMGN’s 1% on comparable trades.

    Winner overall: Depends on your style. Read the sections below and match them to your workflow.

    What is GMGN?

    GMGN Solana trading terminal illustration

    GMGN, which the community reads as “good morning good night,” is a multi-chain token scanner and trading terminal best known for its wallet tracking and copy-trading tools. It runs a web app at gmgn.ai and a companion Telegram bot for execution, and it has become one of the go-to research surfaces for Solana memecoin traders.

    Where GMGN shines is on the discovery side. The token pages surface early buyers, holder distribution, dev history, and smart-money flows in a way that condenses several other tools into one. If you like to trade behind wallets that have a real edge, GMGN is where you find them and set up follows.

    According to industry trackers, GMGN has processed roughly $3 billion in lifetime volume across around 100 million trades, with a lifetime user base of roughly 1 million wallets. That puts it near the top of the discovery-first bots, though it is smaller in raw volume than the execution-first Telegram-only names.

    What is Trojan?

    Trojan Telegram trading bot illustration

    Trojan is one of the most established Solana Telegram trading bots of this cycle. It started life as a chat-based terminal for buying, selling, sniping and copy trading SPL tokens without ever leaving Telegram, and it has since added a web dashboard for users who want visual analytics alongside chat execution.

    Under the hood Trojan is built for speed. The team has publicly leaned into an execution stack it calls BOLT, promising sub-two-second fills on typical trades. That matters when you are racing bots on a pump.fun migration or a fresh token graduation, and it is a big part of why the bot has processed roughly $25 billion in lifetime volume despite carrying a smaller monthly active user footprint than some competitors.

    Trojan is non-custodial: private keys sit inside the bot and can be exported, so you are trusting the bot for uptime and integrity, not custody of your assets long term.

    Fees and pricing

    Fees are where these two bots most obviously differ.

    GMGN charges a flat 1% platform fee on both buys and sells, on top of Solana network gas and any priority fee or Jito tip you enable. Its own docs and third-party trackers confirm this rate, and there is no published subscription tier or standard cashback program. If you activate Anti-MEV routing, GMGN requires a minimum priority fee of about 0.002 SOL for the protection to kick in.

    Trojan charges a 0.9% base fee per trade, and users who onboard through a referral link get a permanent 10% fee discount, taking the effective fee down to about 0.81%. Trojan layers on top of that its Arena cashback program, which can rebate a meaningful portion of fees to active traders based on volume and other criteria.

    For a $10,000 round trip (buy plus sell), that is roughly $200 in fees on GMGN versus about $162 to $180 on Trojan depending on whether you use a referral and how the cashback lands. Over the course of a busy trading month that gap adds up, especially for scalpers.

    Neither bot has a subscription paywall. Both charge only per trade, so your monthly cost is a direct function of your volume.

    Execution speed and reliability

    On a fresh listing the fastest bot usually gets the best fill, and this is Trojan’s home turf. The BOLT execution path is engineered to compress the time between a Telegram tap and an on-chain buy into under two seconds on typical Solana conditions. In practice that puts Trojan in the top tier of Telegram bots for sniping.

    GMGN is competitive but positioned differently. Its web terminal is where most users live, which introduces browser latency and one more render step compared with a Telegram command. That is fine for typical positional trading and copy trading, but for the fastest launches Trojan tends to edge it, especially on mobile.

    Both bots support advanced execution controls: custom slippage, adjustable priority fees, Jito tips for bundled inclusion, and MEV protection modes that route through private relays. Trojan’s MEV protection is on by default in most setups. GMGN treats it as an opt-in with the priority fee requirement noted above.

    Copy trading and smart-money tools

    This is where GMGN pulls ahead. Its wallet database, smart-money tags, and one-click copy setup are the reason many traders keep the tab open even when they execute elsewhere. You can filter wallets by realized PnL, win rate, average hold time, and chain, then subscribe with fine-grained rules for max buy size, slippage, and stop conditions.

    Trojan has a solid copy-trading feature as well, and for chat-native users the on-Telegram alerts are convenient. But the underlying analytics catalog is narrower. If you rely on ranked wallet leaderboards, deep filters and public wallet tagging, GMGN is a level above.

    Verdict on this axis: GMGN wins for research-driven traders who follow proven wallets, Trojan is enough for casual copiers who mostly ride a small stable of favorites.

    Chains supported

    GMGN is multi-chain. Beyond Solana it covers major EVM chains and other high-throughput networks that host active memecoin activity. If you want to hop between ecosystems on a single account, this is a real advantage.

    Trojan is Solana-focused. There is bridging convenience in the app, but the entire product is optimized for the Solana meta. That is a deliberate choice, not a limitation, but if your day involves EVM plays as often as Solana, you will end up running Trojan alongside another tool.

    Security and trust

    Both bots are non-custodial in the sense that private keys sit inside the bot and can be exported. That is different from a hardware wallet or a browser extension wallet you fully control, and it is worth being explicit about the tradeoff: you are trusting the bot operator for uptime, key handling and code integrity in exchange for speed and convenience.

    Neither bot publishes third-party security audits with the depth of a top-tier DeFi protocol. Both have long operating histories, sizable user bases, and no publicly documented catastrophic hacks at the time of writing.

    Practical safety tips that apply to both bots: fund a dedicated hot wallet, keep only working capital there, sweep profits back to cold storage on a schedule, and export your bot key to a secure password manager as a backup.

    User experience

    Trojan’s Telegram-first design is the fastest way to trade with your thumbs. Commands are terse, buttons are large, and the position pane surfaces the essentials without noise. The web dashboard is a decent second surface, though most users treat it as an analytics companion rather than the primary interface.

    GMGN’s web terminal is denser and more information-rich. Token pages are packed with holder analytics, dev history, top traders, and social signal. That density is a feature for researchers and can feel overwhelming for new users. On mobile, Trojan’s Telegram interface is dramatically more usable than a full web dashboard, which is the single biggest UX differentiator between the two.

    Community reputation

    Both products have engaged trader communities on Twitter and in Telegram groups. Trojan has cultivated a reputation for reliability and fair rewards through its Arena program, which has generated meaningful goodwill among high-volume users.

    GMGN has drawn heavier scrutiny for copy-trading latency in past periods, with some public complaints on independent review sites. Whether that matters depends on your strategy: for slow-follow copy trading of long-hold wallets, occasional latency is a nuisance rather than a killer. For scalping tightly around a lead wallet, it can be fatal.

    Comparison table

    GMGN vs Trojan comparison table 2026

    The table above summarizes the head-to-head on the axes most traders care about. Two things worth calling out that a table cannot: Trojan’s speed advantage is most obvious on mobile, and GMGN’s discovery advantage compounds over time as you build watchlists.

    Pros and cons

    GMGN pros

    Best-in-class smart-money and wallet-tracking analytics, dense and information-rich token pages, multi-chain support out of the box, no subscription, mature copy-trading configuration, and a web experience that doubles as a research tool even when you execute elsewhere.

    GMGN cons

    1% fee is at the higher end of the category, no cashback or rebate program, web-first UX is less comfortable on mobile, copy-trading latency has been criticized in public reviews, and the interface density has a learning curve for new users.

    Trojan pros

    Sub-two-second execution via BOLT, 0.9% base fee that drops to about 0.81% with a referral, mature Arena cashback program, non-custodial with key export, MEV protection on by default, Telegram-native UX that is fast on mobile, and a very large lifetime volume history.

    Trojan cons

    Solana-focused, so multi-chain traders will need a second tool, analytics catalog is thinner than GMGN’s, and the Telegram-first design will feel unfamiliar to traders used to full web terminals.

    Verdict: which one should you use?

    The honest answer is that many active Solana traders end up running both. GMGN handles the research and copy configuration, Trojan handles the mobile execution and the fast snipes. If you have to pick just one, use this framework:

    Pick GMGN if your edge is research, you follow multiple wallets across chains, you spend most of your session on a desktop, and analytics depth matters more than saving 20 bps on fees.

    Pick Trojan if your edge is speed, you trade from your phone, you play a lot of launches and migrations, and you would rather have Telegram-native execution and a cashback program than a fuller discovery surface.

    Both are legitimate, both are widely used, and both have real tradeoffs. There is no wrong choice here as long as your workflow matches the tool. If you want a broader look at the trading bot landscape before deciding, our Maestro Bot review and our Photon review cover two other strong contenders in the same category.

    FAQ

    Is GMGN or Trojan safer?

    Both are non-custodial bots with long operating histories and no publicly documented catastrophic hacks at the time of writing. Neither publishes deep third-party audits. Practical safety is roughly equivalent, and depends more on your key hygiene than the bot you choose.

    Which is cheaper?

    Trojan, narrowly. Its 0.9% base fee with a 10% referral discount lands at about 0.81%, versus GMGN’s flat 1%. Add Trojan’s Arena cashback and the gap widens for active traders. Both charge network gas and priority fees on top.

    Can I use both at the same time?

    Yes, and many traders do. A common pattern is to use GMGN for discovery and copy configuration on a desktop, and Trojan for fast Telegram execution on mobile.

    Do these bots support multi-chain trading?

    GMGN is multi-chain and supports major EVM chains as well as Solana. Trojan is Solana-focused. If multi-chain access is a hard requirement, GMGN is the more natural fit.

    How do fees compare with running a wallet-only setup?

    A wallet-plus-Jupiter workflow avoids the 0.9% to 1% platform fee but gives up sniping speed, copy trading, and MEV routing conveniences. For high-volume traders who use these features constantly, the fee usually pays for itself. For occasional traders it may not.

    Where can I check current stats?

    Check CoinGecko for token-side data, DeFiLlama for DEX and protocol volumes, and DappRadar for dApp-level usage. Bot-specific stats are best sourced from each project’s official docs and community dashboards.

    Disclosure: Nothing in this article is financial advice. Trading bots carry smart-contract, custody, and operational risks. Do your own due diligence before funding a bot wallet.

    Sui (SUI) Price Prediction 2026: Can SUI Reclaim $2?

    SUI is quietly stitching itself back together. Sui (SUI) trades at $0.77 at the time of writing, up 2.6% in 24 hours, 7.1% on the week, and 13.2% over the last 30 days. The token is still 85.6% below its January 2025 all-time high of $5.35, but the tape has stopped bleeding. Any serious Sui (SUI) price prediction 2026 has to reconcile two things: real ecosystem traction and a supply schedule that keeps feeding the market.

    The ecosystem side is real. DeepBook, Sui's central limit order book DEX, holds close to $500 million in TVL. Walrus, Sui's decentralized storage layer, just landed a Grayscale trust alongside DeepBook, an institutional signal that even Solana took years to earn. Meanwhile the Sui payments stack notched a 6 million TPS milestone in July.

    This article walks through where SUI sits today, why the price is moving, the bull case, the bear case, timeframe-based targets, how SUI stacks up against Aptos, and the specific triggers that would change our view.

    Key Takeaways

    • SUI trades near $0.77, up 13.2% on the month but down 77% year-over-year. The recovery is early, not confirmed.
    • Grayscale filed separate trusts for DeepBook and Walrus, both native Sui protocols. That is institutional validation few Layer 1s reach.
    • Sui DeFi TVL surged to $1.78 billion in early 2025. It has since consolidated but is showing signs of rebuilding.
    • Our base case for 2026 sits at $1.60 to $2.20. The bull case reaches $3.50 to $5.00 if DeepBook institutional flow materializes.
    • The bear case is $0.55 to $0.70 driven by ongoing token unlocks and Layer 1 rotation into Solana or Ethereum.
    Sui (SUI) price prediction 2026 hero graphic, current price $0.77, DeepBook and Walrus catalyst

    Where Does Sui (SUI) Stand Today?

    Before we get to targets, look at what the tape actually shows. This is the current snapshot from CoinGecko at the time of writing.

    Metric Value
    Price (USD) $0.77
    24h change +2.6%
    7d change +7.1%
    30d change +13.2%
    1y change -77.5%
    Market Cap $3.15B
    24h Volume $489M
    Market Cap Rank #32
    Circulating Supply 4.07B (40.7% of max)
    All-Time High $5.35 (Jan 2025)
    % From ATH -85.6%

    Two things jump out. First, 24-hour volume of $489 million on a $3.15 billion market cap is a 15.5% turnover ratio, higher than most rank 30 assets. Someone is trading this. Second, only 40.7% of the max 10 billion supply is circulating, which means unlocks are the single biggest structural bear factor for the next 24 months.

    Why Is Sui Rising Right Now?

    Three things pushed SUI off the mat.

    Grayscale filed for separate investment trusts for DeepBook and Walrus in the last quarter, treating them as standalone investment vehicles rather than lumping them into a broad Sui product. That kind of institutional carve-out signals that TradFi is starting to read the Sui ecosystem the way it reads Ethereum: not just an L1, but a stack of applications worth owning on their own.

    Second, DeepBook v3 pushed its TVL toward $500 million and doubled monthly trading volume. A CLOB DEX with real depth is what institutional desks actually want to route into. Third, the Sui payments layer benchmarked at 6 million TPS in July, a headline that matters more for narrative than for on-chain reality but still moved retail sentiment.

    In plain terms, the market is starting to price Sui as an infrastructure bet rather than a failed Solana clone. That is a different investment thesis.

    The Bull Case: What Could Push SUI Back to $3 or Higher

    DeepBook becomes an institutional venue

    DeepBook already offers a central limit order book with sub-second finality. If a handful of high-frequency market makers route serious flow through it in Q4 2026, TVL crosses $1 billion and the SUI token captures gas and staking upside directly. Historically, Layer 1s that host a top-five DEX by volume trade at a 2x to 4x premium to peers.

    Walrus becomes the default AI data layer

    Walrus is a decentralized storage protocol with cryptographic availability proofs. If the AI-agents narrative keeps growing, verifiable data storage is exactly the missing primitive. Grayscale filing a Walrus trust says institutions are already scoping the thesis. If Walrus captures even 5% of what Filecoin does today, SUI gets a durable non-DeFi demand driver.

    Consumer apps and gaming actually ship

    Sui has bet on Move-based consumer apps: gaming, social, real-world assets. Most L1s that promised consumer never delivered. If two or three million-user apps ship on Sui in 2026, that generates ambient token demand that no unlock schedule can offset. Watch our Hyperliquid write-up for the closest analog of a specialized L1 that broke out via product-market fit.

    The Bear Case: What Could Send SUI Back Below $0.60

    Token unlocks keep suppressing spot

    Only 40.7% of SUI is circulating. The unlock schedule releases meaningful supply monthly through 2028. Even in a healthy market, that steady dilution acts like a persistent headwind. If the demand side does not scale faster than the unlock rate, price mean-reverts toward the marginal seller.

    Solana or Ethereum steal the L1 narrative

    Sui competes with Solana for the high-throughput consumer L1 slot, and with Ethereum L2s for the DeFi slot. Both incumbents keep executing. A renewed Solana consumer app cycle or a Base-driven onchain economy would starve Sui of the mindshare it needs.

    Move ecosystem stays niche

    Move is a fundamentally strong language, but developer counts on Sui and Aptos combined are still a fraction of Solidity or Rust. If the developer flywheel does not accelerate, all the technical advantages of Sui remain theoretical. See our NEAR analysis for a similar setup where great tech has struggled to convert to token flow.

    Sui (SUI) Price Prediction 2026: Targets by Timeframe

    Sui (SUI) price prediction 2026 targets table, bear $0.60, base $1.80, bull $3.50

    Our hybrid model blends technical analysis, on-chain TVL trends, and L1 sector correlations. Here is how the targets shake out by horizon.

    Timeframe Bear Base Bull
    30 days $0.62 $0.85 $1.05
    6 months $0.58 $1.30 $2.20
    End of 2026 $0.60 $1.80 $3.50
    2027-2028 $0.90 $3.20 $5.50

    Short-term (30 days)

    SUI just broke above the $0.75 level for the first time in three weeks. RSI sits at 62 on the daily, room to run before overbought. Expect a test of $0.85 into September if BTC holds above $78K. Losing $0.72 support flips the picture back to $0.62.

    Medium-term (6 months)

    By early 2027, the DeepBook institutional flow thesis should be measurable. If DeepBook TVL crosses $700 million, $1.30 is the base and $2.20 is in play. Changelly's bullish scenario puts SUI in the $5-$9 range, which we consider aggressive given the unlock schedule.

    Long-term (2027-2028)

    The long-term picture depends on whether Move ecosystems reach a critical mass of developers. Our base case of $3.20 assumes moderate ecosystem growth and a healthy broader market. The bull case of $5.50 requires Sui to become a top-three L1 by application volume, still below its January 2025 ATH.

    How Does Sui Compare to Aptos in 2026?

    Aptos is the closest peer: another Move-based L1 spun out of Meta's Diem team. Here is a side-by-side snapshot.

    Metric Sui (SUI) Aptos (APT)
    Price $0.77 $3.85
    Market Cap $3.15B $2.60B
    Rank #32 #52
    Language Move (object-centric) Move (account-centric)
    Native DEX DeepBook (~$500M TVL) Thala, LiquidSwap
    Storage Layer Walrus (native) None (external)
    Institutional Trusts Grayscale (SUI, DeepBook, Walrus) Grayscale APT trust
    Consensus Mysticeti AptosBFT

    Sui is ahead on the application layer, especially with Walrus and DeepBook as independent Grayscale-tracked assets. Aptos has cleaner tokenomics with a lower percentage of tokens still to unlock. The direction of travel favors Sui if the app-layer thesis plays out.

    What Would Change Our View on SUI?

    Three specific triggers would move us from base to bull, or base to bear, quickly.

    Bullish trigger: DeepBook TVL crosses $1 billion and monthly volume tops $10 billion. That confirms the institutional venue thesis and puts $3 in play by mid-2027.

    Bearish trigger: Sui DeFi TVL falls below $800 million for two consecutive months while unlocks continue. That signals demand is not scaling with supply and forces a reset to the $0.55 to $0.65 range.

    Neutral trigger to watch: Walrus adoption metrics. If Walrus onboards more than 200 dApps by end of 2026, the storage thesis works. Below 50, it stays theoretical.

    Frequently Asked Questions

    Will Sui (SUI) reach $2 in 2026?

    Our base case for end of 2026 is $1.80, with a bull case at $3.50. SUI reaching $2 in 2026 is realistic if DeepBook and Walrus keep gaining traction and the broader Layer 1 sector recovers. It becomes a stretch if token unlocks outpace ecosystem demand or if Solana keeps dominating the consumer L1 narrative.

    Is Sui a good investment in 2026?

    SUI is a high-conviction Layer 1 bet with real ecosystem catalysts and Grayscale institutional interest. It is also facing a heavy unlock schedule that will pressure spot price for the next two years. Sizing matters. Treat SUI as a speculative L1 allocation, not a core holding.

    What is the difference between Sui and Aptos?

    Both use the Move programming language and both spun out of Meta's Diem project. Sui uses an object-centric data model and Mysticeti consensus, and has invested heavily in native applications like DeepBook and Walrus. Aptos uses an account-centric model and AptosBFT, with a leaner but less differentiated ecosystem.

    Why has the SUI price dropped 77% in the last year?

    Three reasons combined: the token peaked in January 2025 during a broad L1 rotation, monthly unlocks kept releasing new supply, and the wider DeFi TVL contracted 37% year-to-date. Recovery requires either a smaller supply overhang or a much stronger demand catalyst.

    What is DeepBook on Sui?

    DeepBook is a central limit order book DEX built natively on Sui by Mysten Labs. It offers institutional-style order matching with sub-second finality, currently holds close to $500 million in TVL, and is one of two Sui protocols with a dedicated Grayscale investment trust.

    What is the Sui price prediction for 2027?

    Our base case for 2027 is $3.20, with a bull case at $5.50 and a bear case at $0.90. The 2027 outlook depends on whether the Move ecosystem reaches escape velocity, whether DeepBook wins institutional flow, and whether the token unlock schedule is absorbed by real demand.

    The Honest Take

    Sui in August 2026 is a real Layer 1 with real products, real institutional attention, and a real token supply problem. Two of those three factors are bullish. The third one is a math problem, and math tends to win over multi-quarter windows.

    The bull case is that DeepBook becomes an institutional DEX, Walrus becomes an AI data primitive, and Move gaming ships. The bear case is that unlocks keep the price capped and Solana keeps eating the consumer L1 mindshare.

    The risk-reward at $0.77 favors patient accumulation on any dip into the $0.62 to $0.68 zone, with a 6-month base case near $1.30 and a 2026 exit target of $1.80. That is not a moonshot. It is a repricing of an asset that finally has infrastructure worth owning. If DeepBook TVL doubles, revise upward. If unlocks compress spot again, revise downward.

    Watch the DeepBook TVL number weekly. Everything else is noise. For a broader read on how L1 majors are trading this cycle, our NEAR Protocol analysis covers a very different Layer 1 value-accrual model that is worth comparing.

    Disclaimer

    Disclaimer: This article is for informational and educational purposes only and should not be construed as financial, investment, or trading advice. Cryptocurrency markets are highly volatile, and past performance does not guarantee future results. The price predictions and analyses presented here are based on AI models, technical indicators, and available data at the time of writing, they are not guarantees. Always conduct your own research (DYOR) and consult with a qualified financial advisor before making any investment decisions. Pump Parade and its authors do not assume liability for financial losses incurred based on information provided in this article.
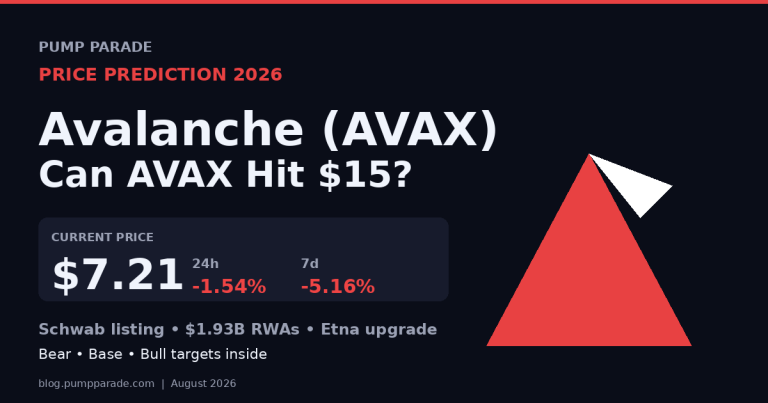
    Chainlink (LINK) Price Prediction 2026: Can LINK Hit $25?

    0

    Chainlink price prediction 2026 conversations look very different than they did six months ago. LINK trades at $11.47 today, down 0.8% on the day but up a striking 55.9% over the past 60 days and 17.2% this week. The token that spent most of 2024 and 2025 disappointing holders is suddenly one of the strongest large caps in the market, even as it sits 78% below its May 2021 all-time high of $52.70.

    The reason is not just price action. Chainlink secured direct integration wins with DTCC, SWIFT, and 24 of the world’s largest financial institutions over the last twelve months. Its Cross-Chain Interoperability Protocol (CCIP) now supports 60+ blockchains and secures $33.6 billion in cross-chain value, with 2025 transfer volumes up 1,972% year over year.

    This piece walks through where LINK sits today, why the price is moving, the bull and bear cases into 2026, target prices by timeframe, how Chainlink stacks up against Pyth Network, and the specific triggers that would change our view.

    Key Takeaways

    • Current price: $11.47, market cap $8.57B, rank 16.
    • Momentum: +55.9% over 60 days, driven by SWIFT and DTCC integration news.
    • Base case for 2026: $18 by mid-year if CCIP volumes keep compounding.
    • Bull case: $25 to $30 if DTCC Collateral AppChain launches on schedule and BTC holds above $80K.
    • Bear case: $9 to $11 range if institutional pilots stall or oracle competition compresses fees.
    • Biggest single catalyst: DTCC Collateral AppChain, targeted for Q4 2026.
    Chainlink (LINK) price prediction 2026 hero graphic - current price $11.47, DTCC and SWIFT catalysts, path to $25

    Where Chainlink Stands Today

    Before we forecast anything, here is the honest scoreboard. All figures pulled fresh from CoinGecko at the time of writing.

    Metric Value
    Price $11.47
    24-hour change -0.81%
    7-day change +17.20%
    30-day change +30.46%
    60-day change +55.86%
    Market cap $8.57B
    24-hour volume $377M
    Circulating supply 748.1M / 1B max
    All-time high $52.70 (May 2021)
    Distance from ATH -78.24%

    The number that matters most: +55.86% in 60 days while broader crypto has been mixed. This is not a rising tide lifting all boats. LINK is outperforming its peer group, and that usually signals a story the market is repricing.

    Why is Chainlink rising right now?

    Two forces are converging. First, institutional integration finally moved from proof-of-concept to production. On May 12, 2026, DTCC confirmed it will adopt the Chainlink Runtime Environment (CRE) for its tokenized Collateral AppChain. That platform handles pricing, valuation, margining, collateral optimization, and settlement for a chunk of the $867 trillion global financial system. Launch is targeted for Q4 2026.

    Second, SWIFT’s partnership with Chainlink now lets 11,000 banks connect to public and private blockchains through their existing SWIFT terminals and ISO 20022 messaging. When your bank’s back office already speaks the language, blockchain becomes a plumbing decision, not a strategy debate.

    Layer in a broader tokenization narrative (BlackRock’s BUIDL, Ondo’s tokenized treasuries, and the tokenized real-world assets sector crossing $30 billion) and you have the setup for a token that gets used every time an oracle price or cross-chain message needs to be verified.

    The Bull Case for LINK in 2026

    Catalyst 1: DTCC Collateral AppChain goes live

    If DTCC’s Q4 2026 launch ships on time, Chainlink becomes the settlement rail for institutional collateral movement. The Depository Trust and Clearing Corporation processes over $2 quadrillion in transactions annually. Even a rounding-error fraction of that flow routing through CCIP would meaningfully increase LINK’s fee capture and, more importantly, its narrative as the default oracle for tokenized finance.

    Catalyst 2: CCIP volume flywheel

    CCIP moved $7.77 billion in cross-chain volume in 2025, up 1,972% year over year. If 2026 growth even halves to a 900% pace, CCIP handles $70 billion plus in flows. Every transaction pays a small LINK fee, and the token is used as staking collateral for oracle nodes securing the network. Higher usage means higher staked LINK, which means less circulating supply.

    Catalyst 3: Payment Abstraction and fee-token flexibility

    Chainlink’s Payment Abstraction lets protocols pay in any accepted token, with the fee auto-swapped into LINK on the back end. This removes the friction that historically held back oracle fee capture. As integrations grow, so does programmatic LINK buy pressure. Standard Chartered and Bernstein analysts have both flagged this as a structural shift in the token’s demand profile.

    The Bear Case for LINK in 2026

    Risk 1: Institutional pilots stay pilots

    The single biggest risk is timing. Every enterprise blockchain story of the last decade has been delayed at least once. If DTCC’s Q4 2026 launch slips into 2027 or gets scaled back, the narrative that is currently pricing in future revenue evaporates fast.

    Risk 2: Oracle competition

    Chainlink still owns the enterprise moat, but on speed and DeFi-native use cases the competition is real. Pyth Network dominates high-frequency price feeds on Solana. API3 pushes a first-party oracle model. Band Protocol has cross-chain traction. If a live protocol failure or a marquee client defection hits headlines, LINK could give back a chunk of the 60-day rally in a session.

    Risk 3: Macro and BTC beta

    Bitcoin trades at $78,732 today, down 0.66% on the day. Every large-cap altcoin has a beta to BTC that goes higher during risk-off moves. A sustained break below $70K would drag LINK toward the $9 to $11 zone regardless of how good the fundamentals look. Correlation still eats alpha in bear tape.

    What is the Chainlink price prediction for 2026 by timeframe?

    Chainlink (LINK) price prediction 2026 targets table - bear $11, base $18, bull $25 across 6 months

    Here is how we model the ranges. These are scenario paths, not promises.

    Next 30 days

    Momentum favors a push toward $13 on continuation of the current trend, but the token is short-term overbought. Bear scenario: profit-taking pulls LINK back to the $9.50 support that held through July. Base case: consolidation between $12 and $14. Bull case: fresh institutional headline sparks a break to $16.

    Six months out (Q1 2027)

    This is where the DTCC and SWIFT catalysts land. Bear case: launches slip and LINK ranges $11 to $13. Base case: gradual adoption and steady CCIP growth take LINK to $18. Bull case: DTCC launches on time, tokenization TVL doubles, and LINK reclaims $25. That $25 level lines up with what CoinShares and Grayscale Research have both flagged as a reasonable base target for the year.

    Twelve to twenty-four months

    Longer horizons widen the cone. Bear case: oracle market fragments and LINK stalls near $14. Base case: $28, reflecting steady growth in CCIP fees, staking capture, and modest multiple expansion. Bull case: $45, requiring BTC in six figures, tokenization TVL past $100 billion, and Chainlink cementing the default-oracle position. Michael van de Poppe recently modeled a $25 to $30 range for 2026 alone, so a two-year $45 print is aggressive but not fantasy.

    How does Chainlink compare to Pyth Network?

    Pyth is the most direct competitor investors compare LINK to. Different design, different market fit, different tokenomics.

    Metric Chainlink (LINK) Pyth (PYTH)
    Market cap $8.57B ~$0.6B
    Chains supported 60+ 75+
    Data model Push, aggregated Pull, first-party
    Latency ~1 min updates Sub-second
    Cross-chain product CCIP (production) Wormhole-based
    Institutional partners SWIFT, DTCC, UBS Cboe, Jane Street
    Total value secured $33.6B (CCIP) ~$8B
    Best fit Enterprise, RWA, TradFi Perps, high-frequency DeFi

    Different weapons for different fights. Pyth wins on speed and DeFi-native perps. Chainlink wins on institutional distribution and enterprise integrations that have taken years to build. For 2026, the institutional side of the trade has the bigger dollars behind it.

    What Would Change Our View

    1. DTCC delay: If DTCC pushes the Collateral AppChain launch past March 2027, cut the base case to $14 to $16 and treat the bull case as invalidated until a new timeline lands.
    2. CCIP security incident: A verified exploit or extended downtime on CCIP would trigger a rerating. Enterprise partners tolerate technical debt in private, not in headlines.
    3. Ethereum reversal: If ETH breaks decisively above $3,500 and DeFi TVL follows, LINK’s oracle-fee thesis strengthens meaningfully. Below $2,000 ETH, DeFi contraction hurts LINK’s core revenue base.

    Frequently Asked Questions

    Will Chainlink (LINK) reach $25 in 2026?

    $25 is achievable and sits in the base-to-bull range that CoinShares, Grayscale, and Standard Chartered analysts have modeled. It requires two things: DTCC Collateral AppChain shipping in Q4 2026 as planned, and Bitcoin holding above $80,000 through the second half of the year. If either fails, $18 becomes the more realistic ceiling.

    Is Chainlink a good investment in 2026?

    LINK sits at a rare intersection of proven institutional traction and deep price drawdown, still 78% below its 2021 peak. That combination favors long-horizon holders more than swing traders. Position sizing matters. Volatility remains high, competition is real, and execution risk on institutional launches is the largest single variable.

    What is the Chainlink price prediction for 2027?

    Assuming DTCC and SWIFT integrations mature and CCIP volume keeps compounding, most analyst ranges cluster between $22 and $40 for 2027, with a stretched bull case near $60. Bear case if oracle competition intensifies: $12 to $16.

    Why is Chainlink price rising?

    Two catalysts: DTCC confirmed adoption of the Chainlink Runtime Environment for its Collateral AppChain, and SWIFT’s integration is bringing 11,000 banks a direct line to public and private blockchains. LINK is up 55.9% in 60 days as the market prices in real institutional revenue for the first time in cycles.

    How does Chainlink CCIP work?

    CCIP is a cross-chain messaging and token transfer protocol secured by decentralized oracle networks and a separate Risk Management Network. Developers use one interface to move data or tokens across 60+ chains. Fees are paid in the source-chain gas token or LINK, with LINK also used as staking collateral by oracle node operators.

    Can LINK reach $100?

    Not realistically in 2026. At $100, LINK’s market cap would exceed $74 billion, roughly the current size of BNB. That path likely requires 2027 to 2028, a broad tokenization super-cycle, and Chainlink capturing meaningful fees from institutional volume. Possible on a five-year horizon. Improbable on a twelve-month one.

    The Honest Take

    LINK is one of the cleanest institutional stories in crypto right now. The partnerships are real. The revenue path is more visible than it has been at any point in the last three years. And the token still trades 78% below where it topped in 2021, which means the setup rewards patience rather than chasing.

    The bull case for $25 by mid-2027 is defensible on fundamentals. The bear case where LINK ranges between $9 and $14 is equally defensible if institutional pilots stall. Anyone modeling this as a one-way trade is not paying attention.

    Watch the DTCC Collateral AppChain launch date. Watch CCIP monthly volume. Watch whether SWIFT integrations move from press release to actual production traffic. Those three signals will do more to determine LINK’s 2026 print than any chart pattern. For readers exploring adjacent oracle-heavy plays, our Aave 2026 outlook covers a protocol that lives or dies on Chainlink feeds.

    Disclaimer: This article is for informational and educational purposes only and should not be construed as financial, investment, or trading advice. Cryptocurrency markets are highly volatile, and past performance does not guarantee future results. The price predictions and analyses presented here are based on AI models, technical indicators, and available data at the time of writing. They are not guarantees. Always conduct your own research (DYOR) and consult with a qualified financial advisor before making any investment decisions. Pump Parade and its authors do not assume liability for financial losses incurred based on information provided in this article.