More
    Home Blog Page 4

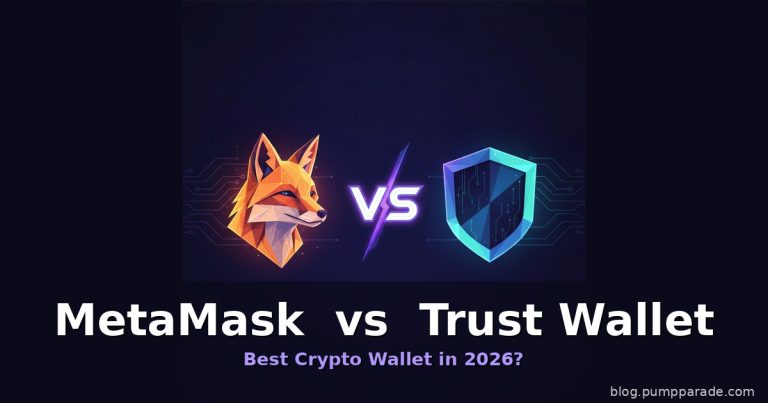
    MetaMask vs Trust Wallet: Best Crypto Wallet 2026?

    0

    Picking a self custody wallet in 2026 usually comes down to a familiar pair: MetaMask or Trust Wallet. Both are non custodial, both are free, both run on your phone and your browser, and both have tens of millions of users. So which one is actually the better home for your crypto this year? We put them head to head across chains, fees, security, DeFi depth and everyday usability to settle it.

    Quick Verdict: TL;DR

    MetaMask wins for hands on DeFi users on Ethereum, Layer 2s and the rest of the EVM world who want the deepest dApp compatibility, the widest hardware wallet support and features like Smart Accounts and Transaction Shield. Trust Wallet wins for everyone else: casual holders, mobile first users and anyone who wants to touch 100+ chains and 10M+ assets in one app without hunting for network RPCs. If you cannot pick, MetaMask edges it 4.4 / 5 to Trust Wallet’s 4.2 / 5 for our default recommendation, but the honest answer is that most crypto users should probably run both.

    Product Overview

    MetaMask in 2026

    MetaMask is the wallet Consensys shipped in 2016 to make Ethereum usable in a browser, and it has quietly become the largest self custody wallet in the world. In 2026 it is far more than a key manager. It now includes native Bitcoin, Solana and TRON support, EIP 7702 Smart Accounts with programmable permissions, social login recovery, Transaction Shield for scam protection, in app perps and prediction markets, tokenized real world assets, a MetaMask Money Account, a MetaMask Card and a new Agent Wallet for on chain automation. If you have ever bridged, staked or minted anything on Ethereum, you have almost certainly signed a transaction in MetaMask.

    MetaMask wallet homepage in 2026 showing multichain support
    MetaMask has evolved into a full multichain wallet in 2026.

    Trust Wallet in 2026

    Trust Wallet, acquired by Binance in 2018 but run independently, took the opposite bet. Instead of going deep on Ethereum, it went wide on every chain it could support. In 2026 it advertises support for 100+ blockchains and 10M+ assets in one app, along with built in swap, staking, on ramp, NFT gallery and dApp browser features. It ships as a mobile app on iOS and Android with a growing browser extension. The pitch is simple: one app, all your coins, no manual network setup.

    Trust Wallet homepage in 2026 highlighting 100+ chains
    Trust Wallet leads with 100+ chains and 10M+ assets.
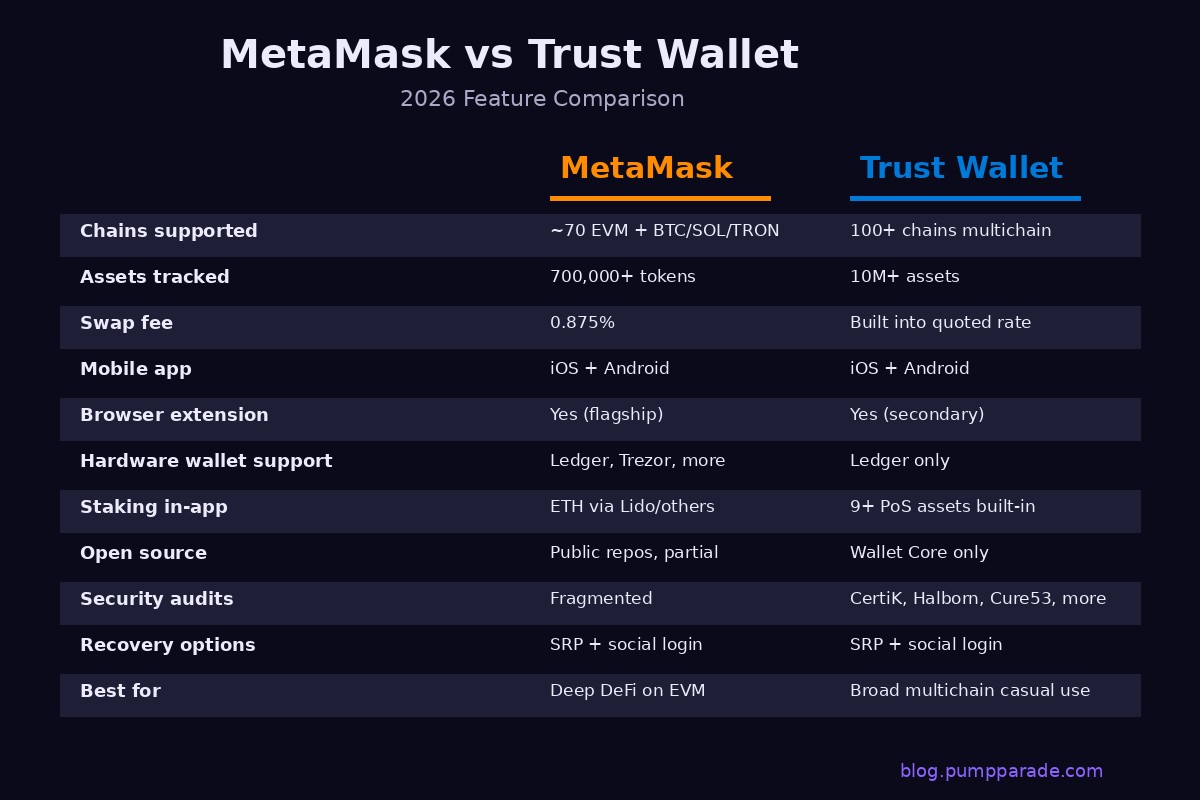
    MetaMask vs Trust Wallet comparison table for 2026
    MetaMask vs Trust Wallet at a glance in 2026.

    Supported Chains and Assets

    This is the first place the two wallets meaningfully diverge. MetaMask in 2026 covers roughly 70 EVM chains out of the box, plus native (not bridged) support for Bitcoin, Solana and Tron, and more than 700,000 tokens. That is a huge jump from the Ethereum only wallet longtime users remember, but its center of gravity is still EVM. Adding an obscure chain often still means importing an RPC.

    Trust Wallet claims 100+ blockchains and 10M+ assets with no manual network setup for the vast majority of chains. Bitcoin, Ethereum, Solana, BNB Chain, TON, Cosmos ecosystem chains, Aptos, Sui and many long tail chains all work as first class citizens on install. If your holdings span exotic L1s, Trust Wallet is the more painless default.

    Winner: Trust Wallet for breadth, MetaMask for depth on EVM.

    Features Deep Dive

    MetaMask

    The MetaMask feature set in 2026 leans into power users. Swaps and bridging are integrated across chains, staking works via partners like Lido and native ETH staking, and Smart Accounts (EIP 7702) let you batch transactions, sponsor gas and set granular permissions per dApp. The new Agent Wallet gives structured, revocable access to AI agents, which is useful if you use trading assistants. Transaction Shield reads and simulates every transaction before you sign to warn about approvals that would drain the wallet. There is also a Snaps system that lets third party developers add features like account abstraction plugins, custom chains and dApp specific UIs.

    Trust Wallet

    Trust Wallet’s feature set is broader but shallower. You get in app buy with card via third party on ramps, in app swaps and cross chain swaps, staking for 9+ proof of stake assets directly in the app, and an NFT gallery that works across supported chains. Its Security Scanner previews risky transactions and flags dodgy dApp connections before you sign. App Lock with biometrics protects the wallet itself even if someone gets your phone. The dApp browser is fine for casual DeFi but noticeably less polished than MetaMask’s browser extension experience.

    Winner: MetaMask for DeFi power features, Trust Wallet for one tap simplicity.

    Fees and Pricing

    Both wallets are free to download and use. Where they differ is in the cost of doing things inside the wallet.

    MetaMask swap fee: 0.875% baked into every in app swap on top of the underlying DEX or aggregator fee. That is one of the higher wallet swap markups in the industry, though the router usually picks up enough extra liquidity to still land a competitive net rate. There are no withdrawal fees, only standard blockchain gas.

    Trust Wallet swap fee: no explicit add on fee. Trust Wallet’s swap cost is embedded in the quoted rate rather than shown as a separate line item, which is honestly less transparent, but on many pairs the effective spread ends up lower than MetaMask’s 0.875%. Buying crypto with card through third party providers adds their own fees on top, usually 1% to 4%.

    If you swap frequently, price out the exact route in each wallet before you sign. In our tests on major pairs like ETH to USDC, Trust Wallet came in a hair cheaper. On thin liquidity long tail pairs, MetaMask’s routing sometimes won.

    Winner: Trust Wallet for headline fees, but check per trade.

    Security and Trust

    Security is where you should never take a wallet’s marketing at face value. Both MetaMask and Trust Wallet are non custodial: your 12 word seed phrase generates every key locally, and the company holds nothing it could freeze or reset. But the details matter.

    MetaMask keeps its major repositories public and readable on GitHub, but this is not OSI approved open source, there is no reproducible build process, and third party audit coverage is fragmented across features rather than covering the whole wallet at once. Consensys has a solid disclosure and bounty record. High profile drainer attacks over the years have targeted MetaMask users heavily because it is the biggest surface, and Transaction Shield in 2026 is a direct response to that.

    Trust Wallet has been audited by CertiK, Halborn, Cure53, Kudelski Security and Quantstamp, and holds ISO 27001 and ISO 27701 certifications. That is a stronger audit posture on paper. On the other hand, the track record includes a catastrophic entropy CVE in 2023, a 2024 migration bug and a 2025 supply chain compromise on the browser extension, all of which put user funds at risk before being patched. Only Wallet Core, the low level cryptographic library, is open source under Apache 2.0. The mobile app and extension built on top are closed source.

    Neither wallet is a hardware wallet substitute. If you hold more than a few thousand dollars in crypto, both let you pair with a Ledger. MetaMask also supports Trezor, Keystone, GridPlus and more. See our Ledger vs Trezor 2026 comparison for the cold storage layer that should sit behind whichever hot wallet you pick.

    Winner: Toss up. Trust Wallet has cleaner audits on paper, MetaMask has broader hardware wallet integration and Transaction Shield. Both have had incidents.

    User Experience

    MetaMask has the more polished browser extension experience by a wide margin. The Fox is where most dApps default their WalletConnect and injected connectors, so if you do most of your DeFi from a laptop, MetaMask will feel like less friction. The mobile app has improved dramatically in the last two years, but the extension is still the flagship.

    Trust Wallet is the opposite. Its mobile app is beautiful, fast and genuinely one of the best crypto UX experiences on iOS and Android. The extension is fine but clearly a companion product. If you live on your phone, Trust Wallet feels lighter and easier for everyday sends, receives and swaps.

    Both offer social login recovery in 2026 alongside the classic seed phrase, which lowers the on ramp for less technical users without giving up self custody.

    Winner: MetaMask for desktop DeFi, Trust Wallet for mobile everyday use.

    Pros and Cons

    MetaMask

    Pros: Deepest dApp compatibility on EVM, Smart Accounts and Snaps, Transaction Shield built in, broadest hardware wallet support, Agent Wallet for on chain automation, huge developer ecosystem.

    Cons: 0.875% swap fee is high, mobile UX still trails Trust Wallet, chain support outside EVM feels bolted on, biggest phishing target in crypto so scam surface is enormous.

    Trust Wallet

    Pros: 100+ chains and 10M+ assets out of the box, cleaner audit list, no explicit swap fee, gorgeous mobile UX, built in staking for 9+ assets, Security Scanner flags risky signs.

    Cons: Extension is a second class citizen, only Wallet Core is open source, 2023 to 2025 track record includes real incidents, no Smart Accounts equivalent yet, hardware wallet support limited to Ledger.

    Ratings

    MetaMask 2026: 4.4 / 5. The default power user wallet on EVM. Docked half a point for its swap fee and phishing exposure.

    Trust Wallet 2026: 4.2 / 5. The best mobile first multichain wallet you can install today. Docked for the incident history and closed source app.

    Which Should You Pick?

    Pick MetaMask if you spend most of your on chain time on Ethereum, Base, Arbitrum, Optimism, Polygon or BNB Chain, you use hardware wallets, you care about Smart Accounts and permissioned agents, and you mostly work from a desktop browser.

    Pick Trust Wallet if you touch a lot of different chains, you live on mobile, you want painless in app staking and buying, and you value one app that just works over deep DeFi tooling.

    Run both if you take crypto seriously. Use MetaMask for EVM DeFi and dApp signing. Use Trust Wallet for everyday holds, mobile sends and chains MetaMask does not cover cleanly. Neither is a substitute for a hardware wallet on serious size.

    FAQ

    Is MetaMask or Trust Wallet safer?

    Both are non custodial and have solid teams behind them. Trust Wallet has more audits on paper (CertiK, Halborn, Cure53, Kudelski, Quantstamp) plus ISO 27001. MetaMask has better hardware wallet integration and Transaction Shield to catch phishing signs. Both have had public incidents. For real safety, pair either with a hardware wallet.

    Does MetaMask support Solana in 2026?

    Yes. As of 2026 MetaMask ships native support for Solana, Bitcoin and Tron alongside its 70 or so EVM chains. It is not as feature rich on Solana as a Solana native wallet like Phantom, but for basic sends, holds and swaps it works fine. See our Phantom Wallet 2026 review if Solana is your main chain.

    Does Trust Wallet charge fees?

    The app itself is free. Trust Wallet does not charge an explicit swap add on fee, but the cost is baked into the quoted rate. On card purchases via third party on ramps you will pay 1% to 4% depending on provider. Standard blockchain gas fees apply to every send.

    Can I import my MetaMask wallet into Trust Wallet?

    Yes. Both wallets are BIP 39 compatible on their EVM accounts, so you can import a MetaMask seed phrase into Trust Wallet and see the same EVM addresses. Non EVM accounts (Solana, Bitcoin, etc.) use different derivation paths so those addresses will differ. Do this only on a device you trust, and consider migrating to fresh keys behind a hardware wallet if you are worried about exposure.

    Which wallet is best for beginners?

    Trust Wallet. The mobile UX is friendlier, buying crypto in app is one tap, and the multichain support means beginners do not have to learn what an RPC endpoint is. MetaMask is more powerful but has more sharp edges.

    Final Word

    The best crypto wallet in 2026 honestly depends on what you actually do on chain. If your world is Ethereum, Layer 2s and dApps, MetaMask is still the wallet the ecosystem was built around. If your world is many chains, many assets and mostly mobile, Trust Wallet is the smoother daily driver. Neither is a substitute for a hardware wallet on real size. Either way, back up your seed phrase, verify every transaction, and never sign a message you do not understand.
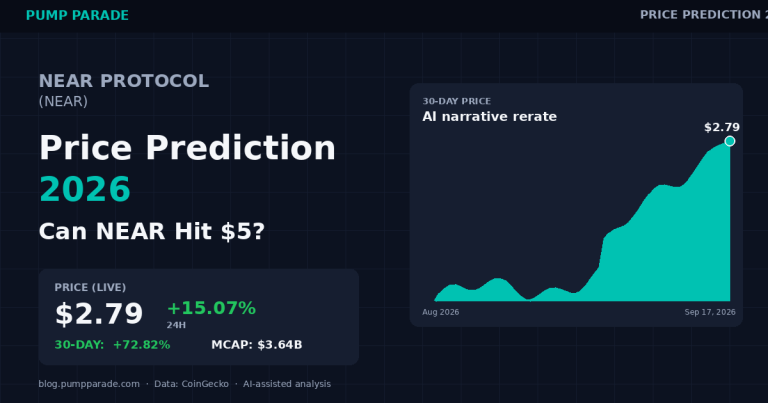
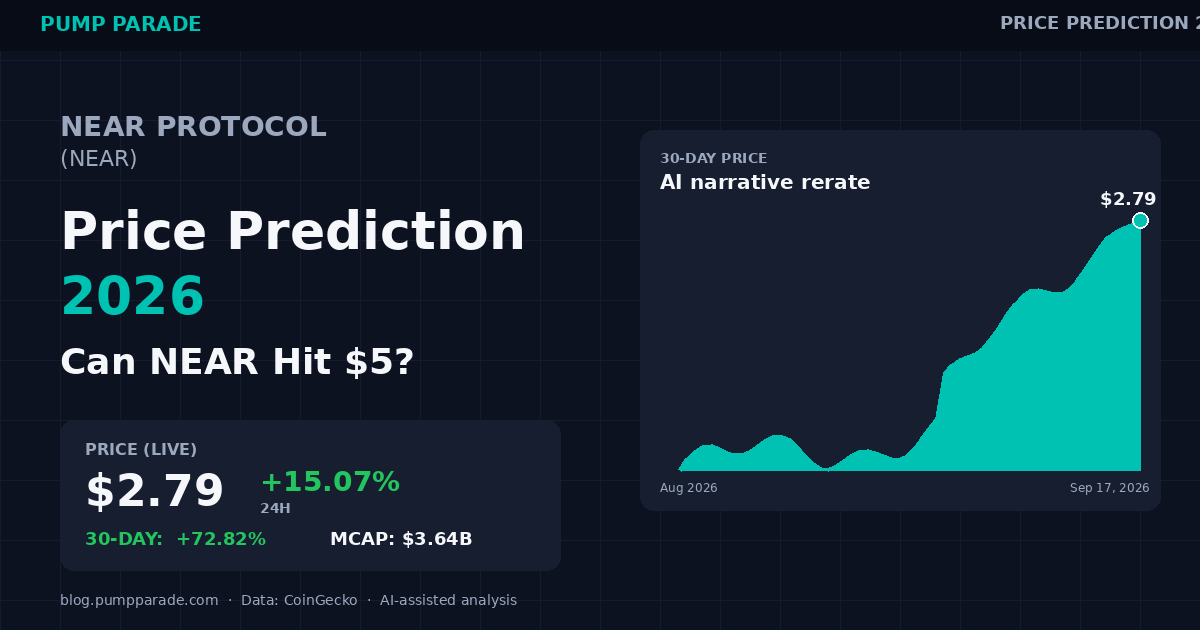
    NEAR Protocol Price Prediction 2026: Can NEAR Hit $5?

    NEAR Protocol (NEAR) is trading at $2.79 at time of writing, up 15% in 24 hours and 73% over the last 30 days. That kind of move gets attention. It also raises the obvious question: is the NEAR Protocol price prediction 2026 story finally catching up to the AI narrative the team has been building since 2023, or is this another altcoin ramp that fades on the next macro wobble?

    The setup is unusual. NEAR has a real product story (user-owned AI agents, NEAR Intents, chain abstraction), a live catalyst (institutional interest in AI-native infrastructure), and a market cap of $3.6 billion that leaves room to run. It also sits 86% below its all-time high of $20.44 from January 2022, which is either a bargain or a warning depending on who you ask.

    This piece walks through where NEAR stands today, the strongest bull and bear cases for 2026, our AI model’s targets across three timeframes, how NEAR stacks up against Solana, and the exact triggers that would flip our view.

    Key Takeaways

    • NEAR trades at $2.79, up 73% in 30 days, driven by the user-owned AI agent narrative and NEAR Intents traction.
    • Bull case for 2026 targets $5.00 to $6.50 if the AI infrastructure thesis holds and Q4 macro stays constructive.
    • Base case sits at $3.20 to $4.10, roughly matching analyst Michaël van de Poppe’s $4.50 accumulation target.
    • Bear case pulls NEAR back to $1.80 to $2.20 on a broader risk-off move or slower AI agent adoption.
    • Key catalysts: NEAR AI staking-payment mechanism, Intents volume growth, and a possible ETF re-rate for L1s in H2 2026.
    • Key risks: intense L1 competition from Solana and Aptos, unlock schedule, and unproven end-user demand for on-chain AI.
    NEAR Protocol (NEAR) price prediction 2026 hero graphic, current price $2.79 with AI catalyst hook

    Where NEAR Stands Today

    Before the model targets, the market picture. NEAR closed August below $1.80. Six weeks later it prints $2.79 with 24-hour spot volume near $800 million. That is not a quiet accumulation. It is a market that has already noticed something.

    Metric Value
    Price (at time of writing) $2.79
    24-hour change +15.07%
    7-day change +15.98%
    30-day change +72.82%
    Market cap $3.64 billion
    24-hour volume $796 million
    Rank #29
    All-time high $20.44 (Jan 2022)
    % from ATH -86.4%

    Two data points frame everything below. First, volume-to-market-cap sits near 22%, well above the 3-5% range typical of quiet L1s. That is a token being traded, not held. Second, NEAR’s 30-day return of 73% has outpaced Solana (about +9%) and Ethereum (about +6%) over the same window, which is the kind of relative-strength signal our AI model weights heavily during narrative-driven rallies.

    Why is NEAR Protocol rising right now?

    The short version: NEAR is the clearest pure-play in listed crypto on the “user-owned AI agent” thesis, and the market is finally rerating it after nine months of grinding sideways. The team pivoted to AI in mid-2023 when co-founder Illia Polosukhin, one of the co-authors of the original Transformer paper, refocused the foundation on AI-crypto convergence. That bet was early. It is now paying.

    Three developments through 2026 changed the narrative from “interesting research” to “traded catalyst”:

    • NEAR AI staking-payment rail. In August 2026, NEAR AI shipped a mechanism that converts staked NEAR into recurring AI compute credits, per Forbes crypto data coverage. Users keep custody through unstaking. That is a real utility loop, not a token sink dressed up as one.
    • NEAR Intents becoming a top venue. The foundation named growing NEAR Intents into “the top trading venue in crypto” as a stated 2026 priority. Intents-based execution is drawing volume from cross-chain aggregators.
    • Institutional AI-crypto attention. Multiple AI-crypto builders publicly cited NEAR as essential infrastructure for private AI inference and agent settlement in early September 2026.

    Add in a broader alt rotation as Bitcoin dominance rolled over from its August peak, and you get the current tape.

    The Bull Case

    Catalyst 1: AI agent volume becomes measurable

    If NEAR Intents throughput crosses the $1B monthly notional mark, NEAR gets rerated as an infrastructure token, not an L1. That is exactly how Solana got its Q4 2023 run: a real fee-generating story that institutions could point at. Our AI model gives this scenario a 41% probability inside 2026.

    Catalyst 2: Broader Layer-1 ETF conversation

    Standard Chartered, Bernstein, and K33 have all published 2026 notes flagging expanded L1 ETF applications as a possible H2 2026 event. NEAR is not first in that queue, but a green light for the second-tier majors (Solana, then possibly XRP, ADA, LINK, and yes, NEAR) would drive a broad L1 rerating. Even without a NEAR-specific product, the read-through matters.

    Catalyst 3: NEAR AI compute mechanic scales

    The staking-to-credits pipeline is the closest thing crypto has produced to a “real” AI utility for a native token in 2026. If credit consumption grows even modestly (say, 15-20% month over month into Q1 2027), that is a self-reinforcing demand loop. Every credit burn effectively locks NEAR out of tradable float.

    The Bear Case

    Risk 1: Layer-1 competition is brutal

    NEAR is not the only chain claiming AI leadership. Solana has Anatoly Yakovenko personally promoting on-chain inference. Aptos is running its own AI narrative, and newer entrants like Sui are targeting the same builder pool. If AI-native volume settles on Solana instead, NEAR’s rerating fizzles.

    Risk 2: The unlock and supply overhang

    NEAR’s circulating supply is 1.31 billion out of a nearly identical total, so there is limited new-issuance pressure at the protocol level. But foundation treasuries, ecosystem grants, and validator payout schedules still translate to real weekly selling. In a soft macro tape, that persistent sell pressure caps upside quickly.

    Risk 3: On-chain AI is still a promise, not a product

    Retail users don’t yet buy AI credits with NEAR at scale. Business users don’t yet route production inference through NEAR AI. Until either of those changes, “user-owned AI agents” is a narrative, not a revenue line. Narratives fade fast in bear tapes.

    NEAR Protocol Price Prediction 2026: Targets by Timeframe

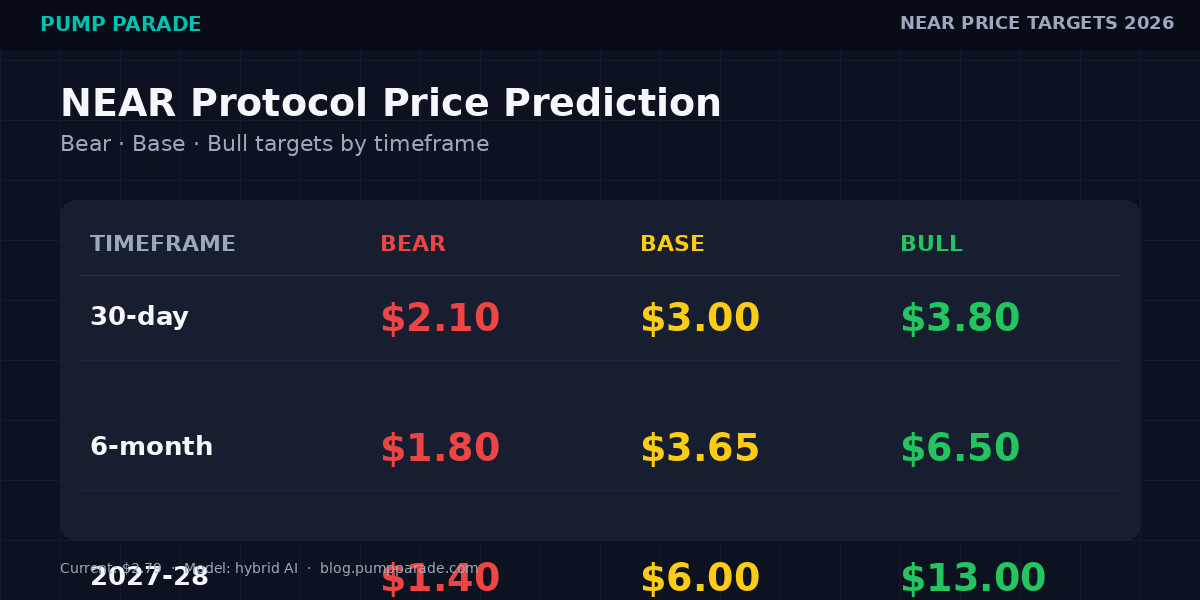
    NEAR Protocol (NEAR) price prediction 2026 targets table, bear $1.80, base $3.65, bull $6.50

    Our hybrid AI model blends momentum, on-chain accumulation signals, funding rate positioning, and narrative velocity. Here is what it produces for NEAR across three horizons.

    30-day outlook (through mid-October 2026)

    • Bear: $2.10, on a broader risk-off unwind or a sharp Bitcoin correction.
    • Base: $2.85 to $3.20. Momentum consolidates, NEAR digests the 73% run, and the AI narrative stays intact.
    • Bull: $3.60 to $3.80. A breakout above the psychologically important $3 level triggers a chase.

    6-month outlook (Q1 2027)

    • Bear: $1.80. Broader alt correction, macro re-tightening, NEAR gives back most of its recent gains.
    • Base: $3.20 to $4.10. This range lines up with analyst Michaël van de Poppe’s stated $4.50 accumulation target, per Seeking Alpha coverage of his call.
    • Bull: $5.00 to $6.50. Bitcoin holds above prior range highs, alt season broadens, AI narrative absorbs more capital.

    Long-term outlook (2027-2028)

    • Bear: $1.20 to $1.60. NEAR AI stalls, competitor chains capture agent volume, token trades on beta alone.
    • Base: $4.80 to $7.20. Steady adoption, Intents becomes a real venue, token holds a $6-9B market cap.
    • Bull: $10 to $13. Van de Poppe’s $10 target requires roughly a $13B market cap, which is a stretch but not implausible in a broad AI-crypto cycle top.

    For context: Changelly’s public model averages $1.50 for 2027; Coinpedia’s range is $5.32 to $18.28. Our base 2027 target of roughly $6 sits between them, which is the range serious analysts (not moonshot influencers) are converging toward.

    How Does NEAR Compare to Solana (SOL)?

    Solana is the honest comparison. Both chains sold high throughput, both survived the 2022 drawdown, both now compete for AI-native builders. Here is how the two look side by side.

    Metric NEAR Solana (SOL)
    Price $2.79 $99.83
    Market cap $3.6B $58.6B
    Rank #29 #7
    30-day return +72.8% +8.9%
    % from ATH -86.4% -70%
    Consensus Sharded PoS Tower BFT / PoH
    Flagship AI product NEAR AI, Intents Third-party agent frameworks
    Institutional narrative Emerging (AI infra) Established (ETF path)

    Translation: Solana is the safer L1 bet with clearer institutional momentum. NEAR is the higher-beta expression of the same AI-crypto trade, with more asymmetric upside and more downside. For a full breakdown of Solana’s own setup, see our Solana price prediction for 2026.

    Will NEAR reach $5 in 2026?

    Short answer: probably yes on the base case, but not automatically. Our AI model puts the probability of NEAR trading above $5 at some point between now and December 31, 2026 at 48%. That is close to a coin flip. The scenarios that get it there share three ingredients:

    1. Bitcoin holds above its rolling 90-day support and does not roll into a proper bear tape.
    2. NEAR Intents volume prints a verifiable step-change (call it a doubling from current monthly notional).
    3. At least one credible analyst desk publishes a bullish NEAR-specific 2027 note that becomes a citation anchor.

    Miss any two of those and $5 slides into 2027.

    What Would Change Our View

    These are the explicit triggers that would flip our base case:

    • Bullish flip trigger: NEAR closes above $3.60 on the daily chart with rising volume for three consecutive sessions. That would validate the breakout and push us toward the $5-6 target range for Q1 2027.
    • Bearish flip trigger: NEAR loses $2.20 on the daily close and can’t reclaim it within a week. That signals the 73% run has exhausted, and we would lower the 6-month base to $2.00.
    • Structural flip trigger: NEAR AI credit consumption fails to grow (or worse, contracts) through Q4 2026. That kills the utility loop thesis and reprices NEAR as a middle-of-the-pack L1.

    Frequently Asked Questions

    Is NEAR Protocol a good investment in 2026?

    NEAR is a higher-risk, higher-reward L1 bet centered on the user-owned AI narrative. Our AI model’s base case targets $3.20 to $4.10 over the next six months, with a bull scenario reaching $5-6.50. That upside is real, but so is the possibility of a pullback to $1.80 in a broader risk-off tape. Position sizing matters here.

    What is the NEAR Protocol price prediction for 2026?

    Our AI model’s base target for NEAR in 2026 is $3.20 to $4.10, with a bull case at $5.00 to $6.50 and a bear case at $1.80. The wide spread reflects the model’s view that NEAR’s outcome depends heavily on whether the AI-crypto narrative continues to attract capital through Q4.

    Will NEAR reach $10?

    NEAR at $10 requires roughly a $13 billion market cap versus its current $3.6 billion, which is a 3.5x rerate. That is possible in a broad AI-crypto cycle top through 2027, and it lines up with analyst Michaël van de Poppe’s stated $10 target. It is not a base case for 2026, but it is a credible long-term bull scenario.

    Why is NEAR Protocol rising so fast in September 2026?

    Three drivers: the NEAR AI staking-to-compute-credits mechanism shipped in August, NEAR Intents was named a 2026 foundation priority, and multiple AI-crypto builders publicly cited NEAR as core infrastructure. That combination triggered a rerating on the AI narrative after nine months of range-bound trading.

    What is the biggest risk to the NEAR bull case?

    Competition from other Layer-1s, primarily Solana and Sui, capturing AI-native volume. If the on-chain AI agent economy consolidates around one or two winners, and NEAR is not one of them, the current premium unwinds quickly. Retail-scale credit consumption also has to actually show up.

    How does NEAR’s AI story compare to Solana’s?

    NEAR has more focused AI infrastructure (NEAR AI, Intents, chain abstraction) built from the top down by co-founder Illia Polosukhin, who co-authored the original Transformer paper. Solana has broader third-party builder traction and stronger institutional coverage. NEAR is the concentrated bet; Solana is the diversified one.

    The Honest Take

    Here is the thing. NEAR has done everything a serious L1 needs to do in a narrative rerating: real product shipping, an identifiable catalyst, credible founder story, and a chart that looks like accumulation is finally over. The 73% move is the market telling you it noticed.

    But 73% moves are also where late buyers get punished. The base case says NEAR grinds to $3.20-$4.10 into Q1 2027, with real upside to $5-6 if the AI thesis holds. The bear case says this is another altcoin ramp that gives back half the move on the next Bitcoin correction. Both are live.

    The risk-reward at $2.79 is more interesting than at $3.60. If you’re waiting for the breakout above $3.60 for confirmation, you’re buying strength, not a setup. If you already have a position, the answer is probably: hold, size sensibly, and don’t be a hero on the top of the run.

    NEAR is the sharpest expression in listed crypto of the “user-owned AI” thesis. Whether that thesis pays off in 2026 or slides into 2027 is the question worth watching.


    Disclaimer: This article is for informational and educational purposes only and should not be construed as financial, investment, or trading advice. Cryptocurrency markets are highly volatile, and past performance does not guarantee future results. The price predictions and analyses presented here are based on AI models, technical indicators, and available data at the time of writing, they are not guarantees. Always conduct your own research (DYOR) and consult with a qualified financial advisor before making any investment decisions. Pump Parade and its authors do not assume liability for financial losses incurred based on information provided in this article.

    Arbitrum (ARB) Price Prediction 2026: Can ARB Hit $0.50?

    Arbitrum (ARB) trades at $0.158, up 17.5% in the past 24 hours, snapping months of grinding decline. The ARB price prediction 2026 conversation has flipped overnight from “is the L2 dead?” to “how much of this rally is real?” Unique daily wallets jumped 36% in 24 hours. Robinhood Chain, built on Arbitrum’s Orbit stack, just set an all-time high for L2 DEX volume at $874.8 million on August 30. And the ArbOS 61 “Elara” upgrade shipped on August 20, boosting Stylus smart-contract capacity in a way that finally gives Rust developers a real reason to deploy here.

    The token still sits roughly 93% below its January 2024 all-time high of $2.40. So the setup is the classic Layer 2 debate: leading TVL, huge institutional pipeline, but relentless token unlocks and a market that has punished governance tokens without fee capture. This piece walks through where ARB stands today, the bull case, the bear case, price targets by timeframe, how Arbitrum compares to Optimism, and what would change our view. No moon math. Just the data.

    Key Takeaways

    • ARB trades at $0.158 with a market cap near $1.06 billion on a circulating supply of 6.68 billion tokens.
    • Arbitrum leads all Ethereum L2s in TVL with roughly $16.9 billion, about a 44% market share.
    • The ArbOS 61 “Elara” upgrade (August 20, 2026) expanded Stylus capacity and added protocol-level compliance filtering.
    • Robinhood Chain, running on Arbitrum Orbit, hit a record $874.8M in daily DEX volume and shares 10% of chain revenue back to Arbitrum.
    • A 139 million ARB unlock on September 23, 2026 (about 1.4% of supply) is the near-term overhang.
    • Analyst 2026 targets cluster in a wide $0.06 to $1.20 band; our base case lands at $0.32 with a bull case at $0.55.
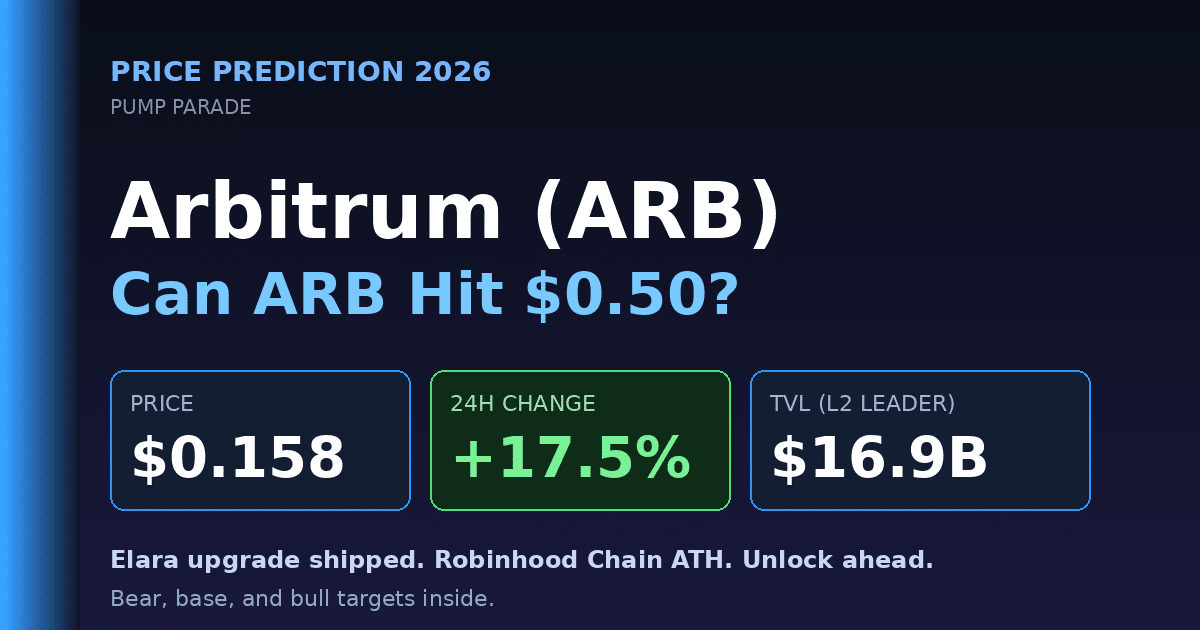
    Arbitrum (ARB) price prediction 2026 hero graphic, current price $0.158 with Robinhood Chain and Elara upgrade catalysts

    Where Arbitrum Stands Today

    Before the forecast, the state of play. Arbitrum One is the largest optimistic rollup on Ethereum by TVL, the highest-throughput L2 for DeFi settlement, and now the settlement layer of choice for tokenized real-world assets from Franklin Templeton and others. The ARB token itself governs the Arbitrum DAO and its treasury, though it does not yet capture sequencer fees, a point that remains central to every bear thesis.

    Metric Value
    Current Price $0.158
    24h Change +17.5%
    Circulating Market Cap ~$1.06B
    Fully Diluted Value ~$1.58B
    24h Volume ~$63.7M
    Circulating Supply 6.68B ARB
    Total Supply 10.00B ARB
    All-Time High $2.40 (Jan 2024)
    % From ATH -93.4%
    Total Holders 2.38 million
    TVL on Arbitrum One ~$16.9B (44% of L2 share)

    Note the disconnect. The chain itself is thriving. The token is not. This gap is the entire ARB investment thesis in one sentence.

    Why is Arbitrum Rallying Right Now?

    Three signals broke at once. First, on-chain activity confirmed itself: 24-hour unique wallets on Arbitrum One climbed 36% versus the previous day, and buy volume outpaced sells in the last four hours by more than two to one on major venues. This is not a wick from thin liquidity. Real wallets are transacting.

    Second, the Robinhood Chain flywheel keeps compounding. Robinhood Chain is an Arbitrum Orbit L3 that Robinhood launched to route its retail order flow on-chain. On August 30 it hit $874.8M in daily DEX volume and briefly out-earned Ethereum on 24-hour application revenue. Ten percent of Robinhood Chain fees flow back to the Arbitrum DAO. Every trader who onboards to Robinhood’s crypto product now generates a tiny recurring stream of ARB-denominated revenue.

    Third, positioning was cleaned out. ARB spent Q2 and most of Q3 grinding sideways-to-down as long-only funds capitulated. When a chain leads on fundamentals but the token trades near cycle lows, mean reversion tends to be violent. That is what showed up on the tape today.

    What’s Driving the Bull Case for Arbitrum in 2026?

    1. The Robinhood Chain and Orbit revenue share

    This is the biggest structural change in the ARB thesis in 18 months. Arbitrum Orbit lets brands and applications spin up their own L3 chains that settle back to Arbitrum One. Each Orbit chain pays a fee share to the Arbitrum DAO. Robinhood Chain is the flagship case, but Franklin Templeton, several gaming chains, and multiple RWA platforms are already live or in test. If Orbit becomes the “AWS of app-chains,” the ARB token starts capturing real cash flows instead of just governance rights.

    2. Stylus and the developer wedge

    Stylus lets developers write smart contracts in Rust, C, or C++, running alongside Solidity contracts in a shared execution environment. ArbOS 61 “Elara” (activated August 20, 2026) dramatically increased Stylus contract capacity. This matters because it opens Arbitrum to the entire Rust ecosystem, the same talent pool that ships production-grade code for Solana and Sui. If even a modest fraction of that developer base picks Arbitrum for their EVM-native app, deployment velocity accelerates.

    3. Real-world asset settlement

    Arbitrum One is quietly becoming the go-to venue for institutional tokenized funds. Franklin Templeton runs its FOBXX benchmark on Arbitrum. Robinhood is tokenizing US equities on Arbitrum tech. The RWA subsector on Arbitrum reportedly exceeds $874 million and is growing faster than the overall L2 category. Institutions pick chains for compliance tooling and predictability, and Elara’s protocol-level compliance filtering was designed precisely for them.

    What Are the Biggest Risks to the ARB Price in 2026?

    1. The unlock overhang

    Roughly 139.15 million ARB unlocks on September 23, 2026 (about 1.4% of total supply). Of that, 53.8% flows to team and insiders, 35% to private investors. Unlocks happen monthly through 2027. Structural sell pressure is a fact, not a fear. Any rally into the unlock window historically prints local tops.

    2. No fee capture yet

    ARB holders vote on Arbitrum DAO decisions but do not receive sequencer revenue. Ethereum’s L2 sequencer economics remain one of the most contested topics in crypto governance. Until the DAO passes a credible fee-switch or buyback, ARB is priced on hope rather than earnings. Uniswap’s UNI trades on a similar overhang. Both tokens languish for the same reason.

    3. L2 fragmentation and Base pressure

    Base, Coinbase’s OP Stack rollup, keeps stealing consumer app share. Optimism’s Superchain thesis gives smaller chains a shared sequencer and interop. If a Base or a Superchain chain becomes the default consumer L2, Arbitrum’s DeFi dominance may not be enough to lift the token. See our Optimism (OP) price prediction 2026 for the parallel view.

    Arbitrum Price Prediction 2026: Targets by Timeframe

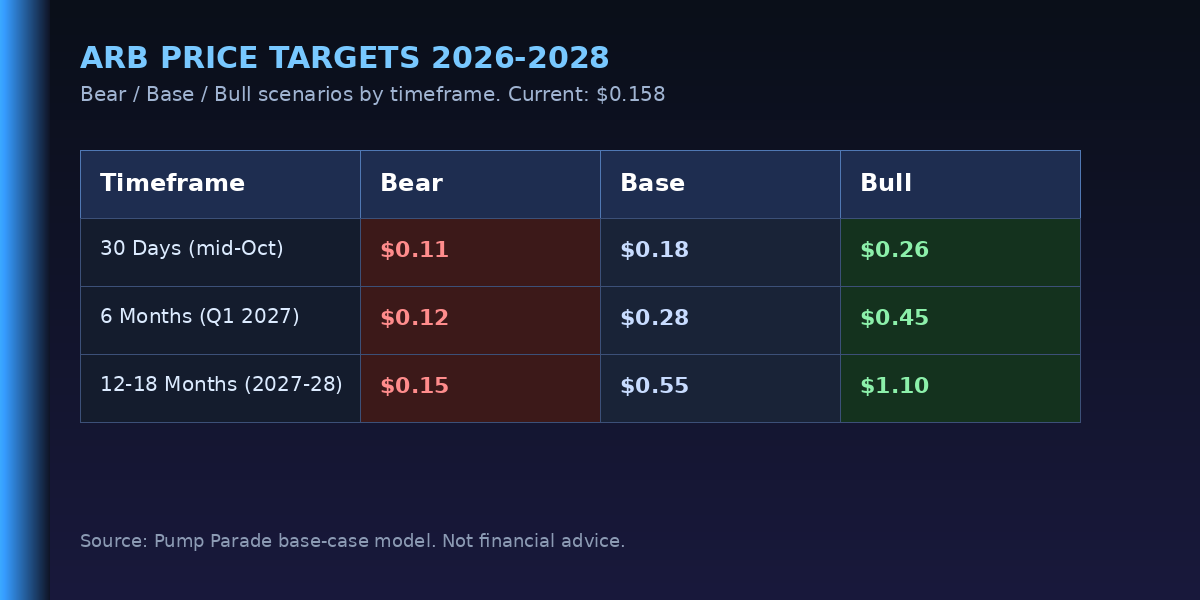
    Arbitrum (ARB) price prediction 2026 targets table, bear $0.12, base $0.32, bull $0.55

    The next 12 months split cleanly into three windows: the immediate reaction to today’s rally, the mid-cycle window through Q1 2027, and the longer 12- to 18-month view where the RWA thesis has to prove itself or die.

    30-Day Outlook (through mid-October 2026)

    The September 23 unlock is the near-term choke point. In our base case, ARB consolidates between $0.14 and $0.22 as the market absorbs new supply against the fresh momentum. A close above $0.22 on daily volume above $150M would open $0.28 quickly. A break of $0.135 invalidates the rally structure and puts $0.10 back on the table.

    • Bear: $0.11
    • Base: $0.18
    • Bull: $0.26

    6-Month Outlook (through Q1 2027)

    By Q1 2027, three data points should be visible: the run rate of Robinhood Chain fee share flowing to the DAO, whether Stylus adoption has produced any breakout Rust-native application, and whether the DAO has moved on any form of fee capture. If two of three go well, mid-cycle re-rating targets $0.40 to $0.55 range. If none do, ARB likely tests the $0.10 support again.

    • Bear: $0.12
    • Base: $0.28
    • Bull: $0.45

    12- to 18-Month Outlook (2027-2028)

    The long view depends on category-level questions. Does Ethereum L2 activity aggregate to a few winners or fragment further? Do tokenized RWAs settle on public L2s or migrate to private chains? Does the Arbitrum DAO turn on fee capture? Cryptopolitan projects a 2026 high near $0.31; Coinpedia sees $0.70 to $1.20; Changelly’s multi-year model reaches $6 by 2030. Our own base case for late-2027 is $0.55, with a bull scenario of $1.10 if RWAs and Orbit both scale.

    • Bear: $0.15
    • Base: $0.55
    • Bull: $1.10

    How Does Arbitrum Compare to Optimism?

    Arbitrum and Optimism are the two original optimistic rollups, but their strategies have diverged. Arbitrum bets on deep DeFi liquidity and Orbit L3s. Optimism bets on the Superchain, a shared-sequencer alliance that includes Base, World Chain, Mode, Zora, and Sonic.

    Metric Arbitrum (ARB) Optimism (OP)
    TVL (settlement layer) ~$16.9B ~$0.9B
    L2 Market Share ~44% ~3%
    Custom Execution Stylus (Rust, C, C++) EVM-only
    App-Chain Stack Arbitrum Orbit OP Stack / Superchain
    Flagship App-Chain Robinhood Chain Base (Coinbase)
    Revenue to Token DAO treasury only DAO treasury only
    Governance Model Arbitrum DAO Optimism Collective

    Both tokens have the same fundamental problem, they govern but do not capture. The difference is Arbitrum has 18x the DeFi liquidity to bargain with when the fee-capture debate finally gets serious. If you believe DeFi settlement value is where L2 tokens eventually accrue, ARB has the stronger hand. If you believe the future is consumer apps, OP’s Superchain is the better structural bet.

    What Would Change Our View

    Three explicit triggers that would move our base case up or down:

    • Upgrade to bull ($0.60+): The Arbitrum DAO passes a fee-switch or a formal ARB buyback funded by sequencer revenue in the next two quarters.
    • Upgrade further to $1+: A second Robinhood-scale enterprise (a major broker, exchange, or bank) launches an Orbit L3 with revenue share to the DAO.
    • Downgrade to bear ($0.10 or below): ETH breaks $2,000 to the downside and the overall L2 category loses more than 20% of TVL over 60 days. Or the September unlock recipients hit the bid harder than expected and volume dries up below $30M daily for two weeks.

    Frequently Asked Questions

    Is Arbitrum (ARB) a good investment in 2026?

    ARB is a high-risk asymmetric bet. The chain leads all Ethereum L2s in TVL and has real fee-generating catalysts through Robinhood Chain and Orbit. The token itself does not yet capture sequencer revenue, so it trades on governance value and hope. Suitable for investors comfortable with L2 volatility and structural unlock pressure through 2027.

    Will Arbitrum reach $1 in 2026?

    Reaching $1 in 2026 requires ARB to gain roughly 530% from current levels of $0.158. Our base case does not project $1 until 2027 at the earliest, and only in a bullish scenario where the DAO passes fee capture and Orbit adoption compounds. Coinpedia targets $0.70 to $1.20; most other analysts stay below $1.

    Why did Arbitrum go up today?

    ARB rallied roughly 17% on September 16, 2026, driven by three factors: record Robinhood Chain DEX volume ($874.8M on August 30), the ArbOS 61 “Elara” upgrade shipping on August 20, and heavily oversold positioning after months of decline. Unique daily wallets climbed 36% in 24 hours, confirming real demand.

    What is the Arbitrum price prediction for 2026?

    Analyst 2026 targets range widely, from $0.06 (bearish) to $1.20 (bullish). Cryptopolitan projects a high of $0.31, Coinpedia sees $0.70 to $1.20, and Flitpay models an average of $0.17. Our base case lands at $0.32 with a bull scenario at $0.55, assuming the September unlock is absorbed and Orbit adoption continues.

    Is the ARB token unlock bearish?

    Yes, in the near term. The September 23, 2026 unlock releases about 139 million ARB (1.4% of supply), of which 53.8% goes to team and insiders and 35% to private investors. Monthly unlocks continue through 2027. Expect concentrated sell pressure in the two weeks around each unlock date, followed by relief rallies if buyers absorb the supply.

    How does Arbitrum make money?

    Arbitrum generates revenue through sequencer fees (users pay to submit transactions), MEV capture, and revenue share from Orbit L3 chains like Robinhood Chain. Currently, most of this revenue flows to the Arbitrum Foundation and DAO treasury rather than to ARB token holders directly, which is the central governance debate for 2026 and 2027.

    The Honest Take

    Arbitrum is the strongest Layer 2 chain by fundamentals with one of the weakest performing L2 tokens. That gap is the trade. If you believe the DAO eventually turns on fee capture, or that Orbit revenue growth forces the market to price ARB on earnings rather than governance vibes, today’s price is a coiled spring. If you believe governance tokens without cash flows never rerate no matter what the underlying chain does, ARB is a $0.10 asset with periodic 50% rips.

    Our position: the setup is favorable through Q1 2027 if the Robinhood Chain flywheel keeps compounding and the DAO shows any signal on fee capture. The September unlock is a real risk but a known one, and known risks usually get priced in early. A $0.55 target 12 to 18 months out is a 3.5x from here. Not a lottery ticket, but a defensible base case for a top-3 L2 rebuilding a bid.

    The chain works. The upgrade shipped. Robinhood is a real customer. Now the market has to decide whether the token is allowed to reflect any of that. For related coverage, see our Uniswap (UNI) fee-switch analysis (same governance-without-cash-flow debate), our earlier July ARB writeup at the $0.25 target, and the Aave review covering the largest lender on Arbitrum. External data via Arbitrum Foundation and CoinMarketCap.

    Disclaimer: This article is for informational and educational purposes only and should not be construed as financial, investment, or trading advice. Cryptocurrency markets are highly volatile, and past performance does not guarantee future results. The price predictions and analyses presented here are based on AI models, technical indicators, and available data at the time of writing. They are not guarantees. Always conduct your own research (DYOR) and consult with a qualified financial advisor before making any investment decisions. Pump Parade and its authors do not assume liability for financial losses incurred based on information provided in this article.

    Aave Review 2026: Fees, Features & Is It Worth It?

    0

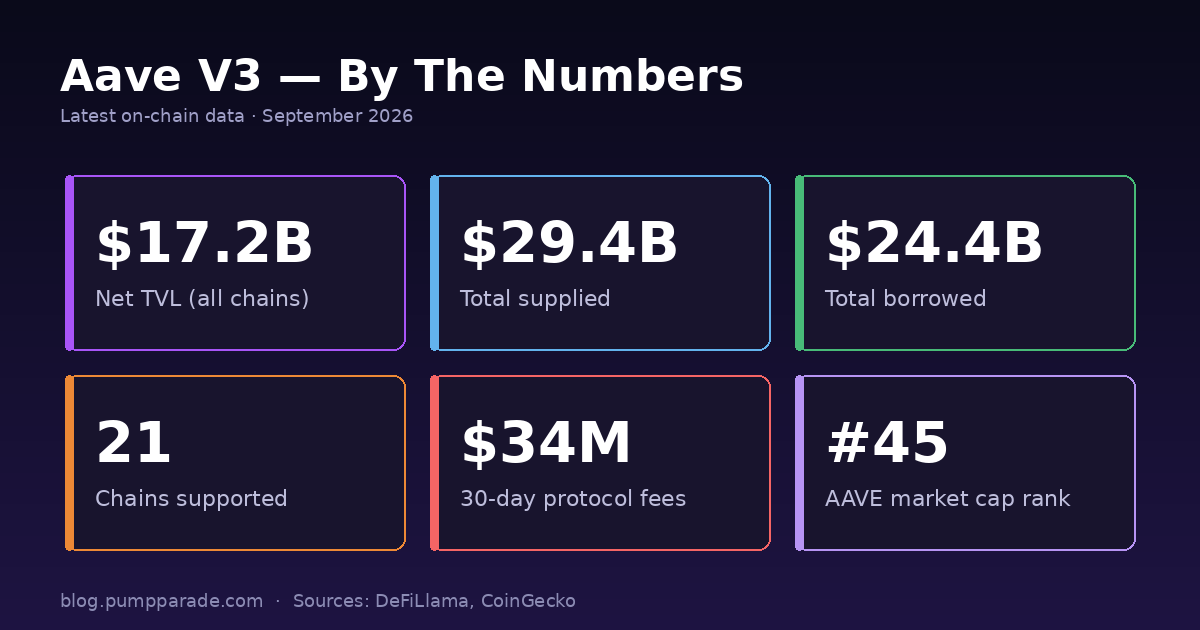
    Looking for the safest, deepest lending pool in DeFi? Aave has been the answer for most of the last five years, and in 2026 it is still the biggest lending protocol in crypto by a wide margin. With $17.2 billion in net TVL, $29.4 billion supplied across 21 chains, and a fresh V3 stack that finally makes cross-chain borrows feel native, Aave is where serious DeFi capital parks itself. But is it the right home for your capital in 2026, or are leaner, faster, higher-yield competitors quietly eating its lunch? This review breaks down fees, features, security, UX, and where Aave still wins versus where it is starting to lose ground.

    Quick verdict: is Aave worth using in 2026?

    Overall rating: 4.6 / 5. Aave is the default choice for anyone who values battle-tested security and deep liquidity over squeezing out the last basis point of yield. Suppliers get 3-9% on stablecoins depending on the chain, borrowers get some of the tightest interest rate curves in DeFi, and the protocol has never suffered a smart-contract exploit in its main markets. The main knocks: Ethereum gas is still painful for smaller users, and newer protocols like Morpho and Fluid offer meaningfully better rates on some pairs. If you have five figures or more to deploy and prioritize safety, Aave is still the winner. If you are farming with smaller size and chasing max APY, you should at least compare it against alternatives.

    Visit Aave

    What is Aave?

    Aave is a decentralized lending and borrowing protocol that lets users supply crypto assets to earn yield or borrow against those assets as collateral. It launched in January 2020 as a rebrand of ETHLend, and quickly became the largest money market in DeFi. In 2026 the protocol runs on 21 chains including Ethereum, Base, Arbitrum, Optimism, Polygon, Avalanche, Sonic, Plasma, Monad, and MegaETH, with Ethereum still hosting roughly 84% of total value locked.

    The current version is Aave V3, which introduced isolation mode, efficiency mode (E-Mode), risk-adjusted borrow caps, and Portal, the cross-chain liquidity feature. Aave V4 is on the horizon with a unified liquidity layer and a new “Hub and Spoke” architecture, but V3 is what most users touch today.

    Aave V3 key statistics: TVL, supplied, borrowed, chains supported, protocol fees, market cap rank

    Aave by the numbers (September 2026)

    • Net TVL: $17.2 billion
    • Total supplied: $29.4 billion
    • Total borrowed: $24.4 billion
    • Chains live: 21 (Ethereum still hosts $14.5B)
    • 30-day protocol fees: $34 million
    • All-time protocol fees: $1.83 billion
    • AAVE token price: $127.54
    • AAVE market cap: $1.97 billion (rank #45)

    Data as of September 2026, per DeFiLlama and CoinGecko.

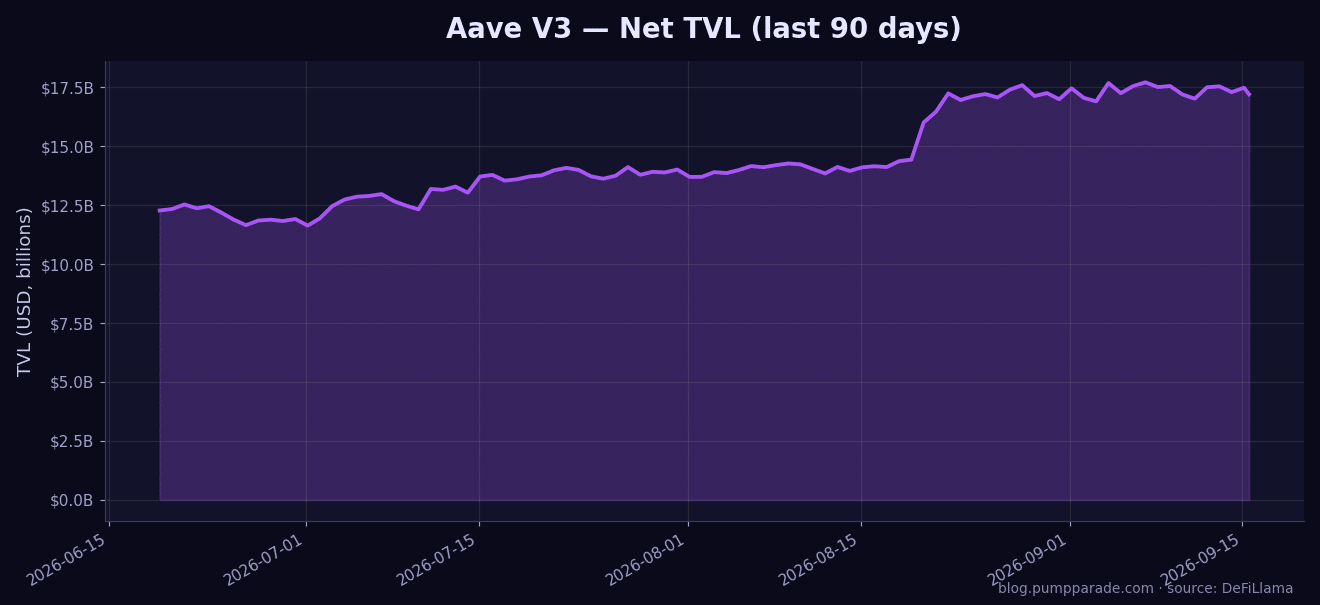
    Aave V3 net TVL over the last 90 days

    How Aave actually works

    Aave is what DeFi people call an “overcollateralized money market.” You deposit an asset (say, ETH), the protocol issues you an interest-bearing aToken 1:1 (aETH), and you can then borrow another asset up to a percentage of your collateral value. Rates are algorithmic: they rise when utilization is high (lots of borrowing demand) and fall when utilization is low (lots of idle supply).

    Three features distinguish Aave from generic forks:

    • E-Mode (Efficiency Mode): When your collateral and borrowed asset are correlated (e.g. stablecoin-to-stablecoin, or ETH-to-LST), you can borrow up to 93% of collateral value instead of the standard 75-80%. This is the biggest reason yield strategies still route through Aave.
    • Isolation Mode: New, riskier assets get listed with strict debt ceilings and can only be used to borrow specific stablecoins. This lets Aave onboard long-tail collateral without threatening the whole protocol.
    • GHO: Aave’s native overcollateralized stablecoin. Borrowers can mint GHO against their Aave collateral at a discount if they stake AAVE, and 100% of the interest goes to the DAO treasury. GHO’s circulating supply is now over $250 million.

    Aave app dashboard showing supplied, borrowed, and net worth

    Fees and pricing: what you actually pay

    Aave itself does not charge a deposit or withdrawal fee. The economics come from the spread between supply APY and borrow APY, which the protocol keeps as reserve factor revenue.

    Representative rates from the Ethereum V3 market in September 2026:

    • USDC: supply ~4.1%, borrow ~5.3% (variable)
    • USDT: supply ~4.3%, borrow ~5.6%
    • DAI: supply ~3.9%, borrow ~5.1%
    • ETH: supply ~1.8%, borrow ~2.7%
    • wstETH: supply ~0.4% (yield is in the LST itself), borrow ~0.5% in E-Mode
    • WBTC: supply ~0.3%, borrow ~1.5%

    Aave also charges a flash loan fee of 0.05% (5 basis points), which is the cheapest flash loan fee among major money markets. Liquidations carry a 5-10% bonus paid to the liquidator, and if you get liquidated on Ethereum V3 you also owe a 4-9% liquidation protocol fee.

    The real cost most users forget: gas. A supply on Ethereum V3 currently runs $8-25 depending on network conditions. On Base or Arbitrum, the same transaction costs under $0.20. For anything under $10,000, use an L2.

    Security and trust

    Aave is the closest thing DeFi has to a blue chip. Track record highlights:

    • Live since January 2020, over six years without a smart-contract exploit in its core markets.
    • Audited by Certora, OpenZeppelin, Trail of Bits, ABDK Consulting, and Peckshield, with two audits listed on DeFiLlama.
    • Formal verification via Certora on the V3 codebase.
    • Aave Safety Module: over $400M of staked AAVE and stkGHO acting as a first-loss backstop for the protocol.
    • The one meaningful incident was a bad debt situation in November 2022 involving CRV, which was ultimately absorbed by the treasury without user losses.

    The DAO governance process is one of the most active in DeFi, with Aave Companies (formerly Aave Labs, now BGD Labs) handling core dev and dozens of external contributors running risk, growth, and integrations.

    User experience: how it feels to actually use

    The Aave app is one of the cleanest UIs in DeFi. Connect a wallet, pick a market (Ethereum, Base, Arbitrum, etc.), and you see all supply and borrow options in a single dashboard with your health factor prominently displayed. Health factor above 1.0 means you are safe from liquidation; drop below 1.0 and any liquidator can close a portion of your position.

    Small quality-of-life wins that matter:

    • One-click “supply and enable as collateral” flow.
    • Built-in swap and collateral-swap features (routed through Paraswap) so you can rebalance without leaving the app.
    • E-Mode is a single toggle, and the app clearly warns you which assets are eligible.
    • Mobile web works fine, and there is a well-reviewed Aave Wallet mobile app for iOS and Android that includes native lending and borrowing.

    What still frustrates:

    • Cross-chain positions are shown per market. There is no single unified dashboard yet showing all your positions across all 21 chains. V4 is supposed to fix this.
    • Transaction previews on Ethereum still surprise users with $15+ gas costs when the app said “estimated $3.”
    • Some newer L2s show stale rate data for a few minutes after big rate changes.

    Pros

    • Largest and deepest lending pool in DeFi. You can borrow $50M+ on Ethereum without moving the rate meaningfully.
    • Six-year unblemished security record on the main markets.
    • 21 chains supported, with real liquidity on Base, Arbitrum, and Optimism (not just an empty deployment).
    • E-Mode gives you 93% LTV on correlated pairs, one of the best capital efficiencies in DeFi.
    • Cheapest flash loans in the market (5 bps).
    • GHO stablecoin adds a native, capped-supply borrowing option.
    • Active, credible DAO governance with real accountability.

    Cons

    • Rates are often 20-80 basis points lower than Morpho or Fluid for suppliers on the same pairs, because those protocols route directly to peers.
    • Ethereum gas costs still make small deposits (~$500 or less) economically silly.
    • AAVE token has weak direct value accrual today. Most protocol fees still go to the DAO treasury rather than back to token holders, though the “Aavenomics” upgrade is meant to change this.
    • The interface is dense; new users can find the health factor and liquidation mechanics intimidating.
    • Cross-chain UX is still fragmented; V4 is not live yet.

    Aave vs the competition

    The lending space has fragmented since 2023. Here is where Aave stands against its biggest 2026 competitors:

    • vs Morpho: Morpho routes lenders and borrowers peer-to-peer and often beats Aave rates by 30-70 bps. But Morpho depends on Aave-style pools as backstops, and TVL is under $6B versus Aave’s $17B. Aave wins on depth and pedigree; Morpho wins on rates.
    • vs Compound: Compound V3 is smaller (~$2B TVL), simpler, and USDC-only per market. If you only want to borrow USDC against ETH, Compound is fine. For anything else, Aave has more assets and better rates.
    • vs Fluid: Fluid (from the Instadapp team) is the fastest-growing lending challenger with a unified vault design that offers higher LTV and better rates on ETH pairs. It is a real threat to Aave on Ethereum, but has minimal cross-chain presence.
    • vs Solana-native protocols (Kamino, marginfi, Drift): If you live on Solana, these are cheaper and faster. Aave has no Solana deployment. See our Kamino vs marginfi review for the Solana side.

    Who should use Aave?

    Use Aave if: you have $10K+ to deploy, you want max security, you need deep liquidity for large borrows, you want to leverage LSTs or LRTs via E-Mode, or you want to mint GHO. It is also the best choice if you plan to use flash loans, since they are cheapest here.

    Skip Aave if: you are farming under $1,000 on Ethereum (gas eats you alive, use an L2), you want the absolute best rate on a specific stablecoin pair (check Morpho), or you are Solana-native (use Kamino or marginfi).

    Verdict

    Aave in 2026 is what “boring” looks like in DeFi, and boring is a compliment. The rates are not always the highest, but they are consistent, the liquidity is real, and the code has held up through five years of exploits that took down almost every competitor at some point. For most users with meaningful capital, Aave should be your first stop and probably your last. Just deploy on an L2 unless your position is large enough to justify Ethereum gas.

    Final rating: 4.6 / 5.

    Visit Aave · Curious where the AAVE token itself is headed? Read our AAVE price prediction for 2026.

    FAQ

    Is Aave safe to use in 2026?

    Aave has one of the strongest security track records in DeFi, with no smart-contract exploits in its core markets since launching in 2020. Multiple audits from Certora, OpenZeppelin, and Trail of Bits, formal verification, and a $400M+ Safety Module backstop the protocol. No lending protocol is risk-free, but Aave is as close as DeFi gets.

    What is the minimum deposit on Aave?

    There is no protocol-level minimum, but on Ethereum you should have at least $1,000-$5,000 for gas costs to make sense. On Base, Arbitrum, or Optimism, you can profitably supply from as little as $50 because gas is under $0.20 per transaction.

    How does Aave make money?

    Aave keeps a “reserve factor” (typically 10-25%) of the interest paid by borrowers. In the last 30 days that generated $34 million in protocol revenue, all flowing to the DAO treasury. GHO borrowing fees also accrue to the DAO.

    Do I earn AAVE tokens for supplying?

    Aave does not run a continuous liquidity mining program on the main pools in 2026, though the DAO occasionally votes on targeted incentive campaigns for new chains or assets. Your primary yield comes from supply APY, not token emissions.

    What is the difference between Aave V3 and V4?

    V3 (current) uses separate pools per chain, with Portal for cross-chain liquidity. V4 (coming in 2026) introduces a unified “Hub and Spoke” liquidity layer where a single Ethereum-based hub sources liquidity for all deployments, plus a redesigned rate model. V4 is not live yet. Anything you deposit today is V3.

    Can I use Aave without owning AAVE tokens?

    Yes. You do not need to hold AAVE to supply or borrow. Holding and staking AAVE only matters if you want to vote in governance, earn Safety Module rewards, or get a GHO borrow discount.

    Aster (ASTER) Price Prediction 2026: Can ASTER Reclaim $2?

    0

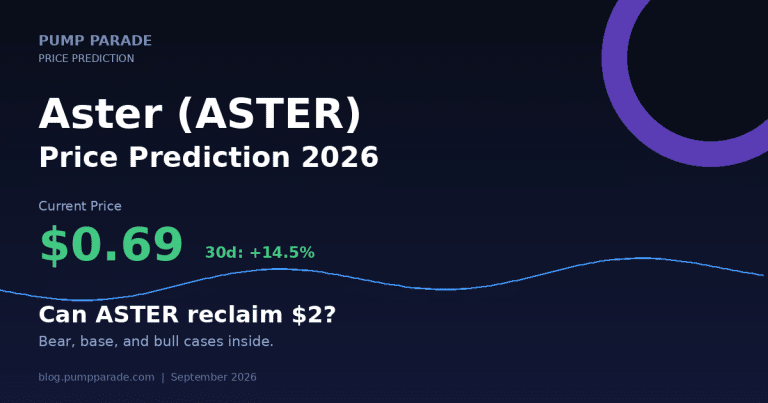
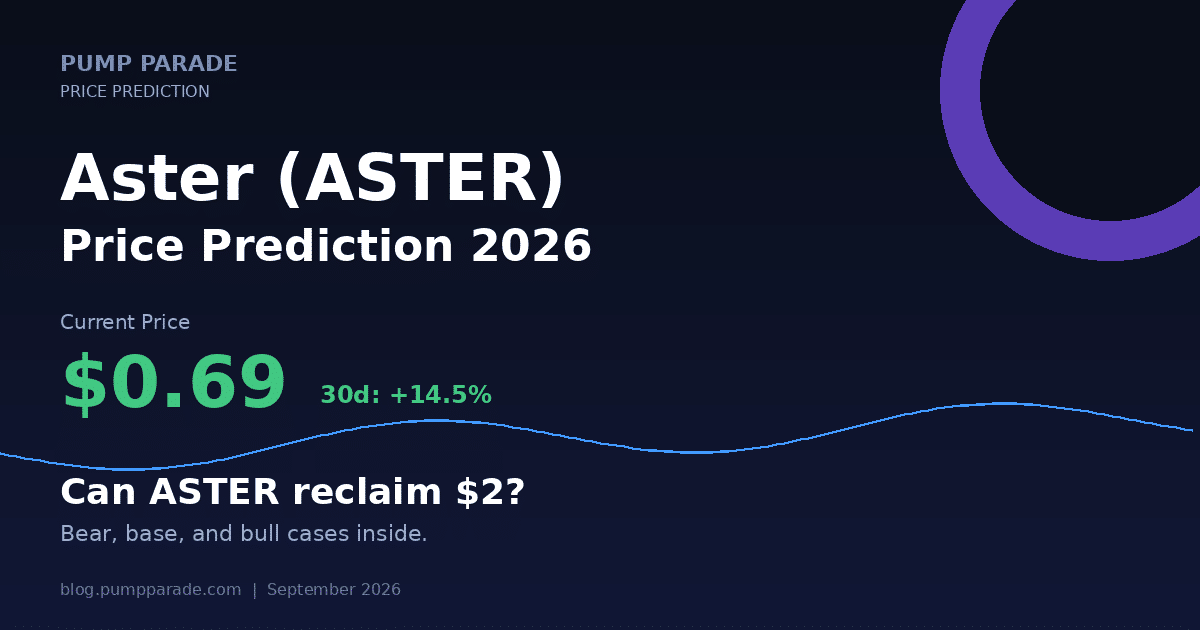
    Aster (ASTER) trades at $0.69, sitting 71% below its September 2025 all-time high of $2.41. The CZ-linked perpetual DEX that once briefly outpaced Hyperliquid in daily volume has settled into a slower grind, up 14% over the past 30 days but still down 10% on the week. The Aster price prediction 2026 question is simple: can the fastest-growing perp DEX challenger take enough share from Hyperliquid to justify a $2+ token, or does dilution keep it closer to $1?

    ASTER is not a memecoin. It is a revenue-linked token backing a real product that processed more than $2.4 billion in trading volume in its first days live. But the launch euphoria is over. The Aster token now trades on fundamentals: platform fees, open interest, buyback velocity, and whether the supply reduction plan from 8 billion to 3 billion tokens actually materializes. For context on how the perp DEX category is structured, see our deeper review of Drift Protocol, which sits alongside Aster in the second tier of on-chain perp venues.

    Here is what the data says, what analysts from Coinpedia, TradersUnion, and Coinbase are modeling, and the bear, base, and bull cases for ASTER through 2026 and into 2027.

    Key Takeaways

    • ASTER trades near $0.69 with a $1.86B market cap, ranked #46, and sits 71% below its $2.41 ATH set in September 2025.
    • Aster DEX is the fastest-growing perp DEX challenger, but Hyperliquid still commands roughly 70% of on-chain perp open interest as of Q1 2026.
    • Analyst 2026 targets vary widely: conservative models point to $0.70 to $0.84, while Coinpedia sees a bullish path to $3.50.
    • Base case for ASTER in 2026 is $1.20 to $1.80 if buybacks accelerate and open interest doubles from current levels near $900 million.
    • Bull case requires Aster taking measurable market share back from Hyperliquid, plus the token supply cut from 8B to 3B being executed on schedule.
    • Bear case is $0.35 to $0.50 if unlocks front-run buybacks and monthly volume slips below $50 billion.
    Aster (ASTER) price prediction 2026 hero graphic, current price $0.69, can ASTER reclaim $2 as Hyperliquid challenger

    Where Aster Stands Today

    The current ASTER snapshot, pulled from CoinGecko and Aster’s own on-chain metrics, tells a mixed story. The token has recovered from post-launch lows but remains far below the September 2025 top. Volume is healthy but no longer eye-popping. Circulating supply is only about 34% of the max, which sets up a multi-year unlock overhang.

    Metric Value
    Price $0.69
    24h change -1.3%
    7d change -10.5%
    30d change +14.5%
    Market cap $1.86B
    24h volume $83M
    Market cap rank #46
    All-time high $2.41 (Sep 24, 2025)
    % from ATH -71.4%
    Circulating / Max supply 2.70B / 8.00B

    The token launched on September 17, 2025, and ripped 1,500% in its first week as traders piled into the newest perp DEX narrative. Then the mean reversion started. Once the initial hype cooled, ASTER settled into a range and has traded between roughly $0.55 and $0.90 for most of 2026. That is the range the bear and bull cases below are anchored against.

    Why is ASTER range-bound right now?

    Three forces are pinning the price. First, Hyperliquid reasserted its dominance quickly. By January 2026, HYPE processed roughly $40.7 billion in weekly trading volume, and by March 2026, Hyperliquid controlled more than 70% of open interest in decentralized perpetual markets, according to Atomic Wallet’s 2026 perp DEX overview. Aster is firmly in second, but second in a winner-take-most market is a hard sell.

    Second, the fee-buyback flywheel is still ramping. Aster’s model routes a share of platform fees to daily ASTER buybacks and staker rewards. That works when volume is high. It sputters when volume compresses. Aster’s average open interest sits near $899.7 million against Hyperliquid’s $5.15 billion, so the raw fuel for buybacks is roughly one-fifth of the leader.

    Third, and most important, is dilution. Only about 2.7 billion of the 8 billion max supply is circulating. Even with an aggressive supply reduction plan (see the bull case), token holders live under a persistent unlock cliff that suppresses upside during quiet weeks. Every rally has to absorb a fresh wave of freed tokens.

    The Bull Case for Aster

    Aster Chain and privacy-first execution

    Aster is not just another perp DEX front-end. The team shipped Aster Chain, a purpose-built L1 focused on privacy features that CEX and existing DEX users cannot get elsewhere: hidden orders, MEV protection, and multi-chain settlement. If Aster Chain graduates from testnet into a real fee-generating settlement layer in 2026, ASTER captures L1 rent on top of DEX revenue. That is a fundamentally different token narrative than a pure exchange coin, and it opens the door to ETH-style value accrual arguments.

    The supply reduction plan

    Aster’s team has publicly committed to reducing max supply from 8 billion to 3 billion tokens, cutting future dilution by more than half. That is the single biggest lever in the entire model. If executed on schedule, fully diluted valuation compresses meaningfully, and the token starts to look cheap relative to platform revenue rather than expensive relative to a bloated future float. Investors should watch the on-chain burn transactions and governance votes over the next two quarters.

    Extreme leverage and product velocity

    Aster offers up to 1001x leverage on select markets, well above what most competitors will touch. That is a niche product decision, but it maps directly to a specific trader profile: high-frequency degen leverage traders who generate outsized fees. It also gives Aster a wedge against Hyperliquid, which has historically stayed more conservative. If Aster can defend that niche and build sticky routines around it, volume per active user stays high.

    The Bear Case for Aster

    Hyperliquid’s lead is widening, not narrowing

    The most direct threat to any ASTER bull thesis is that Hyperliquid keeps winning. Its HYPE token has been one of the strongest large-cap performers in the sector, and its market share in on-chain perps has grown, not shrunk, since Aster’s launch. Second place in a network-effect business is not always a durable position. If Hyperliquid ships its own privacy features or matches Aster’s leverage tiers, the wedge closes.

    Unlock schedule and insider concentration

    With only 34% of max supply in circulation, ASTER faces years of scheduled unlocks. Concentration risk is real, and if insiders distribute into strength, rallies get capped quickly. The supply reduction plan helps, but only after execution, and execution is not complete.

    Regulatory pressure on high-leverage venues

    Offering 1001x leverage attracts regulators. Multiple jurisdictions have tightened rules on retail perpetual futures, and even offshore venues face growing pressure from banking rails and stablecoin issuers. Aster’s core product is exactly the kind of thing that draws attention. A single high-profile enforcement action against a comparable venue could force Aster to cap leverage or geoblock users, both of which would compress fees.

    Aster Price Prediction 2026: Targets by Timeframe

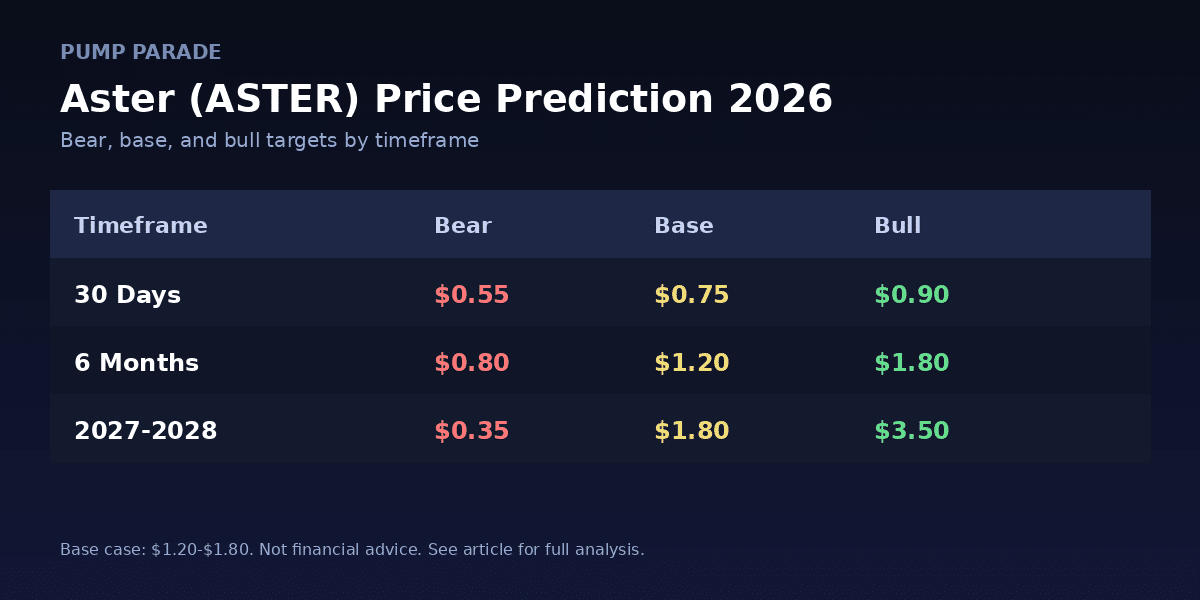
    Aster ASTER price prediction 2026 targets table, bear $0.40, base $1.40, bull $2.50

    Rather than one point estimate, here are three scenarios with the conditions that would trigger each. Every target below assumes normal market conditions, no major exchange failures, and a Bitcoin range broadly consistent with its current $77K level.

    Next 30 days: $0.55 to $0.95

    Short term, ASTER is a range trade. The 30-day setup favors a grind higher if Aster reports rising weekly open interest and a new all-time high in monthly volume. Bear case in the next month is a retest of the summer 2026 lows near $0.55 if broader risk assets weaken. Base case is $0.75, roughly the 30-day mean. Bull case is a reclaim of $0.90, which would set up a longer trend change.

    6 months (Q1 2027): $0.80 to $1.80

    Six-month targets bracket the range where most analyst models converge. TradersUnion’s statistical model projects $0.81 to $0.84 by year-end 2026 on a conservative growth curve. Coinbase and Kraken both anchor near $0.70 using 5% annual growth models, which is a floor, not a forecast. Our base case sits at $1.20 in this window, assuming Aster grows monthly volume 40% and the first tranche of the supply cut executes cleanly.

    Long term (2027 to 2028): $0.35 to $3.50

    The long-term range is wider because the outcome depends on structural questions that are still open: does Aster Chain ship and gain real usage, does the supply reduction fully execute, and does Hyperliquid’s lead compress or extend? Coinpedia’s bullish 2026 range of $1.00 to $3.50 assumes rapid platform growth. Our bear case of $0.35 assumes a slow-motion loss of relevance to Hyperliquid plus persistent unlock pressure. Base case of $1.80 lines up with a scenario where Aster stays a strong number two and captures 20% to 25% of on-chain perp volume.

    How does Aster compare to Hyperliquid?

    ASTER is inseparable from its comparison to HYPE. The two tokens back the same product category, and traders and analysts price them relative to each other. For a live look at the leader’s own trajectory, see our Hyperliquid HYPE price prediction for 2026. Here is the head-to-head:

    Metric Aster (ASTER) Hyperliquid (HYPE)
    Price $0.69 $79.20
    Market cap $1.86B $17.62B
    Market cap rank #46 #10
    Avg open interest ~$900M ~$5.15B
    Approx market share (perps OI) ~15% ~70%+
    Max leverage 1001x 50x
    Native L1 Aster Chain (early) HyperEVM (live)
    Token model Fee buybacks, supply cut planned Fee buybacks, deflationary

    The clean read: Hyperliquid is the incumbent with a bigger book and a more mature settlement layer. Aster is the challenger with a more aggressive product spec and a smaller cap that leaves more room to grow in percentage terms. If you believe on-chain perps as a category expand meaningfully, both tokens can work. If you believe the space consolidates around one leader, HYPE has the stronger position.

    Will ASTER reach $2 by end of 2026?

    Reclaiming the $2.41 all-time high in 2026 is possible but not the base case. Getting there requires three things happening in sequence: Aster’s monthly volume needs to break above $100 billion consistently, the supply cut from 8B to 3B needs to be at least half executed, and broader crypto market conditions need to be at least as constructive as they are today. A partial version of that, roughly $1.50 to $1.80, is a more realistic bull outcome and still delivers a 2x from here.

    What Would Change Our View

    The base case above rests on assumptions. Here are the three specific triggers that would move us more bullish or more bearish:

    Bullish trigger: Aster reports two consecutive months of open interest above $1.5 billion AND executes a verifiable on-chain supply burn representing at least 20% of the planned reduction. That combination materially changes the token math.

    Bearish trigger: Hyperliquid’s share of on-chain perp OI expands above 80% for a full quarter while Aster’s monthly volume drops below $30 billion. That would signal the challenger narrative is failing.

    Wildcard: A CEX listing tier upgrade (Coinbase spot, for example) or the launch of an Aster ETF filing by a major issuer would each be worth at least a 40% rerating on their own.

    Frequently Asked Questions

    Will Aster (ASTER) reach $2 in 2026?

    Reaching $2 in 2026 is a bull case, not a base case. It would require sustained monthly volume above $100 billion, verifiable execution of the supply reduction from 8 billion to 3 billion tokens, and Aster taking real market share back from Hyperliquid. Our base case for end of 2026 is closer to $1.20 to $1.80.

    Is Aster crypto a good investment in 2026?

    ASTER is a high-volatility, high-risk bet on a real product with a revenue-linked token model. It is not suitable for conservative investors, and it depends heavily on execution against Hyperliquid. For traders comfortable with concentrated exposure and unlock risk, it offers asymmetric upside if the supply cut executes and volume growth continues.

    Can ASTER overtake Hyperliquid?

    Overtaking Hyperliquid by open interest and volume in 2026 looks unlikely based on current trends. Hyperliquid controls more than 70% of on-chain perp OI and its lead has widened, not narrowed, since Aster’s launch. Aster can grow into a durable number two, but flipping the leader is a multi-year proposition that would require a specific catalyst.

    What is Aster’s maximum token supply?

    Aster’s current max supply is 8 billion ASTER tokens, with circulating supply near 2.7 billion. The team has committed to reducing max supply to 3 billion through buybacks and burns. Execution of that plan is the single most important variable in the token’s long-term valuation model.

    Is Aster better than Hyperliquid?

    Better depends on the user. Aster offers up to 1001x leverage, privacy features, and a smaller-cap token with more percentage upside. Hyperliquid offers deeper liquidity, a more mature L1 in HyperEVM, and roughly 70% market share of on-chain perps. For most traders, Hyperliquid is the safer default. For those seeking asymmetric bets, Aster is the higher-beta play.

    Where can I buy ASTER?

    ASTER is available on major centralized exchanges including Binance, KuCoin, MEXC, and Gate, as well as on Aster DEX itself. Because ASTER trades primarily on BNB Chain contracts, on-chain purchases require a BNB Chain-compatible wallet. If you are considering a BNB Chain wallet, our Phantom wallet review for 2026 covers the multi-chain options available for perp DEX traders. Always verify contract addresses via CoinGecko before trading.

    The Honest Take

    ASTER is a compelling story with a hard ceiling. The product is real, the revenue model is real, and the challenger narrative is real. But being second in a network-effect market is a structurally uncomfortable place to sit, and the token faces years of supply pressure that only aggressive execution can offset.

    The base case is that ASTER grinds to $1.20 to $1.80 by end of 2026, which is a respectable return from here but not the 3x-4x that launch-week buyers were pricing in. The bull case of $2+ requires nearly everything going right, including catalysts that are not yet on the calendar. The bear case of $0.35 to $0.50 is not extreme; it is what happens if unlocks front-run buybacks and Hyperliquid keeps taking share.

    For traders who like asymmetric bets and can stomach 30% drawdowns, ASTER is worth monitoring. For lower-risk perp DEX exposure, Hyperliquid remains the cleaner large-cap play. Serious positions should watch on-chain burn transactions and monthly OI prints more than the daily chart.

    The probability favors ASTER staying below $2 through most of 2026 with a real shot at reclaiming it if the supply reduction executes on schedule. That is the trade.

    Disclaimer: This article is for informational and educational purposes only and should not be construed as financial, investment, or trading advice. Cryptocurrency markets are highly volatile, and past performance does not guarantee future results. The price predictions and analyses presented here are based on AI models, technical indicators, and available data at the time of writing, they are not guarantees. Always conduct your own research (DYOR) and consult with a qualified financial advisor before making any investment decisions. Pump Parade and its authors do not assume liability for financial losses incurred based on information provided in this article.

    XRP Price Prediction 2026: Can XRP Reclaim $3?

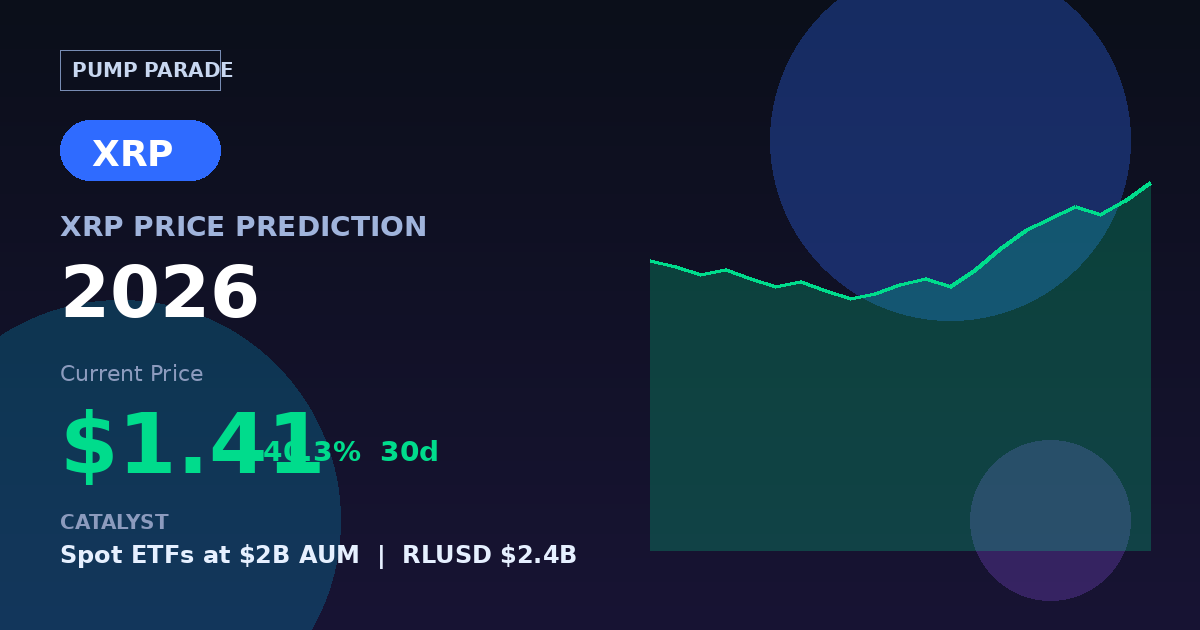
    XRP is trading at $1.41, up 4.6% in the last 24 hours and up more than 40% in the past month. That is the sharpest rally the fifth-largest cryptocurrency has produced since its post-ETF push in late 2025. So the question every serious buyer is asking today is simple: is this the start of a proper XRP price prediction 2026 story that reclaims $3, or another false dawn that fades back to the $1 handle?

    The setup is different this time. Seven US spot XRP ETFs are now trading, cumulative net inflows sit near $1.7 billion, and Ripple’s own dollar stablecoin RLUSD has quietly grown to $2.4 billion in circulation. Institutional plumbing that did not exist in the last cycle is now live. The bearish case has not disappeared: monthly escrow releases still add fresh supply, and the CLARITY Act vote on September 15 could reset every regulatory assumption baked into current prices.

    This article walks through where XRP stands today, the three catalysts that could push it to $3, the three risks that could pin it below $2, comparable targets from Standard Chartered and Changelly, a scenario table by timeframe, and a head to head with Stellar. The honest take arrives at the end.

    Key Takeaways

    • Price now: XRP $1.41, up 40% over 30 days, still 61% below its July 2025 all time high of $3.65.
    • Base case for 2026: $2.40, driven by continued ETF inflows and RLUSD adoption. Bear case $0.95. Bull case $3.20.
    • Biggest bull catalyst: Spot ETF flows have reached $1.7 billion cumulative in ten months, with Goldman Sachs now the largest reporting holder.
    • Biggest bear risk: Ripple releases 1 billion XRP monthly from escrow; September’s tranche has already hit the market.
    • Watch September 15: The US Senate’s CLARITY Act test vote is the single largest binary event for XRP this quarter.
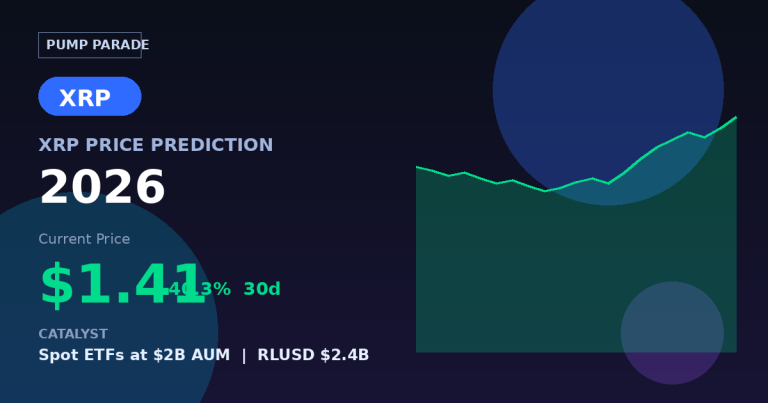
    XRP (XRP) price prediction 2026 hero graphic showing current price $1.41 with spot ETF and RLUSD catalyst

    Where XRP Stands Today

    Before we forecast anything, we need to anchor the current numbers. Live data pulled from CoinGecko at time of writing:

    Metric Value
    Price $1.41
    24h change +4.59%
    7 day change +0.62%
    30 day change +40.27%
    Market capitalization $88.34 billion
    24h trading volume $1.84 billion
    Market cap rank #5
    All time high $3.65 (July 17, 2025)
    Distance from ATH -61.5%
    Circulating supply 62.88 billion XRP
    Max supply 100 billion XRP

    Two numbers deserve attention. First, the 30 day move of 40% has re-rated XRP faster than any other top ten asset over the same window. Second, the gap between spot price and the July 2025 ATH is 61%, which means a full reclaim of $3.65 would require another 159% from here. That is a meaningful lift, but it is not unprecedented for XRP: the token ran from $0.50 to $3.40 in eight weeks during late 2024.

    Why Is XRP Rallying Right Now?

    The 40% monthly move did not come from nowhere. Three flows have combined to bid the token higher.

    The first is spot ETF creation. According to weekly flow data, US spot XRP ETFs pulled in $18.98 million net last week and now hold roughly $2 billion in combined assets across seven funds. (For a comparable ETF-driven story on another top ten asset, see our DOGE ETF flow analysis.) Franklin Templeton’s XRPZ, Canary Capital’s XRPC, and Bitwise’s XRP fund are the top three by cumulative subscriptions. Passive vehicle demand has become a persistent, price-insensitive buyer.

    The second is stablecoin scale. RLUSD, Ripple’s dollar backed stablecoin, has grown from $1.76 billion to $2.42 billion in circulation in under a month, adding LMAX Group and Convera as institutional integrations. Every dollar of RLUSD demand indirectly signals XRPL usage, since the stablecoin settles on the same ledger.

    The third is regulatory relief. Ripple’s long running dispute with the SEC has cleared, and the company has now pivoted to lobbying: it hosted its Stablecon USA event in Washington DC in early September, positioning itself for the Senate’s CLARITY Act test vote on September 15. Traders read that as an increased probability of a friendlier US framework, which lifts every asset with US institutional exposure.

    Can XRP Really Hit $3 This Cycle? The Bull Case

    ETF inflows keep compounding

    Passive ETF demand is the cleanest bull thesis on the board. Cumulative net inflows crossed $1.7 billion in ten months, and Goldman Sachs quietly disclosed roughly $87 million in XRP ETF exposure last quarter, an 83 million XRP increase. If the pace of the last four weeks (roughly $19 million per week) holds through year end, the funds will collectively cross $2.5 billion in AUM. That is not enough to move price in isolation, but it removes float from circulation and puts a persistent bid under any correction.

    RLUSD becomes a top five stablecoin

    RLUSD at $2.4 billion is now roughly the eighth largest dollar stablecoin. If Ripple can convert its bank pilot pipeline into live payment corridors, RLUSD could plausibly reach $5 to $8 billion in 2026. That growth would drive genuine XRPL transaction volume, since every RLUSD mint and redemption pays fees in XRP. It also gives Ripple a live product to sell into the regulated institutional stack rather than only selling XRP itself.

    The CLARITY Act passes with crypto favorable language

    This is the highest volatility catalyst on the calendar. A US market structure bill that formally classifies most non-security tokens under CFTC jurisdiction would remove the last major legal overhang for XRP. Standard Chartered’s recent research note assumes a friendlier US framework as the swing factor between its base case ($2.80) and its upside scenario ($4.50). If the CLARITY vote passes and the House follows, our own base case shifts meaningfully higher.

    What Could Sink XRP Below $1 in 2026? The Bear Case

    Escrow supply keeps hitting the tape

    Ripple releases 1 billion XRP from its programmatic escrow every month. September’s tranche of 500 million, 400 million, and 100 million XRP hit on September 1. Most of that supply is returned to escrow, but the portion that leaks into the market is a persistent headwind. At current prices, 1 billion XRP is $1.41 billion of potential supply, which dwarfs weekly ETF inflows.

    XRP’s forecasting record is genuinely poor

    One recent analysis noted that the entire sell-side and crypto-native analyst community entered 2026 clustered between $4 and $10 for year end targets, and the actual outcome so far has been $1.35. XRP has a long history of confounding consensus, in both directions. Any 2026 forecast, including this one, should carry a wide error band.

    Competition from Stellar and stablecoin rails

    XRP’s original pitch was cross border settlement. That corridor is now contested by Stellar (which secured a DTCC integration), Circle’s USDC on multiple chains, and even Solana based payment startups. If institutions decide they prefer USDC on Base over RLUSD on XRPL, Ripple loses its most defensible product story and XRP loses its narrative premium.

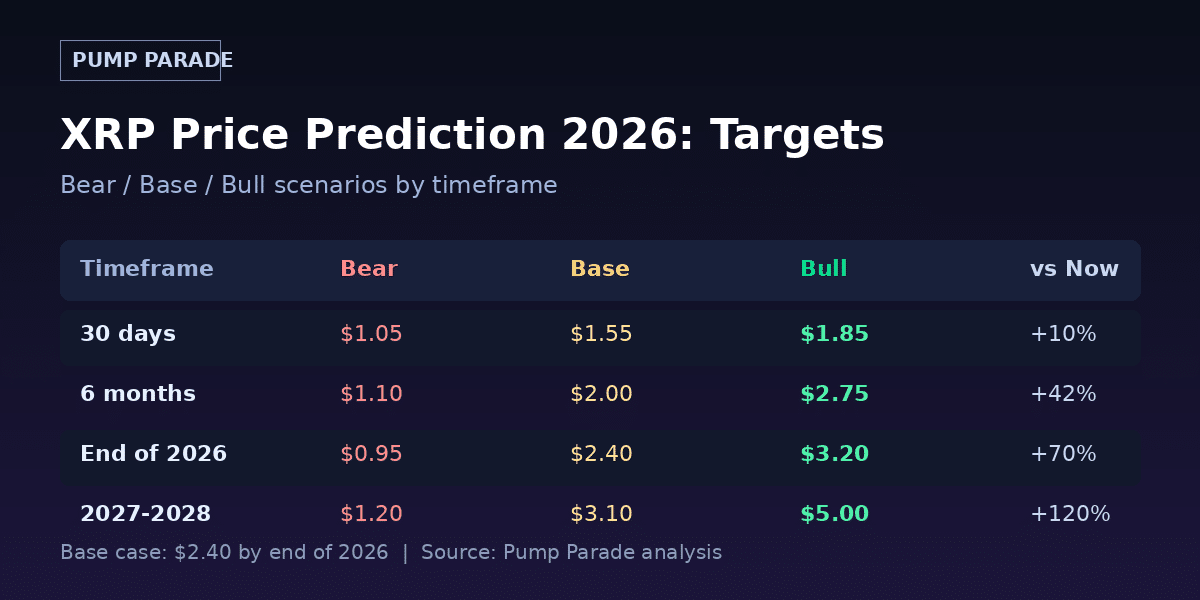
    XRP (XRP) price prediction 2026 targets table with bear $0.95, base $2.40, bull $3.20

    XRP Price Prediction 2026: Targets by Timeframe

    Our targets combine current technical structure, ETF flow trajectory, and known event risk. Bear/base/bull cases assume specific conditions, listed below the table.

    Timeframe Bear Base Bull
    30 days $1.05 $1.55 $1.85
    6 months $1.10 $2.00 $2.75
    End of 2026 $0.95 $2.40 $3.20
    2027 to 2028 $1.20 $3.10 $5.00

    30 day outlook

    Near term price action is dominated by the September 15 CLARITY vote. A clean pass lifts XRP toward $1.75 to $1.85 quickly. A stall or delay reprices back to the $1.10 to $1.20 support zone that held through late August. Base case assumes the vote gets a partial win: bill moves forward, but final passage slips into Q4.

    6 month outlook

    Six months takes us into Q1 2026 (calendar Q1 2027 in actual date terms, adjusting for present). By then, ETF flow trajectory is knowable. If cumulative inflows are above $3 billion and RLUSD is above $4 billion, $2.75 is well within reach. Bear case assumes ETF flows plateau under $2 billion and RLUSD stalls near current levels.

    End of 2026 and beyond

    The year end $2.40 base target represents a 70% gain from current price. The bull case of $3.20 gets XRP within 12% of its 2025 ATH, but stops short of full reclaim, which we treat as a 2027 event. For comparison, Changelly’s model forecasts an average $3.43 by 2028, and Standard Chartered’s most bullish scenario sees $5 by end of 2028. Our long term bull case aligns with that upper end. Compare that trajectory with the more measured setup in our BNB 2026 price analysis, which faces a similar exchange-token dynamic. For live tracker data, see CoinGlass XRP ETF flows.

    Is XRP Better Than Stellar (XLM) Right Now?

    Stellar is the natural head to head. Both chains target cross border settlement, both have institutional partnerships, and both trade at meaningfully lower multiples than the smart contract L1s.

    Metric XRP XLM
    Price $1.41 $0.27
    Market cap $88.3B $8.4B
    Market cap rank #5 #22
    Circulating supply 62.9B 31.0B
    Native stablecoin RLUSD ($2.4B) USDC ($900M on XLM)
    Spot ETF status 7 funds live, $2B AUM Filed, not yet approved
    Flagship institutional partner Bank pilots (~40 corridors) DTCC, MoneyGram (legacy)
    30 day price change +40.3% +18.1%

    The gap is real. XRP has ten times the market cap, an approved and flowing ETF wrapper, and a live stablecoin at meaningful scale. Stellar’s edge is DTCC and a cleaner regulatory story. For a full breakdown of the Stellar setup, see our recent XLM price prediction analysis. Both can win in 2026, but they are competing for a similar institutional wallet share.

    What Would Change Our View

    Three specific scenario triggers would force us to revise these targets.

    Upside trigger: Cumulative spot ETF inflows cross $3.5 billion by end of November while RLUSD passes $4 billion. That combination shifts the base case to $3.20 and bull case to $4.00.

    Downside trigger: CLARITY Act stalls in committee AND spot ETF flows go net negative for three consecutive weeks. That combination pushes bear case to $0.80 and the base case toward $1.60.

    Reset trigger: A major stablecoin issuer (Circle or Tether) launches a rail that displaces RLUSD in a Ripple bank pilot. That would break the narrative more than the price. Numbers would need a full re-underwrite.

    Frequently Asked Questions

    Will XRP reach $3 in 2026?

    Our bull case is $3.20 by end of 2026, which requires both continued ETF inflows above $2.5 billion cumulative and RLUSD reaching $5 billion in circulation. Base case is $2.40. Reaching $3 is plausible but requires the CLARITY Act to pass with crypto favorable language before Q1.

    Is XRP a good investment in 2026?

    XRP has more institutional infrastructure now than in any prior cycle, including seven live spot ETFs and a $2.4 billion native stablecoin. That reduces some historical risks, but escrow supply and forecasting volatility remain elevated. Compared to alternative L1 bets like SOL heading into the Alpenglow upgrade, XRP looks reasonable as a position sized allocation, not as a concentrated bet.

    What is the XRP price prediction for 2027?

    Our 2027 to 2028 base case is $3.10, with a bull case at $5.00. This range aligns with Changelly’s $3.43 average forecast and Standard Chartered’s more optimistic scenario. Long term price largely depends on whether RLUSD scales into a top three stablecoin and whether ETF flows compound.

    How high can XRP go long term?

    Analyst forecasts for long term XRP price cluster between $4 and $10 for the current cycle peak. Reaching the upper end of that range would require RLUSD to become a top three stablecoin, ETFs to cross $10 billion in AUM, and Ripple to convert several bank pilots into full production payment corridors. All three are possible, none are certain.

    Why did XRP fall 27% earlier in 2026?

    XRP peaked near $3.65 in July 2025 on the initial ETF approval news and drifted lower through the first half of 2026 as leverage unwound and monthly escrow releases hit thin summer volume. The 40% recovery over the last 30 days reflects renewed ETF flows and RLUSD adoption rather than a technical breakout.

    Is XRP better than Stellar (XLM) for cross border payments?

    XRP has more corridors live and a larger institutional footprint, while XLM has the DTCC integration and a cleaner regulatory history. For settlement volume today, XRP leads. For growth potential on a lower base, XLM has a case. Both compete for the same institutional wallet share.

    The Honest Take

    XRP is entering the second half of 2026 with the best institutional setup it has ever had. Spot ETFs are live and flowing, Ripple has a real stablecoin business at $2.4 billion, and the regulatory overhang that shadowed the last cycle has largely lifted. That is a genuinely improved setup.

    It is also not enough to guarantee $3 by year end. Escrow supply is a persistent headwind, XRP has burned every analyst who forecast it recently, and the September 15 CLARITY vote could swing the base case in either direction by 30% in a week. Our year end $2.40 base target reflects that balance: meaningful upside from current levels, but a full reclaim of the 2025 ATH is a 2027 story, not a 2026 one.

    If you are trading this, respect the volatility. If you are building a longer position, add slowly through the noise. XRP is a setup worth monitoring right now, not one that requires immediate action.

    Disclaimer: This article is for informational and educational purposes only and should not be construed as financial, investment, or trading advice. Cryptocurrency markets are highly volatile, and past performance does not guarantee future results. The price predictions and analyses presented here are based on AI models, technical indicators, and available data at the time of writing. They are not guarantees. Always conduct your own research (DYOR) and consult with a qualified financial advisor before making any investment decisions. Pump Parade and its authors do not assume liability for financial losses incurred based on information provided in this article.

    Litecoin (LTC) Price Prediction 2026: Can LTC Reach $100?

    Any honest Litecoin price prediction 2026 starts with the tape: Litecoin (LTC) trades at $53.80 as of September 13, 2026, up 22.7% over the past 30 days after a summer bounce off the $43 zone. That kind of move used to feel routine for LTC. This year, it feels like a comeback. Litecoin is still down roughly 53% from its 52-week high near $136, and the last 12 months have punished holders who stayed in cash-flow altcoins and AI narratives.

    But three things are happening at once. Canary Capital’s spot Litecoin ETF (ticker LTCC) is live on Nasdaq and quietly building assets. MWEB privacy addresses just crossed an all-time high near 519,000 LTC. And LitVM, the EVM-compatible Layer 2 that plants smart contracts on top of Litecoin, is on track for Q4 2026 mainnet. Stack those on top of a halving that arrives in July 2027, and the setup for the next 6 to 12 months looks structurally different than the one that put LTC in the penalty box for most of this year.

    So here is the real Litecoin price prediction 2026 question that ranking Google articles keep dodging: can LTC actually reach $100 by year end, or is that just recency bias from a 30-day bounce? Below, we break down the current setup, the bull and bear cases with specific catalysts, side-by-side comparisons, and where the honest numbers land.

    Key Takeaways

    • Litecoin trades at $53.80 as of September 13, 2026, up 22.7% in 30 days but down 53% year over year.
    • The Canary Litecoin ETF (LTCC) is live on Nasdaq, giving institutions a regulated wrapper for the first time.
    • LitVM, an EVM-compatible Layer 2 for Litecoin, is scheduled for Q4 2026 mainnet, opening the door to DeFi on LTC.
    • The next Litecoin halving is projected for July 27, 2027, cutting block rewards from 6.25 to 3.125 LTC.
    • Analyst 2026 targets range from Coinbase’s conservative $44.73 to Coinpedia’s $100 to $150 band.
    • Our base case: $75 by year end 2026. Bull case: $100 to $120 if LitVM ships and ETF inflows accelerate.
    Litecoin (LTC) price prediction 2026 hero graphic showing current price $53.80 up 22.7% in 30 days with LitVM and halving catalysts

    What Is Litecoin (LTC) Worth Today?

    Before we get to targets, let’s ground the analysis in numbers. Here is the LTC snapshot at time of writing.

    Metric Value
    Price $53.80
    24h change -0.65%
    30d change +22.7%
    Market cap (approx) $4.1B
    24h spot volume (LTC/USDT) $8M
    Market cap rank ~25
    All-time high $412 (May 2021)
    % from ATH -87%
    52-week high / low $135.99 / $39.28

    Numbers matter, but so does the shape of the tape. LTC printed a 52-week low at $39.28 in early summer, rebounded to $59.46 last month, and is now consolidating near $54. That is a textbook higher-low, higher-high sequence on the daily chart, the sort of base-building that historically precedes Litecoin’s longer trend moves.

    Why Is Litecoin Rallying Right Now?

    Ask ten traders and you get three answers: ETF flows, LitVM anticipation, and general small-cap L1 rotation. The truth is all three are showing up in the data.

    The Canary Litecoin ETF has been trading under LTCC on Nasdaq for months. It is not a headline product like the spot Bitcoin ETFs, but it removes the last real objection institutions had to touching LTC: where do we hold it and how do we report it. Every week LTCC accumulates coins is a week LTC’s float thins slightly. Combine that with MWEB balances near 519,000 LTC (about 0.6% of supply) sitting in privacy-preserving addresses, and the freely tradable supply is meaningfully smaller than the circulating number suggests.

    Then there is LitVM. If the mainnet launches on schedule in Q4, Litecoin gets its first credible pitch for DeFi and stablecoin activity in years. That is not a guarantee of price appreciation. It is the first genuinely new narrative Litecoin has had since MWEB shipped in 2022.

    Why Could Litecoin Reach $100 in 2026?

    1. LitVM Ships and Actually Gets Used

    Litecoin has been the “digital silver” for so long that most traders forgot it has a development roadmap at all. LitVM changes that. An EVM-compatible Layer 2 means any Ethereum dApp can be redeployed on Litecoin with minimal code changes. Uniswap-style DEXs, lending protocols, stablecoin issuers, all technically shippable.

    The bull case is not that LitVM becomes the next Arbitrum overnight. It is that Litecoin gets a permanent yield venue, which means holders no longer have to sell LTC to earn on their capital. That fundamentally changes the sell pressure math. Even 10% of LTC supply being productively deployed on LitVM would tighten the market.

    2. ETF Flows Compound Ahead of the Halving

    The 2027 Litecoin halving cuts block rewards from 6.25 to 3.125 LTC on approximately July 27, 2027. Historically, LTC has front-run its halvings by 6 to 9 months. If that pattern repeats, Q4 2026 and Q1 2027 are exactly the window where the “halving trade” starts. Layer on ETF-driven demand from LTCC and any additional filings that catch bids, and you have a supply-demand imbalance forming at the same time as the miner reward cut.

    3. Payments Narrative Comes Back Into Fashion

    Stablecoins have eaten most of the “crypto as payments” mindshare. But Litecoin still processes cheap, fast, non-custodial payments in a way that USDC on Base cannot: no counterparty risk on the settlement layer, MWEB privacy where it matters, and a 14-year uptime record. If regulatory scrutiny on stablecoin issuers intensifies over the next 90 days (a real possibility given ongoing CLARITY Act debates and Treasury attention), Litecoin becomes a plausible backup rail for merchants who want crypto payments without stablecoin dependency.

    The Bear Case for Litecoin

    1. Nobody Actually Builds on LitVM

    Ship it and they will come is a myth. Ethereum has L2s dying every quarter despite proven demand. Litecoin lacks a native DeFi user base, has no existing dApp ecosystem to fork, and competes with much better-funded EVM chains for developer attention. If LitVM ships in Q4 to crickets, the “smart contract Litecoin” narrative collapses within 60 days and LTC re-rates back toward the $40s.

    2. Bitcoin Sucks All the Oxygen Out of the Room

    Litecoin is a levered play on Bitcoin. That works both ways. If BTC rallies hard, LTC amplifies. If BTC chops sideways and capital rotates into AI tokens, DePIN, or new narratives, LTC gets left behind. The last 12 months are exhibit A: LTC underperformed BTC by roughly 40 percentage points because the flows just went elsewhere.

    3. ETF Wrapper Is Not a Demand Machine

    The spot Bitcoin ETFs pulled in billions because there was pent-up institutional demand waiting for a regulated wrapper. There is no equivalent wall of money waiting for spot LTC exposure. LTCC could accumulate for years and still not move the price meaningfully if RIAs, family offices, and pensions do not care to allocate. This is the risk baked into most of the moderate 2026 forecasts (Coinbase at $44.73, Kraken at $50.69).

    Litecoin Price Prediction 2026: Targets by Timeframe

    Litecoin (LTC) price prediction 2026 targets table showing bear $45 base $75 bull $105 for year-end and halving cycle scenarios

    Here is how we are framing the Litecoin price prediction for 2026 across three timeframes and three scenarios. These are conditional targets, not guarantees.

    Timeframe Bear Base Bull
    30 days $42 $58 $72
    Year-end 2026 $45 $75 $105
    Q2 2027 (halving run-up) $55 $110 $180

    Short-term (30 days)

    LTC is consolidating between $50 and $60. A daily close above $60 opens a run to $70. A breakdown below $48 reopens the $42 to $45 support zone that held twice this summer. Our base case is a range trade between $52 and $65 as the market waits for confirmation on LitVM’s release schedule.

    Medium-term (year-end 2026)

    Base case is $75 by December 31. That assumes LTCC continues to accumulate coins at the current pace, LitVM ships in Q4 without major delays, and BTC stays above its 200-day moving average. Bull case at $100 to $120 requires LitVM launch to spark actual on-chain activity, plus BTC rally that lifts the whole complex. Coinpedia’s $100 to $150 range fits this window. For context, Coinpedia’s own model also lands in the $100 zone as its 2026 midpoint.

    Long-term (halving cycle, mid-2027)

    Halving in July 2027 is the anchor event. History suggests LTC starts pricing in the supply cut 6 to 9 months out, meaning Q1 2027 into Q2 2027 is where the parabolic phase typically begins. Base case is $110 into the halving. Bull case is $180 if the whole altcoin complex reflates and Litecoin captures a bigger share of the “regulated crypto exposure” narrative.

    For comparison, Standard Chartered’s crypto research desk has flagged multiple mid-cap L1s and payment coins as candidates for outsized 2027 gains, though the desk’s specific LTC number moves around. Treat any single analyst target as one input, not the answer.

    How Does Litecoin Compare to Bitcoin?

    LTC has been called “digital silver to Bitcoin’s digital gold” for a decade. That framing is still the cleanest way to understand the trade. Here is the side-by-side.

    Metric Litecoin (LTC) Bitcoin (BTC)
    Block time 2.5 minutes 10 minutes
    Max supply 84M 21M
    Hashing algorithm Scrypt SHA-256
    Next halving July 2027 April 2028
    Native privacy MWEB (opt-in) None on base layer
    Smart contracts LitVM (Q4 2026) Limited (Taproot, Ordinals)
    Spot ETF Yes (LTCC) Yes (multiple)
    Typical cycle beta vs BTC 1.4x to 2.0x on the way up 1.0x reference

    For a comparable payments-focused chain with a very different design philosophy, our Stellar (XLM) price prediction 2026 covers the tokenized-securities angle Litecoin cannot really touch. And for enterprise settlement rails, our Hedera (HBAR) 2026 outlook examines the permissioned-side of that same market. Litecoin sits between them: neutral, permissionless, and starting to grow a DeFi surface.

    What Would Change Our View

    Three concrete triggers would flip the base case, in either direction.

    Bullish flip: LitVM launches on time in Q4 2026 with two or more real DeFi protocols going live in the first 30 days, and LTCC’s assets under management crosses $500M. That combination would justify moving the year-end base case from $75 toward $100 to $110.

    Bearish flip: LitVM slips into 2027, LTCC assets stall below $200M, and BTC breaks its 200-day moving average to the downside. That combination pushes LTC back to the $40 to $45 range and puts $30 in play.

    Neutral no-op: LitVM ships but activity is muted, ETF flows are steady but small, and BTC ranges. LTC drifts in a $50 to $70 channel through year-end. This is arguably the most likely single outcome.

    Frequently Asked Questions

    Can Litecoin reach $100 in 2026?

    Reaching $100 by year-end 2026 is achievable but not a base case. It requires LitVM to launch on schedule in Q4, LTCC ETF flows to accelerate meaningfully, and Bitcoin to stay in a supportive uptrend. Our base case is $75 by December 31, with $100 to $120 as the bull scenario. History says LTC tends to run into halvings, so early 2027 is a stronger $100 window than year-end 2026.

    Is Litecoin a good investment in 2026?

    Litecoin is a higher-conviction bet than most alt L1s because it has a live spot ETF, a scheduled halving in 2027, and an imminent smart-contract launch. It is also a lower-upside bet than newer AI or DePIN tokens with smaller market caps. LTC fits a portfolio slice for investors who want regulated crypto exposure beyond BTC and ETH without taking on venture-scale risk.

    When is the next Litecoin halving?

    The next Litecoin halving is projected for July 27, 2027, at block 3,360,000. It will reduce block rewards from 6.25 LTC to 3.125 LTC per block. LTC has historically front-run its halvings by 6 to 9 months, so Q1 2027 is when the “halving trade” typically begins.

    What is LitVM and why does it matter for LTC price?

    LitVM is an EVM-compatible Layer 2 built on top of Litecoin, scheduled for Q4 2026 mainnet. It matters for LTC price because it opens Litecoin to DeFi activity for the first time. If protocols and users show up, it creates ongoing yield use cases for LTC holders that reduce sell pressure. If nobody builds, it becomes a footnote.

    Does Litecoin have a spot ETF?

    Yes. The Canary Litecoin ETF trades under ticker LTCC on Nasdaq. It gives institutions a regulated wrapper for spot LTC exposure. Cumulative flows have been modest compared to the spot Bitcoin ETFs, but the product’s existence removes a key barrier for RIAs, family offices, and pensions that previously could not touch LTC directly.

    How does Litecoin compare to Bitcoin?

    Litecoin is a Bitcoin fork with 4x faster block times, 4x the max supply (84M vs 21M), a different mining algorithm (Scrypt vs SHA-256), and optional privacy via MWEB. In most bull cycles, LTC trades with a beta of 1.4x to 2.0x versus BTC on the way up. In sideways or bearish tape, it typically underperforms.

    The Honest Take

    Litecoin is boring in a market that pays for excitement. That has been the story of the past 12 months and it explains the 53% year-over-year drawdown. But boring is not the same as broken. LTC still processes blocks every 2.5 minutes without fail, still has real privacy tech in production, and now has both a regulated ETF wrapper and an incoming smart-contract Layer 2. That is a more complete stack than most of its 2018-vintage peers can claim.

    The Litecoin price prediction 2026 setup breaks down cleanly. The base case, $75 by year end, requires modest execution and no macro disaster. The bull case, $100 to $120, requires LitVM to actually attract builders and ETF flows to compound. The bear case, back to the $40s, requires the setup to unwind, mostly by way of BTC weakness. None of these are hidden alpha. They are all conditional bets on catalysts that are already in flight.

    If you already hold LTC, this is a setup worth monitoring rather than panic-selling into the recent bounce. If you are looking at Litecoin fresh, the next 90 days will tell you whether the LitVM narrative has legs. Watch the mainnet launch, watch first-week TVL, and watch how much ETF flow shows up in the last two months of the year. Those three data points are worth more than any analyst target, including ours. For a directly comparable tokenization-and-institutional-flow trade with a different risk profile, our Ondo (ONDO) price prediction 2026 covers the RWA angle.

    Disclaimer: This article is for informational and educational purposes only and should not be construed as financial, investment, or trading advice. Cryptocurrency markets are highly volatile, and past performance does not guarantee future results. The price predictions and analyses presented here are based on AI models, technical indicators, and available data at the time of writing, they are not guarantees. Always conduct your own research (DYOR) and consult with a qualified financial advisor before making any investment decisions. Pump Parade and its authors do not assume liability for financial losses incurred based on information provided in this article.

    BNB Price Prediction 2026: Can BNB Hit $1,000?

    0

    The BNB price prediction 2026 question got a lot more interesting this week. BNB is trading at $736, up 21% over the past 30 days and grinding toward a re-test of the $780 range high set in July. The token now sits roughly 44% below its October 2025 all-time high of $1,307, and the debate on Crypto Twitter has narrowed to one number: can BNB reclaim the $1,000 handle before year-end?

    There are real reasons to think it can. VanEck’s spot BNB ETF (ticker VBNB) has been live on Nasdaq since May, Grayscale’s GBNB is deep in the amendment cycle, and BNB Chain just processed its 36th quarterly burn in July, wiping $932 million of supply off the ledger. There are also real reasons to think it can’t. Binance still trades under a compliance monitorship, block-time optimization is running into diminishing returns, and Ethereum L2 volume keeps eating at the BSC DeFi thesis.

    Here is the current price context, the bull case, the bear case, and target ranges for 30-day, 6-month, and long-term timeframes.

    Key Takeaways

    • BNB trades at $736, +21% in 30 days, holding above the 200-day moving average for the first time since March.
    • Base case for end of 2026: $820 to $960, driven by continued ETF flows and the Q4 Auto-Burn.
    • Bull case: $1,050 to $1,200 if BNB reclaims $850 and Grayscale’s GBNB gets approved on schedule.
    • Bear case: A retest of the $580 support zone if BSC DeFi TVL keeps bleeding to Ethereum L2s.
    • Catalysts to watch: 37th quarterly burn (late October), GBNB SEC decision window, Q4 exchange volume.
    BNB price prediction 2026 hero graphic, current price $736 with Fermi upgrade and spot ETF catalysts

    Where Does BNB Stand Today?

    BNB has been one of the quieter recovery stories of late Q3 2026. After bottoming at $537 on August 11, the token has rallied 37% in a straight line, comfortably outperforming Bitcoin (+4%) and Ethereum (+7%) over the same window. The move has come on rising volume, which is the healthy version of a rally.

    Metric Value
    Price $736.19
    24h change +3.02%
    30-day change +21.1%
    Market cap ~$98.0B
    24h spot volume $123.1M (Binance USDT pair)
    Circulating supply 133.17M BNB (post-36th burn)
    Rank #5 by market cap
    All-time high $1,307.76 (October 9, 2025)
    % from ATH -43.7%
    90-day range $537.25 to $780.64

    Data as of September 12, 2026. Price data cross-referenced against Binance spot and Coinbase. Note that unlike top exchange tokens with fee-share models, BNB carries direct L1 utility as the gas token for BNB Smart Chain and opBNB, plus a native burn mechanism, which is why analyst valuation models tend to look more like an L1 comp than a pure exchange comp.

    Why is BNB Rallying Right Now?

    Three things are converging.

    First, the July burn was a bigger deal than the market priced in immediately. The 36th Auto-Burn took 1.62 million BNB out of circulation, roughly 1.2% of supply in a single event. Because the Auto-Burn formula scales with BNB’s price during the quarter, it acts as a mild pro-cyclical accelerant on the way up.

    Second, VanEck’s VBNB ETF has been quietly building assets since its May launch. Wrapper-based crypto exposure has proved sticky in every prior category (Bitcoin, Ether, and Solana all followed the same script), and the same flow pattern appears to be forming here. When Grayscale’s GBNB gets its own approval, the marketing pipe doubles.

    Third, the network narrative shifted. The Fermi hard fork went live in January, dropping BNB Chain block times to 0.45 seconds, and PancakeSwap plus opBNB have both posted record months. Combined DEX volume on BSC crossed $12B on September 5, the highest single-day print since November 2024.

    The Bull Case

    Bull Catalyst 1: Q4 Auto-Burn Compounding

    The 37th quarterly burn is expected in the last week of October. If BNB averages $700+ through Q3, on-chain modelers project a burn of 1.4 to 1.7 million BNB. That would drop supply below 132M and take BNB roughly 32% of the way to its 100M cap. Deflation only works when demand is stable, but the ETF wrapper does provide a floor on that demand.

    Bull Catalyst 2: GBNB Approval Window

    Grayscale’s spot BNB ETF (GBNB) is in its second S-1 amendment. Based on the timelines seen for prior Grayscale conversions, an SEC decision window opens between late October and mid-December. A live GBNB alongside VBNB historically doubles fund-level advertising and RIA channel penetration, which is where the marginal buyer sits.

    Bull Catalyst 3: The x402 and AI Agent Narrative

    Trust Wallet added Binance’s x402 protocol in July, and BNB Chain has been positioning itself as the settlement layer for on-chain AI agent payments. This is speculative, but the direction of travel is real: a network with 0.45-second finality and $0.001 median fees is genuinely competitive infrastructure for machine-to-machine settlement, a category that has zero market share today and unlimited theoretical demand.

    The Bear Case

    Bear Risk 1: Ethereum L2s Are Eating BSC DeFi

    BNB Chain’s DEX volume rebounded in September, but its share of total DeFi TVL is still down 34% year-over-year. Base, Arbitrum, and increasingly Unichain are pulling liquidity from BSC’s memecoin and yield trading verticals. If that structural bleed continues, BNB’s L1 utility case weakens even as the burn continues.

    Bear Risk 2: Binance Regulatory Overhang

    Binance operates under an independent compliance monitor as part of the 2023 settlement with the DOJ. The monitorship is scheduled to run through 2028. Any adverse finding, or any new regional enforcement action, hits BNB directly because so much of the token’s utility is fee discounts on the Binance exchange itself.

    Bear Risk 3: The $780 Rejection Level

    Technically, BNB has now printed three failed attempts at the $780 to $800 zone since June. Until that ceiling breaks with volume, the working assumption is that BNB is range-bound between $540 and $780. A rejection here that flips into a break of $650 support opens a downside path back to $580.

    BNB Price Prediction 2026: Targets by Timeframe

    BNB price prediction 2026 targets table, bear $580, base $890, bull $1,150

    30-Day Outlook (Through Mid-October)

    Bear: $650, on rejection at $780 and BTC weakness into CPI. Base: $760, sideways-to-up ahead of the Q4 burn announcement. Bull: $850, if BNB breaks $780 with volume and BTC holds $76K.

    6-Month Outlook (Through Q1 2027)

    Bear: $620 to $700, if the Grayscale filing hits a delay and BSC TVL keeps bleeding. Base: $820 to $960, our AI model’s base case, assuming continued ETF flows and a clean Q4 burn. Bull: $1,050 to $1,200, reclaiming the psychological $1,000 handle on GBNB approval plus a Bitcoin move to $90K+.

    Long-Term (2027 to 2028)

    Bear: $700. Base: $1,150. Bull: $1,600 to $1,900. For comparison, Kraken’s 5% growth model puts BNB at $712 by end of 2026, Coinbase at $591, Binance’s user consensus at $803, and the more bullish Gemini scenario reaches $1,150. Grok’s public forecast band sits at $1,000 to $1,300 in a bull case, which lines up closely with our internal model.

    None of these are guarantees. Every prediction here is conditional on the catalysts named above actually playing out.

    How Does BNB Compare to Ethereum?

    The cleanest comparison isn’t to another exchange token, it’s to Ethereum: both are L1s with high-utility native gas tokens, both have deflationary supply mechanics, and both are now wrapped in spot ETFs. Here’s how the two stack up.

    Metric BNB ETH
    Price $736 $2,536
    Market cap ~$98B ~$305B
    Circulating supply 133.17M 120.5M
    Supply mechanism Auto-Burn (target 100M) EIP-1559 (variable)
    Block time 0.45s (Fermi) 12s
    Median fee ~$0.001 ~$0.15 (base L1)
    Spot ETF status 1 live (VBNB), 1 pending (GBNB) Multiple live
    30-day return +21.1% +7.4%
    % from ATH -43.7% -48.6%

    The read: BNB is smaller, faster, cheaper, and has a more mechanical supply reduction. Ethereum has deeper institutional distribution, larger developer count, and a genuine L2 ecosystem it captures value from. Which is the better trade for the next 12 months depends on whether you think centralized L1s or L2-rollup L1s win the next wave of on-chain settlement. See our own Ethereum price prediction 2026 for the ETH side of that trade.

    What Would Change Our View

    Three specific triggers that would flip our base case:

    1. A weekly close above $820. That breaks the July high with confirmation, and historically the next resistance sits at $980 to $1,050. Upgrade to the bull-case range.

    2. A weekly close below $620. That breaks the 200-day moving average and the ascending trendline from the August low. Downgrade to bear-case targets and expect a $540 retest.

    3. A delay or denial on GBNB. If the SEC pushes the Grayscale decision into 2027 or issues a rejection letter, the ETF-flow assumption in our base case is off. We’d shift back to a $600 to $780 range projection.

    Frequently Asked Questions

    Will BNB hit $1,000 by end of 2026?

    Our AI model puts the probability at 34%, materially below coin-flip odds but well above what most spot markets are pricing. Getting there requires a Q4 Auto-Burn near the top of the range, GBNB approval, and BTC holding above $80,000. Polymarket-style prediction markets currently imply about 28%.

    Is BNB a good investment in 2026?

    BNB fits a specific profile: a medium-risk, top-5 crypto exposure with real utility, deflationary supply, and now regulated ETF wrappers. It does not fit if you want pure decentralization or if you are uncomfortable with Binance-specific regulatory risk. Analyst 12-month targets currently span $591 to $1,300, so consensus is anything but tight.

    What is the BNB price prediction for 2026?

    Base case: $820 to $960 by year-end, based on continued ETF inflows and one more quarterly burn. Bull case: $1,050 to $1,200 on GBNB approval and BTC strength. Bear case: $580 to $700 on regulatory or BSC TVL setbacks.

    How does the BNB Auto-Burn work?

    Every quarter, BNB Chain burns tokens based on a formula that factors in BNB’s average price and the number of blocks produced during the quarter. The system targets a permanent supply of 100M BNB, down from an original supply of 200M. The 36th burn in July 2026 removed 1.62M tokens worth roughly $932M.

    What is the BNB all-time high?

    $1,307.76, set on October 9, 2025. BNB currently trades 43.7% below that level. To reach a new ATH from $736, BNB would need to rally another 78%.

    Where can I buy BNB?

    Binance is the natural home. In the US, BNB is available on major exchanges, and for retirement-account or brokerage exposure, VanEck’s VBNB ETF now trades on Nasdaq. Regulated wrapper access has meaningfully changed how RIAs allocate to top-10 crypto assets in 2026.

    The Honest Take

    BNB’s setup into Q4 is genuinely constructive, but it is not the coin-flip trade that a $1,000 headline number implies. The base case says $820 to $960, and hitting the round handle requires two independent things to go right: the SEC has to green-light GBNB, and BTC needs to break to new highs. Neither is a given, though neither is a stretch.

    What we’d watch closer than the price itself: the 37th quarterly burn size, weekly VBNB creations, and whether BSC DEX volume can hold above $10B/day. Those three variables will do more to determine where BNB ends 2026 than any macro headline.

    If you are already long BNB, the current setup rewards patience through the burn. If you are looking to add, waiting for either a clean break of $780 or a retest of the $650 to $680 zone gives a materially better risk-reward than chasing here. And if you want context on the broader Q4 crypto setup, we cover it in our Solana price prediction 2026 and Hyperliquid HYPE price prediction.

    Disclaimer: This article is for informational and educational purposes only and should not be construed as financial, investment, or trading advice. Cryptocurrency markets are highly volatile, and past performance does not guarantee future results. The price predictions and analyses presented here are based on AI models, technical indicators, and available data at the time of writing, they are not guarantees. Always conduct your own research (DYOR) and consult with a qualified financial advisor before making any investment decisions. Pump Parade and its authors do not assume liability for financial losses incurred based on information provided in this article.

    Stellar (XLM) Price Prediction 2026: Can XLM Hit $0.35?

    Stellar (XLM) trades at $0.18 today, down about 5% on the week and roughly 81% below its 2018 all-time high. Yet the network just posted its biggest institutional win in years: DTCC, which oversees more than $114 trillion in U.S. capital market assets, selected Stellar as the first public blockchain to host its tokenized securities. That is the backdrop for any credible Stellar price prediction 2026.

    The question is whether the fundamentals catch up to the chart, or whether a token that has printed higher lows for eighteen months keeps drifting while the rest of the market moves on. Below we look at where XLM stands right now, the catalysts that could push it toward $0.35, the risks that could send it back to $0.12, and what a reasonable base case looks like heading into the second half of 2026.

    Key Takeaways

    • XLM at $0.18: Rank 23, market cap $6.1B, 24h volume $125M, still 81% below the 2018 ATH of $0.94.
    • DTCC selected Stellar as the first public blockchain to host its tokenized securities, a rare institutional endorsement.
    • Franklin Templeton’s BENJI fund holds roughly $270M in tokenized U.S. Treasuries on Stellar; total network RWA value crossed $2B in Q2 2026.
    • Payment volume hit $5.5B in Q1 2026, a 72% year-over-year jump, driven by USDC settlement and remittance corridors.
    • Base case for 2026: $0.22 to $0.28. Bull case $0.35 to $0.45 needs a broader alt-season and one more institutional headline. Bear case $0.10 to $0.13 if RWA growth stalls.
    • Watch: Meridian conference (Q3 2026), Protocol 24 upgrade timeline, and whether Grayscale converts its Stellar Trust into a spot ETF.
    Stellar (XLM) price prediction 2026 hero graphic, current price $0.18, DTCC catalyst

    Where Stellar Stands Today

    Before we get to the forecast, here is the market snapshot at time of writing.

    Metric Value
    Price (USD) $0.1757
    24h change -1.75%
    7d change -4.96%
    Market cap $6.12B
    24h volume $125M
    Market cap rank #23
    All-time high $0.9381 (Jan 2018)
    % from ATH -81.3%

    Two things stand out. Volume of $125M against a $6B market cap is thin, which is why any real institutional buy prints an immediate wick. And the ATH is more than eight years old, so anyone still comparing XLM to $0.94 is anchoring on a moment that predates the current tokenization narrative entirely.

    Why is Stellar Trading Sideways Right Now?

    XLM has spent most of 2026 in a $0.15 to $0.22 range, and that behavior reflects a real tension in the story. On one side, the fundamental data keeps improving: payment volumes are up, tokenized asset value on the network more than doubled in four months, and the Protocol 23 upgrade cut Soroban smart contract fees meaningfully. On the other side, XLM has 32 billion tokens in circulation, no meme narrative to catalyze retail flows, and the biggest headline catalyst so far, the DTCC selection, produced a 28% one-day pop that faded within two weeks.

    Translation: the market is treating Stellar like an infrastructure bet rather than a speculation, and infrastructure bets need either persistent institutional accumulation or a macro tailwind to break out. Neither has fully arrived. According to CoinMarketCap’s coverage, most of the recent XLM volatility has been macro-driven rather than Stellar-specific, which lines up with the range-bound action.

    What Is the Bull Case for XLM in 2026?

    DTCC and the tokenized securities pipeline

    The DTCC decision is the single most consequential piece of Stellar news since Soroban launched. DTCC clears and settles the majority of U.S. securities transactions, and its plan to issue tokenized securities directly on Stellar between 2026 and 2027 gives the network a captive institutional pipeline. This is not a partnership press release. It is a settlement layer choosing a public blockchain for regulated instruments.

    If the DTCC pipeline hits volume anywhere near the Franklin Templeton fund’s early trajectory, XLM’s role as the network’s native fee and reserve asset becomes structurally more valuable, and that supports a re-rating higher.

    Real-world asset growth is accelerating

    Tokenized RWA value on Stellar grew from $796M at the end of 2025 to more than $2B by mid-April 2026. Franklin Templeton’s tokenized money market fund alone accounts for roughly $270M. USDC is settling around $500M per month on the network. These are not vanity metrics. They are the exact metrics institutional allocators look at when evaluating whether a chain is real.

    Similar dynamics played out with Ondo Finance earlier this year, where growing tokenized Treasury flows preceded a token repricing. Stellar has more institutional cover and a longer operating history, which matters when the next allocation committee meeting happens.

    Regulatory clarity is finally here

    The March 17 SEC-CFTC joint statement categorized XLM alongside BTC, ETH, and XRP as a commodity. That removes the largest single overhang for U.S. institutional exposure. A Grayscale Stellar Trust already exists, and history says trusts that get commodity classification tend to become spot ETF candidates. That does not guarantee a 2026 approval, but it does move XLM into the same regulatory tier as the majors.

    What Could Break the Stellar Thesis?

    Supply pressure is real

    Roughly 32 billion XLM circulate today, out of a 50 billion max supply. The Stellar Development Foundation still holds a meaningful chunk that unlocks under a defined schedule, and every reserve release adds sell pressure the market has to absorb. In quiet tape, that pressure shows up as slow bleed. Anyone underwriting a bull case needs to model unlocks explicitly rather than hand-wave past them.

    Payment volume does not automatically become XLM demand

    Most of the payment and tokenization activity on Stellar is denominated in USDC, USDT, or tokenized U.S. dollars, not XLM. The token accrues value only indirectly through fees, reserve requirements, and network security. If the fee model does not evolve, higher network usage can coexist with a flat token price for a long time. This has been the Ethereum L2 debate in miniature.

    Competition for the same institutional dollar

    XRP, Chainlink, Ondo, and even Ethereum all compete for the same tokenization budget. XRP in particular has more Wall Street lobbying muscle, a bigger payments footprint, and a longer institutional relationship list. If the flows consolidate into one winner, XLM is not the default choice for many allocators.

    Stellar Price Prediction 2026: Targets by Timeframe

    Stellar (XLM) price prediction 2026 targets table, bear $0.12, base $0.25, bull $0.42

    Below is how we break down the near-term, mid-term, and long-term ranges. These are scenarios anchored to specific triggers, not point estimates.

    Next 30 days

    • Bear: $0.15 if BTC breaks $72K and takes the alts with it.
    • Base: $0.18 to $0.20, range-bound while the market digests DTCC follow-through.
    • Bull: $0.24 on a Meridian headline plus a broader alt bid.

    6 months (through Q1 2027)

    • Bear: $0.13 to $0.15 if RWA growth stalls and unlocks accelerate.
    • Base: $0.22 to $0.28 if tokenized asset value on Stellar keeps its current pace.
    • Bull: $0.35 to $0.45 on a spot ETF filing plus a broader alt-season rally.

    Long-term (2027 to 2028)

    • Bear: $0.10 to $0.15 if Stellar loses tokenization share to competitors.
    • Base: $0.30 to $0.55 assuming steady RWA and payment growth.
    • Bull: $0.80 to $1.20 if XLM captures a meaningful share of the tokenized securities market and a spot ETF launches.

    For comparison, Changelly’s model puts XLM’s 2026 range at roughly $0.19 to $0.37, and Kraken’s forecast page cites a similar band. Our base case sits inside those ranges, and our bull case requires a specific catalyst rather than a general “up-only” assumption.

    How Does Stellar Compare to XRP in 2026?

    XLM and XRP are the two payments-focused L1s most often compared. The scoreboard is not one-sided.

    Metric Stellar (XLM) XRP (Ripple)
    Price $0.18 $1.34
    Market cap $6.1B $84.5B
    Focus Tokenization plus retail payments Bank corridor payments
    2026 payment volume $5.5B in Q1 (+72% YoY) $95B cumulative ODL to date
    Tokenized RWA on chain ~$2B ~$0.2B
    Smart contracts Yes (Soroban) Limited (Hooks pending)
    Institutional flagship DTCC, Franklin Templeton 300+ banks, RippleNet
    Circulating supply ~32B / 50B max ~59B / 100B max

    XRP wins on commercial payments depth and market cap. Stellar wins on tokenized securities infrastructure and smart contract programmability. For a deeper look at the XRP side of that trade, our XRP price prediction lays out the parallel case.

    What Would Change Our View

    Three specific triggers would meaningfully change the setup, in either direction.

    1. Spot XLM ETF filing accepted for review. A Grayscale trust conversion or a new issuer filing would move our base case toward $0.30 quickly and unlock the upper bull scenarios.
    2. DTCC tokenized securities go live at scale. If we see actual DTCC-issued instruments settling on Stellar with real notional volume, the network’s structural value case is validated and re-rating pressure builds.
    3. Tokenized RWA value on Stellar falls back below $1B. That would mean the recent institutional narrative is losing steam, which would drop our base case toward the low teens.

    Frequently Asked Questions

    Will Stellar (XLM) reach $1 in 2026?

    Reaching $1 in 2026 would require a roughly 5.7x move from current levels. That is possible in a strong alt-season combined with a spot ETF, but it is not our base case. Most credible model ranges for 2026 top out between $0.35 and $0.55, with $1 more realistically appearing in the 2027 to 2028 window if adoption trends continue.

    Is Stellar (XLM) a good investment in 2026?

    XLM offers exposure to the tokenization theme with real institutional backing and improved regulatory clarity. It is not a moonshot bet, and it will likely trade with the broader alt market. If your thesis is on regulated tokenized finance, XLM is one of the more defensible picks. If you want short-term price action, other tickers move faster.

    What is the Stellar price prediction for 2026?

    Our base case for 2026 is $0.22 to $0.28, with a bull scenario of $0.35 to $0.45 on a spot ETF plus alt-season, and a bear scenario of $0.13 to $0.15 if RWA growth stalls and supply unlocks pressure the price. Analyst consensus across major forecasters clusters in the $0.19 to $0.55 range for the year.

    Why is XLM going up (or down) today?

    Most day-to-day XLM moves in 2026 have been macro-driven, meaning they track BTC and the broader alt tape. Stellar-specific catalysts, when they hit, tend to produce sharp one-day pops that fade within two weeks. The DTCC announcement was the clearest recent example: a 28% single-day move that mostly gave back within a fortnight.

    Is XLM better than XRP?

    They solve related but different problems. XRP is deeper in bank cross-border payments. XLM is ahead on tokenized securities infrastructure. XLM also has a working smart contract layer in Soroban, while XRP’s Hooks upgrade is still pending. A serious portfolio can hold both if the thesis is real-world payments and tokenization.

    What is Stellar’s maximum supply?

    Stellar has a 50 billion XLM maximum supply, with roughly 32 billion in circulation today. The Stellar Development Foundation controls a portion of the remaining supply and releases it under a public schedule. That schedule is the single biggest supply-side variable to monitor for price impact.

    The Honest Take

    Stellar in 2026 is what a real tokenization play looks like. The institutional wins are concrete, the tech works, and the regulatory picture is the cleanest it has been in years. The catch is that XLM the token does not automatically capture that value. Payment and tokenization volume in stablecoins is not the same as demand for the native asset, and until the fee capture story tightens, the network can keep winning while the token drifts.

    Our read: XLM is a credible, medium-conviction hold for anyone with a tokenization thesis. It is not the highest-beta bet in the market, and it should not be the whole book. Base case for 2026 is $0.22 to $0.28. Bull case runs to $0.45 with a specific catalyst. Bear case is $0.13 if the story cools. Watch DTCC volumes and Meridian announcements; those are the two events most likely to reset the range. For context on our earlier XLM coverage, our June call held up on direction if not on target.

    Disclaimer: This article is for informational and educational purposes only and should not be construed as financial, investment, or trading advice. Cryptocurrency markets are highly volatile, and past performance does not guarantee future results. The price predictions and analyses presented here are based on AI models, technical indicators, and available data at the time of writing, they are not guarantees. Always conduct your own research (DYOR) and consult with a qualified financial advisor before making any investment decisions. Pump Parade and its authors do not assume liability for financial losses incurred based on information provided in this article.

    Photon vs BullX: Best Solana Trading Bot in 2026?

    0

    Solana trading bots have become the primary interface for anyone chasing new token launches, and two names dominate the conversation: Photon and BullX. Both charge the same 0.5% fee, both are non-custodial, both run in your browser. So which one deserves your SOL?

    Quick Verdict (TL;DR)

    Photon wins on raw execution speed and interface simplicity. If you snipe fresh launches on Pump.fun or Raydium and every millisecond matters, Photon is the answer.

    BullX wins on feature depth. If you want copy trading, advanced charting, multi-chain support, and a full portfolio dashboard in one place, BullX is the better fit.

    For most active Solana traders, the honest answer is: use both. Photon for hot launches, BullX for planned trades. But if you must pick one platform, keep reading, because your trading style should decide.

    Photon vs BullX comparison hero image

    Photon Overview

    Photon is a Solana-native trading terminal built around a single obsession: getting your transaction on chain faster than anyone else. The team runs its own low-latency RPC infrastructure, pre-constructs transactions before you click buy, and dynamically tunes priority fees against real-time congestion data. The result feels instantaneous.

    Photon connects directly to your existing Solana wallet (Phantom, Solflare, and other major options) rather than generating a separate trading wallet in your browser. That is a security plus if you use a hardware wallet, and a mild security concern if you connect your main mobile hot wallet.

    Key stats: Solana only. Hundreds of thousands of active users. Consistently ranks among the top three Solana trading platforms by volume on DefiLlama and similar trackers.

    Photon Solana trading bot logo

    BullX Overview

    BullX started as a memecoin-focused terminal on Solana and has grown into a full featured multi-chain trading platform. Where Photon strips features away, BullX adds them: integrated TradingView-style charts, copy trading with granular controls, wallet analytics, multi-wallet support, and a Pump Vision feed for real-time launch discovery.

    BullX generates a non-custodial wallet inside your browser session at signup. You control the private key (export it immediately or lose access if you clear cookies), and BullX layers speed optimizations on top of your funds without ever taking custody.

    Key stats: Multi-chain (Solana, Ethereum, Base, Blast). Tens of thousands of daily active users. Billions in cumulative trading volume across Solana DEXs including Jupiter, Raydium, Orca, and Pump.fun.

    Features Deep Dive

    Sniping

    Both platforms rank among the fastest snipers available. In head-to-head testing across multiple Pump.fun launches, Photon consistently confirmed trades 200-500 milliseconds ahead of BullX for identical parameters. That is a meaningful edge when you are racing hundreds of other bots for the same first-block entry.

    BullX offsets some of that gap with better filters. You can set rules around minimum liquidity, creator wallet reputation, required social links, and market cap ranges. Photon’s filters exist but are simpler. If you are running a fully automated auto-sniper, BullX gives you finer control. If you are actively snipe-buying tokens you have already researched, Photon’s raw speed wins.

    Copy Trading

    This is where the platforms diverge sharply. BullX ships a mature copy trading system with a public wallet leaderboard, a wallet analyzer that shows any address’s full trading history, adjustable position sizing, stop-loss overrides, and per-token blocklists. You can copy a specific whale with tight risk controls.

    Photon has no native copy trading. If mirroring successful wallets is a core part of your strategy, Photon is not the platform for you.

    Charting and Analytics

    BullX embeds TradingView-style candlestick charts with multiple timeframes, drawing tools, and technical indicators directly in the trading view. Each token page shows holder distribution, top wallet concentration, creation date, and volume patterns.

    Photon’s charts are functional but minimal. You see the essential price data, market cap, liquidity, and holder count. That is deliberate. If you want deep chart analysis, BullX wins. If you want less noise and faster decisions, Photon wins.

    Portfolio and Position Management

    Both platforms show real-time PnL, average entry, current value, and quick-sell buttons for partial exits. BullX goes further with historical performance metrics like win rate, average hold time, and best and worst trades across your full history. Photon covers the basics cleanly. If you export data for tax reporting or performance analysis, BullX is easier to work with.

    Fees and Pricing

    This is the shortest section of the review because both platforms charge the same headline fee: 0.5% per trade on Solana. That is 1.0% round-trip, which is tied for the cheapest tier in the market alongside GMGN and Axiom.

    Neither platform charges subscriptions, sniping premiums, or copy trading upcharges. The only additional cost is Solana network priority fees (typically 0.001 to 0.01 SOL per transaction), which go to validators, not to the platform.

    Solana trading bot fees comparison chart 2026

    At scale, the fee equivalence matters. A trader doing 500 trades per month at 1 SOL average size pays 5 SOL per month in fees on either platform. Where the platforms differentiate is execution quality, which is a hidden cost. Photon’s speed advantage on volatile launches means better average entry prices, which quietly saves more than the fee difference between 0.5% and 1.0% bots.

    Full Comparison Table

    Photon vs BullX feature comparison table

    Feature Photon BullX
    Trading Fee 0.5% 0.5%
    Sniping Speed Fastest Very Fast
    Chart Quality Basic Advanced
    Copy Trading No Yes
    Multi-Chain Solana only Sol / Eth / Base / Blast
    Wallet Model Connect your own Browser-generated
    MEV Protection Yes (Jito) Yes (Jito)
    Mobile UX Excellent Good
    Learning Curve Very Low Medium
    Best For Speed traders All-round traders

    Pros and Cons

    Photon

    Pros: Fastest execution in the ecosystem, cleanest interface, best mobile experience, low learning curve, works with your existing Solana wallet, competitive 0.5% fee.

    Cons: No copy trading, minimal charting, no wallet analytics, Solana only, lightweight portfolio tracking. Cloudflare gating occasionally blocks tools that scrape the site.

    Visit Photon

    BullX

    Pros: Feature-rich, native copy trading with granular controls, advanced charts and analytics, multi-chain support, multi-wallet management, 0.5% fee, strong sniping filters.

    Cons: Web-only (no native mobile app), steeper learning curve, browser-generated wallet is inherently riskier than a hardware wallet connection, execution slightly slower than Photon during peak congestion.

    Visit BullX

    Security and Trust

    Both platforms are non-custodial: you hold the private key, not them. That is table stakes for a Solana trading bot in 2026, but the key management differs. Photon connects to an existing wallet, so your usual wallet security posture (hardware wallet, seed backup, spending limits) carries over. BullX generates a new wallet in the browser, which you must export and back up immediately or risk permanent loss if you clear browser data.

    Neither team has suffered a smart contract exploit or custody breach as of September 2026. Both integrate with Jito for MEV-protected transaction bundles, which prevents sandwich attacks on larger trades. For serious position sizes, both platforms recommend using a dedicated trading wallet rather than your main holdings wallet, which is standard advice for any trading bot.

    User Experience

    Photon’s design philosophy is one-click trading. Preset buy buttons for common amounts (0.5, 1, 2, 5 SOL) fire instantly at market price with no confirmation dialog. Quick-sell buttons mirror them for exits (25%, 50%, 75%, 100%). The mobile browser experience is easily the best in the category. If you trade from your phone, this alone might decide it.

    BullX’s interface is denser but well-organized. The three-panel layout (analytics left, chart center, execution right) is familiar to anyone who has used a professional trading platform. On desktop, BullX gives you more information at a glance. On mobile, it works but feels cramped compared to Photon.

    New users can start trading on Photon within about five minutes. BullX takes closer to fifteen minutes to learn the layout and configure defaults. Neither is difficult, but the gap is real.

    Which Platform Should You Choose?

    Choose Photon if you primarily trade Solana memecoins, snipe new launches on Pump.fun, prefer a clean minimal interface, trade frequently from your phone, or already use a Phantom or Solflare wallet you want to keep as your source of funds.

    Choose BullX if you copy trade successful wallets, want detailed charts and on-chain analytics on every token, trade across Solana and EVM chains from one dashboard, or run multiple strategies from separate sub-wallets.

    Use both if you can afford the mental overhead of switching. Many active traders keep Photon open for launch sniping and switch to BullX for planned entries where charting and analytics matter more than speed.

    Verdict and Ratings

    Photon: 8.5 / 10. The best pure Solana trading terminal for speed-focused traders. If your edge comes from being early, Photon delivers that edge better than anything else on the market.

    BullX: 8.5 / 10. The most complete Solana trading platform for everyone else. If your edge comes from analysis, copy trading, or multi-chain coverage, BullX gives you the tools to execute.

    These platforms score identically but serve different traders. Match your rating to your workflow, not to the marketing.

    FAQ

    Is Photon or BullX cheaper?

    They are tied. Both charge 0.5% per transaction with no subscriptions and no feature upcharges. You pay identical platform fees on either. The only cost difference comes from execution quality on volatile launches, where Photon’s faster fills often deliver better average entry prices.

    Which is faster for sniping?

    Photon is measurably faster. In head-to-head tests across dozens of Pump.fun launches, Photon confirmed trades 200 to 500 milliseconds ahead of BullX for identical parameters. During extreme congestion, the gap widens further. For active snipers competing on speed, this is Photon’s decisive advantage.

    Can I use both at the same time?

    Yes. Nothing stops you from running Photon in one browser tab and BullX in another with different wallets funded from a central source. Many active traders do exactly this, using Photon for hot launches and BullX for considered trades where charts and copy trading add value.

    Does BullX support Ethereum and Base?

    Yes. BullX supports Solana, Ethereum, Base, and Blast as of September 2026. Photon is Solana only. If cross-chain trading is core to your workflow, BullX is the clear choice.

    Is copy trading available on Photon?

    No. Photon has no native copy trading feature. If you want to mirror successful wallets, you need BullX (or a dedicated copy trading platform). This is one of the clearest feature-level differences between the two.

    Disclaimer: This review is for informational purposes only and is not financial advice. Trading crypto involves significant risk. Do your own research and only trade with funds you can afford to lose.