More
    Home Blog Page 23

    Solana (SOL) Price Prediction 2026

    0

    Solana is trading at $81.93 as of April 13, 2026. That’s a 72% drop from its all-time high of $294. And yet, on-chain activity tells a different story. In the last 24 hours alone, Solana processed over $15 billion in trading volume. Volume is up 27.6% day over day. Whatever the price chart says, the network itself is busy.

    So what’s next for SOL? The Alpenglow consensus upgrade is inching closer to mainnet. Spot Solana ETF applications are progressing through the SEC. And Standard Chartered has set a $250 price target for 2026. Our AI model has run the numbers. The bull case is real. But so are the headwinds. Let’s break both down.
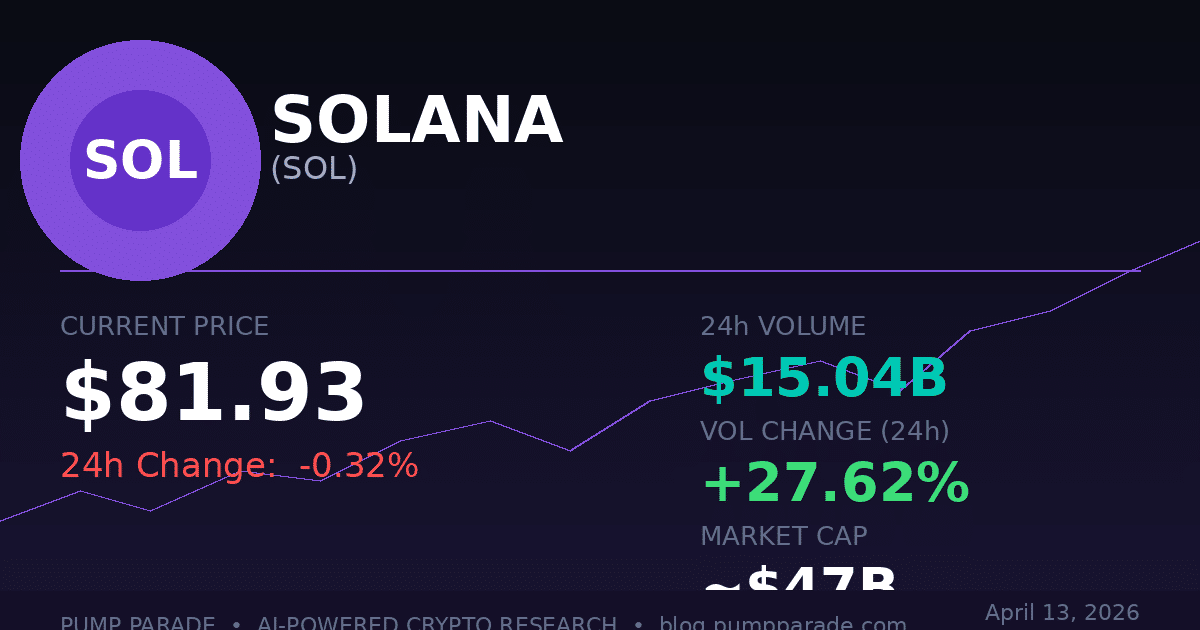
    Solana SOL price prediction 2026 hero image showing current price $81.93 and 24h volume $15.04B

    Solana Today: The Data Behind the Price

    At $81.93, SOL sits roughly 28% above its 2026 low of around $64. The token is recovering, but it hasn’t recovered. The broader market has weighed on Solana along with every other altcoin. Bitcoin crossed $72,000 this week after news of a US-Iran ceasefire. Solana followed, though more quietly.

    Here’s what the on-chain data shows right now:

    • Price: $81.93 (April 13, 2026, via Birdeye)
    • 24-hour trading volume: $15.04 billion
    • Volume change (24h): +27.6%
    • Market cap: approximately $47 billion
    • On-chain liquidity: $5.73 billion

    A $15 billion single-day volume on Solana is significant. That’s not a dead network waiting to be buried. That’s one of the busiest blockchains on the planet, processing transactions at fractions of a penny per trade.

    The 27.6% jump in volume is worth noting too. Volume surges often precede price moves. They can go either way. But the direction of flow matters more than the raw number. Right now, buyer sentiment on Solana is running strong. Data from Capital.com shows 92.3% of retail clients hold long positions on SOL. That’s a meaningful lean, even with caveats about retail positioning.

    The Alpenglow Upgrade: What It Is and Why It Matters

    Solana’s biggest technical catalyst in 2026 is the Alpenglow consensus upgrade. Here’s what it does, in plain terms.

    Right now, a transaction on Solana takes roughly 12 seconds to reach finality. That means 12 seconds before a transaction is truly confirmed and irreversible. Alpenglow targets 150 milliseconds. That’s 80 times faster.

    Why does this matter for price? Faster finality opens Solana to use cases that currently require institutional-grade settlement speed. High-frequency trading firms, payment processors, and real-world asset protocols all need near-instant settlement. At 150ms, Solana starts competing with traditional financial infrastructure, not just other blockchains.

    The upgrade proposal (SIMD-0326) is progressing through Solana’s governance process. It pairs with the Firedancer validator client, which is designed to push throughput beyond one million transactions per second. Both updates point to a network being built for serious financial infrastructure, not just speculative trading.

    This is the narrative driving the Standard Chartered $250 price target for 2026.

    Technical Analysis: Where SOL Stands Right Now

    Solana’s chart shows a token in recovery mode. Here’s what the key indicators are telling us.

    RSI (Relative Strength Index): SOL’s RSI was tracking around 43 in early March. That’s neutral territory, below the 50 midpoint but nowhere near oversold. A move above 50 RSI would signal shifting momentum toward buyers.

    Moving averages: The 50-day, 100-day, and 200-day moving averages are all sitting above the current spot price. That means SOL is still trading below its longer-term trend lines. A reclaim of these levels would be a technically significant signal.

    Key support levels: The $70-75 zone has held as support multiple times in 2026. A breakdown below $70 would be concerning. It hasn’t happened yet.

    Key resistance levels: The first major resistance sits near $95-100. A sustained close above $100 would be the first milestone confirming a broader recovery. After that, the $130-150 range becomes the next test.

    Our AI model’s current technical outlook for SOL rates bullish momentum as building, but not yet confirmed. The setup favors upside over the medium term if the Alpenglow catalyst lands on schedule.

    The Bull Case for Solana in 2026

    There are three strong catalysts that support a bullish SOL thesis for 2026.

    1. Alpenglow mainnet deployment

    If Alpenglow ships to mainnet in mid-2026 as expected, it reframes Solana’s competitive position. The narrative shifts from “fast, cheap blockchain” to “institutional-grade infrastructure.” That reframing attracts a different class of capital.

    2. Spot Solana ETF approval

    Several asset managers have filed for spot Solana ETFs with the SEC. Approval would open SOL to retirement accounts, wealth advisors, and institutional allocators who currently lack a direct exposure path. Bitcoin ETF approval in 2024 drove around $380 million per week in inflows at peak. A Solana ETF would likely be smaller, but still meaningful for price discovery.

    3. Network activity compounding

    $15 billion in daily volume doesn’t happen on a network nobody wants to use. DeFi protocols, memecoins, real-world assets, and AI agent applications are all building on Solana. As ecosystem activity grows, demand for SOL as the gas token grows with it.

    Bull target range: $180-250 by end of 2026, with $310 possible in a strong macro environment.

    The Bear Case for Solana in 2026

    The risks here are real and worth taking seriously.

    Macro pressure: Bitcoin is trading near $72,000, but it’s still well below its January high of $87,500. The Federal Reserve has signaled rates stay elevated into Q2 2026. Risk-off sentiment could push SOL back toward the $65-70 range before any recovery takes hold.

    Upgrade delays: Alpenglow is still in governance. Blockchain upgrades rarely ship on time. A delay or technical complication could remove the primary near-term catalyst and cause a selloff among traders positioned for the upgrade.

    ETF uncertainty: The SEC has rejected or delayed crypto ETF applications before. If Solana ETF approval gets pushed to 2027, institutional capital stays on the sidelines longer than bulls expect.

    Competition from Ethereum: Ethereum’s Layer 2 ecosystem is maturing fast. If Solana loses developer or user activity to Ethereum rollups, the network effect narrative weakens.

    Bear target range: $65-75 in a risk-off scenario. A true breakdown scenario puts $50 on the table if macro conditions deteriorate sharply.

    Solana Price Predictions: Our AI Model’s Targets

    Our hybrid AI model combines technical indicators, on-chain data, sentiment signals, and historical pattern matching to generate forward-looking price scenarios. Here’s what the model outputs for SOL as of April 13, 2026.
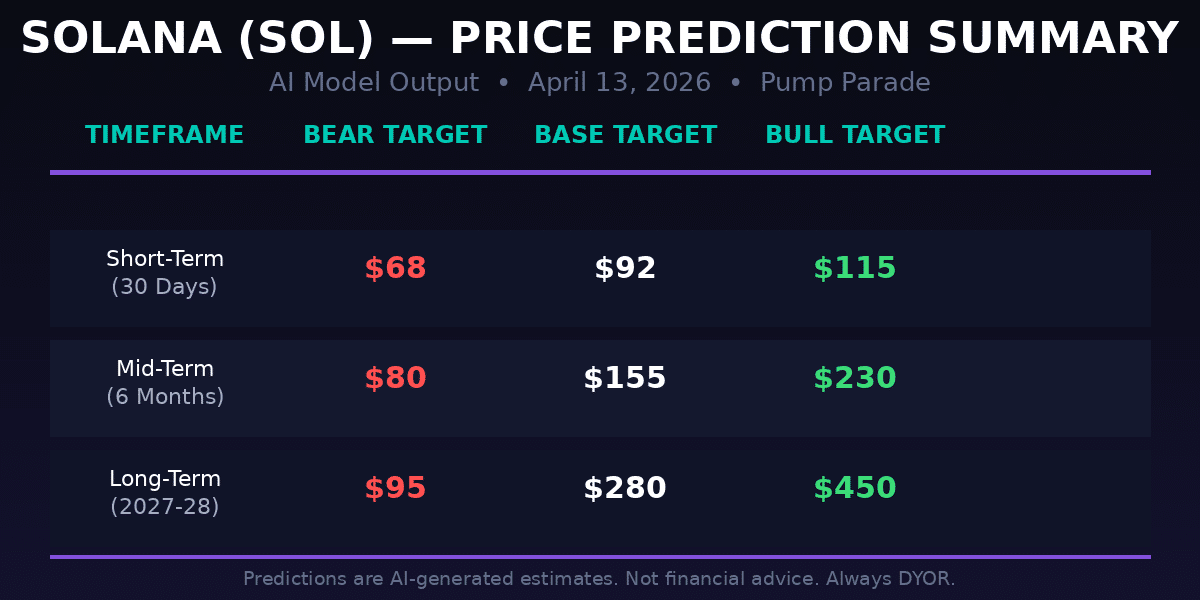
    Solana SOL price prediction table showing bear, base, and bull targets for short-term, mid-term, and long-term timeframes

    Short-Term: 30 Days (May 2026)

    The near-term picture is cautious-to-neutral. SOL needs to reclaim the $90-95 range to confirm upward momentum.

    • Bear target: $68
    • Base target: $92
    • Bull target: $115

    The probability of testing $90 within 30 days sits at approximately 52%, per our model. Macro conditions and Bitcoin’s direction are the primary variables.

    Mid-Term: 6 Months (October 2026)

    This is where the Alpenglow catalyst becomes meaningful. If mainnet deployment lands in Q2-Q3, mid-year price action could be significantly stronger.

    • Bear target: $80
    • Base target: $155
    • Bull target: $230

    Standard Chartered’s $250 target assumes both the Alpenglow upgrade and ETF approval land in 2026. Our base case is more conservative, assuming one of those two catalysts materializes on schedule.

    Long-Term: 2027-2028

    Multi-year forecasts carry significant uncertainty. What the model tracks here is Solana’s fundamental positioning: adoption, developer activity, and competitive moat.

    • Bear target: $95
    • Base target: $280
    • Bull target: $450

    InvestingHaven has projected a corridor of $111 to $450 for 2026 alone. Our model aligns with the upper range of that corridor for 2027-2028 in a bull scenario, contingent on Solana becoming a layer-1 of choice for tokenized real-world assets.

    What to Watch

    Three things to monitor if you’re tracking SOL:

    Alpenglow governance vote: Watch the SIMD-0326 proposal on Solana’s governance forum. A positive vote and mainnet deployment date would be a significant price catalyst.

    SEC filings for Solana ETF: Monitor updates on Grayscale, VanEck, or 21Shares Solana ETF applications. Approval timelines will shape institutional positioning through the rest of 2026.

    $90 SOL as a level to watch: A sustained daily close above $90 would be the first sign of a confirmed recovery trend. Below $75 increases the probability of retesting the 2026 lows.

    For a deeper dive into how to trade Solana ecosystem tokens alongside a broader SOL position, see our guide on finding Solana moonshots.

    Bottom Line

    Solana at $81.93 is a token with real on-chain activity, a credible technical catalyst in Alpenglow, and institutional interest building through potential ETF approval. The bull case is supported by data, not just hope. But the risks are real too: macro headwinds, upgrade delays, and regulatory uncertainty all cap the upside in the near term.

    Our AI model’s base case puts SOL at $155 by October 2026 and $280 by 2028. That’s contingent on Alpenglow shipping and macro conditions not deteriorating sharply. The bear case of $68-80 in the short term is equally plausible if Bitcoin falters below $65,000.

    Worth watching. Not a guaranteed winner. That’s crypto.


    Disclaimer: This article is for informational and educational purposes only and should not be construed as financial, investment, or trading advice. Cryptocurrency markets are highly volatile, and past performance does not guarantee future results. The price predictions and analyses presented here are based on AI models, technical indicators, and available data at the time of writing. They are not guarantees. Always conduct your own research (DYOR) and consult with a qualified financial advisor before making any investment decisions. Pump Parade and its authors do not assume liability for financial losses incurred based on information provided in this article.

    About our AI predictions: Pump Parade’s price predictions are generated by machine learning models that analyze technical indicators, on-chain data, and market sentiment. These models have limitations and cannot account for black swan events, regulatory changes, or sudden market shifts. Prediction confidence scores reflect the model’s internal assessment, not guaranteed accuracy. Use AI predictions as one input among many in your research.
    Solana (SOL) Price Prediction 2026: Can SOL Hit $200?

    0
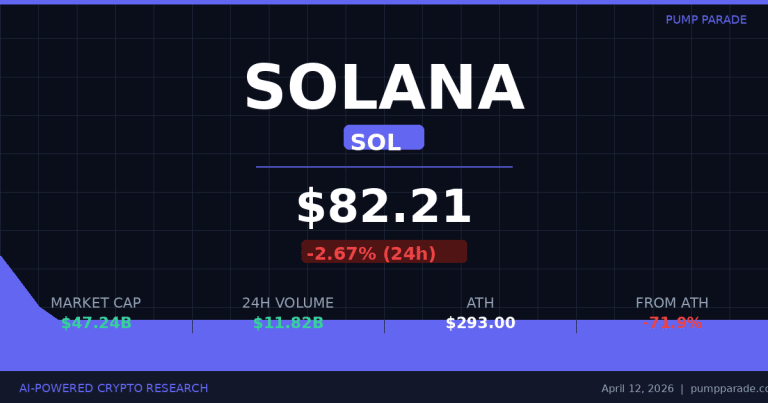
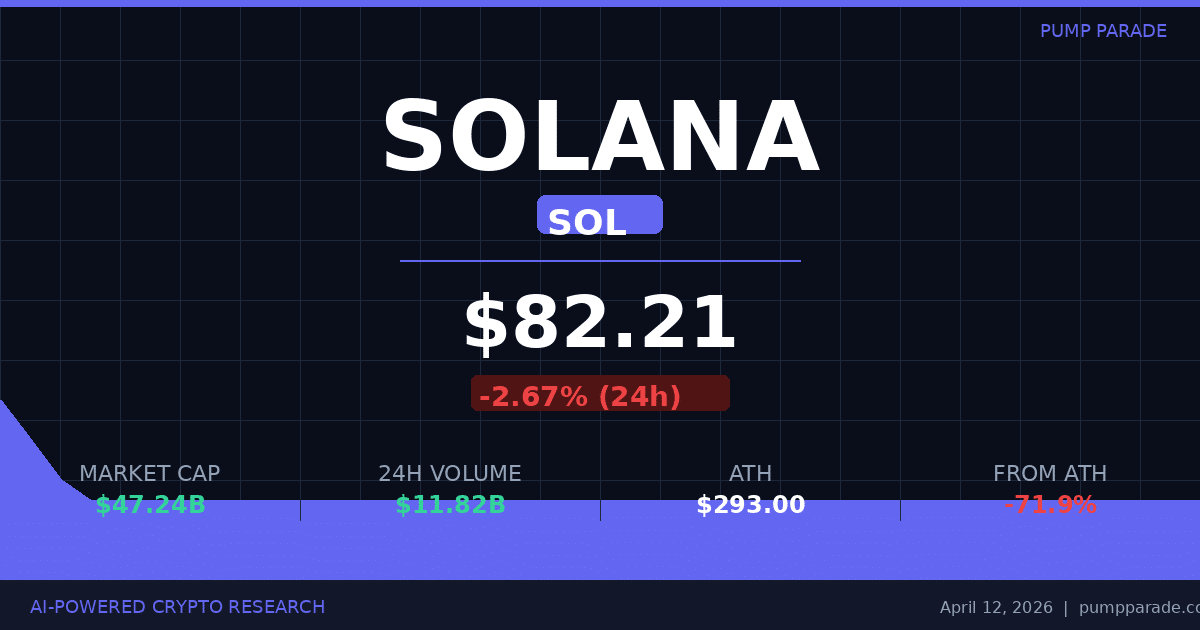
    Solana (SOL) price prediction 2026 hero image showing current price of $82.21 and market data

    Solana is trading at $82.21 today, April 12, 2026 : down 71% from its all-time high of $293 and nursing a fresh wound from the Drift protocol hack that drained $285 million from Solana DeFi just 11 days ago. On paper, SOL looks beaten up.

    But here’s what the bear camp is missing: Solana just hit 167 million monthly token holders : an all-time record, according to Token Terminal data. Daily DEX volume on the Solana ecosystem hit $11.82 billion in the last 24 hours. And the Alpenglow consensus upgrade, which would make Solana 80x faster in transaction finality, is backed by 98% of staked SOL and targeting mainnet by end of 2026.

    This is the tension at the heart of Solana right now: record on-chain adoption, a major technical upgrade on the horizon, and a price chart that looks like a disaster. Our AI model has been running the numbers. Here is what we found.

    Solana (SOL): What You Need to Know

    Solana is a high-performance Layer-1 blockchain designed for speed and low cost. It uses a unique Proof-of-History (PoH) mechanism combined with Proof-of-Stake (PoS) to achieve high transaction throughput. In practical terms, Solana can process thousands of transactions per second with average fees under $0.001.

    The network has become the home of choice for memecoins, DeFi protocols, and consumer crypto apps. It hosts Jupiter (the leading Solana DEX aggregator), Raydium, Drift, and dozens of other protocols. The Solana ecosystem also powers some of the most active NFT markets and GameFi applications in crypto.

    Key metrics as of April 12, 2026:

    • Price: $82.21
    • Market cap: $47.24 billion (ranked #7 globally)
    • 24-hour trading volume: $11.82 billion
    • Circulating supply: approximately 574 million SOL
    • All-time high: $293 (January 2025)
    • Distance from ATH: -71.9%
    • Monthly active token holders: 167 million (all-time high)

    What Just Happened: The Drift Protocol Hack

    On April 1, 2026, Solana-based DeFi platform Drift Protocol was drained of $285 million. It was the largest DeFi hack of 2026 and the second-largest exploit in Solana’s history.

    The attack was sophisticated. Over six months, the attackers (linked to North Korean state actors by Chainalysis) embedded themselves in the Drift contributor community, gained trust, and used a Solana feature called “durable nonces” to pre-sign malicious transactions. Once they had social-engineered real security council members into signing off, they executed the drain in minutes.

    The fallout hit SOL hard. The hack triggered a risk-off wave across Solana DeFi. SOL dropped sharply in the days following, and overall sentiment toward Solana’s security model took a hit.

    The Solana Foundation responded within a week, announcing a comprehensive security overhaul that includes stricter validator client standards, new auditing frameworks for protocols using durable nonces, and enhanced monitoring for governance attack vectors.

    The question for investors: is the Drift hack a one-off security failure at the protocol level, or does it reveal a deeper vulnerability in Solana’s ecosystem? We lean toward the former. The attack exploited social engineering : a human problem, not a protocol flaw. But it is a real risk that any balanced SOL thesis must include.

    Technical Analysis: Where SOL Stands Today

    The technical picture for SOL is unambiguously bearish on the long-term chart : but potentially setting up a short-term bounce from oversold levels.

    Key levels to watch:

    • Immediate support: $80 (psychological level, tested multiple times)
    • Strong support: $78.30 (Fibonacci swing low)
    • First resistance: $85.26 (23.6% Fibonacci retracement)
    • Major resistance zone: $91-$92 (supply zone)
    • 50-day simple moving average (SMA): approximately $85-$86
    • 200-day SMA: approximately $131

    RSI analysis: The 14-day RSI (Relative Strength Index : a momentum oscillator that ranges from 0 to 100) sits at approximately 28-30. That is in oversold territory. Historically, SOL bounces have occurred when RSI drops below 30. That said, oversold does not mean bottomed. In prolonged bear trends, RSI can stay below 30 for extended periods.

    The bearish technical structure is clear: the 50-day SMA is below the 200-day SMA, a pattern known as a “death cross” that has preceded continued weakness in past cycles. Until SOL reclaims the 50-day SMA around $85-$86 on meaningful volume, any rally is likely to face resistance.

    The more constructive read: if SOL holds the $78-$80 support zone and BTC stabilizes above $70,000, the risk-reward for a bounce to the $91-$92 resistance zone is reasonably attractive in the near term.

    The Alpenglow Upgrade: SOL’s Biggest Catalyst in Years

    If there is one reason the long-term bull case for SOL remains credible despite the current selloff, it is Alpenglow.

    Alpenglow (SIMD-0326) is the most significant protocol upgrade in Solana’s history. The core goal: slash transaction finality from 12.8 seconds to approximately 150 milliseconds : an 80x improvement. To put that in context, Visa processes transactions in milliseconds. At 150ms finality, Solana would be competitive with traditional payment rails.

    Here’s how it works. Alpenglow replaces two core components of Solana’s consensus mechanism. Votor collapses the current multi-round confirmation process into one or two rounds. When 80% of validator stake is active, finality happens in a single round at around 100ms. Rotor replaces Turbine as the block propagation layer, using stake-weighted relays and erasure coding to remove bandwidth bottlenecks.

    The validator community voted 98% in favor of the upgrade. Mainnet deployment is targeted for end of 2026. When it launches, Solana’s use cases expand dramatically: high-frequency trading, real-time consumer apps, decentralized AI agents, and payment processing all become far more viable.

    Standard Chartered’s crypto research team has set a year-end 2026 price target of $250 for SOL, citing Alpenglow and the Firedancer validator client (which is expected to push throughput past one million transactions per second) as the primary catalysts.

    Bull Case for SOL in 2026

    The bull case rests on several converging forces.

    First, the adoption metrics are extraordinary. 167 million monthly token holders is not a number you typically see in a dying ecosystem. That is more monthly active participants than many tier-one financial platforms. The gap between SOL’s on-chain adoption and its price performance is historically unusual.

    Second, Alpenglow activation could be a major narrative catalyst. Protocol upgrades that deliver real performance improvements have historically driven price re-ratings. When Solana launched Firedancer testnet validators in early 2025, it drove a significant sentiment shift. Alpenglow mainnet would be a bigger event.

    Third, if the broader crypto market follows BTC’s historically bullish post-halving trajectory into late 2026, SOL tends to outperform on the upside. In the 2020-2021 cycle, SOL was a top-5 performer. In the 2024-2025 cycle, it reached $293.

    Bull case price targets: $110 (30 days), $200 (October 2026), $350 (2027-2028).

    Bear Case and Risks

    The bear case is not hard to construct right now.

    The Drift hack damaged confidence in Solana DeFi. While the attack was a social engineering failure rather than a protocol exploit, the reputational damage is real. Institutional capital flowing into DeFi does not easily distinguish between “human error” and “platform risk.”

    The technical structure is weak. The death cross (50-day SMA below 200-day SMA) is in effect. SOL has been trading below both key moving averages for months. A break below $78 would likely accelerate selling toward $65-$70.

    Macro risk is elevated. BTC is holding above $70,000, but the broader market has been choppy. If risk-off sentiment returns and BTC retests $60,000, altcoins including SOL would face significant additional downside.

    Competition is also intensifying. Ethereum L2s, Sui, and Aptos are competing for the same developer mindshare and TVL. While Solana’s user numbers remain strong, the ecosystem is no longer the only high-performance option in town.

    Bear case price targets: $70 (30 days), $75 (October 2026 if hack fallout persists), $95 (2027-2028 floor in prolonged bear scenario).

    SOL Price Predictions: AI Model Summary

    Our hybrid AI model analyzes technical indicators, on-chain metrics, historical price patterns, sentiment data, and macro correlations. Here is the current output for SOL.

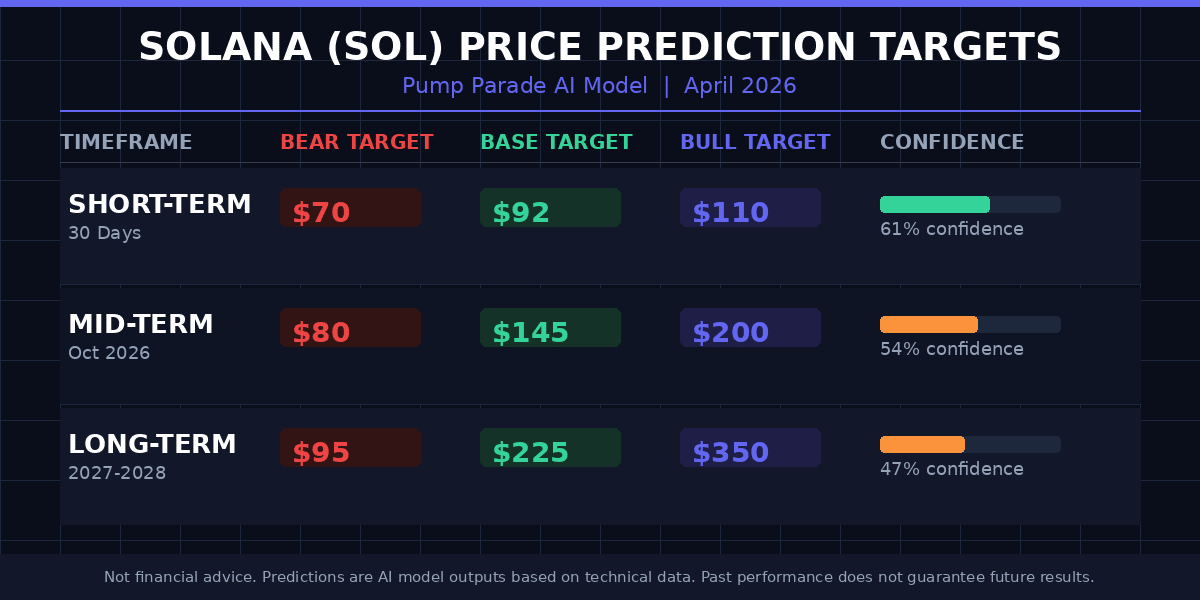
    Solana SOL price prediction targets table showing bear, base, and bull scenarios for 30 days, mid-term October 2026, and long-term 2027-2028

    Short-term (30 days, by mid-May 2026): The model assigns a 61% confidence to the base case range of $88-$95. If SOL holds the $78-$80 support zone and BTC stays above $68,000, a bounce to resistance around $91-$95 is the most likely near-term outcome. The bear case ($70) requires a fresh catalyst: another major hack, a BTC breakdown, or broader market deterioration. The bull case ($110) would need Alpenglow-related news flow or a BTC breakout above $80,000.

    Mid-term (by October 2026): This is where the thesis hinges most on Alpenglow. A successful mainnet upgrade by Q3 2026 could drive a significant re-rating. The base case of $145 assumes moderate BTC price appreciation and Alpenglow shipping on schedule. The bull case of $200 requires institutional narrative around Alpenglow to drive meaningful new capital inflows. The bear case of $80 reflects a scenario where Alpenglow is delayed, macro conditions worsen, or DeFi security concerns continue to weigh on the ecosystem.

    Long-term (2027-2028): The 2028 Bitcoin halving cycle historically lifts the entire market. If Solana maintains its developer activity and Alpenglow delivers the promised performance gains, a retest of the previous ATH range ($250-$300) is plausible. The base case of $225 aligns with Standard Chartered’s view. The bull case of $350 represents a new ATH, which would require a macro bull cycle similar to 2020-2021. For more on how the 2028 halving could impact the broader crypto market, see our analysis of Bitcoin’s price prediction for 2028.

    What to Watch

    If you are following SOL, here are the key indicators and events to monitor over the next 30-90 days.

    • $78-$80 support zone: A daily close below $78 with volume would be a meaningful bearish signal. A bounce from this level sets up a potential recovery to $91-$92.
    • Alpenglow deployment timeline: Any developer updates on the SIMD-0326 mainnet timeline will move SOL. Watch the Solana GitHub and official communications from the Solana Foundation.
    • Drift recovery: The Solana Foundation’s security overhaul response will be watched closely by DeFi TVL. TVL recovery would be a positive signal for broader ecosystem health.
    • BTC correlation: SOL moves with BTC. A sustained BTC rally above $80,000 would likely lift SOL meaningfully. A BTC breakdown below $65,000 would put the $78 support level under serious pressure.
    • Firedancer validator adoption: Watch the percentage of validators running Firedancer clients. Higher adoption strengthens both performance and decentralization narratives.

    The Bottom Line

    Solana at $82 is a genuinely complex situation. The on-chain numbers : 167 million monthly holders, $11.8 billion daily DEX volume : tell a story of a network that users are actively choosing. The price chart tells a different story: a network down 71% from its high, with weak technical structure and a fresh DeFi security scare.

    The honest answer is that both stories are true simultaneously. Solana has real adoption. It also has real risks. The Alpenglow upgrade is a credible, technically sound catalyst that could re-rate the asset. The Drift hack is a real reputational setback that will not be forgotten quickly.

    Our base case: SOL bottoms in the $75-$85 range through Q2 2026, then rerates higher as Alpenglow deployment approaches. But this is a high-conviction setup only if you believe in Solana’s long-term roadmap and can stomach continued short-term volatility.

    The risk-reward here is more interesting than the bear market sentiment suggests. That does not make it easy. It just makes it worth watching closely.


    Disclaimer: This article is for informational and educational purposes only and should not be construed as financial, investment, or trading advice. Cryptocurrency markets are highly volatile, and past performance does not guarantee future results. The price predictions and analyses presented here are based on AI models, technical indicators, and available data at the time of writing : they are not guarantees. Always conduct your own research (DYOR) and consult with a qualified financial advisor before making any investment decisions. Pump Parade and its authors do not assume liability for financial losses incurred based on information provided in this article.

    About our AI predictions: Pump Parade’s price predictions are generated by machine learning models that analyze technical indicators, on-chain data, and market sentiment. These models have limitations and cannot account for black swan events, regulatory changes, or sudden market shifts. Prediction confidence scores reflect the model’s internal assessment, not guaranteed accuracy. Use AI predictions as one input among many in your research.
    Solana (SOL) Price Prediction 2026

    0
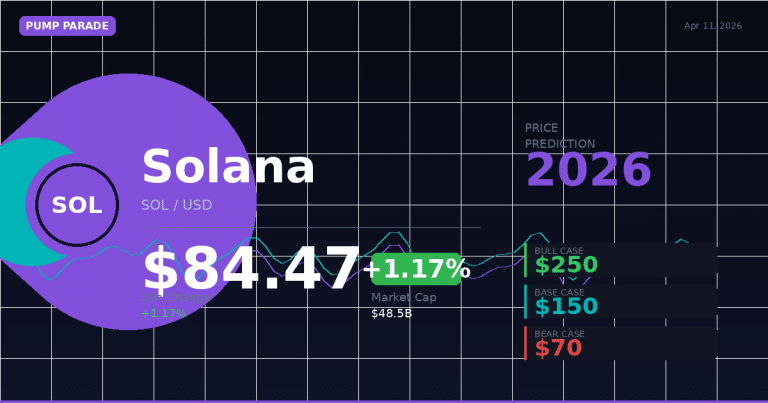
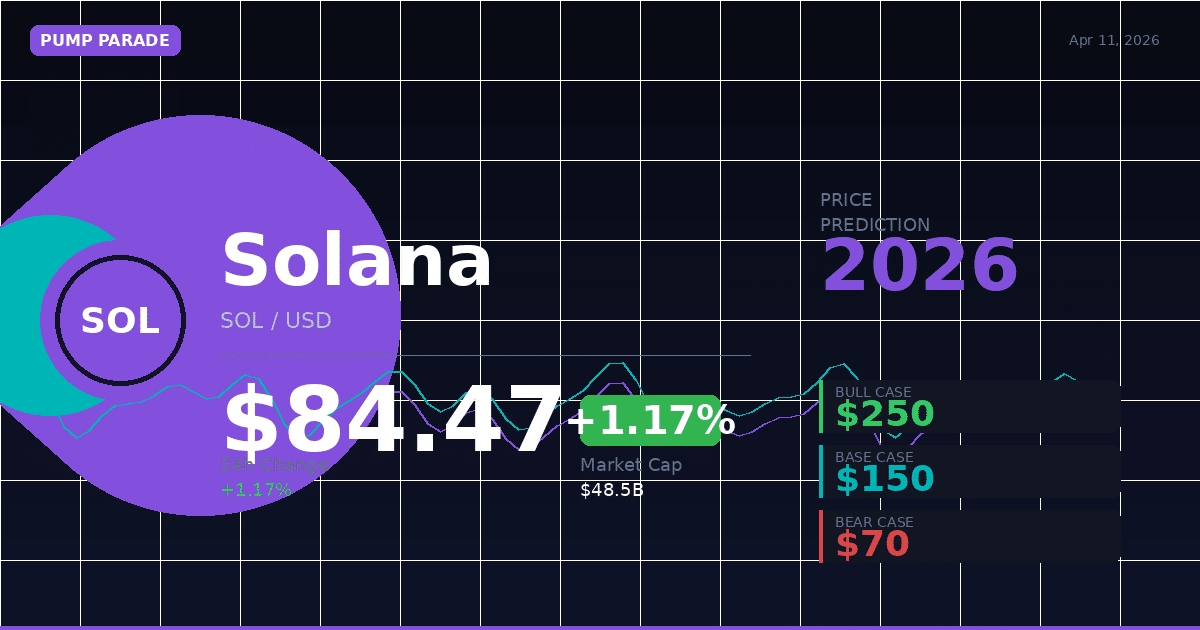
    Solana SOL price prediction 2026 hero image showing current price $84.47 and forecast targets

    Solana is trading at $84.47 as of April 11, 2026. That is a steep 71% drop from its January peak of $293. Ouch.

    But here is the thing: the fundamentals have not collapsed. The network is busier than ever, with $42.9 billion in 24-hour trading volume across the ecosystem. A major consensus upgrade is working its way toward mainnet. And institutional money is flowing in through spot ETFs.

    So is this a fire sale or a falling knife? Our AI model has been running the numbers. Let us break it down.

    What Is Solana (SOL)?

    Solana is a high-performance Layer 1 blockchain built for speed and scale. It can process thousands of transactions per second at fractions of a cent per transaction. That makes it the home of choice for DeFi protocols, NFT marketplaces, memecoins, and trading applications.

    Key metrics as of April 11, 2026:

    • Current price: $84.47
    • Market cap: $48.5 billion
    • 24-hour volume: $42.9 billion
    • Liquidity (on-chain): $5.93 billion
    • 24h price change: +1.17%

    Solana hit an all-time high of $293 in January 2026. Since then, it has shed nearly three-quarters of its value. The broader crypto market pullback has been brutal across the board. CoinGecko data shows SOL still ranks among the top five cryptocurrencies by market cap.

    The Alpenglow Upgrade: Solana’s Biggest Bet

    The most important thing happening in the Solana ecosystem right now is the Alpenglow upgrade, also known as SIMD-0326.

    Here is what it does: it slashes transaction finality from roughly 12 seconds down to about 150 milliseconds. That is 80 times faster. For a network that already markets itself on speed, this is a game-changer.

    The upgrade passed a validator vote with 98% approval in late 2025. It is currently in testnet. Mainnet deployment is expected in late 2026, pending security audits and community testing.

    Why does this matter for the price? Faster finality means Solana becomes more competitive with centralized exchanges. That unlocks a new class of use cases: high-frequency trading, real-time settlement, and institutional-grade applications. More use cases means more demand for SOL to pay fees.

    Institutional Tailwinds

    The regulatory picture got a lot clearer in March 2026. U.S. regulators formally classified SOL as a digital commodity. That is significant. It provides legal certainty for staking, protocol activities, and institutional investment vehicles.

    The money has followed. Goldman Sachs holds over $108 million in SOL ETF positions. Standard Chartered has published a $250 price target for SOL in 2026. These are not retail hype signals. This is institutional positioning.

    Technical Analysis: Where Does SOL Stand?

    SOL is in a challenging technical position right now. But it is not as bad as the headlines make it sound.

    Key levels to know:

    • Current price: $84.47
    • Immediate support: $81.49 and $80.35
    • Critical support floor: $78.31
    • Resistance 1: $87.85 (near-term ceiling)
    • Resistance 2: $91-$92 (strong supply zone)
    • Key breakout level: $97

    The 14-day RSI (Relative Strength Index, a measure of momentum) sits at around 47-52. That puts SOL in neutral territory. It is not oversold, which means there is no forced technical bounce. But it is also not overbought. There is room to move in either direction.

    The longer-term picture is more cautious. The 50-day and 200-day moving averages are both sloping downward. That signals that the dominant trend is still bearish. Clearing the $97 level on a sustained daily close would change that picture meaningfully. Until then, the path of least resistance is sideways to lower.

    The price action is shaping into a potential bear flag pattern in the short term. This is a pattern where a brief consolidation follows a downtrend, and it often resolves lower. The level to watch on the downside is $78. A confirmed break below that opens the door to the $60-$65 range.

    The Bull Case for SOL in 2026

    The optimistic path for Solana has three clear engines:

    1. Alpenglow goes live and delivers. If mainnet Alpenglow launches smoothly in late 2026, it will be the biggest technical upgrade in Solana’s history. Expect a strong narrative-driven rally in the months leading up to launch. Standard Chartered’s $250 target is built around this catalyst.

    2. Spot ETF inflows accelerate. The SOL commodity classification is already attracting institutional capital. If Bitcoin ETF inflows continue (Goldman Sachs, BlackRock, and others are all now holding SOL), demand for SOL will grow structurally. Each new institutional holder reduces circulating supply.

    3. The broader crypto cycle turns. Bitcoin is sitting near $70,000 right now. If it breaks above the $85,000 range, the entire market typically follows. Solana, as a high-beta asset, often amplifies Bitcoin moves. In prior cycles, SOL has outperformed BTC by 3-5x on the upside when sentiment shifts. Our sister analysis covers the Bitcoin price prediction for 2028 and the macro setup in detail.

    The Bear Case for SOL in 2026

    The risks are real. A balanced take requires sitting with the uncomfortable scenarios.

    1. Alpenglow gets delayed again. The upgrade’s mainnet timeline has already shifted from early 2026 to late 2026. Another delay, or a security incident during testnet, would hammer sentiment. Narrative-driven assets get crushed when the narrative misses its moment.

    2. Macro deterioration. If global risk appetite collapses, crypto follows. SOL fell 71% from its ATH in a relatively benign macro environment. A real risk-off move could push SOL toward the $60-$65 range, and possibly lower.

    3. Competition from Ethereum and Base. Ethereum’s L2 ecosystem (Base, Arbitrum, Optimism) has gotten significantly faster and cheaper. If Alpenglow delays, some of the use cases Solana was going to capture may flow to competing chains instead.

    Solana Price Prediction 2026: Our AI Model Targets

    Our hybrid AI model analyzes technical indicators, on-chain data, institutional flow data, and historical pattern recognition. It assigns probability weights to different scenarios. Here is what it outputs for SOL:

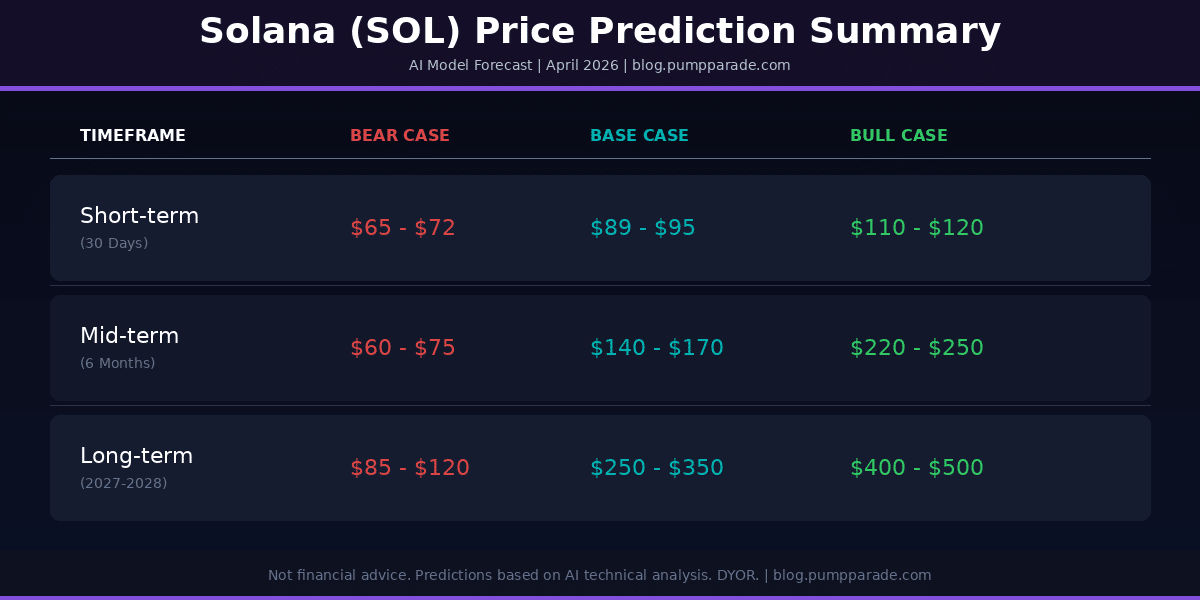
    Solana SOL price prediction 2026 table showing bear, base, and bull case targets for 30 days, 6 months, and 2027-2028

    Short-Term Prediction (30 Days)

    In the next 30 days, SOL needs to hold the $80-$81 support zone. If it does, a move back toward $89-$95 is the base scenario. That would be a 6-12% gain from current levels.

    • Bear case: $65-$72 (breakdown below $78 floor)
    • Base case: $89-$95 (reclaim key resistance)
    • Bull case: $110-$120 (strong breakout with volume)

    Mid-Term Prediction (6 Months, by October 2026)

    By October 2026, Alpenglow should be in final testing or close to mainnet. That positions SOL for a narrative-driven re-rating.

    • Bear case: $60-$75 (macro deterioration, upgrade delays)
    • Base case: $140-$170 (Alpenglow approaching launch, ETF inflows steady)
    • Bull case: $220-$250 (Alpenglow live early, BTC breakout, institutional surge)

    Long-Term Prediction (2027-2028)

    If Alpenglow delivers and the broader crypto cycle enters a new bull phase, the long-term upside for SOL is substantial.

    • Bear case: $85-$120 (consolidation, no cycle, competition pressure)
    • Base case: $250-$350 (Alpenglow live, adoption growth, post-halving BTC cycle lift)
    • Bull case: $400-$500 (new all-time highs, institutional standard for L1 exposure)

    Our model assigns a 58% probability to the base-case mid-term scenario. The bear case holds a 27% probability, and the bull case accounts for 15%. The balance of risks is tilted toward the downside in the near term. The medium-term picture depends almost entirely on the Alpenglow timeline.

    What to Watch: Key Signals for SOL in 2026

    Here is a practical framework for tracking the SOL thesis:

    • The $78 support level. A daily close below this is the near-term danger sign. It changes the probability weighting toward the bear case.
    • The $97 breakout level. A weekly close above this would flip the technical picture from bearish to neutral-bullish. Watch for volume confirmation.
    • Alpenglow testnet progress. Monitor the Solana developer forums and GitHub for SIMD-0326 updates. Any mainnet timeline announcement will move the price.
    • Bitcoin’s $85K test. BTC breaking above $85,000 with conviction typically drags the altcoin market higher. SOL would benefit disproportionately given its beta.
    • ETF flow data. Track weekly SOL ETF inflows. Sustained inflows above $50M/week would be a strong institutional confirmation signal.

    Disclaimer: This article is for informational and educational purposes only and should not be construed as financial, investment, or trading advice. Cryptocurrency markets are highly volatile, and past performance does not guarantee future results. The price predictions and analyses presented here are based on AI models, technical indicators, and available data at the time of writing. They are not guarantees. Always conduct your own research (DYOR) and consult with a qualified financial advisor before making any investment decisions. Pump Parade and its authors do not assume liability for financial losses incurred based on information provided in this article.

    About our AI predictions: Pump Parade’s price predictions are generated by machine learning models that analyze technical indicators, on-chain data, and market sentiment. These models have limitations and cannot account for black swan events, regulatory changes, or sudden market shifts. Prediction confidence scores reflect the model’s internal assessment, not guaranteed accuracy. Use AI predictions as one input among many in your research.
    Solana (SOL) Price Prediction 2026

    0

    SOL at $83: Bargain Buy or Falling Knife?

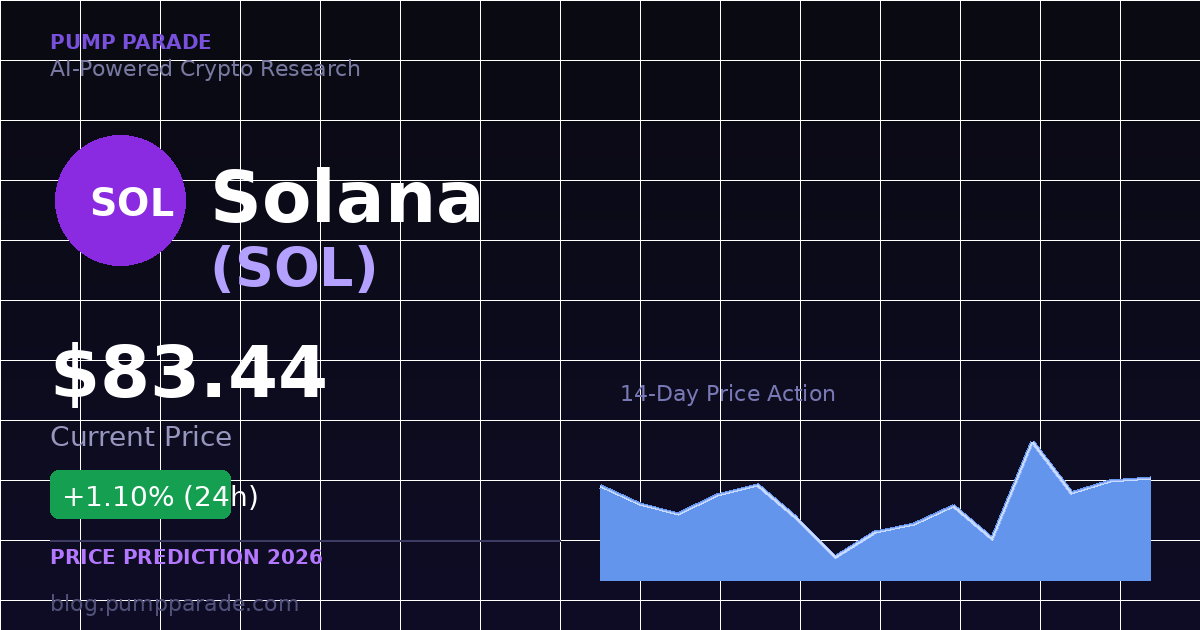
    Solana is trading at $83.44 as of April 10, 2026, down roughly 72% from its all-time high of $295 reached in January 2025. Daily trading volume on Solana-based markets sits above $17 billion, making it one of the most liquid ecosystems in crypto outside of Bitcoin and Ethereum.

    That disconnect between activity and price tells an interesting story. The network is not slowing down. The ecosystem is not dying. Something else is weighing on the price, and understanding what it is matters if you are trying to figure out whether SOL has a path back to three digits in 2026.

    Our hybrid AI model has analyzed on-chain data, technical indicators, and macro conditions. Here is what the data suggests, along with both sides of the trade.

    Solana SOL price prediction 2026 hero image showing current price of $83.44 and 24h change

    What Is Solana? A Quick Overview

    Solana is a high-performance Layer 1 blockchain built for speed and low cost. It uses a hybrid of Proof of Stake and a mechanism called Proof of History (PoH), which lets the network process transactions without requiring validators to communicate timestamps. The result: up to 65,000 transactions per second at sub-cent gas fees.

    Founded by Anatoly Yakovenko in 2017, Solana has grown into one of the top five blockchains by market cap. Its ecosystem spans DeFi, NFTs, memecoins, gaming, and increasingly, real-world asset (RWA) tokenization. As of March 2026, RWA tokenization on Solana crossed $2 billion, a milestone driven by partnerships with institutional players like Ondo Finance and State Street.

    The circulating supply is approximately 573 million SOL, with a market cap of roughly $47.9 billion at current prices.

    Current Price Context: What the Chart Is Telling Us

    Over the past two weeks, SOL has traded in a tight band between $76.66 and $88.74. That range tells you the market is undecided. Neither buyers nor sellers have conviction right now.

    Key technical observations from Birdeye and on-chain data:

    • Support zone: $78 to $81 has held twice in the past 10 days. A close below $76 would signal a more serious breakdown.
    • Resistance zone: $87 to $88 is the first hurdle. Above that, the $94 to $96 range is where sellers have been concentrated since February.
    • RSI: The Relative Strength Index (RSI, a momentum indicator measuring whether an asset is overbought or oversold) sits near 52. That is squarely neutral. No extreme in either direction.
    • Moving averages: SOL is trading below both the 50-day and 200-day moving averages. Until it reclaims the 50-day (currently near $94), the trend remains cautiously bearish on higher timeframes.

    The pattern of lower highs since January 2025 is real and worth taking seriously. But the $78 support has held consistently, which is an equally real signal.

    The Alpenglow Upgrade: Solana’s Biggest Catalyst in Years

    The single most important development for SOL in 2026 is the Alpenglow consensus upgrade.

    Here is the short version: Solana currently takes about 12 seconds to finalize a transaction. Alpenglow will cut that to approximately 150 milliseconds, an 80x improvement. The upgrade redesigns the validator coordination protocol using a new mechanism called Votor, a lightweight voting process that finalizes blocks in one or two rounds instead of multiple communication cycles.

    The Solana community voted on the proposal with 98.27% approval from participating validators. Mainnet launch is expected in 2026, likely in the second half of the year based on current testnet timelines.

    Why does this matter for price? Speed is a competitive moat. At 150ms finality, Solana becomes the fastest finalized Layer 1 by a wide margin. That opens the door for use cases that currently require centralized infrastructure: high-frequency trading platforms, real-time payment rails, and consumer apps that need near-instant confirmation.

    The bull case is that Alpenglow is a genuine step-function improvement. Not a marketing upgrade, but a technical one that expands what Solana can do.

    The Bull Case for SOL in 2026

    The bull case rests on three pillars.

    Pillar 1: Alpenglow launch triggers a re-rating. If Alpenglow ships in Q3 or Q4 2026, the narrative around Solana will shift. Developers targeting high-frequency use cases have been waiting for this. A successful mainnet launch could drive a wave of new applications and capital inflows. Historical precedent: Ethereum’s major upgrades have consistently preceded 60 to 90-day rallies.

    Pillar 2: RWA tokenization tailwind. Solana’s RWA ecosystem crossed $2 billion in March 2026. That number is still small relative to Ethereum’s, but the growth rate is fast. As institutional players like Ondo Finance and State Street deepen their Solana integration, SOL benefits as the gas and staking asset powering those transactions.

    Pillar 3: Bitcoin’s trajectory sets the floor. BTC is currently near $71,000 to $72,000. If Bitcoin follows its historical post-halving pattern and moves toward the $85,000 to $100,000 range by Q4, capital rotation into altcoins tends to follow. SOL has historically outperformed Bitcoin during altcoin seasons by a significant margin.

    Bull price targets from our model: $110 to $130 by June 2026, with a high-conviction upside scenario of $180 to $200 if Alpenglow ships cleanly and Bitcoin breaks above $85,000.

    The Bear Case for SOL in 2026

    The bear case is straightforward and should not be dismissed.

    Risk 1: Macro deterioration. Geopolitical tensions and trade policy uncertainty have weighed on risk assets throughout early 2026. If macro conditions worsen, higher rates, wider credit spreads, and equity selloffs would pull crypto lower with them. SOL’s $78 support could become $65, and $65 could become $50 in a severe risk-off environment.

    Risk 2: Alpenglow delays or execution risk. Consensus mechanism upgrades are extremely complex. Any security vulnerability, validator coordination issues, or timeline slippage could disappoint the market. The 98% validator approval is encouraging, but approval is not the same as flawless execution.

    Risk 3: Competition from Ethereum Layer 2s. Ethereum’s scaling roadmap is progressing. Multiple Layer 2 solutions now offer sub-cent fees and fast finality. If the speed gap between Solana and Ethereum’s ecosystem narrows, the narrative case for SOL weakens.

    Risk 4: The lower-highs pattern. The chart has printed lower highs since the January 2025 peak. Until SOL reclaims $95 and holds it, that trend is intact. Breaking a trend of this duration requires a catalyst, not just optimism.

    Bear price targets: $65 to $72 in a deteriorating macro scenario. A breakdown below $76 would likely test the $65 range quickly.

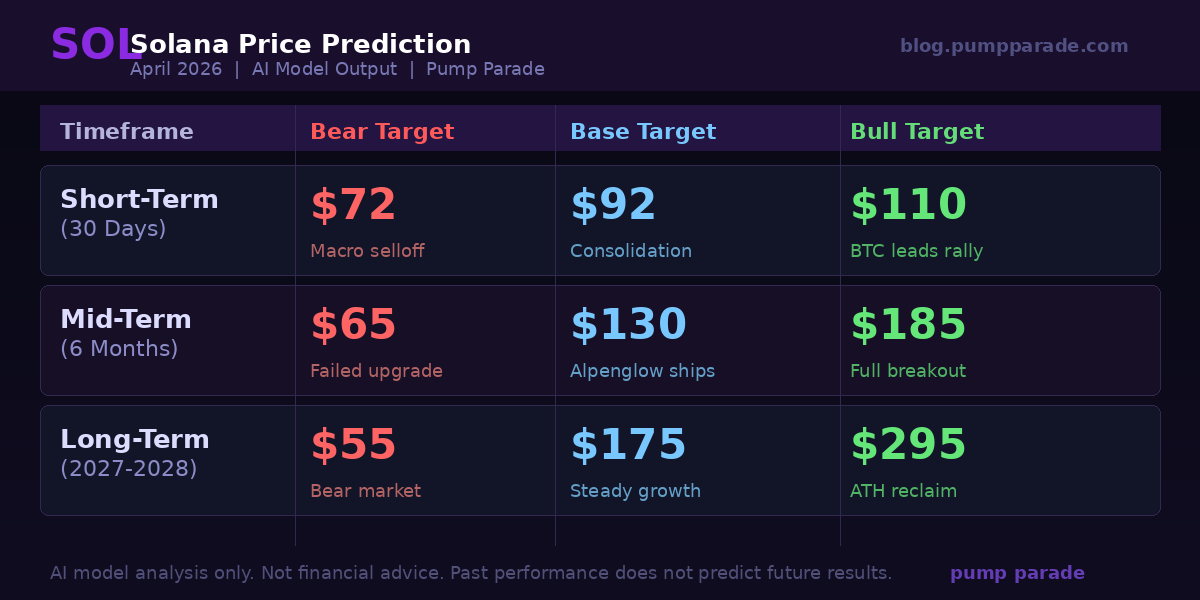
    AI Price Prediction Summary

    Our hybrid model combines technical indicators, on-chain metrics, and sentiment signals to generate probabilistic price ranges. These are scenario-weighted outputs, not guarantees.

    Solana SOL price prediction targets table showing bear, base and bull scenarios for 30 days, 6 months and 2027-2028

    Short-Term Prediction (30 Days)

    SOL is in a consolidation phase with neutral momentum. The 30-day base case is range-bound price action between $80 and $95, with a breakout attempt toward $100 if Bitcoin shows strength.

    • Bear target: $72
    • Base target: $92
    • Bull target: $110

    Mid-Term Prediction (6 Months)

    The six-month window is where Alpenglow becomes a swing factor. A successful upgrade announcement or testnet milestone should act as a catalyst. Our model assigns 55% probability to the base case, 25% to the bear, and 20% to the bull.

    • Bear target: $65
    • Base target: $130
    • Bull target: $185

    Long-Term Prediction (2027-2028)

    Longer-term price targets depend heavily on whether Solana can capture meaningful market share in RWA tokenization and high-frequency DeFi. The 2028 Bitcoin halving cycle is also a significant variable for the entire crypto market.

    • Bear target: $55
    • Base target: $175
    • Bull target: $295 (reclaim of all-time high)

    What to Watch

    These are the specific signals worth monitoring over the next 90 days:

    • Alpenglow testnet progress. Any announcement of mainnet launch timing will move the price. Watch Solana Foundation announcements and validator communications.
    • Bitcoin above $80,000. BTC sustaining above $80K creates the conditions for altcoin rotation. SOL tends to outperform in those environments.
    • The $78 support level. This is the line. A weekly close below $78 changes the near-term picture significantly.
    • $88 to $94 resistance. A clean break and retest above $88 would be the first signal that the lower-highs pattern is breaking.
    • RWA tokenization milestones. Watch for Solana ecosystem announcements around institutional partnerships or new RWA products. Each additional $1 billion in RWA added is a credibility signal for the network.

    If you are researching Solana’s memecoin ecosystem alongside the broader price outlook, check out our guide on Solana Memecoins: How to Find Massive Crypto Moonshots. It covers how the Solana ecosystem works at the retail trading layer and what drives memecoin cycles on the network.

    The Bottom Line

    SOL at $83 is not obviously cheap, and it is not obviously expensive. The network is among the most active in crypto. The upcoming Alpenglow upgrade is a legitimate technical catalyst. The RWA tokenization story is gaining traction with real institutional money.

    But the chart is still printing lower highs, macro uncertainty is real, and complex upgrades carry execution risk. The data supports cautious optimism for a recovery toward $130 by October 2026. Blind confidence is not warranted.

    The setup is worth monitoring. It is not a layup.


    Disclaimer: This article is for informational and educational purposes only and should not be construed as financial, investment, or trading advice. Cryptocurrency markets are highly volatile, and past performance does not guarantee future results. The price predictions and analyses presented here are based on AI models, technical indicators, and available data at the time of writing. They are not guarantees. Always conduct your own research (DYOR) and consult with a qualified financial advisor before making any investment decisions. Pump Parade and its authors do not assume liability for financial losses incurred based on information provided in this article.

    About our AI predictions: Pump Parade’s price predictions are generated by machine learning models that analyze technical indicators, on-chain data, and market sentiment. These models have limitations and cannot account for black swan events, regulatory changes, or sudden market shifts. Prediction confidence scores reflect the model’s internal assessment, not guaranteed accuracy. Use AI predictions as one input among many in your research.
    Axiom Review 2026: Fees, Features & Verdict

    0

    Axiom has gone from zero to $300 million in revenue in just 263 days, making it the fastest crypto application to hit that milestone. But raw speed and hype don’t always mean a platform is right for you. In this Axiom review, we’ll break down the features, fees, security, and user experience to help you decide if Axiom Pro is worth switching to in 2026.

    Quick Verdict: 8.5/10

    Axiom Pro is the most feature-rich Solana trading terminal available right now. If you’re actively trading memecoins or SPL tokens, it offers the fastest execution, built-in copy trading, wallet tracking, and MEV protection in one clean interface. The 0.95% fee per trade is standard for the category, and the cashback tier system rewards high-volume traders. The main downsides: it’s Solana-first (with BNB Chain as a secondary option), and the learning curve can be steep for total beginners.

    What Is Axiom?

    Axiom is a non-custodial, browser-based trading terminal built primarily for the Solana ecosystem. Backed by Y Combinator, it launched in mid-2025 and quickly became the dominant on-chain trading platform, overtaking established players like Photon, BullX, and GMGN.

    Unlike older Telegram-based trading bots, Axiom gives you a full web interface with real-time charts, one-click trading, and integrated token discovery. You keep full control of your private keys through Turnkey’s air-gapped key infrastructure, so the platform never has custody of your funds.

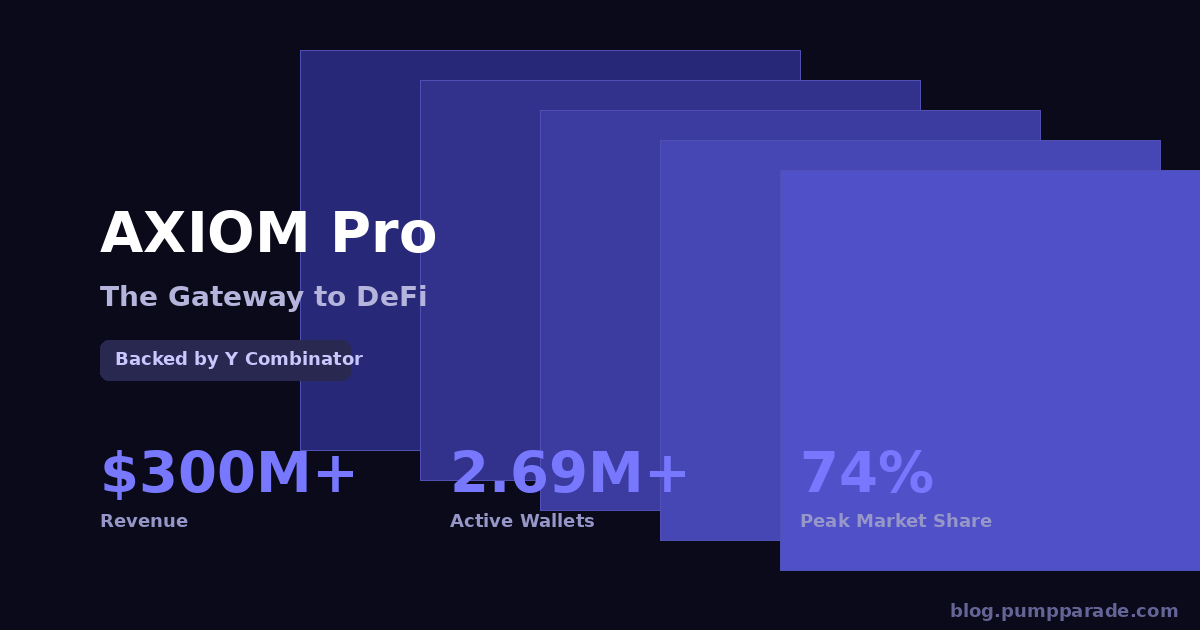
    The numbers tell the story: Axiom has processed over $45 billion in lifetime trading volume, serves more than 2.69 million active wallets, and hit a peak market share of 74% among Solana trading terminals. It earned $300 million in cumulative revenue in just 263 days, making it the fastest crypto application to reach that figure and one of the fastest revenue-generating startups in Y Combinator history.

    Axiom Pro trading terminal - The Gateway to DeFi
    Axiom Pro – The fastest-growing Solana trading terminal in 2026

    Key Features

    Execution Speed

    Axiom’s proprietary execution engine is its biggest selling point. Orders typically land within a single Solana block, giving you a 2-3 second speed advantage over most competitors. During high-congestion periods like token launches, this edge can be the difference between a profitable entry and getting front-run.

    One-Click Trading

    The interface lets you buy and sell with preset SOL amounts, so you can execute trades in under a second. You can paste a token contract address and buy instantly, or use the live pair discovery feed to spot and trade new tokens without leaving the platform.

    Copy Trading

    Axiom lets you mirror the moves of successful wallets automatically. You set customizable parameters including slippage tolerance, buy/sell amounts, and risk limits. This feature is especially useful for newer traders who want to learn by following experienced on-chain traders, or for anyone looking to diversify strategies without constant monitoring.

    Wallet Tracking

    The wallet tracking tool lets you follow “smart money” wallets in real time. You’ll get alerts when tracked wallets make trades, giving you early signals on token movements before they hit broader market attention.

    Tweet Monitor

    A built-in Twitter/X monitoring tool surfaces crypto-related tweets and social sentiment directly in the trading interface. This is useful for catching token catalysts early, since a lot of memecoin price action is driven by social media momentum.

    MEV Protection

    Axiom routes transactions through its own execution engine with optional MEV protection to reduce the risk of sandwich attacks and front-running. While no MEV protection is 100% guaranteed, the platform’s approach meaningfully reduces slippage on trades, especially during volatile market conditions.

    Limit and DCA Orders

    You can set limit orders to buy or sell at specific price targets, plus dollar-cost averaging (DCA) orders to spread entries over time. These tools let you set up trades and walk away, which is a major improvement over the manual, screen-watching approach that many on-chain traders are used to.

    Migration Sniper

    When tokens migrate from one liquidity pool to another (common with pump.fun launches), Axiom’s migration sniper automatically buys as the token moves to the new pool. This is a niche but valuable feature for memecoin traders who want to catch early liquidity events.

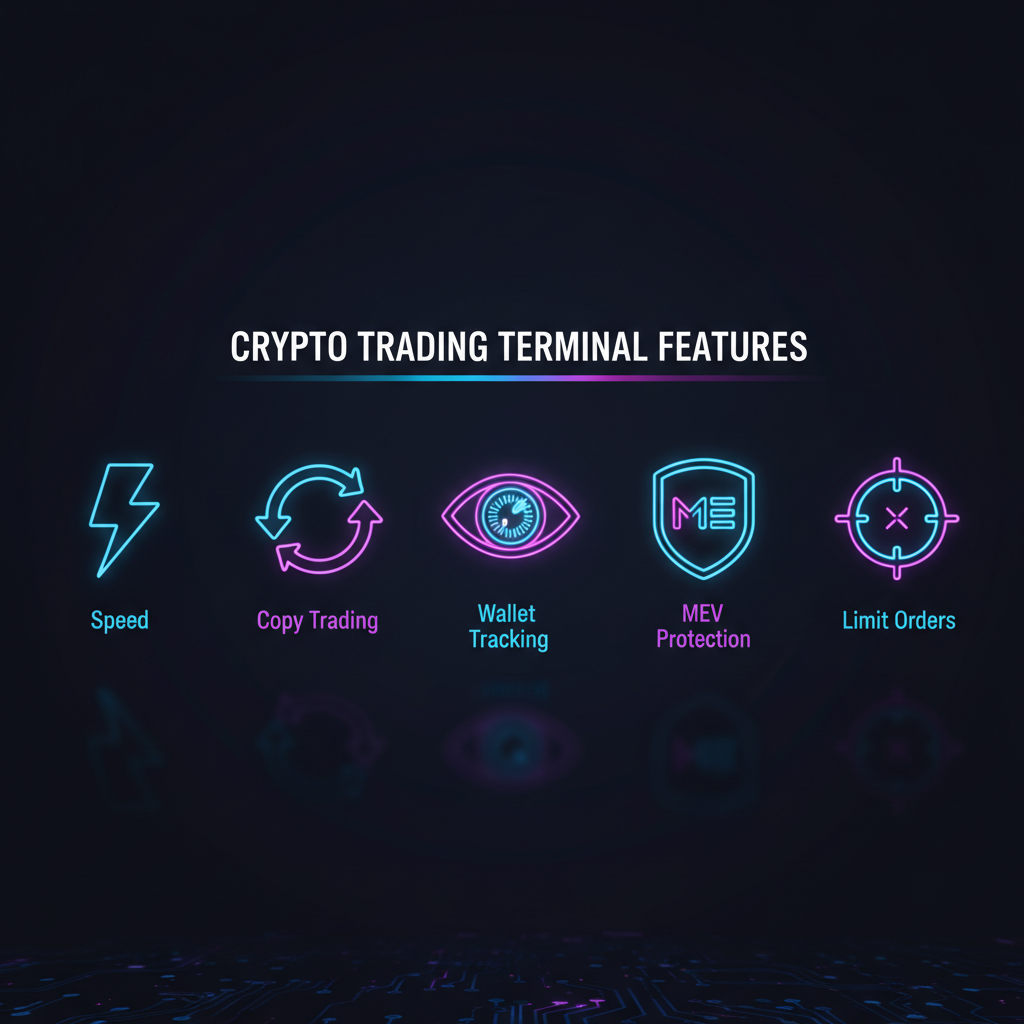
    Axiom Pro key features: Speed, Copy Trading, Wallet Tracking, MEV Protection, Limit Orders
    Axiom Pro feature overview

    Fees and Pricing

    Axiom uses a tier-based fee structure that rewards active traders with cashback:

    Tier Base Fee Cashback Effective Fee
    Wood (New Users) 1.00% 0.05% 0.95%
    Bronze 1.00% 0.10% 0.90%
    Silver 1.00% 0.15% 0.85%
    Gold 1.00% 0.20% 0.80%
    Champion 1.00% 0.25% 0.75%

    On top of the platform fee, you’ll pay standard Solana network fees (typically fractions of a cent) plus optional priority fees and Jito tips during congested periods. Axiom also offers perpetual futures trading through its Hyperliquid integration at a flat 0.01% fee per transaction.

    If you sign up through a referral link, you get a 10% discount on trading fees. The cashback system means your effective cost drops the more you trade, which is a smart incentive model that keeps active traders locked into the platform.

    Pros and Cons

    Pros

    • Fastest execution on Solana – Orders land within a single block, 2-3 seconds faster than most competitors
    • All-in-one platform – Copy trading, wallet tracking, tweet monitor, limit orders, and DCA all in one place
    • Non-custodial – Your keys, your crypto. Turnkey’s air-gapped infrastructure keeps funds secure
    • Migration sniper – Automatically catches early liquidity events on new tokens
    • Cashback rewards – Active traders can reduce fees from 0.95% down to 0.75%
    • Y Combinator backed – Strong institutional backing and fast product development cycle
    • Built-in token safety checks – Red flag indicators for mint authority, LP burn status, and holder concentration

    Cons

    • Solana-first design – BNB Chain support exists but the platform is optimized for Solana. No native Ethereum trading yet (planned)
    • 0.95% base fee – Standard for trading terminals but adds up fast for high-frequency traders
    • Steep learning curve – The feature density can overwhelm new crypto users
    • Limited widget customization – The layout is cleaner than competitors but less modular than Banana Pro
    • No Telegram bot – Mobile sniping and cross-device position management require the browser
    • No fee redistribution to users – Unlike some competitors, Axiom doesn’t share platform revenue with token holders or stakers
    • MEV protection isn’t guaranteed – While it reduces risk, sandwich attacks can still occur in extreme conditions
    Axiom trading stats: $300M+ revenue in 263 days, 2.69M+ active wallets, 74% peak market share
    Axiom by the numbers: Record-breaking growth in 2026

    Security and Trust

    Security is one of Axiom’s stronger areas. The platform is fully non-custodial, meaning your funds stay in your wallet at all times. Private keys are managed through Turnkey’s scalable key infrastructure, which uses an air-gapped design with encryption-based protections.

    Axiom’s wallet system reveals your recovery phrase only once during setup, and the platform encourages users to back it up immediately. For additional security, you can connect hardware wallets like Ledger through Phantom or Solflare integrations.

    The platform includes built-in token safety features that display red flags directly on each pair page, including mint authority status (can the dev mint unlimited tokens?), LP burn status (is the liquidity locked?), and top-10 holder concentration (is the token held by a few whales?). These checks aren’t foolproof, but they give traders a quick risk snapshot without needing external tools.

    On the institutional side, Axiom is backed by Y Combinator and operates as a registered business. The team ships updates frequently, and the platform maintains 99.9% uptime according to their published stats. There haven’t been any major security incidents or exploits reported to date.

    User Experience

    Axiom’s interface is clean and fast-loading, which makes sense given that the engineering team clearly prioritizes frontend performance. The layout puts charts, order controls, and token data all on the same screen, so you rarely need to switch tabs or navigate away from your trading view.

    New pair discovery is built right into the main interface. Instead of bouncing between Telegram groups, Twitter, and DexScreener to find new tokens, you can spot trending pairs and new launches directly in Axiom. This saves time and keeps your workflow consolidated.

    The platform supports both English and Chinese interfaces, and works well on desktop browsers. The lack of a dedicated mobile app or Telegram bot is a real trade-off, though. If you trade heavily on your phone or want alerts that don’t require opening a browser, you’ll need to supplement Axiom with other tools.

    Compared to the top-ranked Banana Pro (which scored 9.3/10 in a recent SecureBlitz ranking), Axiom (8.1/10) trades some widget customization and modularity for a faster, more streamlined experience. If you value execution speed and an integrated feature set over a fully customizable dashboard, Axiom is the better choice.

    How Axiom Compares to Alternatives

    Feature Axiom Photon BullX
    Base Fee 0.95% 1.00% 1.00%
    Copy Trading Yes No Yes
    Wallet Tracking Yes No Yes
    MEV Protection Yes Yes (Jito) Yes
    Chains Solana, BNB Solana, ETH, Base, BNB Multi-chain
    Telegram Bot No No Yes
    Perps Trading Yes (Hyperliquid) No No
    Cashback/Rewards Up to 0.25% No Revenue sharing

    For a more detailed comparison of analytics tools in the Solana ecosystem, check out our Birdeye vs DexScreener comparison. And if you’re looking for wallet options, see our Phantom vs Backpack wallet review.

    Verdict: Is Axiom Worth It?

    Axiom earns its reputation as the leading Solana trading terminal in 2026. The combination of sub-second execution, built-in copy trading, wallet tracking, and MEV protection puts it ahead of most competitors on features alone. The Y Combinator backing and $300M+ revenue milestone signal a platform that’s here to stay, not a fly-by-night bot that could disappear overnight.

    Best for: Active Solana traders, memecoin hunters, and anyone who wants an all-in-one trading terminal with the fastest execution available.

    Not ideal for: Multi-chain traders who need native Ethereum support, mobile-first users who want Telegram-based trading, or total crypto beginners who might find the interface overwhelming.

    Our rating: 8.5/10

    If you’re trading on Solana regularly, Axiom should be at the top of your shortlist. The speed advantage alone justifies trying it, and the integrated toolset means fewer tabs and fewer subscriptions. Just keep an eye on those fees if you’re trading high volume, and remember that no MEV protection is bulletproof.

    Try Axiom Pro

    FAQ

    Is Axiom safe to use?

    Axiom is a non-custodial platform, meaning your funds stay in your wallet and the platform never holds your private keys. Keys are managed through Turnkey’s air-gapped infrastructure. However, as with any on-chain trading tool, you should always start with small amounts and verify token safety before trading.

    What are Axiom’s fees?

    Axiom charges a base fee of approximately 1% per trade, with cashback reducing the effective rate. New users pay 0.95% net, while Champion-tier traders pay as low as 0.75%. Standard Solana network fees and optional priority fees also apply.

    Does Axiom support Ethereum?

    Not natively yet. Axiom currently supports Solana and BNB Chain for spot trading, with perpetual futures available through Hyperliquid. Ethereum support is on their roadmap but hasn’t launched as of April 2026.

    How does Axiom compare to Photon?

    Axiom offers more features (copy trading, wallet tracking, perps, tweet monitor) and faster execution than Photon. However, Photon supports more chains (including Ethereum and Base) and has a simpler, lighter interface. Axiom’s effective fee can also be lower thanks to its cashback system.

    Can I use Axiom on mobile?

    Axiom works in mobile browsers but doesn’t have a dedicated mobile app or Telegram bot. For the best experience, use it on a desktop browser. If mobile trading is a priority, consider BullX or Trojan as alternatives that offer Telegram-based execution.

    GRIFFAIN Price Prediction 2026: Can It Recover?

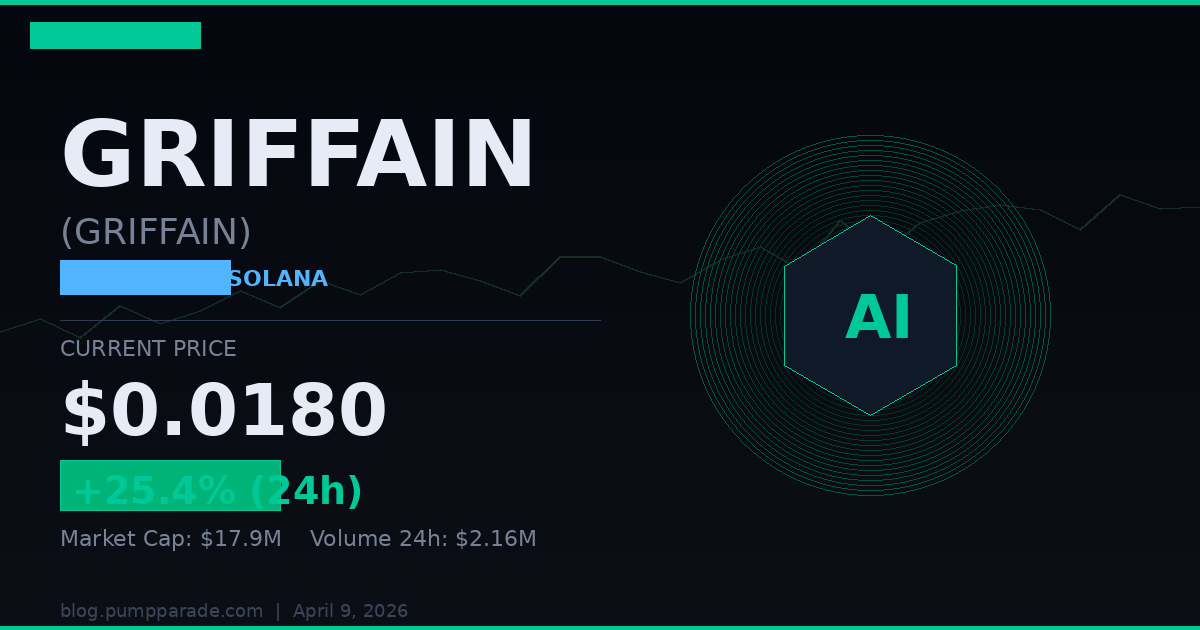
    GRIFFAIN is up 25.4% in the last 24 hours. Unique wallet activity has jumped 425% in the same window. The AI agent token on Solana is suddenly one of the most active tokens on the network, sitting at $0.0180 as of April 9, 2026.

    That is not a small move. With a market cap of just $17.9 million and daily trading volume of $2.16 million, GRIFFAIN is a small-cap token with significant volatility. The question is whether this momentum signals a real recovery or just another short-lived pump. Our AI model digs into the data to find out.

    GRIFFAIN price prediction 2026 hero image showing current price $0.0180 and 24h change of +25.4%

    What Is GRIFFAIN?

    GRIFFAIN is a Solana-based AI agent platform. The protocol lets users coordinate autonomous AI agents that execute on-chain actions through natural language commands. Think of it as an AI assistant that can trade, mint NFTs, and interact with DeFi protocols on Solana, all without requiring users to manually sign every transaction.

    The platform launched in late 2024 and quickly gained attention in the AI agent narrative that swept crypto markets in early 2025. At its peak on January 22, 2025, GRIFFAIN traded at $0.6232. Today it sits at $0.0180, which puts it roughly 97% below that all-time high.

    Key metrics at time of writing:

    • Price: $0.0180
    • 24h Change: +25.4%
    • Market Cap: $17.9 million
    • Fully Diluted Value (FDV): $17.9 million (supply is fully circulating)
    • 24h Volume: $2.16 million
    • Total Supply: ~1 billion GRIFFAIN
    • Unique Wallets (24h): 462, up 425% vs. prior period
    • Holders: 52,141

    Data sourced from Birdeye live market data.

    Why Is GRIFFAIN Moving Today?

    Three factors appear to be driving today’s spike.

    First, the broader AI token sector is having a strong April. AI token market capitalization climbed 30% over the past four weeks, according to market aggregators. Tokens like TAO (Bittensor) and RENDER have posted double-digit gains. GRIFFAIN is catching that wave as a Solana-native AI agent play.

    Second, Solana’s on-chain activity is showing renewed strength. The unique wallet surge, from 88 wallets in the prior 24-hour period to 462 today, suggests genuine new interest rather than wash trading by a handful of accounts.

    Third, GRIFFAIN sits at a psychologically interesting level. Its current market cap of $17.9 million is a small fraction of what it was at its peak. Low-cap AI tokens recovering from deep drawdowns tend to attract speculative interest when they show any sign of life. GRIFFAIN is showing signs of life.

    Technical Analysis

    GRIFFAIN’s recent price action tells an interesting short-term story. Here is how the timeframes stack up:

    • 1 hour: +4.6% (accelerating)
    • 2 hours: +6.0%
    • 4 hours: +15.8% (strong momentum)
    • 8 hours: +11.9%
    • 24 hours: +25.4%

    The 4-hour move of +15.8% is notable. It suggests the bulk of today’s buying happened in a concentrated window. That kind of spike in a low-cap token can mean smart money accumulation or it can mean a short-lived pump. Liquidity of $1.72 million on-chain provides moderate depth, not enough to absorb heavy selling without price impact.

    Key levels to watch:

    • Support: $0.0140 to $0.0150 (prior consolidation zone)
    • Resistance: $0.0220 to $0.0250 (previous local high range)
    • Major resistance: $0.050 (psychological level, significant supply overhead)

    The token is currently above its recent consolidation range, which is technically constructive. However, the Relative Strength Index (RSI) is likely in overbought territory on the 1-hour chart after a 25% day. A pullback to the $0.0140 to $0.0155 range before the next leg higher would not be unusual.

    If you want to understand how to navigate Solana’s high-volatility token ecosystem more broadly, check out our guide on finding Solana moonshots before they explode. The same principles apply to small-cap AI tokens.

    The Bull Case for GRIFFAIN

    Here is what could push GRIFFAIN significantly higher from current levels.

    AI agent narrative returns: The AI agent theme in crypto was one of the defining narratives of early 2025. If that narrative re-accelerates in Q2 and Q3 2026, Solana-native AI agent tokens are likely to be early beneficiaries. GRIFFAIN has brand recognition in that category.

    Recovery from extreme drawdown: Being down 97% from ATH means even a modest recovery to 10-15% of ATH translates to 3-5x gains from current levels. The risk-reward is asymmetric if the project delivers on its roadmap.

    Solana ecosystem tailwinds: Solana’s fee revenue and transaction count have remained strong. An active Solana ecosystem creates more demand for tools that simplify on-chain interactions, which is exactly GRIFFAIN’s value proposition.

    Low market cap entry point: At $17.9 million market cap, GRIFFAIN is a small-cap project. Similar AI agent platforms on Solana have traded at $200 million to $500 million during peak cycles. If GRIFFAIN recaptures even a fraction of that range, upside is substantial.

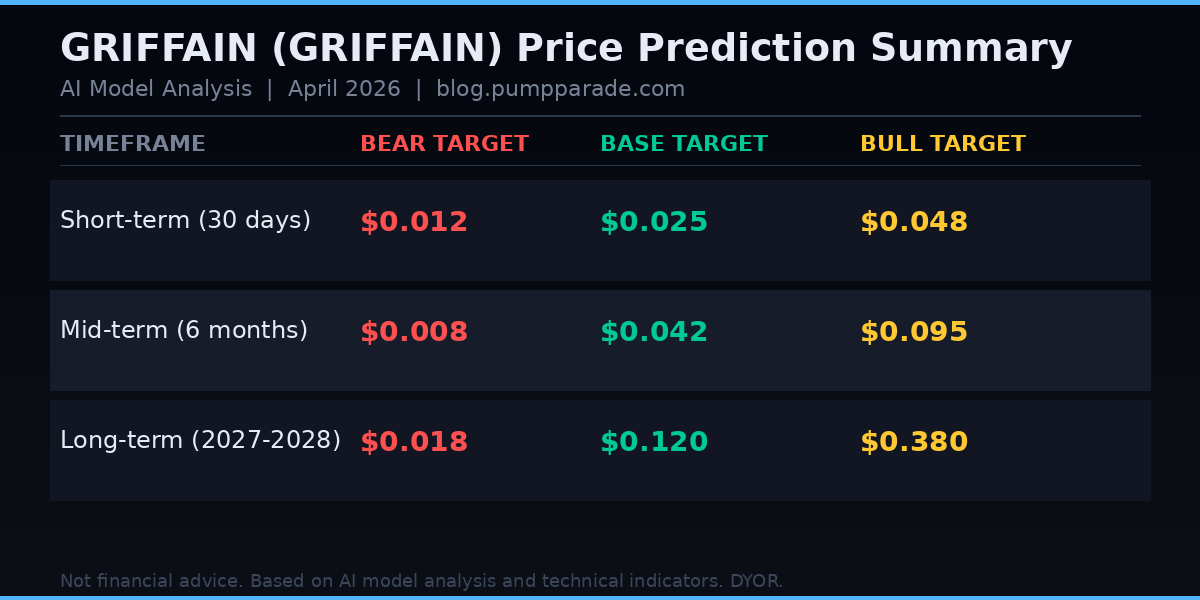
    Bull target range: $0.048 (30 days), $0.095 (6 months), $0.380 (2027-2028 bull scenario)

    The Bear Case for GRIFFAIN

    The risks here are real and worth understanding clearly before making any decision.

    Near-total destruction from ATH: GRIFFAIN lost 97% of its value from its January 2025 peak. That level of drawdown suggests either a loss of community confidence, weak fundamentals, or both. Projects that fall this far often struggle to rebuild.

    Small cap, high risk: A $17.9 million market cap means relatively small amounts of selling can move the price sharply lower. The same liquidity that creates upside volatility creates downside risk.

    Competition in the AI agent space: The AI agent sector on Solana and across other chains is highly competitive. New protocols with better funding and more active development could outcompete GRIFFAIN for mindshare and users.

    Unclear development activity: The token description in the Birdeye data still reads as a “test” token, which raises questions about the current state of the project’s development and team focus.

    Bear target range: $0.012 (30 days), $0.008 (6 months), $0.018 (2027-2028 bear scenario, essentially flat from current)

    GRIFFAIN Price Predictions by Timeframe

    Our hybrid AI model combines technical indicators, on-chain data, and market sentiment signals to produce the following price targets. These are probability-weighted scenarios, not guarantees.

    GRIFFAIN price prediction table showing bear, base, and bull targets for 30 days, 6 months, and 2027-2028

    Short-Term: 30 Days

    The near-term outlook is mixed. Today’s momentum is real, but a token up 25% in one day often consolidates before continuing. Our base case sees GRIFFAIN finding a new short-term range around $0.025, roughly 39% above current price, as it digests today’s move and tests resistance. The bear scenario has GRIFFAIN giving back some gains and retesting $0.012 support. The bull scenario, which requires sustained buying pressure and positive sector sentiment, sees $0.048 as a reachable target within 30 days.

    Mid-Term: 6 Months

    Over a 6-month window, the range widens considerably. In the base case, GRIFFAIN reaches $0.042 as the AI agent narrative builds momentum heading into late 2026. In the bull case, a broader AI token rally and growing platform adoption push it to $0.095. The bear scenario assumes the pump fades, the market loses interest, and GRIFFAIN drifts back toward $0.008, where early buyers from the post-ATH correction would feel the pain again.

    Long-Term: 2027-2028

    The long-term case for GRIFFAIN depends entirely on whether the project builds sustainable utility and user adoption. In the base case, a functioning AI agent platform on Solana with real transaction volume supports a price around $0.120. In the bull case, a full AI agent supercycle combined with platform dominance on Solana could push GRIFFAIN toward $0.380, which would still be about 39% below its January 2025 all-time high. The bear case is essentially stagnation: the project survives but does not thrive, and the price stays near current levels.

    What to Watch

    If you are monitoring GRIFFAIN, here are the key signals that matter:

    • Daily active users on griffain.com: Real AI agent usage means real demand for the token. User growth is the most important fundamental signal.
    • On-chain transaction volume: Watch the number of unique wallets interacting with the GRIFFAIN protocol weekly. Sustained growth here is more meaningful than price action alone.
    • Solana ecosystem health: GRIFFAIN is tied to Solana’s fortunes. Watch SOL price and Solana network activity as a leading indicator.
    • AI agent sector sentiment: Monitor TAO, RENDER, and other AI tokens. When the sector moves, GRIFFAIN tends to move with it, often with amplified volatility due to its small cap.
    • Price levels: $0.0140 is near-term support to watch. A breakdown below that level would be a bearish signal. A clean breakout above $0.025 with volume would be constructive.

    Disclaimer: This article is for informational and educational purposes only and should not be construed as financial, investment, or trading advice. Cryptocurrency markets are highly volatile, and past performance does not guarantee future results. The price predictions and analyses presented here are based on AI models, technical indicators, and available data at the time of writing. They are not guarantees. Always conduct your own research (DYOR) and consult with a qualified financial advisor before making any investment decisions. Pump Parade and its authors do not assume liability for financial losses incurred based on information provided in this article.

    About our AI predictions: Pump Parade’s price predictions are generated by machine learning models that analyze technical indicators, on-chain data, and market sentiment. These models have limitations and cannot account for black swan events, regulatory changes, or sudden market shifts. Use AI predictions as one input among many in your research.

    Fartcoin (FARTCOIN) Price Prediction 2026

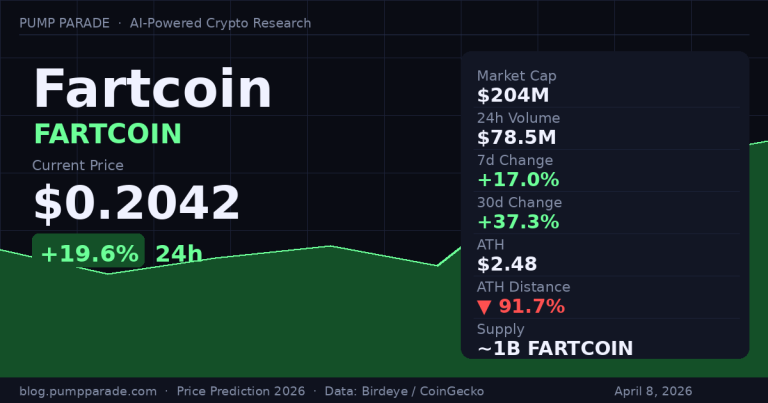
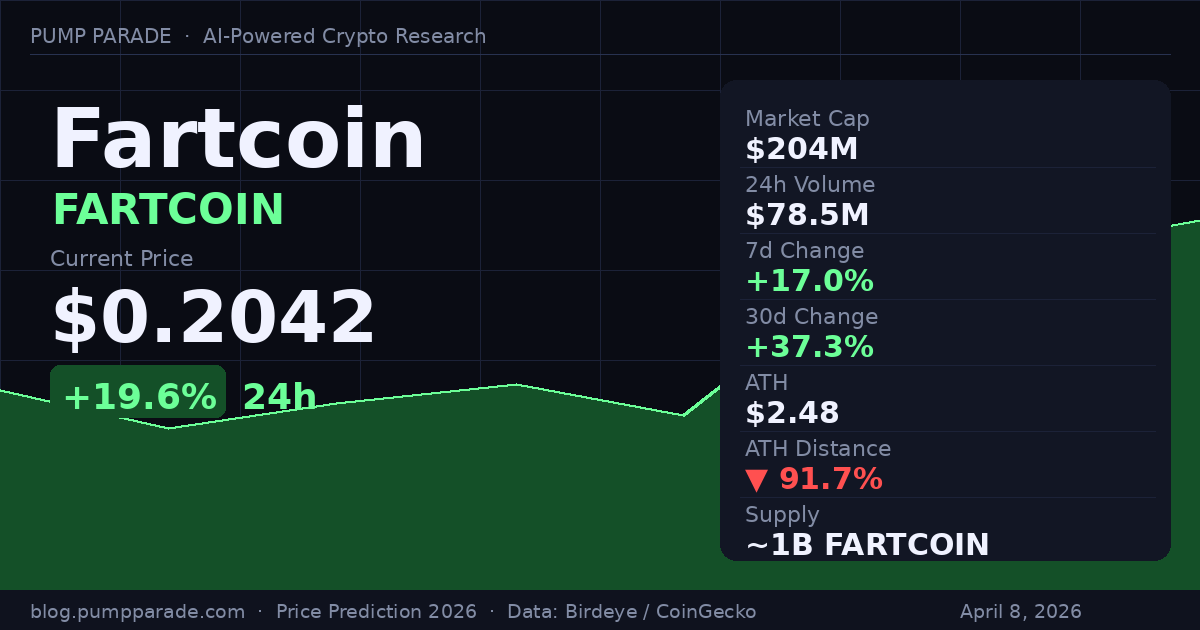
    Fartcoin (FARTCOIN) price prediction 2026 hero image showing current price $0.2042 and market stats

    Fartcoin (FARTCOIN) is up 19.6% in the last 24 hours. It is trading at $0.2042 as of April 8, 2026. Market cap sits at $204 million. Volume over the past 24 hours hit $78.5 million. That is a lot of activity for a coin named after flatulence.

    But here is the thing: Fartcoin is not a random joke coin. It was created by an AI agent called Terminal of Truth, built by researcher Andy Ayrey. The coin peaked at $2.48 in January 2025. It is now 91.7% below that high. A lot of people are watching to see if this bounce has legs.

    This article breaks down what the data says. We will cover Fartcoin’s current setup, the bull and bear cases, and our AI model’s price targets across three timeframes. No hype. Just the numbers.

    What Is Fartcoin?

    Fartcoin is a Solana-based memecoin. It launched in late 2024 and rose to prominence because of its unusual origin. An AI chatbot called Terminal of Truth, which runs on a large language model, began promoting the coin online. The AI itself became one of the top holders of the token.

    The concept is simple. Fartcoin has a circulating supply of roughly one billion tokens. There is no complex utility. It is a pure culture play. That said, the market has given it real attention. At its peak, Fartcoin had a $2.5 billion market cap. That is not nothing.

    Today it sits at $204 million. That is still a top-200 crypto asset by market cap, according to CoinGecko. For context, many projects with working products and active teams trade at lower valuations.

    Current Market Context

    Fartcoin has been quietly consolidating for weeks. The price ranged between $0.155 and $0.179 for most of early April. Then, on April 7, it broke higher. It closed at $0.197 after starting the day at $0.167. That is a 17.9% single-day move on above-average volume.

    Today the move is continuing. Price is holding above $0.20 as of this writing. That is a key psychological level. The last time Fartcoin held above $0.20 for more than a day was in February 2026.

    Volume is strong. The 24-hour figure of $78.5 million is well above the 7-day average. That matters. High-volume breakouts tend to sustain. Low-volume moves tend to fade. This one looks real, at least so far.

    Fartcoin also just entered the LunarCrush AltRank Top 10. That measures social activity relative to price. In plain terms: people are talking about it faster than the price is moving. That kind of setup often precedes further price action, though it is not a guarantee.

    Technical Analysis

    Let us look at the chart. The key support levels to watch are $0.165 and $0.130. The $0.165 level held during the recent consolidation period. It has been tested three times in the past two weeks. A break below it would be a concern.

    On the upside, the first major resistance is around $0.22 to $0.25. That range marks the area where several previous rallies stalled. A clean daily close above $0.25 would open the path toward $0.40 to $0.50.

    The momentum indicators are encouraging. The recent price action shows a higher-low structure forming over the past 30 days. The 30-day change is now +37.3%. The 7-day change is +17.0%. Both short and medium-term momentum are pointing up.

    If you are looking for a reason to be cautious, look at the RSI. Based on the recent price movement, RSI is likely approaching 70 on the daily chart. That is near overbought territory. Short-term pullbacks from here would be normal and healthy.

    Our AI model is tracking this setup and assigns a 58% probability of a continued move higher over the next 30 days. That is a moderate-confidence signal, not a strong one. The market structure is improving, but Fartcoin remains a high-risk memecoin. Position sizing matters.

    If you want a broader framework for evaluating Solana memecoins before putting capital in, our guide on how to find Solana memecoin moonshots covers the signals worth tracking.

    The Bull Case

    The bull case for Fartcoin in 2026 rests on three things: memecoin narrative cycles, Solana ecosystem momentum, and the unique AI origin story.

    First, memecoin seasons tend to come in waves. The market has seen Dogecoin, Shiba Inu, BONK, and others run in distinct cycles. Fartcoin had its first cycle in late 2024 to early 2025. A second wave is not guaranteed, but it is a pattern worth noting. Many traders made 5x to 20x riding the second leg of established memecoins.

    Second, Solana is healthy. Network activity is high. Developer interest is strong. More Solana users means more potential buyers for Solana-native tokens. Fartcoin benefits from this rising tide.

    Third, the AI origin angle is genuinely unusual. Terminal of Truth is a real AI agent with a real following. The story has been covered by TechCrunch and other major outlets. That kind of cultural footprint gives Fartcoin staying power that most memecoins lack.

    In a bull scenario, Fartcoin could recover 40% to 50% of its ATH drawdown. That puts a bull target near $1.10 for mid-2026, and up to $2.00 in a full cycle recovery by 2027 to 2028.

    The Bear Case

    The bear case is straightforward. Memecoins are zero-utility assets. Their value is entirely driven by attention. Attention is fickle. Most memecoins from 2024 to 2025 are now down 90% or more from their highs, and they have stayed there.

    Fartcoin faces real competition. New memecoins launch every day on Solana. Each one competes for the same speculative capital. The Fartcoin narrative is not new anymore. The AI angle was fresh in 2024. In 2026, it is a known story.

    There is also the supply structure. With one billion tokens in circulation, even modest selling pressure at higher prices can create significant downside. There are no lockups, no vesting schedules, and no team incentives to support the price long-term.

    A bear scenario sees Fartcoin fail to hold above $0.20. A drop back to $0.13 is plausible. A retest of the $0.10 area cannot be ruled out if the broader crypto market weakens. In an extreme bear case, memecoins can revisit near their all-time lows.

    AI Price Prediction Summary

    Our hybrid AI model analyzes on-chain data, technical indicators, and social sentiment signals. Here is what it outputs for Fartcoin across three timeframes:

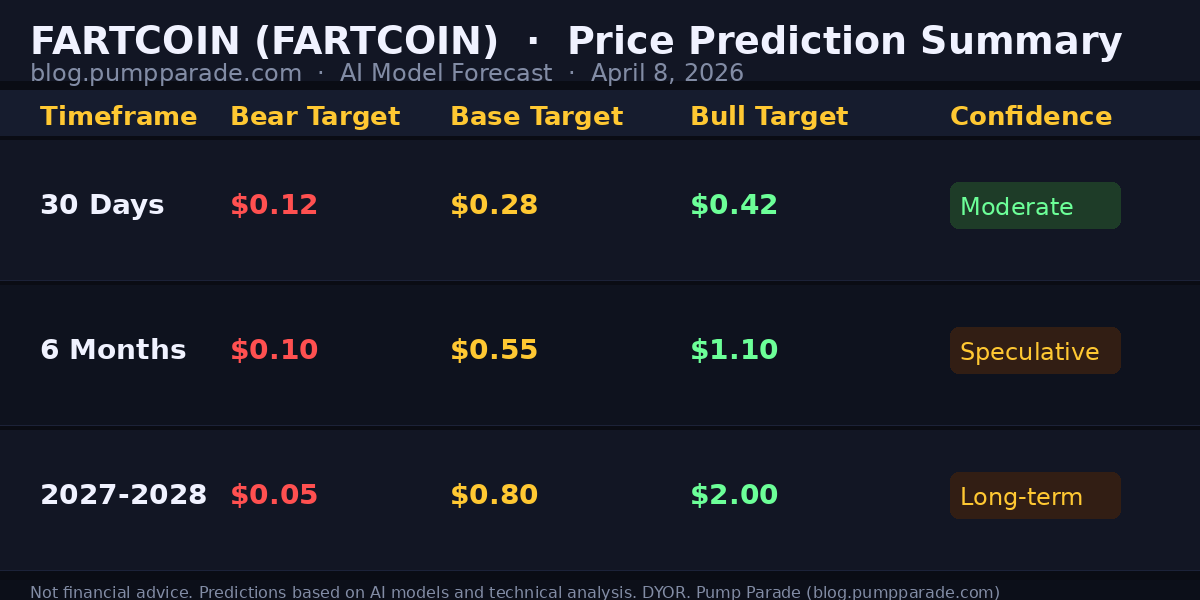
    Fartcoin FARTCOIN price prediction summary table 2026 showing bear base and bull targets for 30 days 6 months and 2027-2028

    30-Day Outlook

    Bear target: $0.12. Base target: $0.28. Bull target: $0.42. Confidence: Moderate. The near-term setup favors continued momentum if volume stays elevated. A pullback to $0.17 would be a reset, not a trend reversal.

    6-Month Outlook

    Bear target: $0.10. Base target: $0.55. Bull target: $1.10. Confidence: Speculative. Six-month predictions for memecoins carry wide error bars. A positive crypto market environment is the key variable. If BTC and Solana run, Fartcoin could outperform significantly.

    Long-Term Outlook (2027-2028)

    Bear target: $0.05. Base target: $0.80. Bull target: $2.00. Confidence: Long-term. Over a 2-year horizon, the outcome depends almost entirely on whether Fartcoin can maintain cultural relevance. That is a hard thing to predict for any memecoin.

    What to Watch

    Here are the key signals to monitor over the next 30 to 90 days:

    • $0.25 resistance: A daily close above this level would be a meaningful breakout signal.
    • $0.165 support: If price breaks below this level on high volume, the near-term bull thesis weakens.
    • Social activity: Track Fartcoin on LunarCrush and CryptoTwitter. Sustained social momentum at rising prices is a positive sign.
    • Solana ecosystem health: Monitor SOL price and Solana DEX volumes. A Solana rally typically lifts all Solana memecoins.
    • Bitcoin direction: BTC remains the macro driver for all of crypto. A BTC pullback below key support levels would likely drag Fartcoin lower.

    Final Take

    Fartcoin is a high-risk, high-volatility memecoin. It is currently showing strong technical momentum with a 19.6% move today and volume confirming the breakout. The AI origin story gives it a cultural edge most competitors lack.

    The data supports cautious optimism in the short term. The longer-term picture is genuinely uncertain. Memecoins live or die by community attention. Right now, the attention is here. Whether it lasts is the question nobody can answer with certainty.

    Watch the $0.25 level. Watch the volume. And keep position sizes in check. This one can move fast in both directions.


    Disclaimer: This article is for informational and educational purposes only and should not be construed as financial, investment, or trading advice. Cryptocurrency markets are highly volatile, and past performance does not guarantee future results. The price predictions and analyses presented here are based on AI models, technical indicators, and available data at the time of writing. They are not guarantees. Always conduct your own research (DYOR) and consult with a qualified financial advisor before making any investment decisions. Pump Parade and its authors do not assume liability for financial losses incurred based on information provided in this article.

    About our AI predictions: Pump Parade’s price predictions are generated by machine learning models that analyze technical indicators, on-chain data, and market sentiment. These models have limitations and cannot account for black swan events, regulatory changes, or sudden market shifts. Prediction confidence scores reflect the model’s internal assessment, not guaranteed accuracy. Use AI predictions as one input among many in your research.
    Birdeye vs DexScreener: Best Crypto Analytics 2026

    0

    Choosing the right crypto analytics platform can make or break your trading edge. Two names dominate the space in 2026: Birdeye and DexScreener. Both offer real-time on-chain data, token discovery, and charting tools, but they take fundamentally different approaches to solving the same problem.

    If you’ve ever wondered which platform deserves a permanent tab in your browser, this head-to-head comparison will help you decide. We’ll break down features, supported chains, pricing, user experience, and more to determine which one comes out on top for different types of traders.

    Quick Verdict: Birdeye vs DexScreener

    Choose Birdeye if you’re a Solana-focused trader who wants deep wallet intelligence, smart money tracking, and advanced token screening with configurable alerts.

    Choose DexScreener if you trade across multiple chains, want a completely free core experience, and prioritize speed and simplicity for discovering new tokens.

    Both are excellent tools, but they serve different trading styles. Let’s dig into why.

    What Is Birdeye?

    Birdeye launched as a Solana-native data aggregation platform and has grown into one of the most comprehensive crypto analytics tools available. With over 2 million users globally, it aggregates data from 400+ decentralized exchanges across 10+ blockchain networks including Solana, Ethereum, Base, BNB Chain, Arbitrum, and Sui.

    What sets Birdeye apart is its data-first approach. Rather than just showing you charts and prices, it gives you deep insights into wallet behavior, holder distribution, liquidity depth, and trade flow. The platform’s “Smart Money” feature tracks profitable wallets across launches, helping you spot early moves before they show up on price charts.

    Birdeye also offers an enterprise-grade API through Birdeye Data Services (BDS), making it a go-to for developers and institutions who need reliable on-chain data feeds.

    Birdeye crypto analytics platform homepage
    Birdeye aggregates data from 400+ DEXs with a focus on Solana ecosystem analytics.

    What Is DexScreener?

    DexScreener is a real-time charting and token discovery platform that covers 100+ blockchain networks and thousands of DEXs. It has positioned itself as the default starting point for traders who want to quickly scan market activity across the entire crypto landscape.

    The platform’s strength is its speed and breadth. DexScreener monitors millions of active trading pairs and provides real-time price data, volume metrics, transaction counts, and liquidity information. Its “Trending” and “New Pairs” sections have become essential tools for early-stage token discovery, especially in the memecoin and low-cap space.

    DexScreener also operates Moonshot, a verified fair launch platform for new tokens, and has expanded into token profiles and advertising services that generate revenue while keeping the core product free for users.

    DexScreener crypto analytics platform logo
    DexScreener covers 100+ blockchain networks with real-time charting and token discovery.

    Features Deep Dive

    Token Discovery and Screening

    Both platforms let you find new tokens, but they approach discovery differently.

    Birdeye gives you granular control with filters for market cap, trading volume, holder distribution, liquidity depth, contract age, and LP size. You can combine multiple signals (like “volume spike plus liquidity drop”) to create custom screens. The Smart Money section identifies wallets with consistent track records and shows you what they’re buying in real time.

    DexScreener takes a faster, more visual approach. The Trending section ranks tokens by various timeframes (5 minutes to 24 hours), while New Pairs surfaces freshly created trading pools. You can filter by chain, boosted status, and profile verification. It’s less granular than Birdeye but significantly faster for spotting what’s moving right now.

    Winner: Birdeye for advanced screening, DexScreener for speed-based discovery.

    Charting and Technical Analysis

    Both platforms integrate TradingView charts, giving you access to standard technical indicators, drawing tools, and timeframe options.

    Birdeye pairs its charts with contextual data like holder changes, liquidity events, and large trade markers directly on the chart view. DexScreener’s Multicharts feature lets you view multiple pairs simultaneously, which is useful for monitoring correlated assets or tracking the same token across different DEXs.

    Winner: Tie. Both deliver solid charting with TradingView integration.

    Wallet and Smart Money Tracking

    This is where the two platforms diverge most significantly.

    Birdeye offers a full wallet intelligence suite. You can track any wallet address across multiple chains, view consolidated P&L statements, transaction history, and portfolio breakdowns. The Smart Money feature algorithmically identifies consistently profitable wallets and surfaces their recent activity, giving you a legitimate edge for following informed capital.

    DexScreener offers basic watchlist functionality but lacks the deep wallet analytics that Birdeye provides. You can track tokens on a watchlist and set price alerts, but you won’t find wallet-level intelligence or smart money feeds.

    Winner: Birdeye, decisively.

    Multi-Chain Support

    DexScreener supports 100+ blockchain networks, making it the clear leader in chain coverage. Whether you’re trading on Solana, Ethereum, Base, BSC, Polygon, Avalanche, Sui, Aptos, TON, or dozens of smaller chains, DexScreener has you covered.

    Birdeye supports 10+ chains with deep coverage on Solana and expanding EVM support. While it covers the major networks, its depth of data is strongest on Solana, where it aggregates from 400+ DEXs.

    Winner: DexScreener for breadth, Birdeye for depth on supported chains.

    Birdeye vs DexScreener feature comparison table showing supported chains, pricing, token discovery, wallet tracking, and more
    Side-by-side feature comparison of Birdeye and DexScreener in 2026.

    Fees and Pricing

    This is one of the biggest differentiators between the two platforms.

    DexScreener keeps its core features entirely free. Charts, token data, trending lists, new pairs, and basic API access cost nothing. The platform generates revenue through token profile listings and advertising placements. For power users, there’s a paid tier that unlocks higher API rate limits and additional data access.

    Birdeye also offers a free tier with access to basic token data, charts, and the dashboard. However, advanced features like full API access, higher-resolution data, and premium analytics are behind paid tiers. API pricing is based on compute units, which vary by the complexity of each call. Enterprise customers can negotiate custom pricing.

    Winner: DexScreener for free access. Birdeye’s paid tiers are worth it if you need the advanced analytics, but there’s a higher cost of entry for power features.

    Pros and Cons

    Birdeye

    Pros:

    • Best-in-class wallet intelligence and smart money tracking
    • Advanced token screening with combinable filters and alerts
    • Deep Solana ecosystem coverage (400+ DEXs aggregated)
    • Enterprise-grade API for developers and institutions
    • Multi-chain portfolio tracking with consolidated P&L

    Cons:

    • Best features are behind paid tiers
    • Strongest on Solana; other chain coverage is less comprehensive
    • Steeper learning curve for new users
    • Interface can feel overwhelming with all the data available

    DexScreener

    Pros:

    • 100% free core experience with no hidden paywalls
    • Unmatched chain coverage (100+ networks)
    • Lightning-fast token discovery via Trending and New Pairs
    • Clean, intuitive interface that’s easy for beginners
    • Multicharts for monitoring multiple pairs simultaneously
    • Mobile apps with full charting capability

    Cons:

    • No wallet intelligence or smart money tracking
    • Token screening filters are less granular than Birdeye
    • Advertising and boosted tokens can create noise in rankings
    • Limited portfolio tracking compared to dedicated tools

    Security and Trust

    Both platforms are data aggregators, not custody solutions. They read on-chain data and display it; they don’t hold your funds or require wallet connections for basic use.

    Birdeye has been operating since 2021 and has built a strong reputation in the Solana ecosystem. The platform has partnerships with major Solana projects and has been featured in the Solana Foundation’s ecosystem guides. It also offers token risk signals and audit information as part of its data layer.

    DexScreener has been live since 2021 as well and is one of the most-visited crypto data sites globally. The introduction of token profiles with verification adds a trust layer for token discovery, and the platform’s Moonshot fair launch feature includes built-in security checks. However, some users have raised concerns about paid boosted placements potentially highlighting risky tokens.

    Winner: Tie. Both are reputable, established platforms. Birdeye edges slightly ahead with its risk-signal integration.

    User Experience

    DexScreener wins on simplicity. The interface is clean, loads fast, and gets you to the information you need with minimal clicks. The sidebar navigation is straightforward, and the default Trending view immediately shows you what’s moving. It’s the kind of tool you can hand to a crypto newcomer and they’ll figure it out within minutes.

    Birdeye is more feature-dense, which means a steeper learning curve. The dashboard presents a lot of information at once, including trending tokens, smart money activity, bubble maps, find-gems sections, and large trade feeds. Power users love this, but it can be overwhelming for beginners. The navigation bar includes sections for Trending, Smart Money, Perps, Tracker, and Explore, each with their own sub-views.

    Both platforms offer mobile apps for iOS and Android with full functionality, which is essential for active traders.

    Winner: DexScreener for simplicity, Birdeye for power users who want everything in one view.

    Verdict: Which Should You Use?

    The honest answer? Most serious crypto traders should have both bookmarked. They complement each other rather than directly competing.

    Use Birdeye if:

    • You’re primarily a Solana trader
    • Smart money tracking and wallet intelligence matter to your strategy
    • You want advanced token screening with custom alerts
    • You need API access for building trading tools or bots
    • You’re willing to pay for premium analytics

    Use DexScreener if:

    • You trade across many different blockchains
    • You want a free, no-friction analytics experience
    • Speed and simplicity are your priorities
    • You focus on early token discovery and trending plays
    • You’re newer to crypto trading and want an accessible starting point

    Our overall pick: For the Solana-heavy audience that reads Pump Parade, Birdeye gets the edge thanks to its smart money features and deeper Solana data. But DexScreener remains an essential tool for its unbeatable chain coverage and free access model. The best setup is using both: DexScreener for broad discovery across chains, and Birdeye for deep analysis on the tokens that make it to your watchlist.

    If you’re interested in tools that can help you act on the data these platforms surface, check out our Photon Review 2026 for a look at one of the best Solana trading bots, or our Phantom vs Backpack comparison to find the right wallet for executing those trades.

    FAQ

    Is Birdeye free to use?

    Yes, Birdeye offers a free tier with access to basic token data, charts, and the dashboard. Advanced features like full API access, wallet intelligence details, and premium analytics require paid tiers. API pricing is based on compute units that vary by call complexity.

    Is DexScreener completely free?

    DexScreener’s core features are 100% free, including charts, token data, trending lists, new pair discovery, and basic API access. The platform makes money through token profile listings and advertising. A paid subscription is available for higher API rate limits.

    Which platform has better data for Solana tokens?

    Birdeye has deeper Solana coverage, aggregating data from 400+ DEXs on the network. It also provides Solana-specific features like smart money wallet tracking and advanced holder analysis. DexScreener covers Solana well but with less depth in its analytics layer.

    Can I use both platforms together?

    Absolutely, and many active traders do exactly this. A common workflow is using DexScreener’s Trending section to spot new opportunities across chains, then switching to Birdeye for deeper analysis on specific tokens, especially for wallet intelligence and holder distribution data.

    Do either of these platforms offer trading functionality?

    Birdeye offers swap functionality through integrated DEX aggregation, allowing you to trade directly from the platform. DexScreener primarily focuses on analytics and charting, though it provides links to trade on the underlying DEXs. For dedicated trading tools, you might want to explore specialized platforms like Photon or similar trading bots.

    Zcash (ZEC) Price Prediction 2026

    0

    Zcash (ZEC) is up 21.5% in the last 24 hours, trading at $320 at time of writing. That puts it among the best-performing major assets today. Volume has spiked to over $500 million across exchanges, the highest single-day figure for ZEC in over a year.

    This isn’t a random pump. Three major developments have converged to push ZEC into the spotlight: the SEC closed its investigation into Zcash in January 2026, Grayscale filed to convert its Zcash Trust (ZCSH) into a U.S.-listed spot ETF, and the Zcash Open Development Lab raised $25M from Paradigm and a16z just weeks ago. Privacy coin narratives are back, and ZEC is leading the charge.

    So is this the start of a sustained rally, or a liquidity event that fades by Friday? Our AI model breaks down both scenarios, with specific price targets for the next 30 days, 6 months, and 2027-2028.

    What Is Zcash?

    Zcash is a privacy-focused cryptocurrency that launched in 2016 from the work of cryptographers at Johns Hopkins, MIT, and other top institutions. It uses a cryptographic technique called zk-SNARKs (zero-knowledge succinct non-interactive arguments of knowledge) to allow users to transact with full privacy, meaning neither the sender, receiver, nor transaction amount needs to be visible on-chain.

    In plain terms: Zcash lets you send money without anyone knowing who sent it, who received it, or how much. For users who prioritize financial privacy, that’s a powerful proposition.

    ZEC runs on its own proof-of-work blockchain with a maximum supply of 21 million coins, mirroring Bitcoin’s cap. About 16.5 million ZEC are currently in circulation. The project is developed by the Electric Coin Company and supported by the Zcash Foundation.

    Current Market Context

    ZEC’s 24-hour move of 21.5% to $320 puts it up roughly 54% over the past 30 days. The broader crypto market is mixed right now, with the total market cap around $2.3 trillion and Bitcoin dominance at 58.5%. This is classic “Bitcoin season” territory, when altcoin moves tend to be narrative-driven and selective.

    ZEC fits that pattern. Privacy coins are not a broad altcoin rotation play. They are catching a specific tailwind driven by regulatory clarity and institutional demand. The Grayscale ETF filing, in particular, signals that institutional appetite for ZEC is real, not speculative.

    Key market data at time of writing (April 8, 2026):

    • Price: $320.43
    • 24h Change: +21.51%
    • 24h Volume: $565 million (cross-exchange)
    • Market Cap: ~$5.3 billion
    • Circulating Supply: ~16.5 million ZEC
    • 30-day Change: +53.8%

    For live data, you can track ZEC on CoinGecko.

    Zcash ZEC price prediction 2026 hero chart showing current price $320.43 and 24h gain of 21.51%

    Key Catalysts Driving the Rally

    SEC Clears Zcash: No Enforcement Action

    On January 15, 2026, the SEC officially closed its investigation into Zcash without recommending enforcement action. This was a significant overhang that had weighed on ZEC since 2023, when regulators began scrutinizing privacy coins more aggressively. The all-clear removes a meaningful risk from the thesis.

    Grayscale Files for Spot ZEC ETF

    Grayscale has filed with the SEC to convert its Grayscale Zcash Trust (ZCSH) into a U.S.-listed spot ETF on NYSE Arca. The trust already holds a meaningful position in ZEC. This mirrors the playbook Grayscale used successfully with Bitcoin and Ethereum. If approved, a spot ETF would open ZEC to a new class of institutional and retail investors who prefer regulated wrappers over direct crypto custody.

    Grayscale has also been actively accumulating. Reports indicate the firm added approximately $46 million in ZEC to its trust ahead of the filing, a signal of conviction rather than passive management.

    Zcash Open Development Lab Raises $25M

    In late March 2026, the Zcash Open Development Lab announced a $25 million raise from Paradigm and Andreessen Horowitz (a16z). Two of the most respected names in crypto venture putting capital into Zcash ecosystem development is a strong signal. The funds are earmarked for protocol development, privacy tooling, and ecosystem growth, including integrations with major wallets and DeFi protocols.

    Foundry Launches Institutional ZEC Mining Pool

    Foundry Digital, one of the largest Bitcoin mining operations in North America, announced it will launch an institutional ZEC mining pool in April 2026. This is its first move beyond Bitcoin mining. Institutional mining infrastructure adds a layer of legitimacy and liquidity to the ZEC ecosystem that it previously lacked.

    Technical Analysis

    ZEC’s chart is showing bullish momentum, but some caution is warranted after a 21% single-day move.

    Key levels to watch:

    • Support: $280-$300 (previous resistance, now flipped support), $234 below that
    • Resistance: $340-$360 (first major overhead zone), then $420-$450
    • 50-day moving average: Trending up, ZEC is trading well above it

    The RSI (Relative Strength Index, a momentum measure from 0-100 where above 70 is considered overbought) is likely in the 75-80 range after today’s move. That means short-term pullback risk is elevated. A consolidation or retest of the $280-$300 zone would be healthy and expected before any continuation higher.

    The broader pattern looks like a breakout from a multi-month base. ZEC spent most of late 2025 and early 2026 consolidating in the $180-$260 range. The confluence of catalysts has triggered a clean technical break. Historical breakouts from similar setups have seen 60-120% follow-through over the next 3-6 months, though past patterns are not predictive guarantees.

    Volume confirms the move. Over $500 million in 24-hour trading volume is not retail-driven noise. That is institutional and large-wallet activity.

    Bull Case for ZEC

    The bull case rests on a convergence of three factors: regulatory clarity, institutional access, and a renewed privacy narrative.

    If the Grayscale spot ETF is approved, ZEC gains access to a distribution channel that could bring hundreds of millions in new capital. The Bitcoin ETF approved in early 2024 drew $12 billion in net inflows in its first 90 days. ZEC is orders of magnitude smaller, so even a fraction of that impact would be transformative.

    The $25M raise from Paradigm and a16z also matters for developer activity. Protocol improvements, better wallet integrations, and DeFi composability could drive ZEC adoption beyond its current niche of privacy-focused traders.

    If the broader altcoin market sees a rotation in the second half of 2026, ZEC, with its cleaner regulatory profile and ETF optionality, is positioned to outperform. Our AI model’s bull case target for end-2026 sits at $700, which would represent roughly 2.2x from current levels.

    Bear Case for ZEC

    Privacy coins face a structural headwind that is easy to underestimate: regulatory pressure globally. While the SEC cleared Zcash in the U.S., the EU’s Markets in Crypto-Assets (MiCA) framework has provisions that complicate privacy coin listings in Europe. Several exchanges have already delisted Monero (XMR) in European markets. ZEC could face similar pressure.

    There is also the question of whether the Grayscale ETF filing will actually be approved. A spot ZEC ETF would require SEC comfort with a privacy-first asset. That comfort is not guaranteed, even with the investigation closure. Approval timelines could stretch well into 2027.

    On the technical side, a failure to hold $280 would be bearish. A breakdown below $234 would suggest the rally was a liquidity event rather than the start of a trend, and could trigger a retest of the $180-$200 zone where ZEC spent much of late 2025.

    Macro risk is also real. Geopolitical tensions (the Iran-Strait of Hormuz situation) have already put pressure on risk assets this week. If macro deteriorates, even strong fundamental stories get sold.

    Our bear case for end-2026: $200-$240 if catalysts fail to materialize.

    Zcash ZEC price prediction table showing bear base and bull targets for 30 days 6 months and 2027-2028

    Zcash Price Predictions: Short, Mid, and Long-Term

    Our hybrid AI model analyzes technical indicators, on-chain metrics, sentiment data, and fundamental catalysts to generate probability-weighted price ranges. These are not guarantees. They are scenario maps.

    Short-Term (30 Days): April-May 2026

    After a 21% single-day move, a short-term consolidation or pullback is the base case. The $280-$300 zone is the key support level to watch. If ZEC holds that zone and volume remains elevated, the path toward $400-$420 opens over the next 30 days.

    • Bear target: $240 (if macro deteriorates or rally fades)
    • Base target: $350-$380 (consolidation then continuation)
    • Bull target: $450-$500 (if ETF news accelerates and altcoin rotation begins)

    Mid-Term (6 Months): October 2026

    The 6-month window is where the ETF story plays out. If Grayscale makes regulatory progress, ZEC has a clear path toward $500-$650. If ETF approval stalls and macro headwinds persist, a retracement to $200-$250 is the more likely outcome.

    • Bear target: $200
    • Base target: $480
    • Bull target: $700

    Long-Term (2027-2028)

    Long-term ZEC predictions depend heavily on two things: whether privacy becomes a mainstream crypto use case, and whether ZEC maintains its technical and community edge over competitors like Monero. If the Paradigm and a16z investment delivers on developer adoption and the ETF creates sustained institutional flows, ZEC could test its previous highs and beyond.

    • Bear target: $150 (if privacy coins face regulatory delisting pressure)
    • Base target: $750-$900
    • Bull target: $1,500 (full ETF + institutional adoption cycle)

    What to Watch

    A few specific things to monitor over the coming weeks and months:

    • SEC response to Grayscale ETF filing: Any comment letter or approval timeline update from the SEC will move ZEC price significantly.
    • $300 support level: If ZEC pulls back after today’s surge, how it handles $300 will tell you whether the move has legs.
    • Foundry pool launch: The institutional mining announcement is a data point worth tracking. More institutional infrastructure typically means more OTC demand and liquidity depth.
    • Broader altcoin rotation: Bitcoin dominance at 58.5% means alts are still fighting for capital. Watch for any shift in dominance below 55% as a signal that capital is rotating.
    • Monero (XMR) delisting announcements: Any additional exchange delistings of Monero in European markets could cut both ways for ZEC, either as a contagion risk or as capital rotating from XMR to ZEC.

    If you are weighing how ZEC fits into a broader altcoin strategy, our XRP price prediction for 2026 covers another major asset with a similar “regulatory clarity unlocks upside” thesis.

    The Bottom Line

    ZEC is not a random pump. It has real catalysts: regulatory clearance, an ETF filing with institutional backing, and serious venture capital in the ecosystem. The 21% move today is loud, but the underlying thesis is quieter and more durable.

    The risk-reward here is asymmetric. If the ETF moves forward, ZEC could see multiples from current levels by the end of 2026. If it stalls, the downside is real but contained by a clearly defined support structure around $280-$300.

    For traders watching privacy coins, ZEC is worth a close look. Not as a speculation, but as a fundamentals-driven setup with a clear catalyst pipeline and defined levels on both sides of the trade.


    Disclaimer: This article is for informational and educational purposes only and should not be construed as financial, investment, or trading advice. Cryptocurrency markets are highly volatile, and past performance does not guarantee future results. The price predictions and analyses presented here are based on AI models, technical indicators, and available data at the time of writing and are not guarantees. Always conduct your own research (DYOR) and consult with a qualified financial advisor before making any investment decisions. Pump Parade and its authors do not assume liability for financial losses incurred based on information provided in this article.

    About our AI predictions: Pump Parade’s price predictions are generated by machine learning models that analyze technical indicators, on-chain data, and market sentiment. These models have limitations and cannot account for black swan events, regulatory changes, or sudden market shifts. Use AI predictions as one input among many in your research.
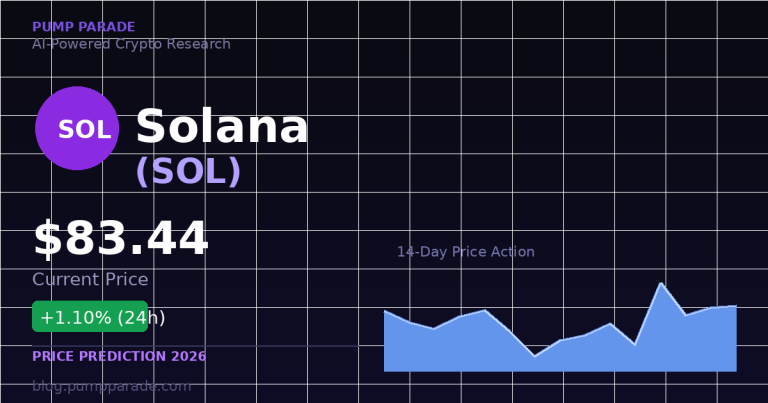
    USDC Just Passed USDT in Volume. Now Regulators Are Picking Sides.

    0

    The $317 billion stablecoin market is splitting along a fault line nobody expected — and two regulatory deadlines in July could make it permanent.

    USDC now processes more transaction volume than USDT — despite having less than half the market cap.

    That’s not a typo. Circle’s stablecoin handled $18.3 trillion in transactions in 2025, compared to Tether’s $13.3 trillion. In 2026, the gap has widened: USDC captured 64% of adjusted volume between the two in Q1, processing roughly $2.2 trillion versus USDT’s $1.3 trillion in the same period. The stablecoin that spent six years as the clear #2 is now #1 by the metric that arguably matters most — actual usage.

    And two regulatory deadlines hitting simultaneously in July 2026 could turn this volume flip into a structural shift that reshapes the entire $317 billion stablecoin market.

    What the Volume Flip Actually Means

    Market cap and transaction volume tell different stories, and both matter.

    USDT still dominates supply: $184 billion in market cap versus USDC’s $77.5 billion. That’s a 2.4x gap. Tether has more tokens in circulation, more trading pairs on more exchanges, and deeper liquidity in most markets — particularly in Asia and emerging economies where it functions as a de facto dollar substitute.

    But volume tells you who’s using stablecoins, not just who’s holding them. And the shift toward USDC in volume is driven by a specific cohort: institutions.

    Metric USDT USDC
    Market Cap (Apr 2026) ~$184B ~$77.5B
    2025 Transaction Volume $13.3T $18.3T
    Q1 2026 Adjusted Volume Share ~36% ~64%
    Stablecoin Market Share (by supply) ~58% ~24.5%
    MiCA Compliant No Yes
    GENIUS Act Positioned Unclear Yes

    The divergence between market cap dominance and volume dominance isn’t a contradiction — it’s a signal. USDT is where retail holds dollars. USDC is where institutions move them. And as regulation arrives, that distinction is about to matter a lot more.

    Why Institutions Chose USDC

    Three factors explain the institutional preference, and none of them are about technology.

    Regulatory posture. Circle is a US-based company, publicly traded on the NYSE (ticker: CRCL) since June 2025. Its reserves are audited by Deloitte, held in cash and short-term US Treasuries, and disclosed monthly. For institutional compliance teams, USDC checks every box. Tether, by contrast, operates from the British Virgin Islands, has faced persistent questions about reserve transparency, and has never completed a full independent audit — only periodic attestations.

    Infrastructure integration. Coinbase, the largest US exchange, co-founded the Centre Consortium that created USDC. Every major US-regulated exchange and custodian supports USDC natively. For institutions already using Coinbase Prime or similar platforms, USDC is the path of least resistance.

    European access. This is the emerging differentiator. USDC has obtained the Electronic Money Institution (EMI) authorization required under MiCA, the EU’s comprehensive crypto regulation. USDT has not. As of early 2025, Coinbase Europe, Binance, and other major exchanges have already delisted USDT for European Economic Area users. Circle’s compliance head start in Europe is now a concrete competitive advantage.

    The GENIUS Act: When Banks Become Stablecoin Issuers

    On February 25, 2026, the Office of the Comptroller of the Currency (OCC) published proposed rulemaking to implement the GENIUS Act — the Guiding and Establishing National Innovation for U.S. Stablecoins Act, signed into law in July 2025.

    The proposed rules would create a comprehensive federal framework for “payment stablecoin issuers,” establishing requirements for licensing, reserves, custody, capital, redemption, and reporting. Issuers must maintain high-quality liquid assets — cash or short-term Treasuries — and honor redemption at par within two business days.

    Here’s the part that changes the competitive landscape: the framework explicitly allows national banks to issue their own stablecoins.

    JPMorgan already operates JPM Coin for institutional transfers. BNY Mellon has been expanding its digital asset custody capabilities. Under the GENIUS Act framework, these institutions — and dozens of other nationally chartered banks — could launch regulated, dollar-backed stablecoins that compete directly with USDC and USDT.

    The comment period closes May 1, 2026. Final regulations are due by July 18, 2026. The Act takes full effect on January 18, 2027, or 120 days after final rules — whichever comes first.

    For Circle, this is a double-edged sword. The GENIUS Act validates the regulated stablecoin model that Circle pioneered, but it also opens the door to competitors with deeper pockets and existing banking relationships. For Tether, the framework creates a compliance standard that its current structure doesn’t meet — and the clock is ticking.

    MiCA’s July 1 Deadline: The European Squeeze

    While the US builds its framework, Europe is enforcing one.

    MiCA — the Markets in Crypto-Assets Regulation — entered force in stages starting December 2024. The final transition deadline arrives July 1, 2026, when all grandfathering periods expire. After that date, no crypto-asset service provider can operate in the EU without full MiCA authorization.

    For stablecoins specifically, MiCA requires issuers of electronic money tokens (EMTs) to hold an EMI license in an EU member state, maintain segregated reserves, submit to ongoing supervision, and meet stringent transparency requirements.

    Tether has not obtained an EMI license in any EU member state. The consequences are already visible: USDT has been delisted from EU-facing platforms including Coinbase Europe (December 2024) and Binance EEA (March 2025). After July 1, remaining holdouts lose their grace period.

    USDC, by contrast, is MiCA-compliant. Circle obtained the necessary authorizations and positioned USDC as the default compliant stablecoin for European markets. In a region where regulatory compliance isn’t optional, that’s not a feature — it’s a moat.

    The timing is striking: MiCA full enforcement on July 1. GENIUS Act final rules due July 18. Two regulatory frameworks, two deadlines, one month. The stablecoin market enters July 2026 one way and exits it another.

    The Third Contender: Ethena’s USDe

    While USDC and USDT dominate the headlines, a third model is quietly gaining traction.

    Ethena’s USDe is a synthetic stablecoin — it doesn’t hold dollar reserves at all. Instead, it maintains its peg through a delta-neutral strategy: holding crypto assets (primarily ETH and BTC) while shorting equivalent perpetual futures positions. The yield from funding rates gets passed to holders, making USDe a yield-bearing stablecoin.

    USDe surged to over $14 billion in market cap during 2025, capturing nearly 5% of the total stablecoin market at its peak. A deleveraging event in Q4 2025 brought supply down to approximately $5.9 billion by March 2026 — still the fifth-largest stablecoin globally.

    The model is innovative. It’s also untested in a true black swan. A simultaneous crash in spot crypto prices and a spike in funding rates could pressure the delta-neutral position in ways the protocol hasn’t experienced. Kraken Custody was appointed as institutional custodian for USDe’s reserves in January 2026, adding a layer of institutional credibility — but the fundamental risk profile remains different from reserve-backed stablecoins.

    Bull and Bear: Where Each Stands

    USDC

    The bull case: Regulatory tailwinds on two continents. MiCA compliance gives USDC a monopoly-like position in EU stablecoin markets. The GENIUS Act validates the regulated model Circle built. Institutional volume is accelerating — 64% of adjusted volume in Q1 2026. Circle is public, audited, and transparent.

    The bear case: Bank-issued stablecoins under the GENIUS Act could erode USDC’s institutional share. Circle’s stock has dropped roughly 70% from its June 2025 peak, raising questions about the company’s revenue model (USDC generates income from reserves, but interest rate cuts compress margins). And USDC’s dominance is concentrated in institutional and DeFi use cases — it hasn’t cracked the retail and emerging market corridors where USDT thrives.

    USDT

    The bull case: Network effects are real. $184 billion in market cap, the deepest liquidity across global exchanges, and dominant position in emerging markets where regulatory compliance is less relevant than dollar access. Tether generated over $13 billion in profit in 2024 from reserve yields. The company isn’t going anywhere.

    The bear case: The regulatory walls are closing. Delisted from EU exchanges, unclear positioning under the GENIUS Act, and persistent reserve transparency concerns that institutional compliance teams can’t overlook. Every new regulation that requires audited reserves and licensed issuers is a regulation that favors Circle’s model over Tether’s.

    USDe

    The bull case: Yield-bearing stablecoins are a genuinely new primitive. In a market where USDC and USDT earn nothing for holders, USDe passes funding rate yields through. Expanding to seven chains including Solana and Hyperliquid. Kraken Custody adds institutional credibility.

    The bear case: Untested in a real crisis. The delta-neutral strategy depends on functioning perpetual futures markets — the same markets that can seize up during extreme volatility. A 58% supply contraction from peak ($14B to $5.9B) in three months shows how quickly capital exits when confidence wavers.

    The Takeaway

    The stablecoin market isn’t just growing — it’s stratifying. USDT dominates supply and retail access. USDC dominates institutional volume and regulatory compliance. USDe is carving a niche as the yield-bearing alternative. And in July 2026, two regulatory frameworks land simultaneously, potentially hardening these divisions into permanent market structure.

    For traders, the practical question isn’t which stablecoin is “best” — it’s which one matches your use case. If you’re trading on EU-regulated platforms, USDC is increasingly your only compliant option. If you need deep liquidity on global exchanges, USDT remains unmatched. If you want your stablecoins earning yield (and accept the smart contract risk), USDe is worth researching.

    The volume flip from USDT to USDC isn’t a fluke — it’s the market pricing in a regulatory future that’s now three months away.


    Disclaimer: This article is for informational and educational purposes only and should not be construed as financial, investment, or trading advice. Cryptocurrency markets are highly volatile, and past performance does not guarantee future results. The analyses presented here are based on AI models, technical indicators, and available data at the time of writing — they are not guarantees. Always conduct your own research (DYOR) and consult with a qualified financial advisor before making any investment decisions. Pump Parade and its authors do not assume liability for financial losses incurred based on information provided in this article.


    Research Sources


    Pump Parade is an AI-powered crypto research platform. We combine real-time price predictions, technical analysis tools, and editorial content to help traders make smarter, data-backed decisions.

    Try our tools → pumpparade.com | Follow us → @PumpParade