

Ethereum is trading at $2,258 as of May 14, 2026. That is down 2.5% in the last 24 hours, but up 29% from the February low of $1,743. The chart has stopped bleeding. The question is whether it can break out before the year’s biggest catalyst arrives.
That catalyst is Glamsterdam, Ethereum’s next major network upgrade. Developers are targeting H1 2026 for mainnet activation, with some now pushing the timeline into Q3. When it ships, it could raise the gas limit from 60 million to 200 million per block. Throughput could approach 10,000 transactions per second. That is roughly 10 times what Ethereum handles today.

Whales have noticed. Wallets tracked by on-chain analytics accumulated over 140,000 ETH, worth about $322 million, in a 96-hour window earlier this month. ETF flows have also turned positive. May 1 saw $101.2 million in net inflows into U.S. spot ETH ETFs, with BlackRock’s ETHA and Fidelity’s FETH leading the day.
Here is the data, the bull case, the bear case, and where our AI model lands on ETH for the rest of 2026.
Ethereum at a Glance
Ethereum is the second-largest cryptocurrency by market cap. At time of writing it sits at roughly $272 billion, behind Bitcoin’s $1.6 trillion. Daily trading volume runs around $14.3 billion.
The protocol secures over $50 billion in DeFi total value locked. It also hosts the largest stablecoin market in crypto. More than $130 billion in USDT and USDC supply lives on Ethereum mainnet and its Layer 2 rollups.
Three numbers matter most right now for traders:
- Current price: $2,258
- 52-week range: $1,743 low to roughly $4,100 high
- Year-to-date: down approximately 30%, but recovering
Technical Setup: What the Chart Is Saying
ETH has been carving out a base between $2,000 and $2,400 for most of the past six weeks. That is a tight range after the February capitulation. Tight ranges after big drawdowns often resolve in one of two ways: a sharp breakout, or a final flush before recovery.
Key levels to watch:
- Support 1: $2,040, the April consolidation floor
- Support 2: $1,743, the February cycle low
- Resistance 1: $2,420, the level that traders flagged this week as a “strong move” trigger
- Resistance 2: $2,800, the prior breakdown zone from December
- Resistance 3: $3,400, the 200-day moving average
The Relative Strength Index, a momentum indicator that measures whether an asset is overbought or oversold, sits around 48 on the daily chart. That is neutral territory. It leaves room for ETH to run higher without flashing immediate exhaustion signals.
The 50-day moving average has flattened. The 200-day is still pointing down. A bullish reclaim of the 200-day at $3,400 would be the cleanest technical signal that the trend has flipped.
The Bull Case: Glamsterdam, Staking ETFs, and CLARITY
Three catalysts make the case for ETH upside through the rest of 2026.
1. The Glamsterdam Upgrade
Glamsterdam is the headline event. The upgrade introduces two major changes that could reshape Ethereum economics.
First, ePBS (EIP-7732). In plain terms, this separates the heavy work of validating transactions from the lighter work of reaching consensus. It expands the data propagation window from 2 seconds to about 9 seconds. That unblocks Ethereum’s ability to handle much higher transaction throughput safely.
Second, Block-Level Access Lists (EIP-7928). These let validators see in advance what data each block needs to read and write. The result is parallel transaction execution. Multiple transactions can be processed at the same time instead of one after another.
Put together, the upgrade targets a 78% reduction in gas fees and a 10x lift in throughput. If it ships on time and works as designed, it will be the biggest performance jump for Ethereum since The Merge.
2. The BlackRock Staked ETF
BlackRock launched the iShares Staked Ethereum Trust (ticker: ETHB) on Nasdaq on March 12, 2026. It was the first major U.S. staking-enabled ETH ETF.
The product stakes between 70% and 95% of its ether holdings through Coinbase Prime. Investors receive about 82% of the gross staking rewards, currently running at roughly 3.1% per year, distributed monthly. The non-staking ETHA fund still holds $6.5 billion in assets. ETHB adds a yield-bearing option that competes directly with bond products.
The regulatory door for this opened in 2025. Combined April ETF inflows hit $356 million, with BlackRock and Fidelity accounting for over 90% of the total.
3. The CLARITY Act
The U.S. Senate Banking Committee is voting on an updated version of the CLARITY Act today. The bill addresses how digital asset issuers and exchanges are regulated. A compromise has been reached on stablecoin yield: issuers cannot pay interest on holdings, but related user incentives are allowed.
For ETH, the practical impact is straightforward. A clearer regulatory framework reduces the discount that institutions apply to crypto exposure. It also helps unlock more conservative pools of capital that have stayed on the sidelines.
The Bear Case: Delays, Macro, and L2 Cannibalization
Balanced analysis means owning the downside too. Three risks deserve serious weight here.
1. Glamsterdam Could Slip Again
Ethereum upgrades have a history of pushing right. Glamsterdam was originally a June 2026 target. Developers are now openly discussing Q3. If testnet bugs surface, it could slide further. Each month of delay weakens the case for ETH outperformance because the market is already partly pricing the upgrade.
2. Macro Risk
Bitcoin is currently trading below $80,000 after producer price inflation surged to 6%. Hot inflation data has historically dragged risk assets lower. ETH tends to trade with a beta higher than 1 to Bitcoin during macro stress. If BTC retests $70,000, ETH could revisit $1,800 or lower.
3. Layer 2 Cannibalization
This is the structural concern that bears keep raising. Layer 2 rollups like Arbitrum, Base, and Optimism handle a growing share of Ethereum activity. They pay fees to mainnet, but post-Dencun blob pricing those fees are tiny. If Glamsterdam succeeds and L1 becomes cheaper, it could compete with the L2s for high-value transactions. If it slips, L2s keep growing and ETH revenue stays low.
The bull rebuttal is that more total transactions, on L1 or L2, still drive ETH demand for gas and staking. The bear rebuttal is that EIP-1559 burn rates have dropped substantially from 2024 levels. Both points are valid. Watch the burn rate and L1 fee revenue trend over the next two quarters.
Price Predictions by Timeframe
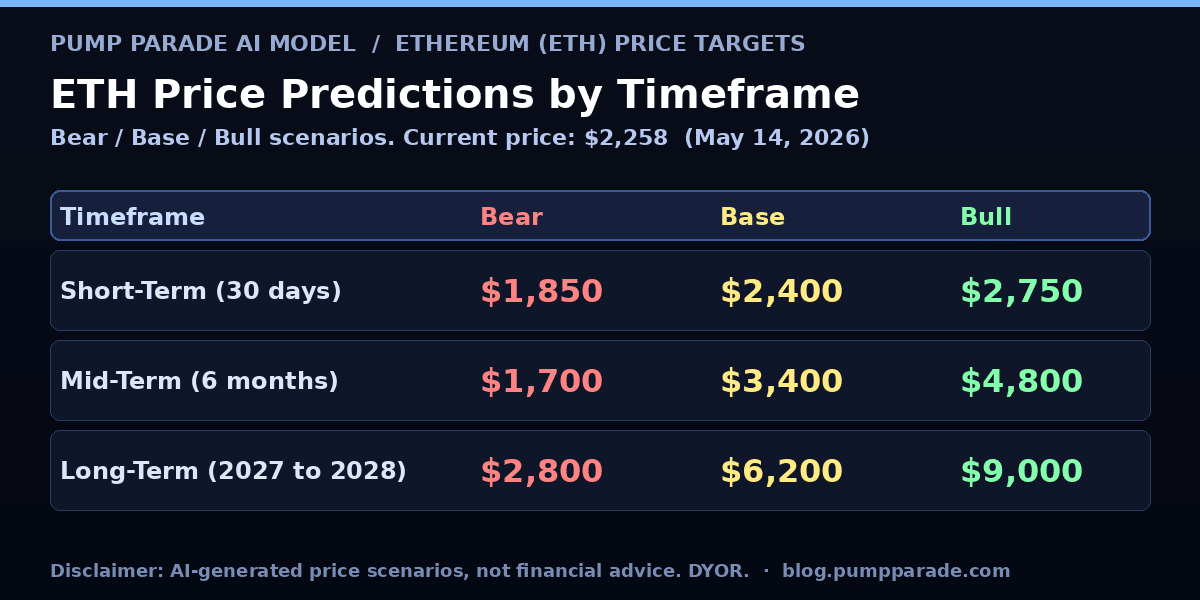
Here is how our hybrid AI model frames the next 30 days, 6 months, and 24-plus months for ETH. These are scenarios, not promises.
Short-Term (Next 30 Days)
The base case is continued consolidation between $2,100 and $2,500. A clean breakout above $2,420 on volume would open the path to $2,800. A loss of $2,040 brings $1,800 back into view.
- Bear target: $1,850
- Base target: $2,400
- Bull target: $2,750
Medium-Term (6 Months, Through Q4 2026)
This window contains the Glamsterdam activation, the next leg of ETF flows, and the post-CLARITY regulatory picture. If the upgrade ships in Q3 and macro stays neutral, the setup looks constructive. Historically, L1 narrative trades around major upgrades have run 60% to 100% from multi-month accumulation ranges.
- Bear target: $1,700 (upgrade slips, macro deteriorates)
- Base target: $3,400 (upgrade ships, ETF flows continue, BTC stable)
- Bull target: $4,800 (upgrade plus altseason rotation plus rate cuts)
Long-Term (2027 to 2028)
Standard Chartered raised its end-2026 ETH target to $7,500 in a recent note. That is the high end of mainstream Wall Street estimates. Other analyst ranges cluster between $4,500 and $7,500 for base cases. Our model is slightly more measured but still constructive.
- Bear target: $2,800
- Base target: $6,200
- Bull target: $9,000
The bull case assumes Glamsterdam ships, staking ETFs continue to gather assets, and Ethereum maintains its lead as the dominant settlement layer for tokenized real-world assets. The tokenized Treasuries market on Ethereum recently crossed $8 billion. That is a structural tailwind that did not exist in prior cycles.
What to Watch
Five concrete signals will tell you whether the bull or bear path is winning over the next 90 days:
- Glamsterdam testnet milestones. Clean public testnet activation is the green light. Bugs that delay it are a red flag.
- ETF flows. Weekly net inflows above $300 million signal institutional demand is sustained. Sustained outflows mean the institutional bid is gone.
- The $2,420 resistance. A daily close above this level on above-average volume is the cleanest short-term breakout signal.
- The ETH burn rate. If post-Glamsterdam transaction volume lifts L1 burn meaningfully, the deflationary narrative comes back.
- Bitcoin’s behavior. ETH rarely runs hard while BTC is bleeding. A BTC reclaim of $85,000 would create the macro room for ETH to outperform.
For traders watching parallel Layer 1 narratives, the playbook around major upgrades has been a familiar one. Solana’s upcoming Alpenglow upgrade is a useful reference point. We broke down that setup in our Solana price prediction for 2026. The mechanics are different, but the market structure around an upgrade-driven move tends to rhyme.
The Bottom Line
ETH is in a setup that rewards patience. The downside is bounded by a clearly defined support zone. The upside is anchored by a real, dated catalyst that the market has only partly priced in. The base case is constructive but not heroic. The bull case requires the upgrade to ship and macro to cooperate.
If you trade ETH, the framework right now is simple. Watch $2,420 to the upside. Watch $2,040 to the downside. Size positions around how much you trust the Glamsterdam timeline.
You can track real-time ETH price action and market cap data at CoinGecko.
Disclaimer: This article is for informational and educational purposes only and should not be construed as financial, investment, or trading advice. Cryptocurrency markets are highly volatile, and past performance does not guarantee future results. The price predictions and analyses presented here are based on AI models, technical indicators, and available data at the time of writing, they are not guarantees. Always conduct your own research (DYOR) and consult with a qualified financial advisor before making any investment decisions. Pump Parade and its authors do not assume liability for financial losses incurred based on information provided in this article.
