More
    Home Blog Page 18

    Pudgy Penguins (PENGU) Price Prediction 2026: ETF Catalyst

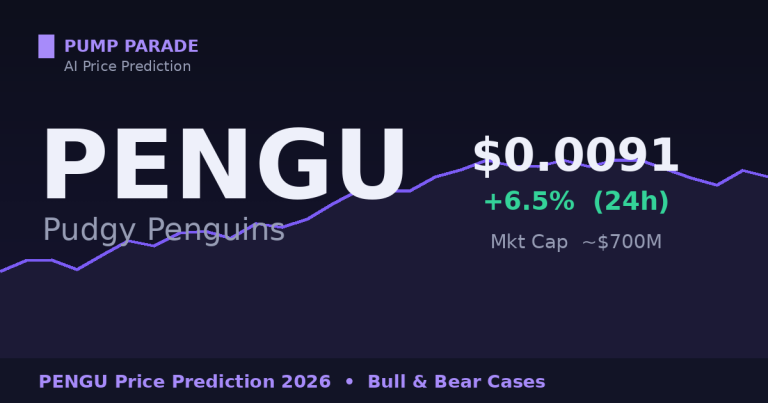
    Pudgy Penguins (PENGU) is trading near $0.0091 at the time of writing. That is up about 6.5% on the day. The strange part? Most of the market is deep in the red. Bitcoin slid toward $78,000 and Solana dropped to around $86 after a wave of risk-off selling. PENGU stayed green.

    So why is the penguin swimming against the tide? And what does our AI model see for the rest of 2026 and beyond? Let’s break down the data, the catalysts, and both sides of the trade.
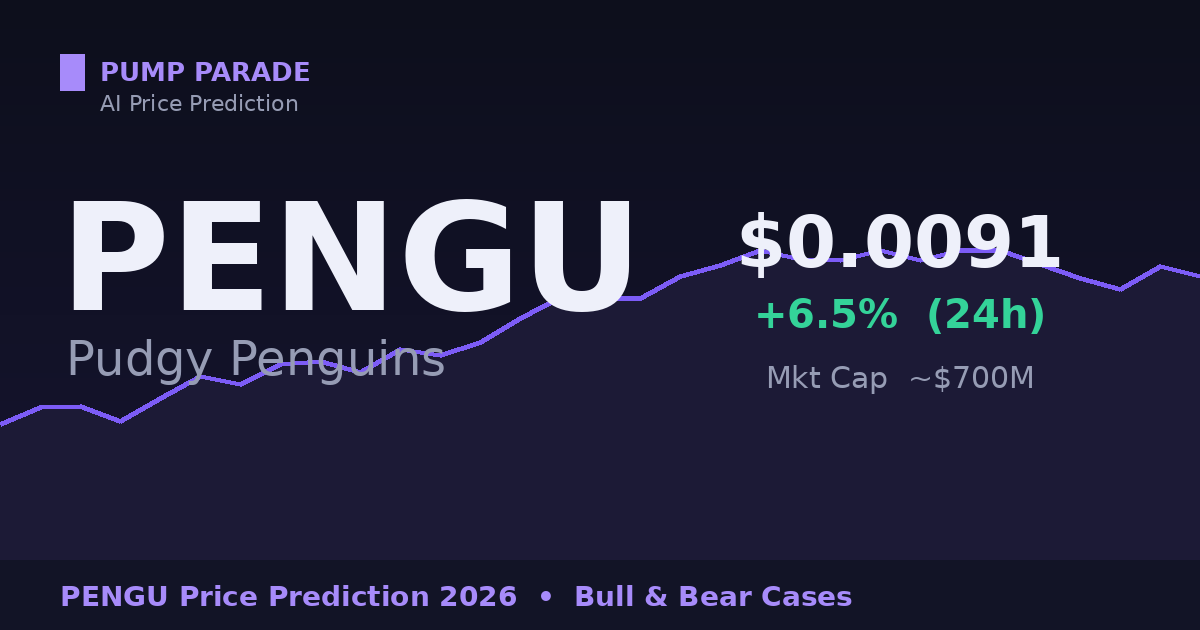
    PENGU Pudgy Penguins price prediction 2026 hero image with current price and 24h change

    PENGU Price Today: The Quick Snapshot

    Here is where PENGU stands right now, based on live on-chain data from Birdeye:

    • Price: about $0.0091
    • 24-hour change: roughly +6.5%
    • Market cap: around $700 million
    • Holders: more than 535,000 wallets
    • On-chain liquidity: close to $10 million

    The token is still well below its all-time high set in late 2024. But the chart tells an interesting story. While high-beta coins like Solana fell hard this week, PENGU held its ground. For a token that many still write off as “just a meme,” that relative strength is worth a closer look. You can track the live market data on CoinGecko.

    What Is Pudgy Penguins (PENGU)?

    PENGU is the official token of Pudgy Penguins. That brand started as a collection of cartoon penguin NFTs in 2021. It has since grown into one of the most recognized names in crypto culture.

    Here is the part many traders miss. Pudgy Penguins is not only a digital project. The team sells physical plush toys in major retail stores. It launched a browser game called Pudgy World. It also rolled out a Visa-backed Pengu Card for real-world spending. In plain terms, the brand is trying to reach people who have never bought a single NFT.

    The PENGU token launched in December 2024 and was airdropped to the community. It now acts as the main liquid asset tied to the whole Pudgy ecosystem. With over 535,000 holders, the distribution is wide. That matters, because broad ownership tends to make a token less fragile than a coin held by a handful of whales.

    The Big Catalyst: A First-of-Its-Kind ETF

    The single biggest story around PENGU is the proposed exchange-traded fund. Investment firm Canary Capital filed to launch an ETF that would hold both PENGU tokens and Pudgy Penguins NFTs. The structure is unusual. The fund would keep most of its value in PENGU, with a smaller slice in the NFTs themselves.

    This would be the first regulated US fund to hold NFTs directly. The SEC formally acknowledged the filing in July 2025, which started the review clock. Since then, the agency has pushed back its decision more than once. That is normal for a novel product like this one.

    Why does this matter for price? An ETF would open the door to buyers who cannot or will not hold tokens in a self-custody wallet. When the SEC first acknowledged the filing, PENGU jumped more than 20% in a single move. That gives us a clear read on how the market values this catalyst. You can read the full filing breakdown on Decrypt.

    The risk is just as clear. Approval is not a sure thing. If the SEC denies the fund, the token could lose a key part of its bull thesis fast.

    PENGU Technical Analysis: What the Chart Says

    Let’s look at the levels that matter. PENGU has spent recent weeks chopping in a range. The zone near $0.0080 has acted as support. Buyers keep stepping in there. On the upside, the $0.0110 to $0.0120 area is the first real resistance. Price has been rejected from that band before.

    The 24-hour green candle in a red market is a small but real bullish signal. It suggests PENGU has its own demand drivers right now, not just market beta. Traders call this relative strength. It often shows up before a token leads a recovery.

    Still, one day does not make a trend. The token trades on lower volume than its larger peers, near $5 million over 24 hours. Thin volume can cut both ways. It can amplify a rally, and it can deepen a sell-off. For more on how Solana memecoins behave in these conditions, see our Bonk (BONK) price prediction.

    The Bull Case for PENGU

    The bull case rests on three legs:

    • The ETF wildcard. Approval would be a major catalyst. It would bring a new class of buyers and a fresh wave of headlines.
    • Real-world reach. The toys, the game, and the Visa card give Pudgy Penguins a brand most tokens simply do not have. That can pull in users who never touch a chart.
    • Strong holder base. More than half a million wallets hold PENGU. A wide base tends to support the floor during sell-offs.

    If these drivers line up with a broader market recovery, the probability favors a move back toward the prior highs.

    The Bear Case for PENGU

    Now the other side. We always show both.

    • It is still a sentiment asset. Without the ETF, PENGU trades mostly on hype and brand momentum. That can fade quickly.
    • Token unlocks. Large supply unlocks can add selling pressure and cap rallies.
    • Macro risk. This week proved the point. Geopolitical shocks and tight monetary policy can drag the whole market down, and high-beta tokens fall hardest.
    • ETF denial. A “no” from regulators would remove the loudest bull argument overnight.

    The level to watch is $0.0080. A clean break below it would weaken the short-term bull case.

    PENGU Price Prediction 2026 and Beyond

    Our hybrid AI model blends technical indicators, on-chain activity, and sentiment data. These are scenarios, not promises. Markets move fast, and no model can price in a black swan. Here is how the three paths look:
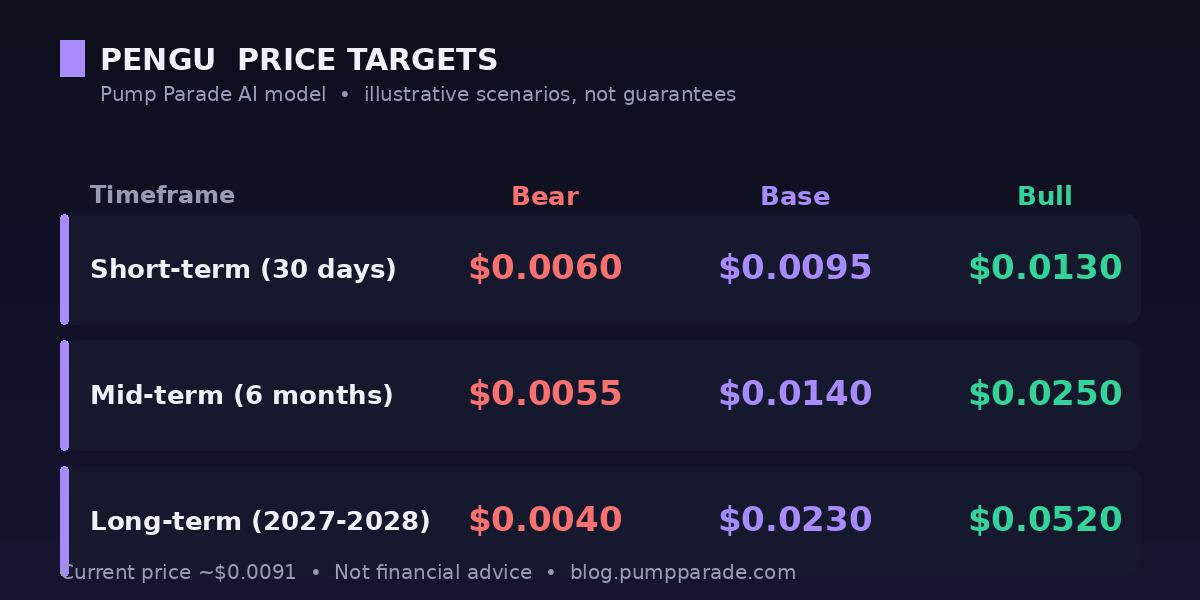
    PENGU price prediction table showing bear, base and bull targets across three timeframes

    Short-term (next 30 days)

    Expect more chop. A bear move could retest $0.0060. The base case holds near $0.0095. A bull run on ETF buzz or a market bounce could push price toward $0.0130.

    Mid-term (6 months)

    This window depends heavily on the ETF outcome and the wider market. The bear path sits near $0.0055. The base case points to about $0.0140. A bull scenario, with approval and a risk-on market, could reach $0.0250.

    Long-term (2027-2028)

    Here the brand strategy matters most. If Pudgy Penguins keeps growing beyond crypto, the long-term base case is around $0.0230. A strong bull cycle could lift it toward $0.0520. The bear case, if the brand stalls, drops back near $0.0040.

    What to Watch Next

    Keep your eyes on a few key signals. First, any update on the Canary ETF decision. Second, the $0.0080 support and $0.0120 resistance levels. Third, overall market direction, since PENGU still moves with risk sentiment. Fourth, new Pudgy World and Pengu Card user numbers, which show real adoption.

    Here is the honest takeaway. PENGU is one of the few memecoins with a real brand engine behind it. That gives it a higher floor than most. But it is still a speculative asset in a volatile market. The smart move is to size positions for that reality, not for the dream.

    Frequently Asked Questions

    Will PENGU reach $0.05?

    It could, but only in a strong bull case over the long term. Our model puts a move toward $0.0520 in the 2027-2028 bull scenario, and only if the ETF and brand growth both deliver.

    Is PENGU a good long-term hold?

    That depends on your risk tolerance. PENGU has a real brand and a wide holder base, which helps. It also carries memecoin-level volatility. Treat it as high-risk, and never invest more than you can afford to lose.

    Disclaimer: This article is for informational and educational purposes only and should not be construed as financial, investment, or trading advice. Cryptocurrency markets are highly volatile, and past performance does not guarantee future results. The price predictions and analyses presented here are based on AI models, technical indicators, and available data at the time of writing. They are not guarantees. Always conduct your own research (DYOR) and consult with a qualified financial advisor before making any investment decisions. Pump Parade and its authors do not assume liability for financial losses incurred based on information provided in this article.
    Ondo (ONDO) Price Prediction 2026: RWA Boom Ahead?

    0

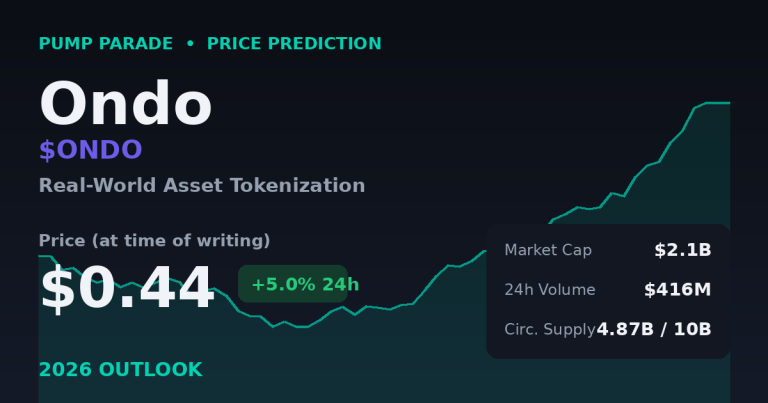
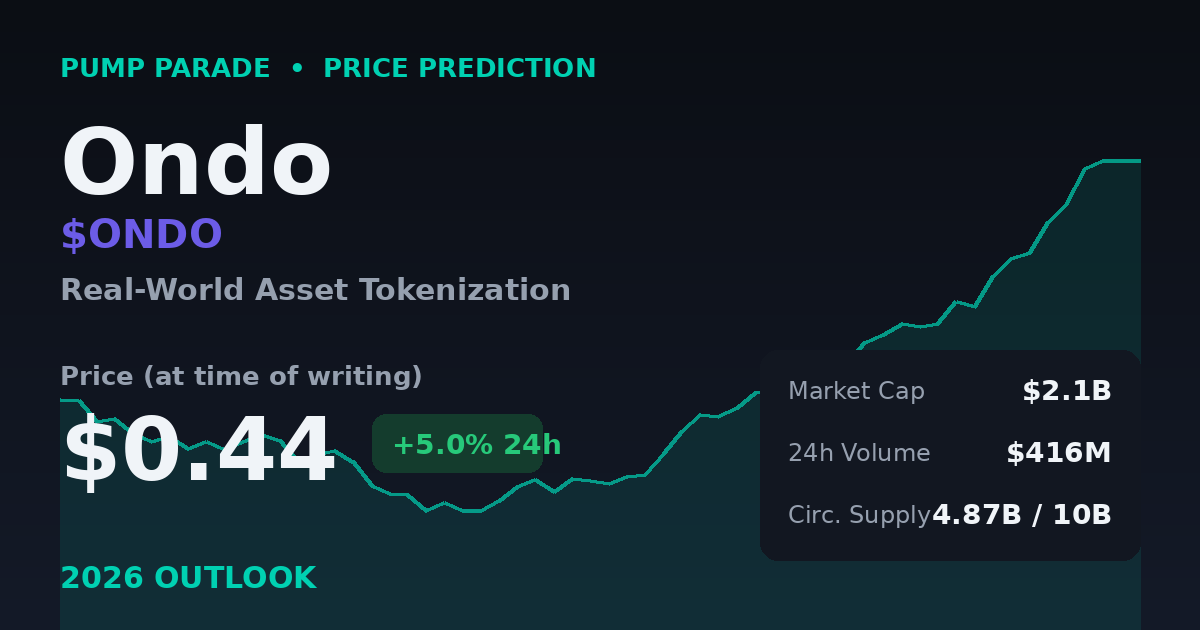
    Ondo Finance (ONDO) is trading near $0.44 at the time of writing. The token is up about 5% over the past 24 hours, on roughly $416 million in trading volume. That puts its market cap around $2.1 billion, good for a top-40 ranking. But here is the number that matters most: ONDO still sits about 80% below its all-time high of $2.14, set back in December 2024.

    So why look at ONDO right now? Timing. Real-world asset (RWA) tokenization just crossed $20 billion in total on-chain value. And the U.S. SEC is expected to roll out a new framework for tokenized stocks this week. Ondo is one of the biggest names in that exact corner of crypto. When a sector heats up, the leaders tend to move first.

    This article breaks down where ONDO stands today, what could push it higher, and what could drag it down. We will cover the data, the catalysts, the technical picture, and clear price targets for the short, mid, and long term. Both the bull case and the bear case get equal time.

    Ondo (ONDO) price prediction 2026 hero graphic showing price near $0.44, market cap $2.1B, and a rising chart line

    What Is Ondo Finance (ONDO)?

    Ondo Finance brings traditional financial assets onto the blockchain. Think U.S. Treasury bonds, money market funds, and now tokenized stocks. In plain terms, Ondo wraps real assets into tokens that anyone can hold and trade on-chain, 24 hours a day.

    Its flagship products are USDY and OUSG. Both give holders exposure to short-term U.S. government debt. The pitch is simple. You get the yield of safe traditional assets, with the speed and access of crypto. That story has found real demand.

    Ondo’s total value locked (TVL) reached about $3.78 billion as of mid-May 2026. The ONDO token itself helps govern the protocol. It has a circulating supply near 4.87 billion out of a 10 billion max supply. That large locked supply matters, and we will return to it in the bear case.

    ONDO Current Price Context

    Let’s look at the numbers. ONDO trades near $0.44 with a market cap close to $2.1 billion. Daily volume of around $416 million shows the token is liquid and active. On-chain DEX pools tracked by Birdeye showed a thinner picture, with one pool dipping about 7% on the day. That gap is normal. Most ONDO volume happens on centralized exchanges, not on-chain.

    The bigger story is the trend. ONDO climbed more than 20% in a single day earlier this month as RWA tokenization crossed the $20 billion mark. It also ranked among the top trending tokens on major price trackers. You can track live market data on its CoinGecko market page. Momentum is building, but the token is still far from its old highs.

    Key Factors and Catalysts

    Three catalysts stand out for ONDO right now.

    1. The SEC tokenized-stock framework. The SEC is expected to introduce rules for tokenized stocks as early as this week. The proposed “innovation exemption” would let firms like Ondo issue blockchain tokens tied to public stocks. They would not need approval from each underlying company. If this passes, Ondo’s addressable market grows by a huge margin. Stocks are a far bigger pie than Treasuries alone.

    2. The RWA sector boom. The tokenized RWA market cap has grown more than 100% year on year, to roughly $37.5 billion. Tokenized Treasuries lead the way. BlackRock’s BUIDL fund alone holds over $1.7 billion in assets. Ondo sits right in the middle of this trend, and big institutions are the customers.

    3. Product and exchange momentum. Ondo keeps shipping. Exchanges are pushing its tokenized stock and ETF products to users. More distribution means more demand for the underlying platform. The RWA narrative also leans on oracle and data infrastructure to price assets safely, a theme we explored in our Chainlink (LINK) price prediction.

    ONDO Technical Outlook

    Here is what the chart is telling us. ONDO has been carving out a base in the $0.34 to $0.46 range for weeks. That zone now acts as support. The first real ceiling sits near $0.50, a level that has rejected price more than once. Above that, $0.62 is the next target where sellers may step in.

    The RSI (Relative Strength Index, a momentum gauge that runs from 0 to 100) has been hovering in neutral territory. That means ONDO is neither overbought nor oversold. In plain terms, it has room to run in either direction without hitting an extreme. A daily close above $0.50 on strong volume would be the first bullish signal worth watching.

    The long-term chart is less kind. ONDO is down about 80% from its $2.14 peak. Recovering that level would take a full sector rally. The pattern suggests a slow grind, not a straight shot. Patience is the theme here.

    The Bull Case for ONDO

    The bull case rests on one idea: Ondo becomes the default bridge between Wall Street and crypto. If the SEC opens the door to tokenized stocks, Ondo is positioned to lead. RWA is one of the few crypto narratives with real, growing institutional money behind it.

    In this scenario, ONDO reclaims the $0.62 to $1.00 zone within six months. A broader bull market in 2027 could push it back toward its old highs near $2.00. Historically, sector leaders capture outsized gains when their narrative goes mainstream. Ondo’s TVL growth gives the thesis real support, not just hope.

    The Bear Case for ONDO

    Now the other side. The biggest risk is token unlocks. With only about half the supply circulating, more tokens will enter the market over time. New supply can cap price gains, even when the product is doing well. This is a real headwind, not FUD.

    The second risk is regulation cutting the wrong way. The tokenized-stock framework could arrive watered down, delayed, or with strict limits. Crypto markets often “buy the rumor and sell the news.” A disappointing ruling could trigger a sharp pullback. The third risk is simple competition. Big players like BlackRock and traditional finance giants could build their own rails and squeeze Ondo’s edge.

    In a bearish scenario, ONDO loses the $0.34 support and slides toward $0.30 or lower. That would invalidate the near-term recovery thesis. Risk factors here are concrete, and any serious analysis has to weigh them.

    ONDO Price Prediction by Timeframe

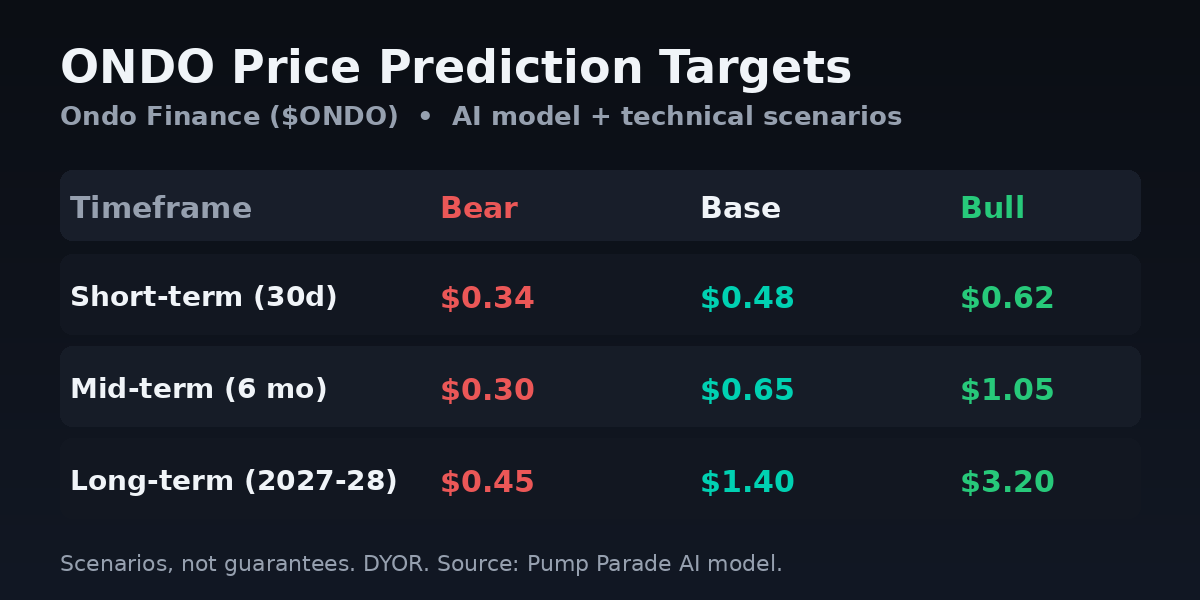
    Based on our AI model, current technicals, and the RWA narrative, here are our scenarios. These are probabilities, not promises. Each timeframe shows a bear, base, and bull target.

    ONDO price prediction table showing short-term, mid-term, and long-term bear, base, and bull targets

    Short-term (next 30 days): Bear $0.34, Base $0.48, Bull $0.62. A clear SEC ruling could drive the bull case. A delay likely keeps ONDO range-bound.

    Mid-term (6 months): Bear $0.30, Base $0.65, Bull $1.05. The base case assumes steady RWA growth and a stable market. The bull case needs tokenized stocks to gain real traction.

    Long-term (2027-2028): Bear $0.45, Base $1.40, Bull $3.20. A full bull market plus mainstream RWA adoption could carry ONDO past its old high. The bear case reflects heavy unlocks and weak demand.

    What to Watch

    Keep your eyes on a few key signals. First, the SEC framework details and timing. The fine print will matter more than the headline. Second, the $0.50 resistance level. A clean break on volume opens the next leg up. Third, ONDO’s TVL trend. Rising TVL means the product is winning, which supports the token over time.

    The smart move is to treat ONDO as a bet on the RWA narrative, not just a single token. If real-world assets keep flowing on-chain, the sector leaders benefit. If the trend stalls, even good products struggle. Watch the sector, and the token will follow.

    Disclaimer: This article is for informational and educational purposes only and should not be construed as financial, investment, or trading advice. Cryptocurrency markets are highly volatile, and past performance does not guarantee future results. The price predictions and analyses presented here are based on AI models, technical indicators, and available data at the time of writing. They are not guarantees. Always conduct your own research (DYOR) and consult with a qualified financial advisor before making any investment decisions. Pump Parade and its authors do not assume liability for financial losses incurred based on information provided in this article.
    GMGN vs Trojan: Best Solana Trading Bot 2026

    0
    GMGN vs Trojan Solana trading bot comparison

    If you trade Solana memecoins, you have almost certainly run into both of these names. GMGN and Trojan are two of the most used trading tools in the ecosystem, but they solve the problem from opposite ends. One started as a research and analytics terminal that grew teeth. The other started as a Telegram sniper that grew a full web app. So which one actually deserves a spot in your workflow in 2026? We put them head to head on fees, speed, features, and trust.

    Quick Verdict (TL;DR)

    Both bots charge a 1% trade fee and both are non-custodial, so the decision comes down to how you trade. If you want the deepest research, wallet tracking, and multi-chain reach, GMGN is the stronger all-in-one terminal. If you want the fastest, most battle-tested execution on Solana with a real third-party security audit and generous cashback, Trojan wins.

    • Best for research and multi-chain trading: GMGN (rating 4.3/5)
    • Best for fast Solana execution and security: Trojan (rating 4.5/5)

    Product Overviews

    What is GMGN?

    GMGN (the name is shorthand for “good morning, good night”) began life as a multi-chain token scanner and gradually turned into a full trading terminal. It supports Solana, Ethereum, BSC, and Base, and it pairs a browser-based terminal with a Telegram bot. The platform is built around discovery: new token monitoring, holder analysis, smart money wallet tracking, profit and loss analytics, and built-in token security checks. Daily trading volume routinely sits in the multi-million dollar range, and the user base spans every chain it touches. For traders who treat finding the next play as half the battle, GMGN packs a lot into one screen.

    What is Trojan?

    Trojan launched in early 2024, built by the team that previously ran “Unibot on Solana” before splitting off into its own independent project. It is Solana-first and Telegram-native, with a web terminal added later that shares the same core engine. By 2026 Trojan has processed well over $20 billion in lifetime volume and serves roughly 1.7 million users, which makes it one of the largest trading bots in the entire Solana ecosystem. Its reputation rests on raw execution speed and a no-nonsense feature set aimed at active on-chain traders.

    Trojan Solana trading bot interface
    Trojan’s onchain trading interface (source: trojan.com).

    Features Deep Dive

    On paper the two tools overlap heavily. Both offer market, limit, and DCA orders, copy trading, token audits, and self-custodial wallets. The differences show up in emphasis.

    GMGN leans into intelligence. Its smart money tracking lets you watch profitable wallets and mirror their entries, and its security monitor scores token risk before you ape in. Anti-sandwich and MEV protection are baked in, and power users can run custom automated scripts rather than relying on preset buttons. The catch reported by active traders is copy-trade latency: mirrored buys can lag the original wallet by roughly 2 to 5 seconds, which matters a lot on fast Solana launches.

    Trojan leans into speed. Its BOLT execution engine targets sub-2-second fills, and it supports private transaction routing to reduce front-running and sandwich attacks. Copy trading comes with customizable risk parameters and auto-exit settings, and the limit and DCA tools let you automate recurring buys over time. There is less emphasis on research dashboards and more on getting your order filled before the candle moves.

    It is worth being honest about what each tool gives up. GMGN asks you to learn a busy interface in exchange for its depth, and its multi-chain breadth means features sometimes land on Solana first and other chains later. Trojan keeps things narrow on purpose: you will not find sprawling analytics or cross-chain support, but the trade-off is a tool that does one thing, fast Solana trading, very well. Knowing which compromise you are comfortable with usually settles the choice faster than any feature checklist.

    Fees and Pricing

    This is closer than you might expect. Both platforms charge a 1% fee per trade, applied to buys and sells, with no monthly subscription. The nuance is in the discounts:

    • GMGN: 1% base fee, reducible to roughly 0.7% to 0.9% using a referral code. The default priority fee sits around 0.006 SOL per transaction, which is on the higher side, so watch your settings during congestion.
    • Trojan: 1% base fee, reducible to 0.9% with a referral code. On top of that, Trojan runs an “Arena” loyalty system that pays SOL cashback after every completed trade, starting near 10% at the entry “Degen” rank and climbing toward 45% at the top “Titan” rank. For high-volume traders, that cashback can meaningfully lower the effective cost.

    Bottom line: headline fees are identical, but Trojan’s cashback program gives heavy traders a real edge, while GMGN’s value is in the data you get alongside the trade.

    GMGN vs Trojan: Side-by-Side Comparison

    GMGN vs Trojan feature and fee comparison table

    The table above sums up where each tool pulls ahead. GMGN is the wider net; Trojan is the sharper spear.

    Pros and Cons

    GMGN

    Pros: Multi-chain support across Solana, Ethereum, BSC, and Base; excellent wallet tracking and smart money discovery; built-in token security scoring; web terminal plus Telegram; custom scripting for advanced users.

    Cons: Copy-trade latency of 2 to 5 seconds; higher default priority fee; no formal smart contract audit, with a CertiK code-security score around 57/100 (a BBB rating).

    Trojan

    Pros: Sub-2-second BOLT execution; Trail of Bits security audit; generous Arena SOL cashback up to 45%; private transaction routing for MEV protection; massive proven volume and user base.

    Cons: Solana only, so no cross-chain trading; lighter on research and analytics dashboards; the loyalty tiers reward volume, which can nudge overtrading.

    Security and Trust

    Security is where the gap is widest, and it favors Trojan. Trojan has a public audit from Trail of Bits, one of the most respected names in software security, and it uses a non-custodial setup with an MPC-based wallet design that keeps funds under user control while reducing friction. With over $20 billion in lifetime volume and no major reported incidents, it has a long track record to point to.

    GMGN is also non-custodial and has no history of security breaches, which is reassuring. However, it lacks a formal smart contract audit, and third-party security scanners give its codebase a middling score. That does not make it unsafe, but it does mean you are trusting reputation and uptime rather than a published audit. For traders moving large size, that distinction is worth weighing. If you are new to bot security in general, our Axiom review covers the same custody questions in more depth.

    User Experience

    GMGN’s web terminal is dense. The screen is packed with new pairs, migration status, holder counts, and smart money flags, which is fantastic once you learn it and overwhelming on day one. Most users research on the web app and execute through the Telegram bot for speed.

    Trojan feels lighter and faster. The Telegram interface is clean and quick to navigate, the web terminal mirrors it, and the whole experience is built around getting in and out of a position with minimal taps. New traders tend to find Trojan easier to start with, while data-hungry traders gravitate to GMGN’s wall of information.

    Verdict and Rating

    There is no single winner here, because these tools are optimized for different jobs. If your edge comes from finding tokens early and following smart money across multiple chains, GMGN is the better home base, and you can always route execution elsewhere when speed is critical. If your edge comes from fast, reliable fills on Solana and you value a published security audit plus cashback, Trojan is the safer, faster choice.

    Plenty of serious traders use both: GMGN for discovery, Trojan for execution. Try each with a small wallet before committing real size. For another close matchup in this category, see our Photon vs BullX comparison.

    • GMGN: 4.3 / 5
    • Trojan: 4.5 / 5

    Visit the official sites to confirm current fees and features: GMGN and Trojan. You can also cross-check ecosystem data on CoinGecko and DeFiLlama.

    Frequently Asked Questions

    Is GMGN or Trojan cheaper?

    Both charge a 1% base fee, reducible with referral codes. Trojan can end up cheaper for active traders thanks to its Arena cashback, which pays back up to 45% of fees in SOL at the highest tier.

    Are GMGN and Trojan safe to use?

    Both are non-custodial, so your funds stay in wallets you control. Trojan has a public Trail of Bits audit, while GMGN has no formal smart contract audit but a clean incident history. Always use a dedicated trading wallet and never store more than you are willing to risk.

    Does GMGN support chains other than Solana?

    Yes. GMGN supports Solana, Ethereum, BSC, and Base, which is a key advantage over Trojan, which is Solana only.

    Which bot is faster for sniping new launches?

    Trojan’s BOLT engine targets sub-2-second execution and is generally considered faster for fills. GMGN is strong for spotting launches early but can lag on copy trades by a few seconds.

    Can I use both at the same time?

    Yes, and many traders do. A common setup is using GMGN for research and wallet tracking, then executing through Trojan for speed. They are separate, non-custodial tools, so there is no conflict in running both.

    Disclaimer: This article is for informational purposes only and is not financial advice. Crypto trading carries significant risk. Always do your own research.

    Bittensor (TAO) Price Prediction 2026: Can TAO Hit $500?

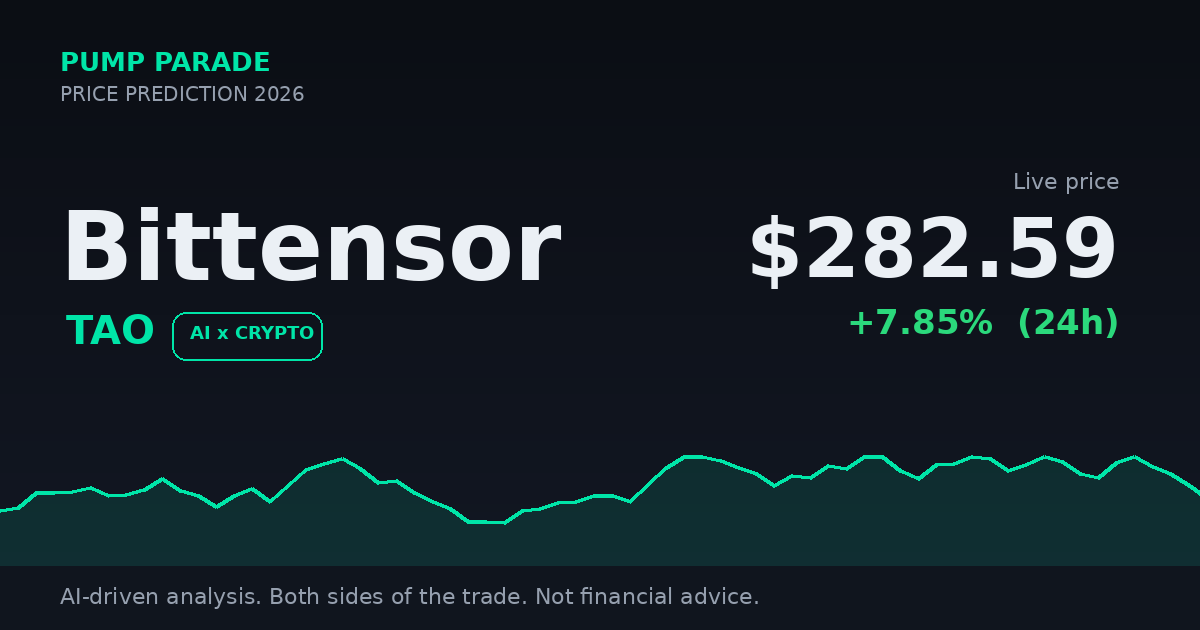
    Bittensor (TAO) is trading near $282 at the time of writing. It is up about 8% on the day, but still down roughly 14% over the past week. That mix tells the whole story right now. Buyers are stepping back in after a sharp drop, yet the trend is still shaky.

    So why look at TAO today? Because it sits at the center of one of crypto’s loudest narratives: real, on-chain artificial intelligence. The token also has fresh catalysts in play, from spot ETF filings to a recent supply halving. Let’s break down the data, the bull case, the bear case, and where the price could go next.

    Bittensor TAO price prediction 2026 with live price near $282

    What Is Bittensor (TAO)?

    Bittensor is a network that pays people to build and run AI models. Think of it as an open market for machine intelligence. Developers spin up “subnets,” which are specialized markets for AI tasks like text generation, data scraping, and price prediction. The best models earn more TAO. Weak ones earn less.

    TAO is the token that powers all of it. You need it to register, to stake, and to earn rewards. The network now runs more than 250 subnets, up sharply from a handful two years ago. In plain terms: the more useful AI work the network does, the more demand there is for TAO.

    Here are the key numbers at the time of writing:

    • Price: about $282
    • Market cap: roughly $2.7 billion
    • 24-hour volume: around $226 million
    • 7-day change: down about 14%

    The Catalysts Driving TAO Right Now

    Three things make Bittensor worth watching this quarter. None of them are hype. All of them are checkable.

    1. Spot TAO ETF filings

    On April 28, 2026, major asset managers Grayscale and Bitwise disclosed spot TAO ETF filings. An ETF would let regular investors buy TAO through a normal brokerage account. No wallet. No seed phrase. That matters because it opens the door to large pools of capital that cannot touch tokens directly today.

    We have seen this movie before. When spot ETFs launched for other altcoins, demand often followed. Our coverage of the Hyperliquid ETF catalyst showed how fast sentiment can shift once products go live. A filing is not an approval, though. This is a catalyst to track, not a done deal.

    2. The December 2025 halving

    On December 12, 2025, Bittensor cut its block rewards in half. Daily new supply dropped from 7,200 TAO to 3,600 TAO. Less new supply hitting the market can support price over time, if demand holds steady. Bitcoin’s halvings work on the same logic. The effect is slow, not instant, so do not expect a clean reaction.

    3. Dynamic TAO (dTAO) and real revenue

    Bittensor switched to a system called Dynamic TAO, or dTAO. Translation: rewards now flow to the subnets that actually perform, not just the ones that exist. This pushes builders to ship useful AI, not noise. The network reported about $43 million in revenue in Q1 2026, with cumulative ecosystem value nearing $1.5 billion. Real usage, not just promises, is the bull thesis here.

    TAO Technical Analysis

    Let’s look at what the chart is telling us. TAO has been weak over the past week, but it is bouncing today.

    The first level to watch is resistance near $329. Analyst Michael van de Poppe flagged this zone in early May. A clean break above it would open a path toward $350. Until then, sellers hold the upper hand.

    On the downside, the $250 area is the key support to defend. Lose it, and the next test sits closer to $200. The Relative Strength Index (RSI), a momentum gauge that runs from 0 to 100, has cooled off after the weekly drop. That leaves room for a bounce, but it is not yet a strong buy signal.

    In short: TAO is stuck in a range. The bulls need $329. The bears want a break under $250. Whichever level breaks first likely sets the tone for the next month.

    Bittensor (TAO) Price Prediction by Timeframe

    Here is where our analysis lands. These are scenarios, not promises. Each one comes with a condition. Markets can and do surprise.

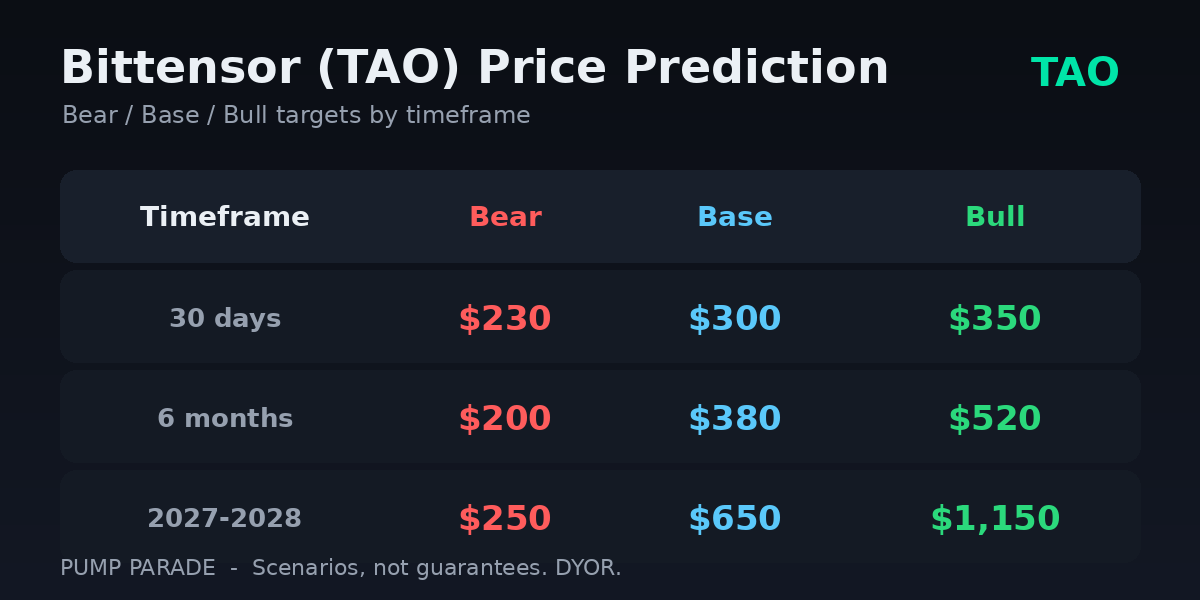
    Bittensor TAO price prediction targets bear base bull by timeframe

    Short-term (next 30 days)

    The probability favors a range-bound month. Our base case sees TAO near $300 if buyers defend $250. A break above $329 could push it to the $350 bull target. If support fails, a slide to the $230 bear zone is on the table.

    Mid-term (next 6 months)

    This is where the ETF story gets tested. If a spot TAO ETF gains traction, the base case points to $380, with a bull path toward $520. That bull target lines up with the more optimistic 2026 forecasts from sources like Changelly. The bear case sits near $200 if AI hype cools and filings stall.

    Long-term (2027 to 2028)

    The long game depends on whether Bittensor becomes real AI infrastructure or fades as a narrative. If subnet revenue keeps climbing, our base case targets $650, with a bull case near $1,150. If the AI trade unwinds and competitors win, TAO could revisit $250 or lower. The range is wide on purpose. The further out you forecast, the less certain anyone should be.

    The Bear Case: What Could Go Wrong

    Balanced analysis means naming the risks. TAO has plenty.

    First, AI tokens are a crowded narrative. If the broader AI trade loses steam, TAO will likely fall with it. Second, the ETF filings could stall or get rejected. A “no” would hit sentiment hard. Third, competition is real. Other networks are chasing the same decentralized-AI dream. Fourth, much of TAO’s value still rests on a story about the future, not on profits today. Stories can fade fast in crypto.

    There is also the macro backdrop. With the wider market choppy and majors like Bitcoin and Solana well off their highs, risk appetite is fragile. TAO is a high-beta asset. It tends to move harder than the market in both directions.

    What to Watch Next

    Keep an eye on a few clear signals. Watch the $329 resistance and the $250 support. Watch for any news on the Grayscale and Bitwise ETF filings. And watch subnet revenue: if Q2 numbers beat Q1, the bull thesis strengthens. If they slip, the bear case grows.

    You can track live TAO price and volume data on CoinGecko. Cross-checking the numbers yourself is always the smart move.

    The Bottom Line

    Bittensor is one of the more credible AI plays in crypto. It has real revenue, a clear use case, and fresh catalysts in the ETF filings and the recent halving. That is the bull case, and it is a solid one.

    But TAO is volatile, story-driven, and exposed to a crowded narrative. The path to $500 and beyond runs through the $329 level and a working ETF story. The path lower runs through a break of $250 and a cooling AI trade. Both are live. Watch the levels, size your risk, and let the data lead.

    Disclaimer: This article is for informational and educational purposes only and should not be construed as financial, investment, or trading advice. Cryptocurrency markets are highly volatile, and past performance does not guarantee future results. The price predictions and analyses presented here are based on AI models, technical indicators, and available data at the time of writing. They are not guarantees. Always conduct your own research (DYOR) and consult with a qualified financial advisor before making any investment decisions. Pump Parade and its authors do not assume liability for financial losses incurred based on information provided in this article.
    Raydium (RAY) Price Prediction 2026: Buyback Catalyst

    0

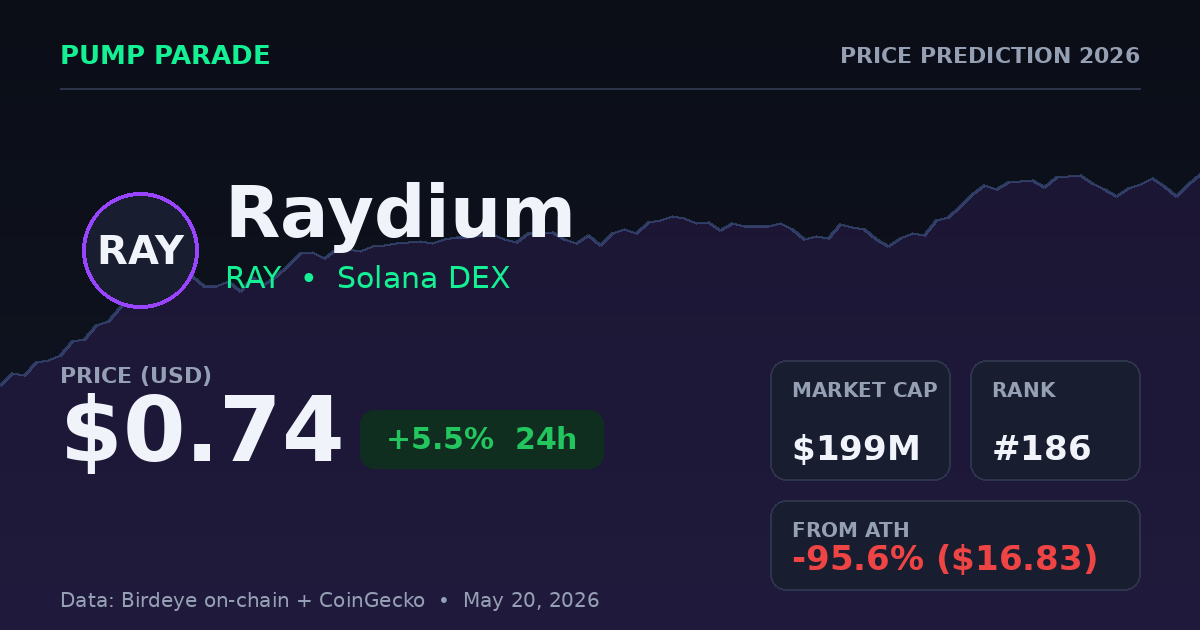
    Raydium (RAY) is trading near $0.74 at the time of writing. The token is up about 5.5% in the last 24 hours. But the picture is more mixed over a longer window. RAY is up roughly 15% over the past 30 days, yet down about 10% over the past 7 days. In short: a strong month, with a recent cooling-off.

    So why look at Raydium right now? Two reasons. First, RAY has a real, working business behind it. Raydium is one of the largest decentralized exchanges (a DEX, meaning a place to trade tokens without a middleman) on Solana. Second, it has a buyback program that has already retired a large chunk of its supply. That mix of cash flow and shrinking supply is rare in crypto.

    This article breaks down where RAY stands today, what is driving it, and where the price could go. We will cover the bull case and the bear case. Then we will give clear price targets by timeframe. Let’s look at the numbers.

    Raydium RAY price prediction 2026 with current price $0.74 and market cap

    Raydium (RAY) Price Today: The Current Setup

    Here is the snapshot as of May 20, 2026:

    • Price: about $0.74
    • Market cap: roughly $199 million (rank #186)
    • 24-hour change: +5.5%
    • 7-day change: -10%
    • 30-day change: +15%
    • 24-hour trading volume: about $23 million across all venues
    • Circulating supply: roughly 269 million RAY (max supply 555 million)

    One number stands out. RAY sits about 95% below its all-time high of $16.83, set back in September 2021. That is a steep fall. For some traders, that gap looks like risk. For others, it looks like room to run. According to CoinGecko market data, the token has bounced hard off its 2022 low near $0.13, but it has a long way back to its peak.

    What Is Raydium? A Quick Primer

    Raydium is a decentralized exchange built on Solana. In plain terms, it lets people swap one token for another and earn fees by providing liquidity. It launched in 2021 and has stayed a core piece of Solana’s DeFi (decentralized finance) world ever since.

    The token, RAY, does a few jobs. Holders can stake it, provide liquidity, and benefit from the protocol’s buyback program. The more the platform is used, the more fees it earns. Some of those fees flow back to RAY through buybacks. We will get to why that matters in a moment.

    The Buyback Catalyst: Why RAY Is Different

    Here’s the thing that makes Raydium worth a closer look. The protocol runs a programmatic buyback. It uses 12% of its protocol fees to buy RAY off the open market. This is automatic, not a one-time PR move.

    The scale is large for a token this size. Raydium has spent more than $190 million on cumulative buybacks. That adds up to around 69 million RAY, or roughly 25% of the circulating supply. Translation: a quarter of the float has been bought back over time. When supply shrinks and demand holds, price tends to feel upward pressure.

    The fuel behind this is LaunchLab, Raydium’s token launch platform. It went live in April 2025 and quickly became a top revenue driver for the protocol. More launches mean more fees. More fees mean bigger buybacks. That is the flywheel the bulls are watching.

    Raydium (RAY) Technical Analysis

    Let’s look at what the chart is telling us. RAY had a solid month but pulled back over the past week. That recent dip put the price back near a key zone.

    Support levels to watch: The first real support sits around $0.65. Below that, the $0.55 area comes into play. A deeper flush could test $0.48, which lines up with recent swing lows.

    Resistance levels to watch: The first hurdle is near $0.88, a level RAY has struggled to clear in 2026. Above that, $1.00 is the big psychological line. A clean break there opens the path toward $1.65.

    Momentum is mixed. The 30-day trend is up, which is bullish. But the 7-day slide shows buyers took a breather. The RSI (Relative Strength Index, a tool that measures whether an asset is overbought or oversold) has cooled from its recent highs. That is not bearish on its own. It often signals healthy consolidation before the next move.

    The Bull Case for RAY

    The bull case rests on real fundamentals, not hype. Here is the core of it.

    First, the buyback. If LaunchLab keeps generating fees, the protocol keeps buying back RAY. That steady demand can put a floor under the price. Few small-cap tokens have this kind of built-in buyer.

    Second, Solana’s growth. Raydium earns more when Solana activity rises. If trading, farming, and token launches climb on Solana in 2026, RAY benefits directly. It is a leveraged bet on the broader Solana ecosystem. For more on the network itself, see our Jupiter (JUP) price prediction, which covers another major Solana DEX token and the same demand trends.

    Third, the discount. RAY trades 95% below its peak. If the market rotates back into DeFi, tokens with real revenue could lead. RAY fits that profile.

    The Bear Case for RAY

    Now the other side of the trade. A balanced view means taking the risks seriously.

    First, competition is fierce. Jupiter, Orca, and other Solana platforms all fight for the same users. If Raydium loses market share, fee revenue drops. Smaller fees mean smaller buybacks. The flywheel can spin in reverse.

    Second, the buyback depends on volume. LaunchLab revenue is tied to memecoin and token launch activity. That activity is cyclical. When the launch frenzy cools, so does the cash flow that funds buybacks.

    Third, broad market risk. Some analysts expect a crypto market correction in 2026. In a downturn, small-cap DeFi tokens often fall harder than majors. A drop below $0.48 would invalidate the near-term bull thesis and could open the door to lower levels.

    Fourth, security. Solana DeFi has seen frontend hacks and exploits. A serious incident involving Raydium or a key partner could hit confidence fast.

    Raydium (RAY) Price Prediction 2026 and Beyond

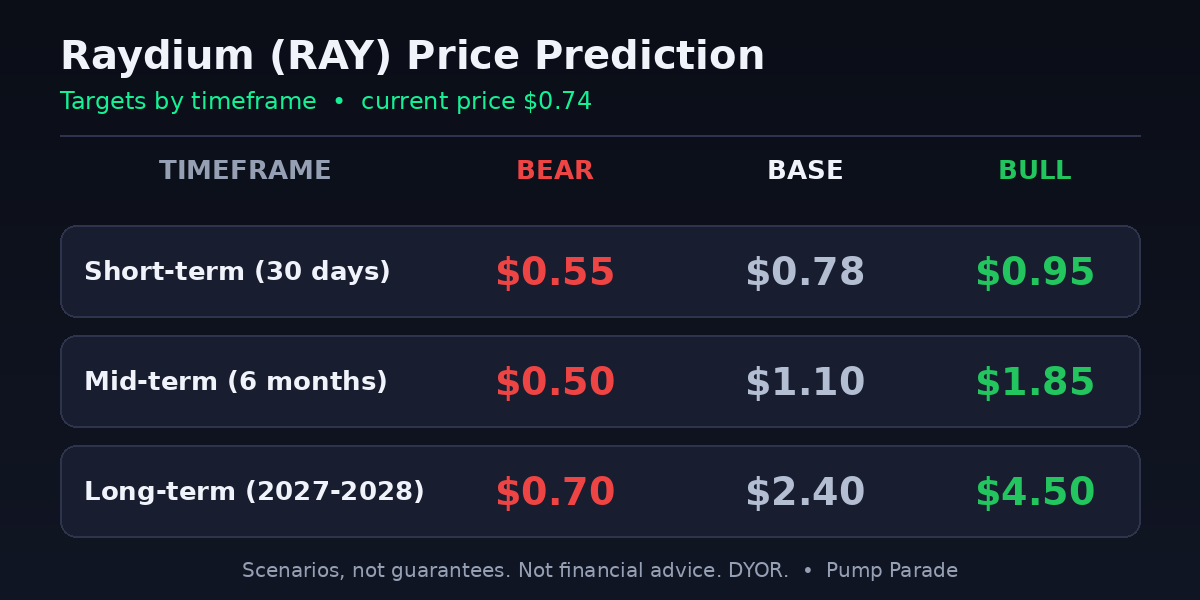
    So where could RAY go? Below are our scenarios by timeframe. These are based on current data, technical levels, and the buyback dynamic. They are not guarantees. Each timeframe shows a bear, base, and bull target.

    Raydium RAY price prediction targets: short, mid and long-term bear, base and bull cases

    Short-Term Price Prediction (Next 30 Days)

    Expect range-bound action while the market digests the recent pullback. If support holds, RAY could grind back toward resistance.

    • Bear target: $0.55
    • Base target: $0.78
    • Bull target: $0.95

    Mid-Term Price Prediction (6 Months)

    This window depends on Solana activity and LaunchLab fees. Strong on-chain demand could push RAY through $1.00. Weak demand could send it back toward the lows.

    • Bear target: $0.50
    • Base target: $1.10
    • Bull target: $1.85

    Long-Term Price Prediction (2027-2028)

    Over a longer horizon, the buyback could meaningfully shrink supply. If Solana DeFi keeps growing and RAY holds its share, the upside is real. But a prolonged bear market would cap gains.

    • Bear target: $0.70
    • Base target: $2.40
    • Bull target: $4.50

    For context, several analyst models put RAY’s 2026 range between roughly $0.62 and $2.71. Our base case sits inside that band. Our long-term bull case assumes sustained buybacks plus a healthy Solana cycle.

    What to Watch Next

    Keep an eye on a few signals. They will tell you which scenario is playing out.

    • LaunchLab revenue: Rising fees support bigger buybacks. Falling fees do the opposite.
    • The $0.88 resistance: A clean break above it would be a bullish signal. Rejection keeps RAY range-bound.
    • The $0.48 support: A break below it would flip the near-term outlook bearish.
    • Solana activity: More network usage tends to lift RAY. Watch overall DEX volume on Solana.

    The Bottom Line

    Raydium is one of the few small-cap tokens with a real business and a working buyback. That is its edge. The data points to a token with strong fundamentals trading at a steep discount to its peak. The risk is competition and a possible market correction.

    Our base case sees RAY near $0.78 in the short term and around $1.10 over six months. The bull case needs sustained buybacks and a healthy Solana cycle. The bear case needs only a market downturn or a drop in LaunchLab fees. As always, the smart move is to watch the levels and let the data guide you, not the hype.

    Analysis dated May 20, 2026. Prices reference Birdeye on-chain data and CoinGecko market data at the time of writing.

    Disclaimer: This article is for informational and educational purposes only and should not be construed as financial, investment, or trading advice. Cryptocurrency markets are highly volatile, and past performance does not guarantee future results. The price predictions and analyses presented here are based on AI models, technical indicators, and available data at the time of writing. They are not guarantees. Always conduct your own research (DYOR) and consult with a qualified financial advisor before making any investment decisions. Pump Parade and its authors do not assume liability for financial losses incurred based on information provided in this article.
    Nansen Review 2026: Smart Money, Features & Verdict

    0

    If you’ve spent any time researching tokens, chasing alpha, or trying to figure out what the whales are doing, you’ve almost certainly bumped into Nansen. It is the analytics platform that effectively created the “Smart Money” category, and after a sweeping 2026 relaunch (new product, new pricing, new chains, even onchain trading), it has changed enough that any older review on the internet is now out of date.

    This is a fresh, hands-on look at where Nansen stands in May 2026. We will cover what it is, how the new free and Pro tiers compare, the headline features, the fees you actually pay, the chains it now supports, where it shines, where it struggles, and whether it is worth $49 a month if you are a serious onchain trader.

    Quick Verdict: Nansen Rating 4.5 / 5

    Nansen remains the most polished, professional onchain analytics product on the market. Its wallet labels are unmatched in depth, its Smart Money dashboards still surface trades that other tools miss, and the simplified Pro plan at $49 per month is the single biggest UX improvement in years. The free tier is enough for casual research, and the Pro tier is genuinely affordable for any active trader. The main reason it is not a perfect 5 is that competitors like Arkham now match it on basic wallet tracking for $0, and Nansen’s interface still has a learning curve.

    Best for: active onchain traders, fund analysts, NFT researchers, anyone who tracks Smart Money flows.
    Skip if: you only buy on a centralized exchange and never look at wallets.

    Visit Nansen →

    What Is Nansen?

    Nansen Review 2026: Smart Money, Wallet Labels and Pro Pricing on PumpParade

    Nansen is a blockchain analytics platform that ingests onchain data from more than a dozen networks, attaches human-readable labels to the wallets behind that activity, and then surfaces those labels through dashboards, alerts, and a query layer. The headline use case is “Smart Money” tracking, which means watching the wallets of profitable traders, funds, market makers, and protocol insiders in near-real time so you can react when they react.

    The company was co-founded in 2019 by Alex Svanevik, Evgeny Medvedev, and Lars Bakke Krogvig, and it is backed by Andreessen Horowitz, Tiger Global, and other top tier investors. According to Nansen’s own documentation, the labels database now covers over 300 million wallet addresses across 12 plus chains, which is the moat that keeps it ahead of cheaper alternatives.

    Nansen 2 and the 2026 Relaunch

    For most of its life, Nansen was an expensive professional tool. The old Pioneer plan cost $129 a month, and the Professional tier ran from $999 to several thousand. That changed with the Nansen 2 redesign and a pricing overhaul that collapsed the old four tier structure into just two plans: Free and Pro. The new Pro plan is $49 per month on an annual subscription, or $69 per month if you pay monthly, which works out to roughly a 62 percent cut from the old Pioneer price and around 95 percent off the old Professional tier.

    At the same time, Nansen shipped a redesigned dashboard, a real-time Signal feed, a “Smart Segment” builder for custom wallet groups, native onchain trading on Solana and Base, and a cross-chain swap rail powered by partners like Jupiter, OKX, and LI.FI. The product still has rough edges, but the trajectory is clearly toward a much broader, more retail friendly tool.

    Nansen official product image showing the Nansen onchain analytics platform

    Key Features

    Nansen Smart Money wallet tracking dashboard illustration

    1. Smart Money Dashboards

    This is still the marquee feature. Nansen maintains a curated set of roughly a dozen “Smart Money” labels assigned to wallets that meet specific behavioral criteria, including historical PnL, holding patterns, and onchain history. Examples include Smart Money Funds, Smart LPs, Smart Airdrop Farmers, Smart NFT Traders, and Top Ranked Wallets. The dashboards then aggregate flows from those wallets so you can see what they are buying, selling, and holding without manually opening 200 Etherscan tabs.

    2. Wallet Labels (300M+ Addresses)

    The label database is the single biggest reason traders pay for Nansen. Every label in the system has to be backed by compiled evidence, which the team has talked about publicly as a deliberate quality-assurance moat. You get coverage of exchanges, funds, market makers, KOLs, MEV bots, bridges, and protocol contracts across Ethereum, Solana, Base, BNB Chain, and more. That context is what turns a random transaction into a story.

    3. Signal: Real-Time Alerts

    Signal is Nansen 2’s real-time feed of unusual onchain activity. It flags things like a Smart Money cluster suddenly accumulating a new token, large stablecoin movements off CEXs, abnormal liquidity adds, and other patterns. Pro subscribers can layer custom alert criteria on top of it.

    4. Smart Segments

    Smart Segments lets you define your own custom wallet group based on labels, token holdings, or activity, then track that segment as if it were one of Nansen’s native dashboards. This is the feature that converts Nansen from a “look at what Nansen thinks is interesting” tool into “look at what I think is interesting”, which is the upgrade serious researchers have wanted for years.

    5. Native Onchain Trading

    As of January 21, 2026, Nansen opened its native onchain trading to all users on Solana and Base. Trades route through Jupiter, OKX, and LI.FI for execution, and you can swap directly from Base to Solana inside the app. Fees are 0.10 percent for Pro users and 0.25 percent for Free users, which is competitive with most Solana trading interfaces and noticeably cheaper than most Telegram bots once you factor in their priority fee markups.

    6. Token, Wallet, and Chain Pages

    Every token, wallet, and chain on a supported network has a dedicated profile page with holders, flows, top buyers and sellers, Smart Money exposure, and historical PnL. These pages are the daily-driver views for most active traders, and they are noticeably faster after the Nansen 2 rebuild.

    7. NFT Analytics

    Nansen kept its NFT analytics through the rebrand and they remain stronger than most competitors, including Arkham. You get collection-level Smart Money exposure, top buyer flows, wash trade detection, and floor price analytics across the major marketplaces.

    Supported Chains

    As of May 2026, Nansen supports analytics on Ethereum, Solana, Base, BNB Chain, Polygon, Arbitrum, Optimism, Avalanche, Linea, Blast, Scroll, and Hyperliquid, with deeper Smart Alerts and Smart Segment coverage on the headline networks. The team is on record about prioritizing Solana and Base for new product features like trading, with the rest of the network list expanding over time.

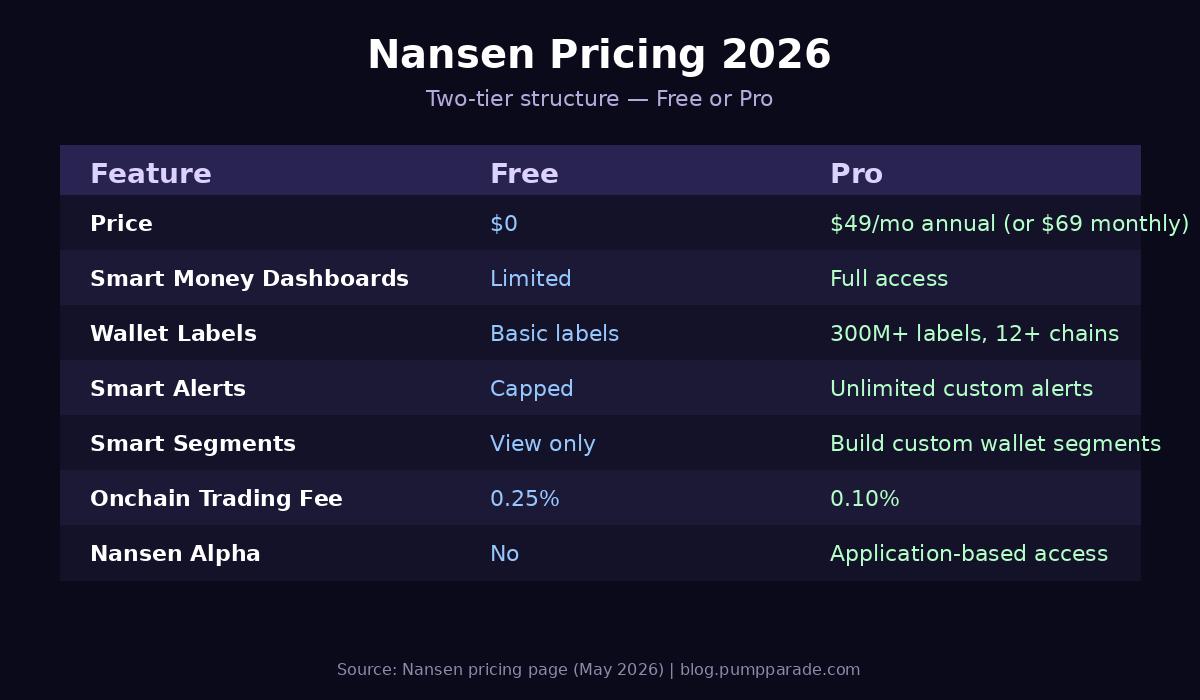
    Pricing: Free vs Pro

    Nansen Pricing 2026 comparison table: Free vs Pro plan features

    The new two-tier structure is refreshingly simple. Here is what you get at each level.

    Free Plan ($0)

    The Free plan gives you a real, usable slice of Nansen. You can browse token pages, view limited Smart Money dashboards, get a capped number of alerts, and trade onchain at 0.25 percent. It is enough to evaluate the product and to do light, casual research, but the rate limits and reduced label depth will frustrate you fast if you are trading every day.

    Pro Plan ($49/month annual, $69/month monthly)

    Pro is where Nansen earns its reputation. You get full Smart Money dashboards, unlimited Smart Alerts, the Smart Segments builder, deeper label access, faster data refreshes, and the reduced 0.10 percent onchain trading fee. For comparison, the old Pioneer plan that delivered a similar feature set cost $129 a month, so existing power users are effectively paying 62 percent less for more product.

    Nansen Alpha

    Nansen Alpha is a separate, application-based community for institutional users, funds, and high-volume traders. It is invite gated and not a self-serve tier, so most readers can ignore it unless your trading desk is going to apply directly.

    How Nansen Compares to Arkham, Birdeye, and DexScreener

    Nansen is not the only onchain tool worth using, and the right answer for many traders is a stack of two or three products. Here is how it fits next to the most common alternatives.

    Nansen vs Arkham Intelligence. Arkham is the closest direct competitor and has a generous free tier. Arkham is stronger on entity attribution and graph-style fund tracing, and its token economics let it stay free for retail. Nansen still has the deeper label database, the stronger NFT analytics, and (in our testing) a noticeably cleaner Smart Money product. Serious researchers often pay for Nansen and keep an Arkham tab open for graph queries.

    Nansen vs Birdeye and DexScreener. Birdeye and DexScreener are price and chart focused, optimized for “find a token, watch its candles, click trade.” Nansen is wallet focused, optimized for “find a wallet, follow what it does next.” They are complementary tools. If you only need price discovery and live charts, save your $49. If you want to understand who is on the other side of those candles, Nansen is the upgrade.

    Nansen vs DeFi-native dashboards (Dune, DeFiLlama). Dune is a SQL playground and DeFiLlama is a free TVL and fee aggregator, and both are excellent for what they do. They do not, however, give you a labeled wallet feed in real time. Nansen sits one layer above them: it bakes the queries into product.

    Security and Trust

    Nansen does not custody user funds, which is the single biggest piece of good news from a security perspective. The platform is a read-mostly analytics product, and the new onchain trading routes through audited DEX aggregators (Jupiter, OKX, LI.FI) rather than running custom liquidity. When you trade through Nansen, you sign transactions in your own wallet, the same as you would on Jupiter directly.

    The company itself has a strong reputational moat. It is venture backed by Andreessen Horowitz and Tiger Global, the founding team is public and active, and CEO Alex Svanevik has written publicly about a “trust ladder” approach to agentic trading that emphasizes incremental human approval. None of that is a substitute for using a hardware wallet (see our Ledger vs Trezor guide if you have not yet), but the platform itself is one of the more trustworthy operators in crypto data.

    User Experience

    Nansen 2 is the most polished iteration of the product to date. The information density is still high, and a first-time user will feel mildly overwhelmed staring at a Smart Money dashboard with twelve nested filters. But the navigation has been simplified, page loads are faster, and the new tabbed layout for token and wallet profiles is a meaningful step up from the older interface.

    Mobile support is reasonable on the web app, and the Signal feed in particular is well suited to checking on your phone between meetings. Search has improved, and the global command palette finally feels usable. For absolute beginners, the learning curve is the main complaint that comes up in user reviews, and it remains a fair one. Plan to spend an hour with the Nansen Academy materials before you make any judgments.

    Pros and Cons

    Pros

    • Largest, deepest wallet label database in the industry (300M+ addresses, 12+ chains).
    • Smart Money dashboards remain the gold standard for following profitable wallets.
    • New $49 Pro plan is a massive price cut from the old $129 Pioneer tier.
    • Smart Segments finally lets you build your own custom wallet feeds.
    • Native onchain trading at 0.10 percent for Pro is competitive with dedicated trading interfaces.
    • Strong NFT analytics, an area where most competitors are thin.
    • Backed by tier 1 investors and a public, technically credible team.

    Cons

    • Free tier is genuinely useful for sampling but quickly hits caps for daily use.
    • Interface still has a learning curve, especially for users new to onchain data.
    • Arkham covers some basic wallet tracking workflows for free.
    • Some advanced features (Nansen Alpha) are gated behind an application process.
    • If you only trade on a centralized exchange, you will not get your $49 of value.

    Who Should Subscribe to Nansen Pro?

    The honest answer is that the new Pro pricing makes the decision easy. If you trade onchain more than a few times a month, follow Smart Money wallets, run any kind of token research workflow, or are an NFT trader trying to read flows around a launch, $49 per month is a no-brainer at the current label coverage. The Pro fee is recouped in a single avoided bad entry.

    If you are a casual investor who buys ETH and SOL on Coinbase once a quarter, the Free tier is genuinely all you need and you should not feel any pressure to upgrade.

    Frequently Asked Questions

    Is Nansen free to use?
    Yes. Nansen offers a Free plan that includes limited Smart Money dashboards, capped alerts, and onchain trading at a 0.25 percent fee. The Pro plan unlocks the full product for $49 per month on an annual subscription or $69 per month on monthly billing.

    What chains does Nansen support in 2026?
    Nansen supports analytics on Ethereum, Solana, Base, BNB Chain, Polygon, Arbitrum, Optimism, Avalanche, Linea, Blast, Scroll, and Hyperliquid, with the deepest feature coverage on Ethereum, Solana, and Base. Onchain trading is live on Solana and Base.

    Is Nansen safe to use?
    Nansen does not custody user funds. It is a read-focused analytics product, and onchain trading routes through audited DEX aggregators where you sign transactions in your own wallet. The company is venture backed by Andreessen Horowitz, Tiger Global, and others.

    How accurate are Nansen’s Smart Money labels?
    Every label in Nansen’s database is backed by compiled evidence under the team’s internal quality assurance process. Labels are derived from rule based criteria like historical PnL, holding patterns, and onchain behavior, not arbitrary curation. Errors do happen, but the false-positive rate is meaningfully lower than competing wallet trackers.

    Is Nansen better than Arkham Intelligence?
    For Smart Money tracking, NFT analytics, and labeled wallet feeds, Nansen Pro is the stronger product. For entity attribution and graph-style fund tracing on a free tier, Arkham is excellent. Many serious researchers use both.

    Final Verdict

    Nansen in 2026 is a fundamentally different proposition than it was even twelve months ago. The new $49 Pro tier removes the single biggest objection to the platform, the Nansen 2 redesign genuinely improved the daily experience, and features like Smart Segments and native onchain trading turn the product into a research and execution stack rather than a passive dashboard.

    If you are serious about onchain trading, this is the analytics tool to beat in 2026. Use the Free plan for a week, decide whether the Smart Money dashboards change how you allocate, and upgrade to Pro if they do. Try Nansen here and decide for yourself.

    Disclosure: This is an independent product review. PumpParade does not have a paid relationship with Nansen at the time of publication. Always do your own research before paying for any subscription, and never trade with money you cannot afford to lose.

    Bitcoin (BTC) Price Prediction 2026: Reserve Catalyst

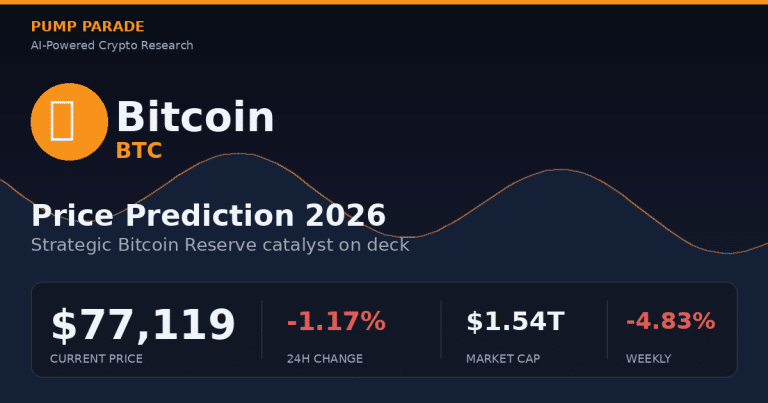
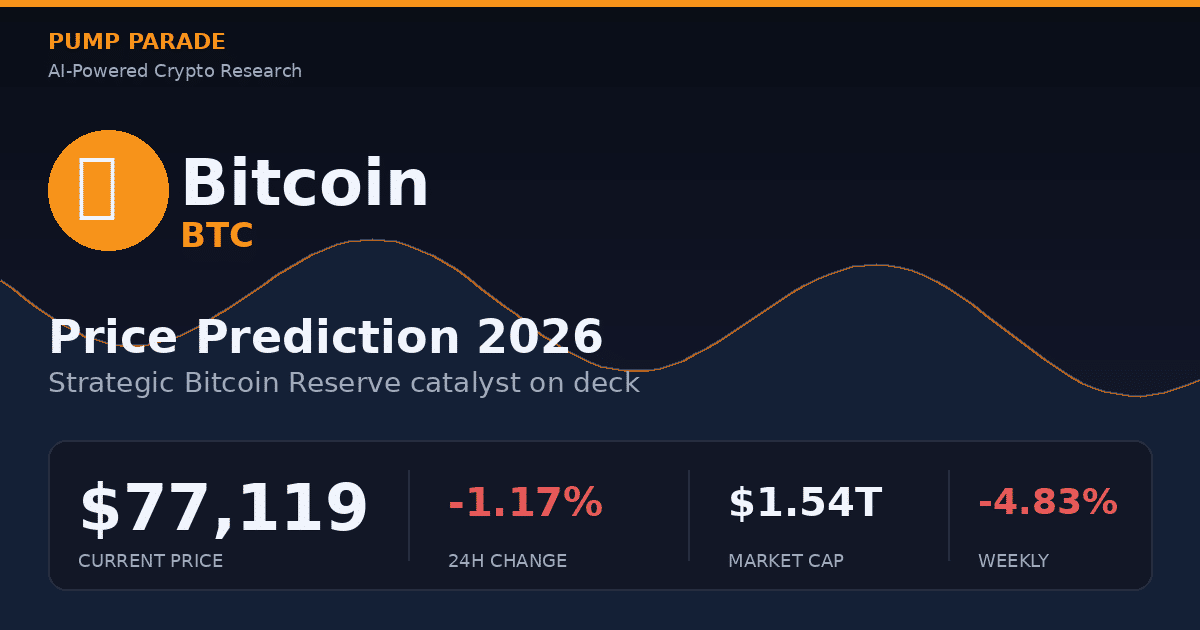
    Bitcoin just had its worst week since February. BTC is trading at $77,119, down roughly 4.83% on the week and 1.17% in the past 24 hours. The total market cap sits near $1.54 trillion. Iran-related geopolitical pressure on May 18 forced about $657 million in liquidations and snapped support in a single session.

    And yet the bigger story is what is coming next. White House digital assets director Patrick Witt told the Consensus Miami audience that a major update on the Strategic Bitcoin Reserve is due “in the next few weeks.” That clock started ticking on May 6. We are now squarely inside the window where an announcement could land. So the question is simple. Does this dip get bought, or does Bitcoin trade lower from here? Let’s look at the data.

    Bitcoin BTC price prediction 2026 with current price $77,119 hero graphic

    Bitcoin in May 2026: where the price actually sits

    Before we get to predictions, let’s set the scene with real numbers. Bitcoin opened the week near $81,070. It then sold off every single session from Monday through Saturday. The Fear and Greed Index has dropped to 28, firmly in fear territory.

    Here’s the technical snapshot as of May 19:

    • Price: $77,119
    • 14-day RSI: 35.2 (approaching oversold)
    • MACD: -335.97 (bearish, no reversal yet)
    • 200-day moving average: $80,517 (price is below)
    • Key supports: $76,500, $75,537 (Strategy average cost), $74,900, $73,500
    • Key resistance: $80,000, $81,000, $82,228 (200-day MA)

    Translation: BTC is bruised but not broken. The price is sitting on a thick support cluster between $73K and $76K. The 200-day moving average has flipped from a floor into a ceiling. That is the level bulls need to reclaim. Until they do, the trend on the daily is down.

    The catalysts that actually matter

    1. The Strategic Bitcoin Reserve announcement

    This is the headline catalyst. The US government already holds roughly 328,372 BTC, worth about $25 billion, mostly from criminal forfeitures. That makes the Treasury the largest known sovereign Bitcoin holder, sitting on close to 1.56% of total supply.

    Patrick Witt has called the recent custody and legal compliance work a “breakthrough.” The framework is reportedly ready. According to CoinDesk’s reporting from Consensus Miami, the next update is imminent. If the announcement includes a real purchase plan, the supply shock is mechanical. If it is just a custody and “no sales” framework, the market reaction will be more muted.

    Behind the headline sits Senator Cynthia Lummis’ BITCOIN Act of 2025. That bill would direct the Treasury to buy 200,000 BTC per year for five years, then hold for at least 20 years. If it passes, the first official purchase is estimated for Q4 2026. The market is already pricing in some probability of that path.

    2. ETF flows are choppy but still net positive YTD

    April was the best month of the year for spot Bitcoin ETF inflows. The category pulled in about $2.44 billion, with BlackRock’s IBIT capturing roughly 70% of that flow. May started strong. Spot Bitcoin ETFs took in $630 million on May 1, then $1.1 billion across two early-month sessions.

    Then the music slowed. May 7 saw $268.5 million in net outflows, led by Fidelity’s FBTC and IBIT. ETF flows have been the most reliable directional signal for BTC all year. When they go positive, price follows. When they go negative, dips like this one show up.

    For a similar ETF-driven setup playing out in a different corner of the market, see our recent breakdown on Hyperliquid and its ETF catalyst. The mechanics are the same. Institutional rails change who gets to buy.

    3. Post-halving supply dynamics

    The April 2024 halving keeps doing its quiet work. New supply is roughly half of what it was. Miner sell pressure is structurally lower. When ETF buying returns at scale, those flows hit a thinner book than they did in 2023. That is the supply-side bull case in one sentence.

    4. Macro is the swing factor

    The bond market and geopolitics drove this week’s selloff. Rising yields and the Iran headlines pulled risk assets lower together. Crypto did not break in isolation. If yields cool and the geopolitical premium fades, BTC should re-rate higher quickly. If they do not, $73K becomes a real test.

    Bitcoin technical outlook

    The chart is in a corrective phase, not a breakdown. Here is what we are watching:

    • Bullish reversal trigger: Daily close back above the 200-day MA at $82,228, ideally with rising RSI and a MACD crossover.
    • Range scenario: Price chops between $73,500 and $82,000 while the market waits on the Reserve update. This is the base case for the next few weeks.
    • Bearish trigger: A daily close below $73,500 on heavy volume opens the door to $68,000 and the April low.

    RSI in the mid-30s is the kind of reading where short-term bounces tend to start. It is not a buy signal on its own. It is a flag that the easy downside has likely been priced in.

    Bitcoin price prediction 2026: by timeframe

    Bitcoin BTC price prediction 2026 targets table showing bear base and bull scenarios across three timeframes

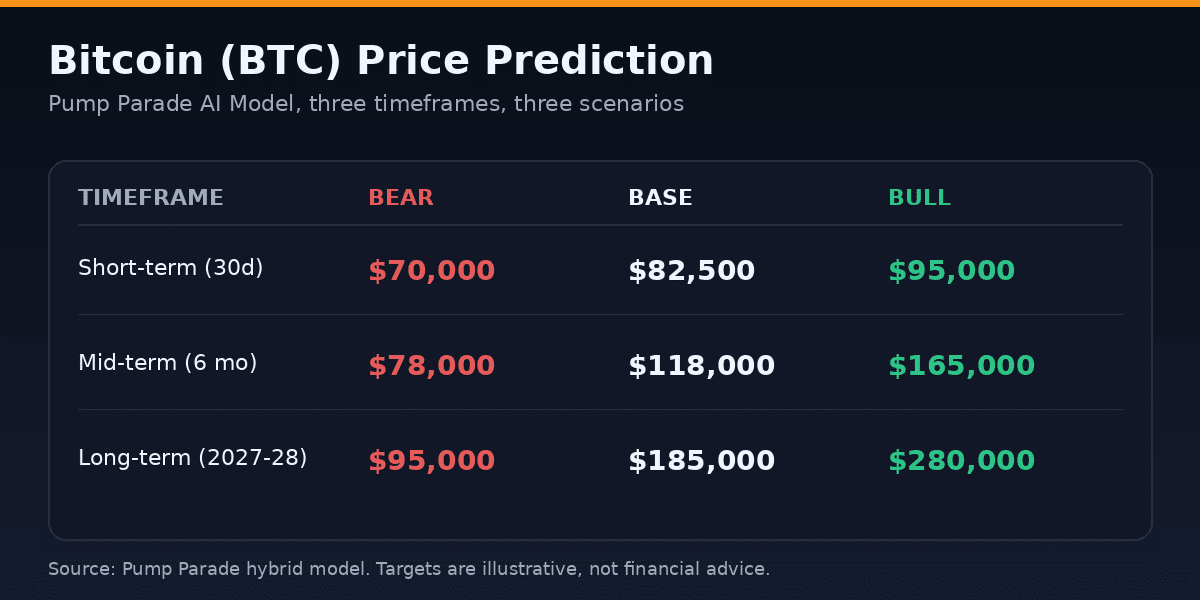
    Short-term (next 30 days)

    • Bear: $70,000. Macro stays heavy, Reserve announcement underwhelms, BTC tests the April lows.
    • Base: $82,500. BTC stabilizes, reclaims the 200-day MA, and the Reserve update lands roughly as expected.
    • Bull: $95,000. A strong Reserve announcement plus a return of net ETF inflows triggers a sharp short squeeze.

    The most likely path is the base case. RSI is stretched to the downside. The catalyst calendar is loaded. But Bitcoin can still hand out one more flush before the next leg.

    Mid-term (6 months, through November 2026)

    • Bear: $78,000. The cycle stalls, ETF flows go net negative, the Reserve framework gets delayed.
    • Base: $118,000. ETF accumulation resumes, the Reserve framework is signed into law, BTC tracks the standard post-halving timeline.
    • Bull: $165,000. Treasury begins active purchases ahead of schedule, macro rates fall, and the cycle accelerates.

    The base case aligns with Citigroup’s $112,000 view and is in the same neighborhood as several institutional models. The bull case requires the political and policy stars to align. It is not impossible, but it is not the modal outcome either.

    Long-term (2027-2028)

    • Bear: $95,000. The four-year cycle ends, BTC enters a multi-year sideways grind.
    • Base: $185,000. Standard cycle plays out with deeper ETF integration and slow sovereign buying.
    • Bull: $280,000. Fundstrat’s Tom Lee has called for $250K by year-end 2026. Stretched into 2027 with continued ETF inflows and active Treasury buying, $280K becomes the upper bound.

    You can read the full live BTC market data on CoinGecko if you want to cross-check our numbers against your own.

    The bear case nobody wants to talk about

    Every bull cycle has a graveyard of “this time is different” calls. Here is what could go wrong:

    • Reserve announcement is a dud. A custody framework with no buy plan is already partially priced in. A miss could trigger a 10% to 15% drop.
    • ETF outflows accelerate. If BlackRock’s IBIT starts seeing sustained daily outflows above $200 million, the mechanical bid for BTC weakens fast.
    • Macro tail risk. A real bond market dislocation or a deeper geopolitical event can take risk assets down together. BTC is not insulated.
    • Cycle exhaustion. Some analysts argue the four-year cycle is over and that this is the start of a longer consolidation. The data does not confirm that yet, but it is not impossible.

    The discipline is to hold both pictures in your head at the same time. The setup looks attractive. The risk is also real.

    What to watch this week

    • Daily ETF flow data, especially IBIT and FBTC
    • Any official statement from the President’s Council of Advisors for Digital Assets
    • Daily closes relative to $76,500 support and $80,000 resistance
    • RSI behavior: a bullish divergence on the 4-hour would be an early reversal signal
    • Bond yields and Iran-related headlines as the macro overlay

    The Pump Parade take

    This is a setup worth monitoring closely, not chasing. Bitcoin is oversold inside a still-intact uptrend, sitting on real support, with a known catalyst due inside the next few weeks. The probability favors a base case in the $80K to $120K range over the next six months. The path is unlikely to be smooth.

    If the Reserve announcement lands soft, BTC re-rates higher. If it lands hot, the move is faster. If it lands as nothing, the chart still has work to do. The job is to be positioned for the asymmetry, not to predict the headline.

    Disclaimer: This article is for informational and educational purposes only and should not be construed as financial, investment, or trading advice. Cryptocurrency markets are highly volatile, and past performance does not guarantee future results. The price predictions and analyses presented here are based on AI models, technical indicators, and available data at the time of writing, they are not guarantees. Always conduct your own research (DYOR) and consult with a qualified financial advisor before making any investment decisions. Pump Parade and its authors do not assume liability for financial losses incurred based on information provided in this article.

    Hyperliquid (HYPE) Price Prediction 2026: ETF Catalyst

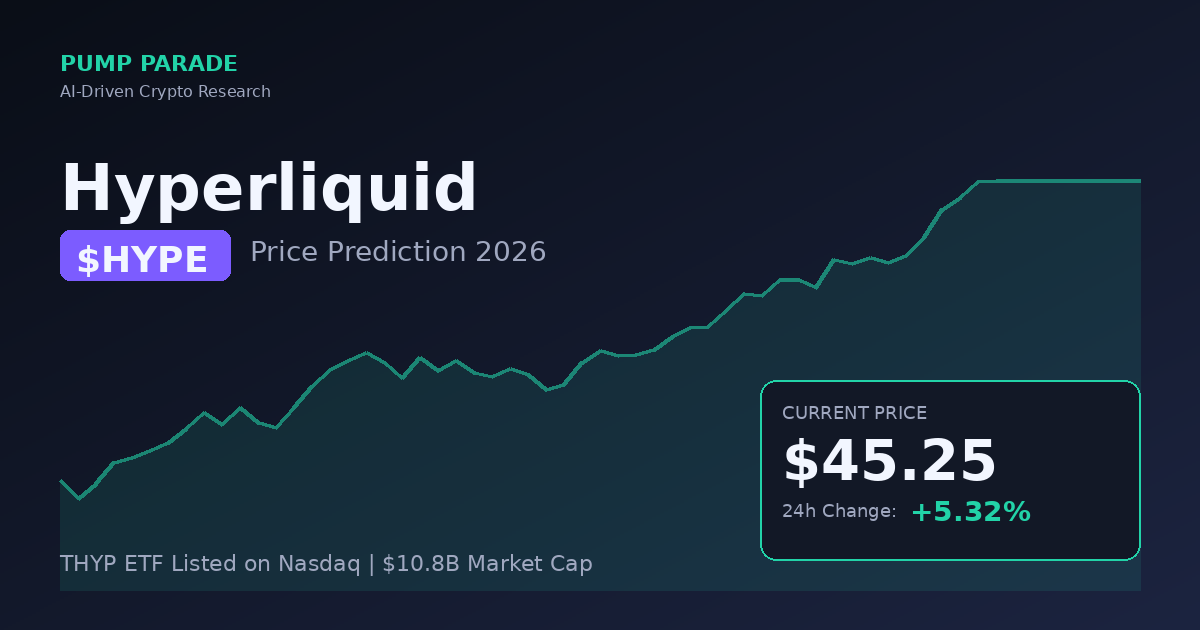
    Hyperliquid (HYPE) just got something almost no altcoin has: a spot ETF on a U.S. exchange. On May 12, 21Shares listed THYP on Nasdaq, the first U.S. spot ETF tracking the HYPE token. A 2x leveraged sibling, TXXH, launched the same day.

    The market reacted fast. HYPE is now trading near $45.25, up about 5.3% in 24 hours and 7.9% over the past week. That is a notable green print on a day when 88% of the crypto market is in the red and Bitcoin is bleeding back toward $76,900.

    So the question is no longer “is HYPE on Wall Street’s radar?” It clearly is. The question is whether the ETF is a real demand catalyst, or a sell-the-news event that capped the run from the September 2025 high of $59.30.

    Let’s break it down.

    Hyperliquid HYPE token price prediction 2026 hero chart with THYP ETF launch

    HYPE Current Price and Market Snapshot

    Here is where HYPE stands as of May 18, 2026:

    • Price: $45.25
    • 24h range: $42.69 to $46.94
    • Market cap: $10.8 billion
    • Fully diluted valuation: $43.6 billion
    • 24h trading volume: $700 million
    • Circulating supply: 238.4 million HYPE
    • Max supply: 1 billion HYPE
    • All-time high: $59.30 (September 18, 2025)
    • Market cap rank: #13

    HYPE started 2026 around $25. It pushed to roughly $33 in March, $40 in late April, and now sits about 24% below its all-time high. The September 2025 peak came during a broader memecoin and perp DEX narrative wave. The current move is being driven by something different: institutional access.

    The Catalyst: THYP and the First U.S. Hyperliquid ETF

    The 21Shares Hyperliquid ETF (ticker: THYP) is structured as a 33-Act spot exchange-traded product. It tracks the FTSE Hyperliquid Index. The fund can stake between 30% and 70% of its HYPE holdings through Figment, with the sponsor able to push that allocation as high as 100%.

    A few details worth flagging:

    • Management fee: 0.30%, the lowest of any Hyperliquid product at launch
    • Staking yield split: 70% to the trust, 30% to the provider
    • First staking distribution: scheduled for June 30, 2026
    • Day-one trading: roughly $1.8 million in volume and $1.2 million in net inflows

    The sibling product, TXXH, is a 2x leveraged HYPE ETF. That is unusual for an altcoin debut and signals that 21Shares expects active institutional and retail interest, not just passive allocation.

    In plain terms: U.S. brokerages, retirement accounts, and registered investment advisors can now get HYPE exposure without touching a wallet, a bridge, or the Hyperliquid app. That is a real distribution unlock. It is also, historically, the kind of structural demand shift that takes months to play out, not days.

    The same week, Coinbase deepened its relationship with Hyperliquid. Coinbase becomes the official USDC treasury deployer as the native USDH stablecoin is phased out, with Circle as the technical deployment partner. That is a quiet but meaningful endorsement from the largest U.S. exchange.

    Why Hyperliquid Has Wall Street’s Attention

    To understand why an ETF on this token even exists, you have to look at what Hyperliquid is doing on-chain. The numbers are not normal.

    • Daily trading volume: roughly $8 billion across perpetuals
    • Share of DEX perp open interest: more than 50%
    • Cumulative volume since launch: over $4 trillion
    • Monthly fees: roughly $56 million, with more than 95% funneled into HYPE buybacks
    • 2025 protocol fees: ~$844 million
    • Blockchain fee market share last week: about 43%, ahead of Ethereum and Solana combined

    Translation: Hyperliquid is a derivatives exchange that has captured more daily volume than most centralized exchanges and converts those fees into structural buy pressure on its own token. That is closer to a public-company buyback story than a typical altcoin tokenomics pitch.

    For competitive context, perp DEX rivals are tracking these numbers closely. If you want the trader’s view of the field, our Drift Protocol review covers how Solana-native perp venues compare on fees and execution.

    Key Factors That Will Drive HYPE in 2026

    1. ETF Inflows (or Outflows)

    Day-one THYP volume was modest at $1.8 million. The honest read: this is a brand-new product on a token most U.S. RIAs have never held. Watch the weekly inflow numbers. If THYP can compound to $50 to $100 million in AUM by year-end, that becomes a real, sticky demand floor. If inflows stall under $20 million, the ETF narrative deflates fast.

    2. Perp Volume and Fee Generation

    HYPE’s price is mathematically tied to fee revenue because most fees fund buybacks. If daily volume holds above $5 billion, monthly buybacks stay in the tens of millions. If volume craters to $2 billion or below in a broader market drawdown, the buyback flywheel weakens.

    3. Competitive Pressure

    Perpetual DEX competition is heating up. Drift, Jupiter Perps, dYdX, and a wave of new Solana-based and L2-based venues are all fighting for the same wallets. Hyperliquid’s lead is real, but 50% market share is also a target on its back.

    4. Token Unlocks

    HYPE has a max supply of 1 billion. Circulating supply is 238 million. The gap matters. While the buyback program offsets emissions, large team or community unlocks can still pressure price during weak market conditions. The fully diluted valuation of $43.6 billion is something every serious analyst is modeling.

    5. The Macro Backdrop

    Bitcoin is trading near $76,900, down on the week amid renewed U.S.-Iran tensions and softer risk appetite. Altcoins with elevated valuations historically underperform in this kind of macro chop. HYPE is more resilient than most because of buybacks, but it is not immune.

    Technical Outlook

    HYPE’s chart shows a clear pattern of higher lows since the December 2025 retracement. The token is consolidating in a range between roughly $40 and $50, with the all-time high at $59.30 as overhead resistance.

    Key technical levels to watch:

    • Major support: $40 to $42 (consolidation floor and 50-day moving average zone)
    • Secondary support: $33 (March 2026 swing low)
    • Immediate resistance: $47 (recent local high)
    • Major resistance: $59 to $60 (all-time high)
    • Breakout target: $75 to $80 on a clean push above the ATH

    RSI on the daily chart is hovering near neutral. That is constructive. A token can rally for months from a neutral RSI before it gets technically overbought. The setup suggests momentum is building, not exhausted.

    HYPE Price Predictions by Timeframe

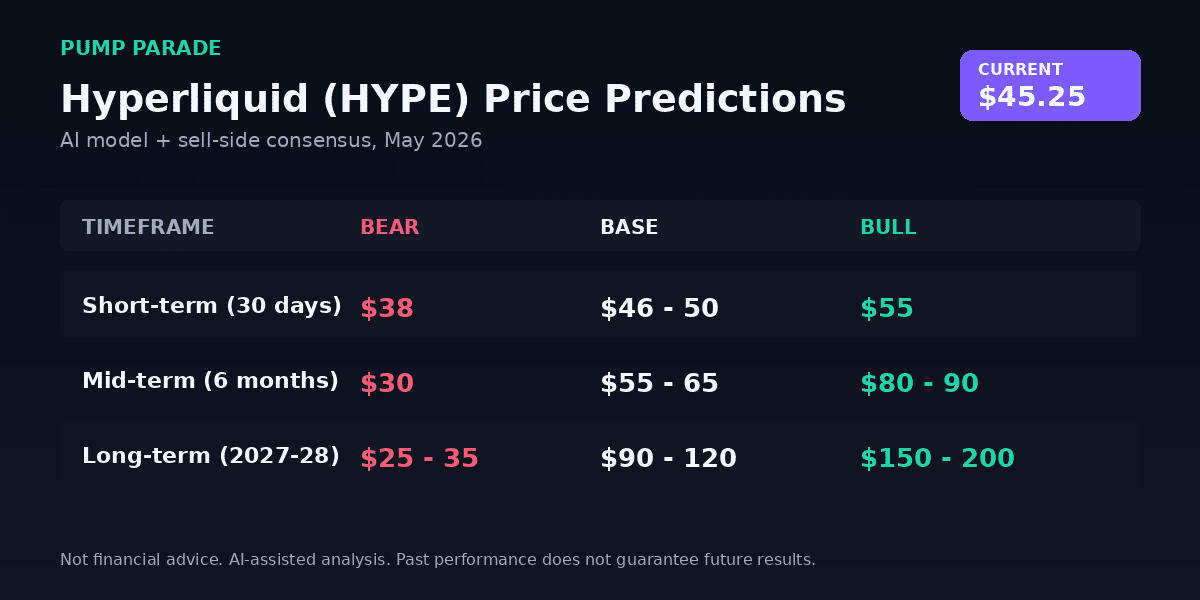
    Hyperliquid HYPE price prediction targets short, mid, and long term scenarios

    These targets blend our AI model output with sell-side projections from CoinMarketCap, CoinCodex, and Coinpedia, weighted by fee revenue trajectory, ETF inflow assumptions, and macro conditions.

    Short-Term (Next 30 Days)

    • Bear scenario: $38 (broader market sell-off, ETF inflows disappoint)
    • Base scenario: $46 to $50 (range continuation, steady buybacks)
    • Bull scenario: $55 (strong ETF inflows, BTC reclaims $82,000)

    Mid-Term (Next 6 Months)

    • Bear scenario: $30 (sustained crypto drawdown, perp volume drops 40%+)
    • Base scenario: $55 to $65 (ETF AUM grows, fee revenue stable)
    • Bull scenario: $80 to $90 (THYP becomes a top-3 altcoin ETF, BTC ATHs)

    Long-Term (2027 to 2028)

    • Bear scenario: $25 to $35 (competitive erosion, market share drops below 30%)
    • Base scenario: $90 to $120 (perp DEX volume keeps growing, buybacks compound)
    • Bull scenario: $150 to $200 (Hyperliquid becomes the dominant on-chain derivatives layer, broad altcoin bull cycle)

    The base case assumes Hyperliquid holds its current market position, the ETF gathers steady AUM, and crypto markets avoid a deep recession. Every scenario above the base case requires the buyback flywheel to keep turning, which is the entire investment thesis.

    The Bull Case

    The bull case for HYPE is mechanically simple. The protocol earns real fees. Most of those fees become buy orders for HYPE on the open market. Demand is growing. Supply growth is offset by buybacks. Now add U.S. ETF access through THYP, the leveraged TXXH product, deeper Coinbase ties, and a growing roster of professional listings like HashKey.

    If perp DEX volume globally keeps shifting from CeFi to on-chain venues, Hyperliquid is positioned to capture a disproportionate share. The token captures that flow directly.

    The Bear Case

    The bear case is equally clear. HYPE trades at a fully diluted valuation north of $40 billion. That is a premium valuation for any crypto asset, let alone a single-protocol token competing in a brutal vertical. A few real risks:

    • Competitive pressure: Solana, Sei, Monad, and Ethereum L2s are all building cheaper, faster perp infrastructure
    • Centralization concerns: Hyperliquid’s validator set and matching engine have raised eyebrows around true decentralization, and incidents like the 2025 JELLY event remain in trader memory
    • Regulatory tail risk: U.S. regulators are still working through how to treat on-chain perpetuals
    • ETF disappointment: If THYP fails to gather AUM, the catalyst evaporates and the narrative resets
    • Macro: A risk-off shock could compress all altcoin valuations 40 to 60% regardless of fundamentals

    The Verdict

    Hyperliquid is one of the most fundamentally interesting tokens in crypto right now. The fee numbers are not made up. The buyback flywheel is real. The ETF launch is a structural unlock, not a meme catalyst.

    That said, HYPE is not cheap. At a $43.6 billion FDV, a lot of growth is already priced in. The asymmetry from here is less obvious than it was at $25 in January.

    For traders, HYPE near $40 is a setup worth monitoring on pullbacks. For long-term allocators, the thesis depends on whether you believe on-chain derivatives capture a much larger share of global crypto trading volume over the next two to three years. If yes, the base case still favors higher prices.

    The smart move is to watch THYP inflows, daily perp volume, and the buyback dashboard. Those three data points will tell you whether the flywheel is accelerating or stalling, long before the price does.

    Disclaimer: This article is for informational and educational purposes only and should not be construed as financial, investment, or trading advice. Cryptocurrency markets are highly volatile, and past performance does not guarantee future results. The price predictions and analyses presented here are based on AI models, technical indicators, and available data at the time of writing, they are not guarantees. Always conduct your own research (DYOR) and consult with a qualified financial advisor before making any investment decisions. Pump Parade and its authors do not assume liability for financial losses incurred based on information provided in this article.
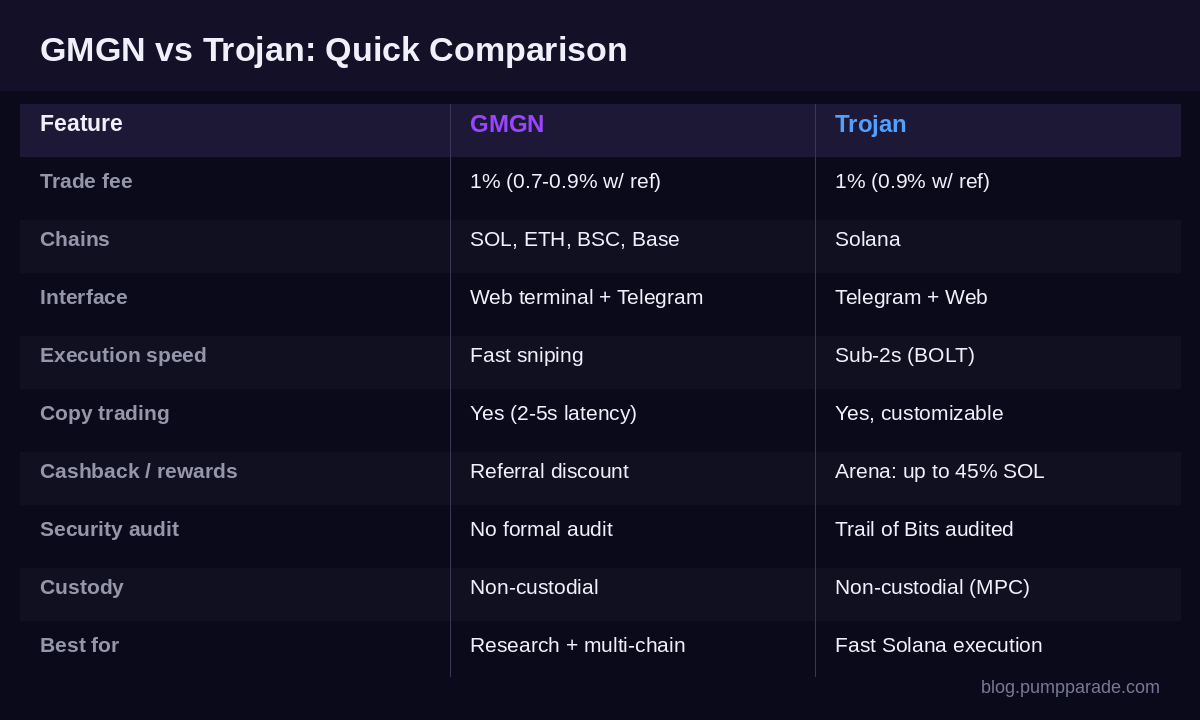
    Pump.fun (PUMP) Price Prediction 2026: After $370M Burn

    PUMP is trading at $0.00176 at time of writing. The Pump.fun token is up 2.5% in the last 24 hours but still sits roughly 79% below its September 2025 all-time high of $0.008777. Volume is humming. Holders just crossed 118,000. And on April 29, Pump.fun did something that most memecoin launchpads would never do: it set $370 million of its own token on fire.

    That single act, plus a fresh tokenomics rewrite that routes 50% of net revenue into automated buybacks, has resurrected the PUMP price prediction debate. Is this the deflationary turning point the token needed? Or is it a desperate move from a project whose flagship product, the Solana memecoin casino, has cooled since last year’s peak? Let’s break down the data, the catalysts, and where our model thinks PUMP is heading next.

    Pump.fun PUMP price prediction 2026 hero

    PUMP at a Glance

    Pump.fun is the Solana memecoin launchpad that defined the 2024 to 2025 retail trading cycle. Anyone can spin up a token in minutes. Buyers ride a bonding curve until liquidity migrates to PumpSwap, the project’s in-house DEX. The PUMP token launched in July 2025, ran to $0.0088 within two months, then spent most of the next year ranging between $0.0014 and $0.0025.

    Here are the numbers traders should anchor on:

    • Price: $0.00176
    • Market cap: ~$634 million (CoinGecko basis) / $1.52 billion (full on-chain circulating supply)
    • 24h volume: roughly $38 million across all venues
    • On-chain liquidity (Solana DEXs): $18.4 million
    • Holders: 118,756
    • 30-day price change: approximately flat
    • All-time high: $0.008777 (Sep 14, 2025)

    If you want to dig deeper into how the launchpad itself works (fees, bonding curves, PumpSwap migration), our full Pump.fun Review covers the platform mechanics that drive PUMP’s revenue model.

    The April 29 Catalyst That Changed the Math

    For nine months, Pump.fun ran a 100% revenue-to-buyback policy. Every dollar of fees became a market bid for PUMP. The price barely moved. On April 29, 2026, the team admitted the model was not working and pivoted hard.

    Three things happened in one announcement, first reported by The Block:

    1. A one-time burn of about $370 million in PUMP tokens. That destroyed every token the buyback fund had repurchased over nine months, removing roughly 36% of circulating supply in a single transaction.
    2. A new 50% revenue rule. Half of net revenue from the bonding curve, PumpSwap, and the Terminal product is now locked in an irreversible smart contract that buys and burns PUMP for the next year.
    3. The other 50% is freed up for product development, hiring, marketing, and potential acquisitions.

    In plain terms: the supply pressure just got cut by more than a third, the buyback is now hard-coded instead of discretionary, and the project finally has cash to actually grow. The market noticed. PUMP popped 7% on the news and 24-hour volume surged 138% to $161 million the day of the burn.

    Technical Picture: Where the Chart Is Right Now

    PUMP has been a range trader’s coin since November. The technical setup, based on the current chart at time of writing:

    • Strong support: $0.0014 to $0.0015, defended twice in March and once in April
    • Near-term resistance: $0.0021 to $0.0023, the post-burn reaction high
    • Major resistance: $0.0035 to $0.0040, the early 2026 swing high zone
    • Moving averages: Price sits above the 50-day, below the 200-day, a classic mid-cycle consolidation pattern
    • RSI (Relative Strength Index, a momentum gauge from 0 to 100): sitting near 52, neutral with a slight bullish lean

    Translation: PUMP is not overbought, not oversold, and not breaking out yet. The pattern of higher lows since the burn announcement is constructive, but the token needs to clear $0.0023 on volume to confirm a trend change. A break above that level opens the door to a retest of $0.0035. A break below $0.0014 would invalidate the bullish thesis and likely send PUMP toward $0.0010 or lower.

    The Bull Case

    The bull case for PUMP rests on three legs, and all three are stronger than they were two months ago.

    1. The deflationary flywheel is real. If Pump.fun does $200 million in net revenue over the next year (a reasonable estimate given current activity levels), that is roughly $100 million in automated buy pressure on a token with under $40 million in daily volume. The math compounds. Fewer tokens, sustained buying, slowly tightening float.

    2. Solana memecoin volume is still the dominant retail flow on-chain. Pump.fun captures the lion’s share of bonding curve launches, and PumpSwap routes meaningful volume that competitors like Raydium and Orca used to own. As long as memecoin culture has any pulse, Pump.fun has a revenue source.

    3. The product roadmap finally has funding. The 50% revenue allocated to operations means the team can ship features, hire engineers, and acquire complementary protocols. That is the difference between a one-trick launchpad and a multi-product DeFi business.

    If those three legs hold, our hybrid AI model assigns a 41% probability that PUMP reaches the $0.0040 to $0.0050 range by Q4 2026, which would be a 130% to 180% move from current levels. Best case, a full retest of the $0.0088 ATH is possible if a broader memecoin cycle returns, though our model puts that scenario at only a 12% probability over the next 12 months.

    The Bear Case

    The bear case is also concrete, and it should not be ignored.

    1. Memecoin demand is structurally lower than it was in 2024. Pump.fun is still the leader in its category, but the category itself has shrunk. Daily token launches are down. Average revenue per launch is down. The unit economics that drove the original PUMP thesis are weaker.

    2. The buyback is still bounded by revenue. 50% of net revenue is meaningful, but it is not infinite. If memecoin activity continues to soften, the buyback shrinks alongside it. There is no Federal Reserve here. The only bid that matters is the one Pump.fun’s product generates.

    3. Competition is intensifying. Letsbonk, Believe, and several stealth launchpads are eating into Pump.fun’s share of new launches. If a credible competitor takes meaningful market share, PUMP revenue, and therefore the buyback, gets squeezed.

    The bear case price target sits at $0.0008 to $0.0010, which would represent a 43% to 55% drawdown from here. The trigger would be a clean break of the $0.0014 support combined with declining Pump.fun daily revenue.

    Price Predictions: Short, Medium, and Long-Term

    PUMP price prediction targets short medium long-term

    Our AI model blends technical indicators, on-chain flow, revenue projections, and comparable token analysis. Here is the breakdown by timeframe.

    Short-Term (Next 30 Days)

    • Bear target: $0.0013
    • Base target: $0.0019
    • Bull target: $0.0026

    Model confidence: 58%. The next month is about whether PUMP can close above $0.0021 on weekly volume. If it does, momentum builds. If not, expect more chop in the current range.

    Medium-Term (6 Months)

    • Bear target: $0.0010
    • Base target: $0.0028
    • Bull target: $0.0048

    Model confidence: 49%. By Q4 2026, the cumulative impact of the buyback program should be measurable. If Pump.fun revenue holds or grows, the base case targets a 60% gain. The bull case requires both sustained buybacks and a broader memecoin tailwind.

    Long-Term (2027 to 2028)

    • Bear target: $0.0008
    • Base target: $0.0055
    • Bull target: $0.0120

    Model confidence: 38%. Long-term outcomes hinge on two questions. Does Pump.fun successfully expand beyond pure launchpad revenue? And does Solana retail trading volume return to 2024 levels or higher? A yes to both opens a path back above the all-time high. A no to either caps PUMP in a much narrower range.

    What to Watch

    If you are monitoring PUMP, these are the data points that actually matter:

    • Weekly Pump.fun revenue. Posted on-chain and tracked by sources like CoinGecko and DefiLlama. This is the single best leading indicator for the buyback bid.
    • Daily token launches on the platform. Trending higher means user engagement is recovering. Trending lower means the bear case is playing out.
    • PumpSwap volume share. A rising share against Raydium and Orca confirms Pump.fun is keeping users in its ecosystem.
    • PUMP burn transactions. Every burn is verifiable on-chain. Watching the cumulative supply destruction is one of the cleanest signals available.
    • Price reclaim of $0.0023. A clean breakout above this level on volume would be the technical green light.

    The Honest Take

    Here is the thing: PUMP is one of the few tokens in this cycle with a real, observable cash flow story. The April 29 changes turned it from a hopeful buyback experiment into a hard-coded deflationary mechanism. That is bullish on the margin.

    But “bullish on the margin” is not the same as “buy with both hands.” PUMP is still a memecoin-adjacent infrastructure play, with revenue tied directly to retail speculation cycles that are difficult to forecast. The base case is a steady grind higher into 2027. The bull case requires the cycle to turn. The bear case requires nothing more than the status quo continuing to drift downward.

    The smart move is to treat PUMP like what it is: a leveraged bet on Solana memecoin activity, with a mathematically attractive supply curve, sized appropriately for the volatility it brings. Watch the revenue. Watch the chart. And do not confuse a good thesis with a guaranteed outcome.

    Disclaimer: This article is for informational and educational purposes only and should not be construed as financial, investment, or trading advice. Cryptocurrency markets are highly volatile, and past performance does not guarantee future results. The price predictions and analyses presented here are based on AI models, technical indicators, and available data at the time of writing, they are not guarantees. Always conduct your own research (DYOR) and consult with a qualified financial advisor before making any investment decisions. Pump Parade and its authors do not assume liability for financial losses incurred based on information provided in this article.
    Injective (INJ) Price Prediction 2026: USDC Catalyst

    Injective (INJ) is trading at $4.59 at time of writing, down 10.4% in the past 24 hours but still up 37% over the past 30 days. The Layer-1 chain built for finance just landed one of the most consequential integrations of its history. On May 7, Circle launched native USDC and the Cross-Chain Transfer Protocol (CCTP) on Injective. The token spent the next seven days ripping 33% before today’s broad market pullback knocked it back to the mid-$4 range.

    This is exactly the kind of setup where price predictions stop being useful and the underlying mechanics start mattering. INJ is fully circulating. Its burn engine just ate roughly 7% of supply in a single auction. A new wave of institutional liquidity is being plumbed through Circle’s rails. The question now is simple. Can all of that push price back toward double digits? Or does INJ remain a momentum trade that fades into the next risk-off week?

    Let’s break down both paths.

    Injective INJ price prediction 2026 dashboard showing price, market cap, and recent change

    Injective at a Glance

    Injective is a Layer-1 blockchain in the Cosmos ecosystem, designed specifically for on-chain finance. Think of it like Solana for DeFi: high throughput, low fees, and a native module stack tuned for derivatives, decentralized perpetuals, and real-world assets. The big difference is that Injective lives inside the IBC universe. That means it can route liquidity to and from Cosmos chains, Ethereum, and now, via CCTP, to every major USDC chain Circle supports.

    The key numbers, based on current market data from CoinGecko:

    • Price: $4.59
    • Market cap: $459 million (rank 111)
    • 24h volume: $93.7 million
    • Circulating supply: 100 million INJ (fully circulating)
    • All-time high: $52.62 (March 2024), currently down 91% from ATH
    • 30-day change: +37%
    • 1-year change: -63%

    That fully diluted supply matters more than people realize. Unlike most Layer-1s with multi-year unlock cliffs hanging over them, INJ has no surprise dilution coming. Every token already trades.

    The Catalyst: Native USDC and CCTP Are Now Live

    For years, USDC on Injective meant wrapped USDC bridged from Ethereum. That worked, but it added friction, fragmented liquidity, and gave traders a reason to keep capital parked on bigger chains. On May 7, 2026, Circle confirmed that native USDC and CCTP are now live on Injective mainnet.

    In plain terms: traders can now move USDC onto Injective in one step, without wrapped tokens or extra bridge hops. CCTP burns USDC on the source chain and mints it on Injective, which keeps liquidity deep and removes a chunk of bridging risk.

    Why this matters for price:

    • Native stablecoin rails are table stakes for institutional flow. dYdX has already signed up to be the first major protocol to migrate stablecoin infrastructure to Injective.
    • Deeper USDC liquidity makes perps and on-chain RWAs more usable, which lifts dApp fees.
    • Injective’s tokenomics route a chunk of those fees straight into the weekly burn auction.

    The market reaction was immediate. INJ climbed 33% in the week after the launch and trading volume spiked above $140 million on May 8.

    Technical Picture: Strong Momentum, Now Cooling

    The 30-day chart tells a clear story. INJ broke out from a tight base around $3.30 in late April. It ran into the $5.20 zone on May 12. Today it is retesting the $4.50 area after a 10% red day.

    Key levels to watch:

    • Support: $4.25 (post-USDC launch base), then $3.80 (50-day moving average), then $3.30 (April breakout base)
    • Resistance: $5.20 (recent local high), then $6.50 (mid-2025 swing high), then $8.00 (early 2025 support flip)

    The RSI (Relative Strength Index, a momentum indicator that runs from 0 to 100) had pushed into overbought territory above 75 during the rally. Today’s pullback is cooling that reading toward the 50s. That is not a bearish signal on its own. It is what a healthy continuation looks like, assuming buyers show up at support.

    The bigger picture: INJ is still 91% below its March 2024 high. Even a return to the $10 level would only retrace roughly 19% of that drawdown. The chart has room to run if fundamentals keep cooperating.

    The Bull Case for INJ

    The bull thesis rests on three legs.

    1. The burn engine is accelerating. Injective’s tokenomics route up to 100% of dApp fees into a weekly burn auction, where INJ is bought back from the market and destroyed. The protocol kicked off 2026 with a single auction that burned 6.78 million INJ, roughly 7% of total supply. A May 6 community buyback filled in 10 minutes and burned another $196,000 worth of INJ. With 100 million tokens in circulation and no new supply coming online, every burn cycle is a direct supply shock.

    2. Stablecoin infrastructure pulls institutional flow. Native USDC plus CCTP is not flashy, but it is exactly the kind of plumbing that hedge funds and market makers care about. dYdX is migrating. More are reportedly in talks. If Injective becomes the default Cosmos-side venue for stablecoin-denominated perps and RWAs, dApp fees rise and the burn engine runs hotter.

    3. The chart has asymmetric upside. Down 91% from ATH means most of the speculative excess is already gone. The token is fully circulating. A return to the $15 to $20 zone would not require new investors to believe in a fairy tale, just that the catalysts already on the table keep playing out.

    The Bear Case for INJ

    Now the other side of the trade. Three risks deserve real attention.

    1. The 1-year chart is still ugly. INJ is down 63% over the past 12 months. The 30-day rally is impressive, but it has to overcome a long-running downtrend before it qualifies as a regime change. If the broader market enters a deeper pullback, INJ is a high-beta name that tends to drop harder than majors.

    2. Catalyst-fade risk. Native USDC launches are now common across chains. Stripe is moving stablecoins. Aptos, Sui, and others have similar integrations. The narrative window where “Injective got USDC” is news on its own may already be closing. Without follow-on protocol launches and visible TVL growth, the rally cools.

    3. Competition for on-chain perps and RWAs is fierce. Hyperliquid dominates perps mindshare. Solana eats DeFi volume. Ethereum L2s anchor most RWA issuance. Injective has a defensible niche, but it needs to keep winning new builders to justify a higher market cap.

    The level that would invalidate the bull case: a decisive break below $3.30 on rising volume. That would signal the post-USDC rally has fully unwound and the previous downtrend is reasserting.

    INJ price prediction targets table for short, mid, and long term across bear, base, and bull cases

    INJ Price Predictions by Timeframe

    Based on our hybrid AI model and the catalysts above, here are price targets across three horizons. These are scenarios, not guarantees.

    Short-term (next 30 days):

    • Bear case: $3.50 (broader market drawdown, support fails)
    • Base case: $5.20 (consolidation in current range, retests local high)
    • Bull case: $6.50 (momentum continues, new dApp launches confirmed)

    Mid-term (next 6 months):

    • Bear case: $4.00 (catalyst fades, no follow-on news)
    • Base case: $8.00 (steady burn pace, dYdX migration goes live, modest TVL growth)
    • Bull case: $12.00 (major RWA launch on Injective, top-50 ranking returns)

    Long-term (2027 to 2028):

    • Bear case: $5.00 (sector compresses, Injective stays a niche L1)
    • Base case: $18.00 (Injective becomes a top stablecoin and perps venue)
    • Bull case: $35.00 (broad institutional adoption of on-chain finance, INJ revisits 60% of ATH)

    Confidence note: our model assigns the highest probability to the base case across all three horizons. The long-term targets carry the widest uncertainty band, because they depend on factors well outside Injective’s control: rate cycles, regulatory clarity for on-chain RWAs, and whether ETH or Solana absorbs most of the institutional demand instead.

    What to Watch From Here

    Three signals will tell you whether the bull thesis is still intact:

    1. USDC supply on Injective. If native USDC supply on Injective keeps climbing month over month, the catalyst is working. If it plateaus quickly, the story weakens.
    2. Weekly burn auction size. Bigger auctions mean more dApp fees. Track the auction value week by week. A trend of $200K+ auctions would be very bullish for supply mechanics.
    3. dYdX migration milestones. Watch for testnet, mainnet, and TVL announcements from dYdX on Injective. Each one is a fresh catalyst.

    For context on how other Layer-1s with fresh catalysts have traded in this market, see our recent breakdown of Avalanche (AVAX) Price Prediction 2026: CME Catalyst. The setup is different, but the playbook for trading L1 catalyst pumps and fades is similar.

    Bottom Line

    INJ at $4.59 sits at an interesting spot. The catalyst is real, the tokenomics are aggressive, and the chart has room to run. It is also down 91% from ATH for a reason, and the broader market is in a pullback that does not care which token has the best fundamentals.

    The smart move is not to chase the next green candle. It is to define your levels before you enter: where you are wrong (below $3.30), where the trade pays off (above $6.50 with conviction), and how much you are willing to risk on a momentum L1 in a choppy tape.

    Injective has earned its place back on the watchlist. Whether it deserves a slot in your portfolio is a different question, and that one only you can answer.

    Disclaimer: This article is for informational and educational purposes only and should not be construed as financial, investment, or trading advice. Cryptocurrency markets are highly volatile, and past performance does not guarantee future results. The price predictions and analyses presented here are based on AI models, technical indicators, and available data at the time of writing. They are not guarantees. Always conduct your own research (DYOR) and consult with a qualified financial advisor before making any investment decisions. Pump Parade and its authors do not assume liability for financial losses incurred based on information provided in this article.