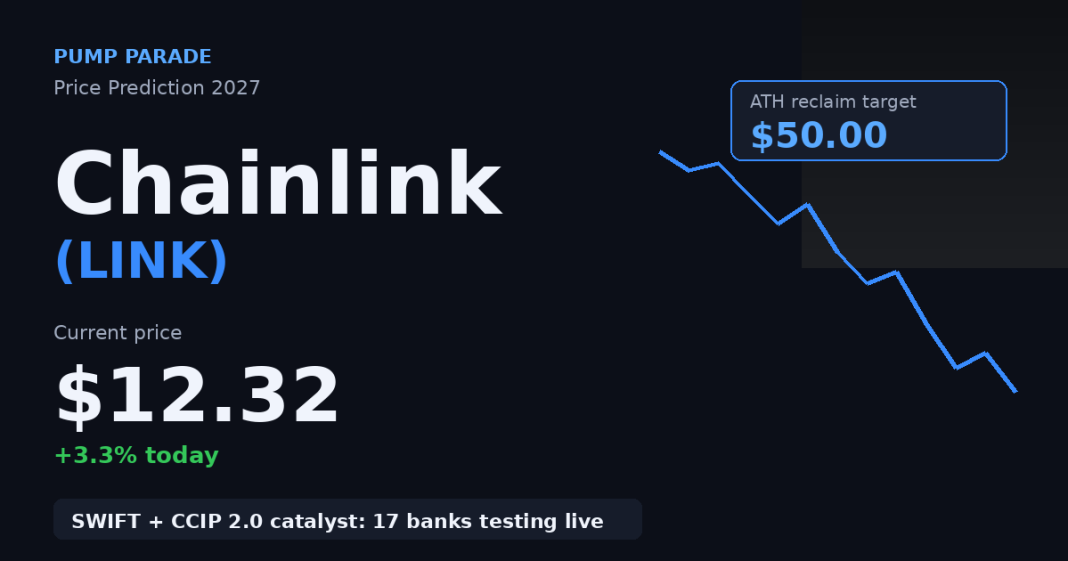
Chainlink (LINK) trades near $12.32, up 3.3% on the day and about 54% off its July low near $8. That is the backdrop for the Chainlink price prediction 2027 story: a token priced like a sleepy mid-cap while its network wires 17 of the world’s largest banks into blockchain settlement rails. Something has to give.
In late September 2026, Chainlink launched CCIP 2.0 and announced its software now connects major banks to SWIFT’s live blockchain ledger. HSBC, Citi, UBS, and Wells Fargo are among the names preparing live transactions. Standard Chartered has a $200 LINK target by 2030. Yet the token is still 76% below its 2021 peak of $52.70.
This piece lays out where LINK sits today, the specific catalysts stacking into 2027, the risks that could unwind the thesis, and three concrete price scenarios across 30 days, six months, and 12 to 24 months. We also compare LINK to Quant (QNT), its closest interoperability-and-tokenization rival, and walk through the exact levels that would change our view.
Key Takeaways
- LINK trades at $12.32 with a $9.4B market cap, ranked #16, and sits 76% below its 2021 ATH of $52.70.
- CCIP 2.0 launched September 28, 2026, adding sanctions screening, custom verification, and transaction-size controls. The SWIFT ledger integration brings 17 banks to live testing.
- Standard Chartered’s Geoff Kendrick initiated coverage in August 2026 with a $200 LINK target by end-2030, built on a 25x fee-growth assumption.
- Our base case for 2027 is $35 (around 180% upside). The bull scenario reclaims the $50 ATH. The bear case holds the $8 to $10 reaccumulation zone.
- The core risk: banks using Chainlink software do not share transaction fees with LINK holders. Token value depends on whether these services ultimately require LINK for payment or security.
- Watch the $15.44 breakout level and the $13.52 invalidation. A weekly close above $18 opens the path to the upper $20s.
Where Chainlink stands today
Before the forecast, here is the snapshot. These are the numbers that frame every scenario below.
| Metric | Value |
|---|---|
| Current price | $12.32 |
| 24h change | +3.32% |
| 7d change | -4.4% |
| 30d change | -4.78% |
| Market capitalization | $9.45 billion |
| 24h trading volume | $258 million |
| Market cap rank | #16 |
| All-time high | $52.70 (May 9, 2021) |
| Price vs ATH | -76.62% |
| Circulating supply | 766.85M LINK |
| Max supply | 1.00B LINK |
Translation: LINK is a top-20 asset trading at a quarter of its previous cycle peak, with a fully-vested supply picture that is clearer than most peers in the top 25. Market cap is modest for a project with Chainlink’s enterprise reach. Volume is healthy without being frothy. These are the conditions, historically, where accumulation ranges form.
Price action over 2026 has been a tug-of-war. LINK bottomed near $8 on July 4, rallied 80% into the September 28 CCIP 2.0 launch, peaked at $15.70 the next day, and gave back most of it. The current retrace to $12 is textbook: catalyst-driven move, profit taking, then a slow rebuild while the fundamentals keep marching. For context on how similar oracle-and-interoperability narratives have played out, our Quant (QNT) price prediction covers an adjacent setup in the enterprise-blockchain space.
Why is LINK range-bound right now?
The simple answer: the news arrived faster than the token design can capture it. The SWIFT announcement and CCIP 2.0 are landmark events for the broader crypto rails story, but the mechanism that would translate bank activity into LINK demand is still being built.
Today, banks pay for Chainlink services in fiat, not in LINK. The token’s value accrual depends on three things: oracle fees paid in LINK (growing but modest), CCIP transaction fees (early), and staking v0.2 and future upgrades that lock supply and anchor security. The market knows this. It is waiting for the moment the fee pipeline from TradFi integrations becomes visible in on-chain data. Until then, LINK moves on narrative and macro.
That is not a bearish read. It is the honest one. The setup is coiled: unresolved institutional pipeline on one side, a 76% drawdown from ATH on the other. The resolution usually favors the side with the fundamental story. We will come back to the risk this takes for granted.
The bull case for LINK
CCIP 2.0 and the SWIFT integration
On September 28, 2026, Chainlink launched CCIP 2.0, which lets institutions add their own verification layers, screen transactions against sanctions lists, and set payment-size rules. The same day, Chainlink announced that its software connects banks to SWIFT’s blockchain ledger, which SWIFT opened for initial use in July. According to reporting from 24/7 Wall St., 17 banks including HSBC, Citi, UBS, and Wells Fargo are preparing live transactions. This is the first time a major oracle network has become a direct piece of plumbing between global banks and public blockchains.
Standard Chartered sees “owning the rails”
In August 2026, Standard Chartered’s global head of digital assets research, Geoff Kendrick, initiated coverage of LINK with a note titled “Owning the rails” and a $200 target by end-2030. Kendrick’s thesis: tokenized assets will grow from about $340 billion today to $4 trillion by end-2028, and Chainlink is the only end-to-end platform supporting the full lifecycle of tokenized assets across DeFi and TradFi. The forecast assumes Chainlink’s fee generation grows roughly 25x by 2030.
Infosys and the enterprise distribution engine
A separate Infosys partnership extends Chainlink’s reach across roughly 1.7 billion bank accounts via Infosys-serviced institutions. Enterprise adoption rarely moves token price in a straight line, but it changes the base rate. Each integration becomes a potential future fee stream. Compound that over four years and the Standard Chartered 25x fee multiplier starts to look conservative, not optimistic.
The bear case for LINK
Fee capture is unproven
The biggest risk is the one Kendrick himself names first: banks using Chainlink software do not currently share transaction fees with LINK holders. Oracle fees paid in LINK are a real revenue stream, but the TradFi integrations announced in September do not yet route economic value to the token. If this stays true through 2027, the “owning the rails” thesis becomes “owning the brand of the rails, not the toll.” That is a very different valuation.
Competition from specialist providers
Pyth Network has eaten into high-frequency price-feed demand. Band Protocol and API3 serve specific niches. In cross-chain, LayerZero and Wormhole compete directly with CCIP for messaging volume. Chainlink still holds roughly 70% oracle market share, but share is a trailing indicator. The bear case assumes a slow erosion as institutions pick best-of-breed rather than one-stop-shop. Our Aave (AAVE) price prediction covers one of the largest LINK oracle customers, a useful cross-check on DeFi demand.
Macro and token unlocks
LINK has about 233 million tokens left to enter circulation (a 30% supply overhang) released on a schedule that funds operations and ecosystem incentives. Historically, these unlocks have not crashed the price, but they do cap rallies when distribution outruns new demand. Overlay a risk-off macro turn and the “coiled” setup can decompress downward instead of upward.
What’s the Chainlink price prediction for 2027?
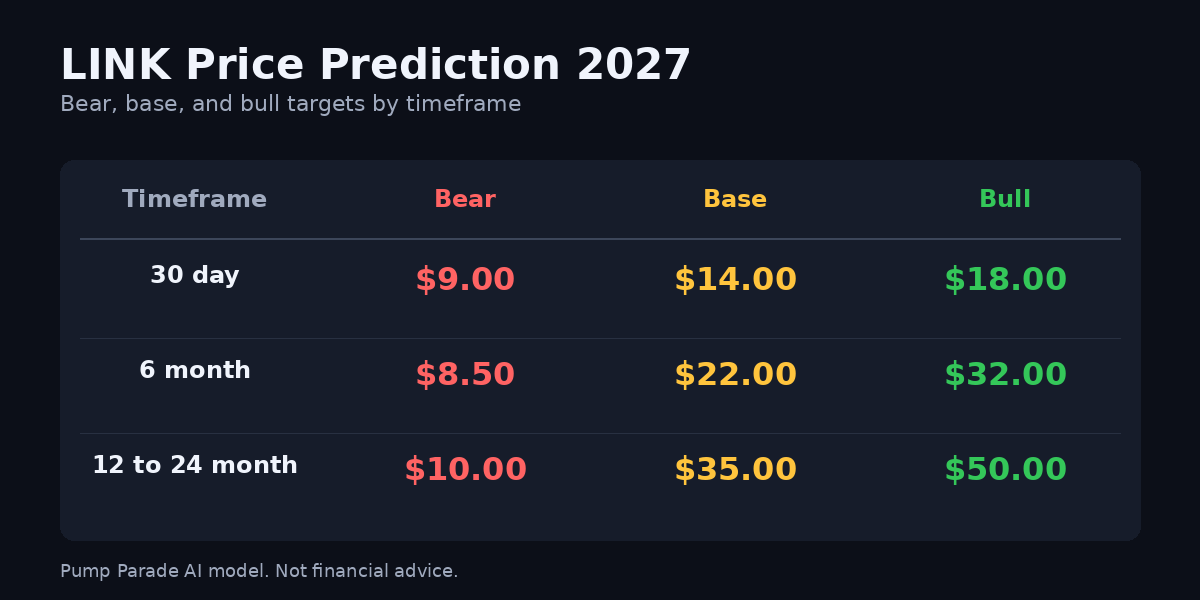
Our hybrid model combines technical levels, on-chain accumulation signals, Chainlink’s fee growth trajectory, and comparable analyst targets from Standard Chartered, Changelly, and VanEck’s digital assets group. Here is how it reads across three timeframes.
Short-term: 30 days (through November 2026)
LINK is pinned between the $11.80 to $12.50 accumulation zone and the $13.52 to $15.44 resistance band. A daily close above $15.44 opens the path to $18. A break below $11.50 risks a retest of the $9 to $10 reaccumulation zone from July. Our base case is a range-bound $12 to $14 drift as the market waits for live SWIFT transaction data.
- Bear case: $9.00
- Base case: $14.00
- Bull case: $18.00
Medium-term: 6 months (through April 2027)
By spring 2027, the SWIFT pilot results should be public. If live transaction volume is material and bank participation expands beyond the initial 17, the fee-capture question starts to resolve positively. In parallel, staking rewards and CCIP volume should produce the first real “Chainlink is a cash flow business” charts. A rotation into oracle-and-infrastructure plays would push LINK through $20 toward the upper $20s.
- Bear case: $8.50
- Base case: $22.00
- Bull case: $32.00
Long-term: 12 to 24 months (through late 2027 and early 2028)
This is where the ATH reclaim thesis lives. For LINK to hit $50 by late 2027, three things need to be true: SWIFT and DTCC-adjacent flows need to be live and scaling, LINK staking needs to lock a meaningful portion of float (think 20%+), and the broader crypto cycle needs to still be in expansion. Standard Chartered’s $200 by 2030 target implies roughly $45 to $55 at the two-year mark on a linear path, which lines up with the ATH level.
- Bear case: $10.00
- Base case: $35.00
- Bull case: $50.00
How does Chainlink compare to Quant (QNT)?
Quant (QNT) is the closest public-market analog to LINK: enterprise-first, interoperability-focused, with real TradFi touchpoints. Side by side:
| Metric | Chainlink (LINK) | Quant (QNT) |
|---|---|---|
| Price (Oct 21, 2026) | $12.32 | $197.47 |
| Market cap | $9.45B | $2.86B |
| Market cap rank | #16 | #40 |
| Core product | Oracles, CCIP, data streams | Overledger interoperability |
| Flagship TradFi partner | SWIFT, Infosys, 17 global banks | UK Oracle for CBDC pilots |
| Oracle market share | ~70% | N/A (not an oracle) |
| Staking live | Yes (v0.2, v0.3 roadmap) | No native staking |
| Max supply | 1.0B LINK | 14.6M QNT |
The scarcity story on QNT is tighter, but LINK has the broader distribution and the measurable network. Both can win if tokenization grows the way Standard Chartered projects. The honest comparison is that LINK is the index bet on blockchain middleware, while QNT is a more concentrated bet on cross-chain settlement.
What would change our view on LINK?
Three triggers would push us bull, neutral, or bear faster than the base path:
- Bull trigger: A weekly close above $18.00 on volume, combined with any public disclosure of live SWIFT transaction volume quoting LINK as the settlement rail. That accelerates the 2027 base case toward the bull target.
- Neutral-to-bear trigger: SWIFT pilots complete but the fee flow routes exclusively through fiat with no LINK-denominated payment or staking requirement. The thesis survives but the time horizon stretches to 2029 and beyond.
- Hard bear trigger: A weekly close below $8.00 breaks the two-year accumulation base. That would signal institutional demand did not show up on-chain and would reset the model toward the $5 to $7 range before the next cycle.
If you want context on how a competing high-conviction DeFi play has handled a similar catalyst-driven range, our Lido (LDO) price prediction walks through comparable mechanics.
Frequently asked questions
What is the Chainlink price prediction for 2027?
Our base case for LINK by late 2027 is $35, roughly 180% above today’s $12.32. The bull scenario reclaims the $52.70 all-time high. The bear case holds the $8 to $10 range if TradFi fee capture does not materialize. These are modeled targets, not guarantees.
Will LINK reach $50?
Reaching $50 would be an ATH reclaim and requires three things aligning: live SWIFT transaction volume quoting LINK, meaningful staking lockup reducing float, and a broader crypto cycle still in expansion. We give that path about a 25% probability over the next 24 months, with $35 as the more likely 2027 outcome.
Is Chainlink a good investment in 2027?
LINK offers one of the clearest asymmetric setups in the top 20: a token priced at a quarter of its last cycle peak while the underlying network wins the biggest institutional distribution deals in crypto. The main risk is that bank activity does not translate to token demand. That makes it a position-sized bet, not a conviction concentration.
What is driving the Chainlink price in 2026?
Three drivers: CCIP 2.0 launch (September 2026), the SWIFT ledger integration with 17 banks testing live transactions, and Standard Chartered’s August coverage initiation at a $200 target by 2030. Macro conditions and competition from Pyth, LayerZero, and Wormhole are the main counterweights.
Can Chainlink reach its all-time high again?
Reclaiming the $52.70 ATH requires LINK to roughly 4x from here. That is well within historical crypto bull-cycle ranges for top-20 tokens with real institutional traction. The timeline is the open question, not the magnitude. Our base case puts the reclaim window between late 2027 and 2028.
How does Chainlink make money?
Chainlink earns revenue from three streams: oracle fees paid in LINK for price feeds and data services, CCIP cross-chain messaging fees, and staking-related slashing and rewards economics. Enterprise integrations like SWIFT do not currently route fees directly to LINK holders, which is the central valuation debate.
The honest take
Here is where Pump Parade stops hedging. LINK is one of the only crypto assets where you can point to a verified TradFi distribution agreement with 17 globally systemic banks and still buy the token at a 76% drawdown. That combination does not usually sit still for long. The Ripple (XRP) price prediction covers an adjacent “payments rails” story that has moved faster on similar news, which gives you a reference for how fast institutional-adoption narratives can translate into price.
What the market is testing is whether network value and token value stay coupled. That is a legitimate question. The right posture for 2027 is a modest LINK allocation sized to survive the bear case, with the understanding that the bull case needs real on-chain fee data, not just press releases, to deliver. If live SWIFT volume shows up in CCIP-labeled transactions through 2027, the $35 base case probably underclubs it. If it does not, $14 to $18 is where this spends most of next year.
The data suggests the probability favors the first outcome, not the second. The chart is telling us the market has not priced it in yet.
Disclaimer: This article is for informational and educational purposes only and should not be construed as financial, investment, or trading advice. Cryptocurrency markets are highly volatile, and past performance does not guarantee future results. The price predictions and analyses presented here are based on AI models, technical indicators, and available data at the time of writing. They are not guarantees. Always conduct your own research (DYOR) and consult with a qualified financial advisor before making any investment decisions. Pump Parade and its authors do not assume liability for financial losses incurred based on information provided in this article.