
Short answer: in our paper test, not really. We took 23 stock buys that members of Congress disclosed this summer and “bought” each one on the day the public could first see the filing, not the day the member traded. Held for 30 days, those copies beat $SPY 10 times out of 23, with a median result of 0.31 points behind the market. The members’ own entries did slightly better, but not by enough to call it an edge.
That’s a small sample and a short window, so treat it as a field note, not a verdict. The more useful part is how the test was set up, because most “copy Congress” charts skip the step that matters.
The claim vs the lag
The pitch is simple. Lawmakers sit close to policy, so follow their trades and you get a slice of whatever they know. Plenty of trackers will show you a chart of a Congress portfolio climbing past the S&P 500.
The catch is timing. Under the STOCK Act, members file a Periodic Transaction Report no later than 30 days after they’re notified of a trade, and in no case later than 45 days after the trade itself. So the trade date and the day you can act are weeks apart. A backtest that buys on the trade date is buying something nobody outside the office could have bought.
We pulled the dates for every buy in our sample to see how big that gap really is.
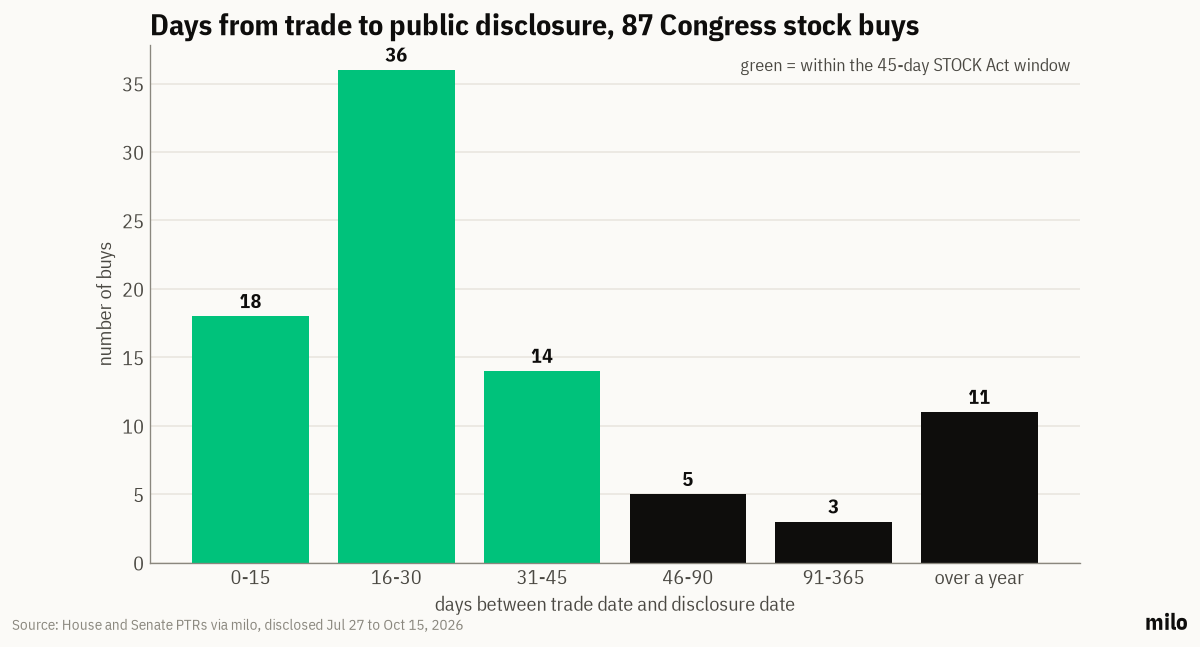
Across 87 disclosed buys by 19 members, the median wait was 28 days. 68 landed inside the 45-day window. 19 didn’t, and 11 showed up more than a year after the trade date. One of those was a hand-delivered paper report, stamped received on August 13, 2026, listing spouse purchases of $AAPL, $GOOGL, $MSFT and $META dated August 20, 2024. The form itself has a line saying a $200 penalty applies to late filers. Nobody copying that filing was getting the member’s entry price.
Our method
- Data: House and Senate Periodic Transaction Reports as ingested by milo, which pulls from the House Clerk and Senate eFD sites. We took every purchase disclosed between July 27 and October 15, 2026 for ten heavily traded stocks ($NVDA, $MSFT, $AAPL, $AMZN, $GOOGL, $META, $AVGO, $TSLA, $JPM, $AMD), plus every purchase disclosed market-wide from October 9 to 15. After removing duplicate rows (the same filing listed twice under two spellings of a name), that left 87 buys.
- Sales ignored. Only purchases, since that’s what people try to copy.
- On-time only for the return test. We used the 68 buys disclosed within 45 days, so late filings don’t distort the result.
- Two entries for each buy: the closing price on the trade date (what the member roughly got) and the closing price on the disclosure date (the first close a copier could realistically get). If either day wasn’t a trading day, we used the next one.
- Holding period: 30 calendar days from entry, measured against $SPY over the exact same dates. Prices are daily closes adjusted for dividends.
- What it leaves out: position size (filings only give ranges like $1,001 to $15,000), trading costs, and taxes. Every buy counts the same.
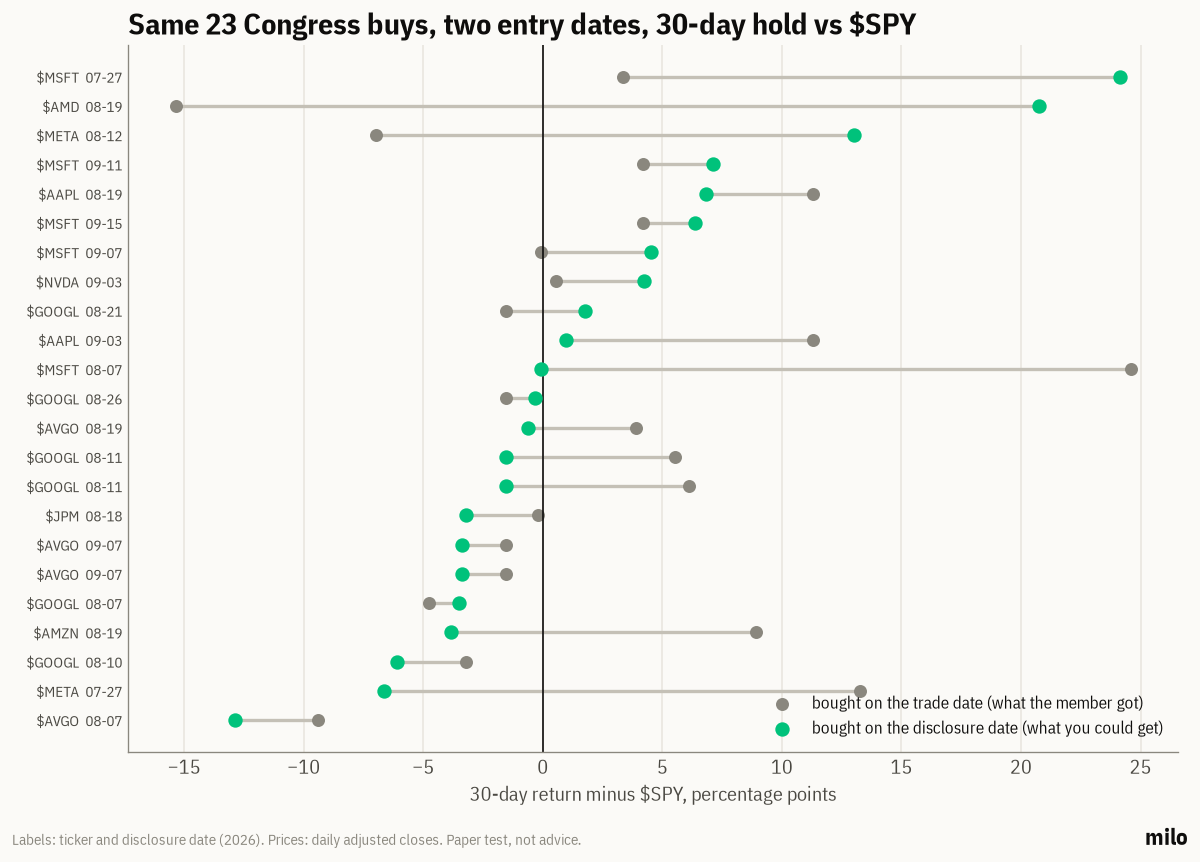
Only 23 of the 68 on-time buys had a full 30 days of prices after the disclosure date, so the return test runs on those 23. They cover 9 tickers and were disclosed between July 27 and September 15.
Results
| 30-day hold vs $SPY | Bought on trade date | Bought on disclosure date |
|---|---|---|
| Beat $SPY | 12 of 23 | 10 of 23 |
| Median, points vs $SPY | +0.56 | -0.31 |
| Average, points vs $SPY | +2.22 | +1.85 |
| Best / worst | +24.2 / -12.9 |
A few things stand out.
The members’ edge, if any, was small. Buying on the trade date beat $SPY 12 times out of 23. That’s a coin flip with a slight lean, during a stretch when $SPY itself rose about 5% (mid-June to mid-October).
Waiting for the filing made 13 of the 23 worse. The copy beat the member’s entry in the other 10, so the lag doesn’t always hurt. It mostly adds noise. Look at the $MSFT buy disclosed on August 7: the member’s 30 days ran 24.6 points ahead of $SPY, while the copier’s 30 days came in at roughly zero.
The average looks better than the typical trade. Both averages are positive because a few big winners pull them up. The disclosure-date copy of an $MSFT buy disclosed July 27 ran 24.2 points ahead of $SPY, and an $AMD copy ran 20.7 ahead. The median, which is the trade you’re most likely to get, was slightly negative. If someone shows you a Congress portfolio return, ask whether it’s an average driven by a couple of names.
The wait itself was flat. For all 68 on-time buys, we also measured the stretch between the trade date and the disclosure date. The stocks rose a median 1.1% during that wait, but so did the market, and they ended up level with $SPY (median -0.01 points, 34 of 68 ahead). In this sample, members weren’t buying right before obvious pops that the public then missed.
What this doesn’t tell you: whether some specific members are consistently good, whether a longer hold works better, or whether the result holds in a falling market. 23 trades from one summer, mostly large tech stocks, can’t answer those. It does show why a trade-date backtest overstates what a copier gets.
NANC and the Congress ETFs
If you’d rather not copy filings yourself, there’s an ETF for it. The Unusual Whales Subversive Democratic Trading ETF ($NANC) holds stocks based on the disclosed trades of Democratic members of Congress. It charges a 0.74% expense ratio, per the issuer’s fact sheet.
The issuer’s fact sheet as of December 31, 2025 shows $NANC returning 18.54% at market price in 2025, against 17.88% for the S&P 500 total return index. In 2026, through the October 15 close, $NANC was up 13.8% against 14.1% for $SPY, based on dividend-adjusted closing prices. So the fund that does this full time, with a team and a process, is running roughly level with the index. After fees, that’s about what our small test found too.
The issuer’s annual report says that for the year to September 30, 2025 the fund was overweight technology, communications and healthcare, and about 94% large cap. In a year when those lead, a Congress portfolio looks smart. When they lag, it won’t.
How to test a Congress-following idea without real money
If you still want to try it, and it’s a reasonable thing to be curious about, test it on paper first. Pick your rules before you look at results: which members, how long you hold, what you do when a filing is late. Then let it run forward and compare it to $SPY over the same dates.
Paper-test a Congress-following idea with a milo agent: no real money, and every move is explained. Start on milo. milo’s stock page also tracks insider buying and SEC filings for 50 of the most-followed US stocks, which is a useful second signal next to Congress filings.
If you’re picking a tracker first, our Congress stock trade trackers comparison covers the free and paid options.
FAQ
Do members of Congress beat the market?
The evidence is mixed. In our sample, their own entries beat $SPY over 30 days in 12 of 23 buys. $NANC, which follows Democratic members’ trades, beat the S&P 500 total return index by 0.66 points in 2025 and was slightly behind $SPY in 2026 through October 15.
Why don’t copy-Congress portfolios match the charts?
Because you can only buy after the filing goes public, usually weeks after the trade. In our data the median wait was 28 days, and 19 of 87 buys came in after the 45-day limit. Filings also give amount ranges, not exact sizes, so any portfolio built from them has to guess the weights.
How long do members of Congress have to report a trade?
They have 30 days from being notified of the trade, and never more than 45 days from the trade itself, under the STOCK Act.
Is there a Congress ETF?
Yes. $NANC follows disclosed trades of Democratic members. Check the issuer’s site for current holdings and fees before you buy anything.
Is it legal to copy politicians’ trades?
Yes. The reports are public, and anyone can read them on the House Clerk and Senate eFD sites or through a tracker.
This is a paper-trading test for education, not investment advice. Data: Periodic Transaction Reports via milo (House Clerk and Senate eFD), disclosed July 27 to October 15, 2026. Prices: daily adjusted closes. $NANC 2025 figures: Subversive ETFs fact sheet as of 12/31/2025.
Want the insider side too? Read the milo Insider Digest, a weekly roundup of the open-market insider buys worth a look.