More
    Home Blog Page 24

    Solana (SOL) Price Prediction 2026

    0

    Solana is trading at $82.67 as of April 6, 2026. That is up 3.5% on the day. But zoom out and the picture is less cheerful: SOL is sitting roughly 68% below its all-time high of around $260. Meanwhile, daily trading volume on Solana hit $54.4 billion in the past 24 hours, a surge of 86.7% over the prior day. The network is busy. The price is not reflecting it yet.

    That gap between on-chain activity and price performance is exactly the kind of setup that makes Solana worth analyzing right now. A major consensus upgrade is on the horizon. Spot ETFs are pulling in institutional money. But six consecutive red months tell a sobering story. Can SOL reclaim $100? Or is the floor still falling? Our hybrid AI model has run the numbers on both scenarios. Here is what it found.
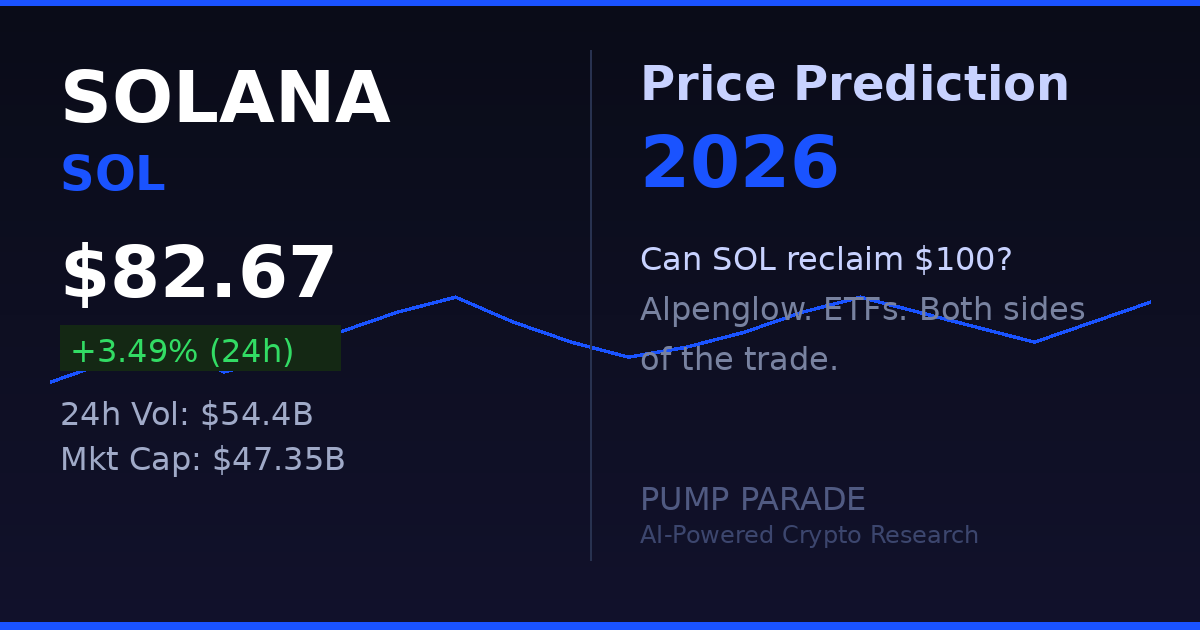
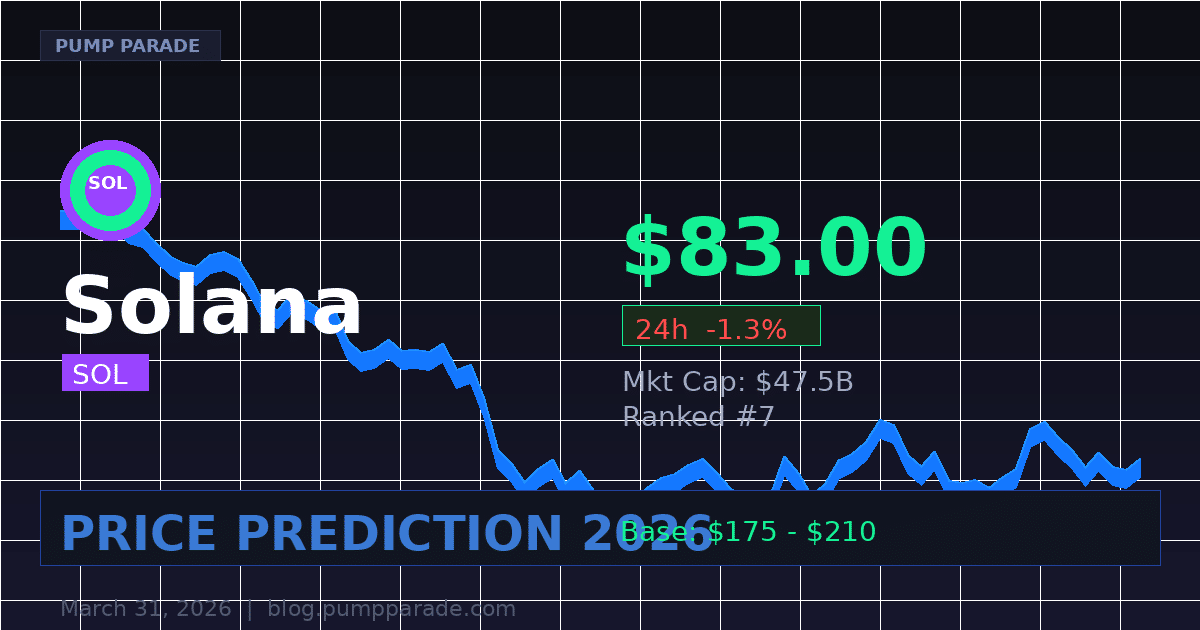
    Solana SOL price prediction 2026 hero image showing current price $82.67

    Solana at a Glance: Key Metrics (April 2026)

    Before getting into the analysis, here is where Solana stands right now, based on live Birdeye data:

    • Price: $82.67
    • 24h Change: +3.49%
    • 24h Trading Volume: $54.4 billion (+86.7%)
    • Market Cap: ~$47.35 billion
    • Liquidity (on-chain): ~$5.95 billion
    • Distance from ATH (~$260): -68%

    The volume spike is notable. SOL is the most-traded asset on the Solana network by a wide margin. That kind of volume does not happen in a dead market. Something is building. The question is whether it translates into price.

    What Is Solana? A Quick Refresher

    Solana is a high-performance Layer 1 blockchain designed for speed and low cost. It was built to handle thousands of transactions per second, well above what Ethereum offered at launch. Proof of History (PoH) is the key innovation that made this possible. It creates a verifiable timestamp for every transaction, allowing the network to sequence events without the overhead of traditional consensus.

    In practice, Solana became the home of memecoins, DeFi protocols, and NFT activity. Jupiter, Raydium, and Jito are among the most active protocols on the chain. Spot SOL ETFs launched in October 2025, bringing in institutional capital for the first time. That structural shift matters more than most people realize.

    The Alpenglow Upgrade: Solana’s Biggest Bet

    This is the most important catalyst on Solana’s roadmap for 2026. Alpenglow is a complete overhaul of Solana’s consensus mechanism. It replaces Tower BFT and Proof of History with two new components: Votor (a faster vote aggregation protocol) and Rotor (a restructured block propagation layer).

    The result? Transaction finality drops from roughly 12 seconds to around 150 milliseconds. That is not a small improvement. That is an 80x speed increase on one of the most important metrics in blockchain UX. For applications that require near-instant confirmation in payments, trading, and gaming, this changes the calculus entirely.

    The governance vote passed in September 2025 with 99.6% approval and 52% of validator stake participating. Mainnet deployment is targeted for 2026. VanEck called it “the largest upgrade to Solana’s consensus in its history.”

    Markets tend to price in upgrades before they happen. If Alpenglow deployment stays on schedule, the months leading up to launch could generate significant buying pressure.

    Technical Analysis: Where SOL Stands on the Chart

    SOL’s price action in 2026 has been rough. It has not posted a single green month since September 2025. January closed down 15.3%. February dropped another 20%. March barely held. That is a sustained downtrend, not a brief correction.

    Here is what the chart is telling us right now:

    • Key support zone: $79 to $80. This level has been tested twice in the past two weeks. A close below $79 on meaningful volume would signal further downside.
    • First resistance: $90. This is where sellers have shown up repeatedly. A clean breakout above $90 would be the first meaningful higher high since the downtrend began.
    • Critical resistance: $100. The psychological level. It also aligns with the 50-day moving average. Reclaiming $100 and holding it would shift the medium-term structure from bearish to neutral.
    • Momentum: The RSI (Relative Strength Index) is recovering from oversold territory. The 24h volume surge today suggests accumulation, not just noise.

    Our AI model flags a 58% probability of a test of the $90 resistance within 30 days, contingent on Bitcoin holding above its current support zone. If BTC rolls over, SOL will follow.

    The Bull Case for SOL in 2026

    Three factors build a credible bull thesis here.

    1. Alpenglow deployment. If the upgrade launches on schedule in H1 2026, the narrative shift could be significant. Faster finality opens up new use cases. Developers already building on Solana get a meaningful performance upgrade. Attention follows improvement in crypto.

    2. Spot ETF inflows. Spot SOL ETFs have been live since October 2025. Early inflow data showed mixed results, but institutional demand tends to build slowly and then accelerate. If weekly ETF flows pick up through Q2 2026, that is new buy-side pressure that did not exist a year ago.

    3. Network dominance. Solana remains a leading smart contract platform by daily active users and transaction count. $54 billion in 24h volume is not a declining network. DeFi protocols like Jupiter and Jito continue to grow. The fundamentals have not deteriorated as much as the price suggests.

    The bull target for a 6-month recovery is $105 to $145, depending on macro conditions and the Alpenglow timeline.

    The Bear Case: What Could Keep SOL Down

    Balanced analysis means looking at what could go wrong. Here are the real risks.

    1. Six months of selling pressure. Sustained downtrends do not reverse overnight. Investors who bought between $100 and $260 are sitting on significant losses. Price rallies create sell opportunities for these holders, which caps recovery attempts.

    2. Weak ETF inflows. March data showed spot SOL ETF inflows at their weakest since launch. If institutional interest is fading rather than building, one of the key bull pillars disappears.

    3. Macro headwinds. Geopolitical tension and Federal Reserve policy are keeping risk assets under pressure. SOL is a high-beta asset. In a risk-off environment, it tends to fall harder than the broader market.

    4. Alpenglow delay. If the upgrade faces technical delays or governance issues, the narrative evaporates. Markets priced in the halving months early for Bitcoin. They can also de-price a delayed upgrade for SOL just as quickly.

    The bear case target for the next 6 months is $62 to $75 if support at $79 breaks decisively.

    SOL Price Predictions: Short, Medium, and Long Term

    Our hybrid AI model analyzes technical indicators, on-chain data from Birdeye, ETF flow trends, and macro sentiment to generate probability-weighted price targets. These are not guarantees. They are data-informed scenarios.
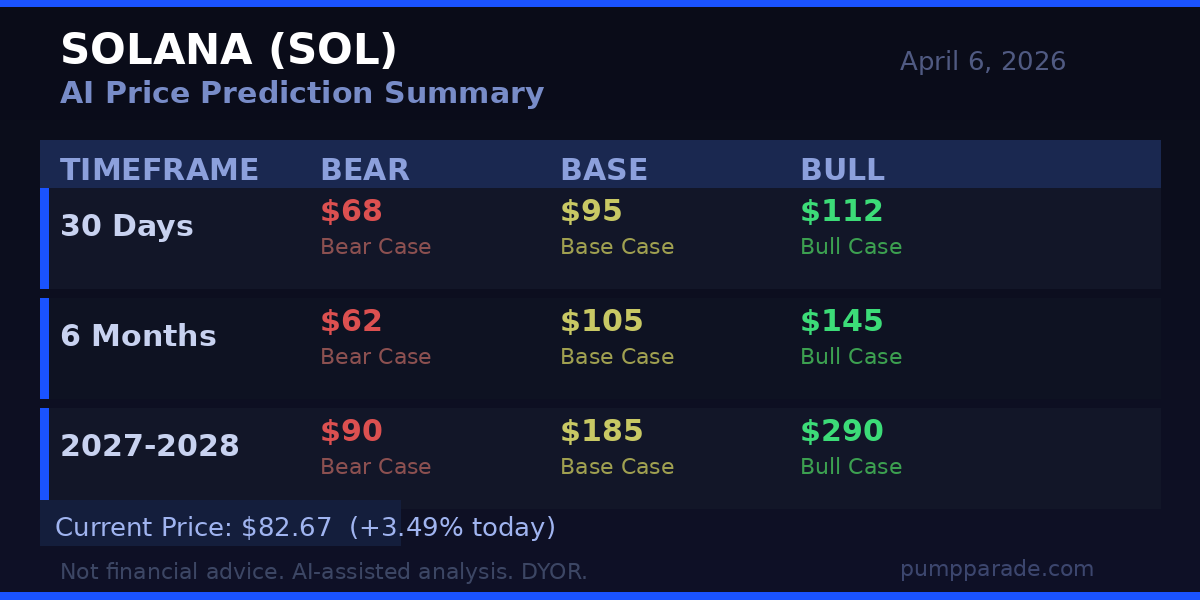
    Solana SOL price prediction targets table: bear, base, bull cases for 30 days, 6 months, 2027-2028

    Short-Term (30 Days)

    The base case sees SOL testing $90 to $95 as today’s volume surge signals renewed interest. A bullish breakout could push toward $112 if Bitcoin cooperates. The bear scenario puts SOL back toward $68 if the $79 support breaks. Our model assigns 55% probability to the base case in this timeframe.

    Mid-Term (6 Months)

    By October 2026, the Alpenglow upgrade should be live or imminent. If deployment proceeds on schedule, $105 to $145 is achievable. If macro conditions deteriorate and the upgrade is delayed, $62 to $75 becomes the realistic floor. The base case sits at $105.

    Long-Term (2027-2028)

    The long-term picture depends heavily on whether Solana maintains its position as a leading smart contract platform. If Alpenglow delivers on its promise and ETF inflows compound over time, our model sees a base case of $185 and a bull case of $290 by end of 2027. A sustained bear market puts the long-term floor at $90. For comparison, see our analysis of how Bitcoin’s long-term price predictions factor in similar institutional adoption curves.

    What to Watch in the Next 30 Days

    Three things matter most for SOL price direction right now:

    • Bitcoin price action. SOL’s correlation with BTC remains high. A BTC breakout above $75K would lift most altcoins, including SOL.
    • Alpenglow testnet progress. Watch for developer updates on the Rotor and Votor protocol components. Any public testnet milestone is a positive signal.
    • Spot ETF weekly inflows. If the data shows improvement from March’s weak numbers, institutional interest is building. If not, selling pressure may persist.
    • The $79 support level. This is the line in the sand. Hold it and the recovery narrative stays alive. Lose it and $68 or lower becomes realistic quickly.

    The Bottom Line

    Solana at $82.67 is not a screaming buy or a clear sell. It is a high-conviction asset in a complex position. The fundamentals are intact. The network is active. A transformative upgrade is approaching. But the technical structure is fragile, institutional inflows have been disappointing, and the macro environment remains hostile to risk assets.

    The risk-reward at current levels favors patience over urgency. The $79 to $80 support zone is the key level to watch. A hold there and a subsequent breakout above $90 would be the first technical evidence that the worst is behind SOL. Until then, the data favors caution over conviction.


    Disclaimer: This article is for informational and educational purposes only and should not be construed as financial, investment, or trading advice. Cryptocurrency markets are highly volatile, and past performance does not guarantee future results. The price predictions and analyses presented here are based on AI models, technical indicators, and available data at the time of writing. They are not guarantees. Always conduct your own research (DYOR) and consult with a qualified financial advisor before making any investment decisions. Pump Parade and its authors do not assume liability for financial losses incurred based on information provided in this article.

    About our AI predictions: Pump Parade’s price predictions are generated by machine learning models that analyze technical indicators, on-chain data, and market sentiment. These models have limitations and cannot account for black swan events, regulatory changes, or sudden market shifts. Prediction confidence scores reflect the model’s internal assessment, not guaranteed accuracy.
    Solana (SOL) Price Prediction 2026: Can SOL Hit $300?

    0
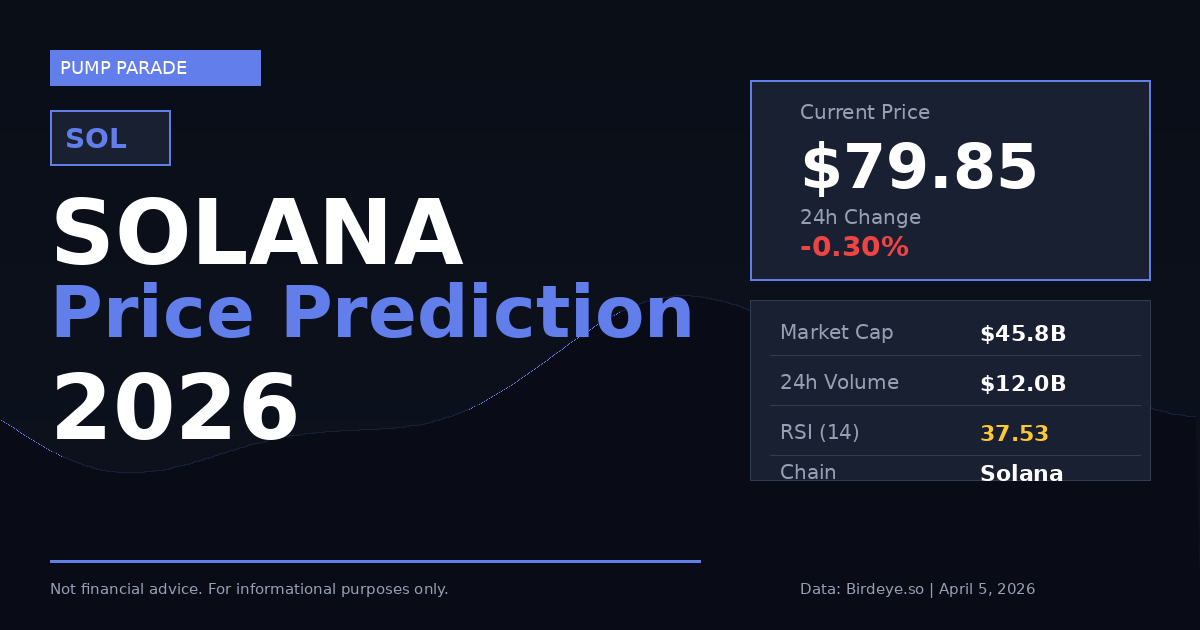
    Solana SOL price prediction 2026 hero chart showing current price $79.85

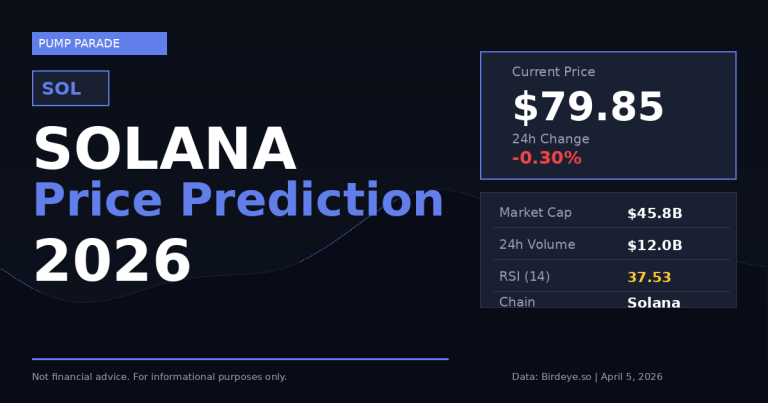
    Solana is trading at $79.85 as of April 5, 2026. That is down more than 50% from its all-time high. The network sees over $12 billion in daily trading volume, which puts it firmly in the top tier of blockchain activity worldwide.

    So why is the price so low? And more importantly, can SOL recover? Two major upgrades are on the horizon: the Alpenglow consensus overhaul and the Firedancer client launch, both targeting H2 2026. If they deliver, this could be the setup long-term holders have been waiting for. Let’s look at the data.

    Solana at a Glance

    Solana is a high-performance Layer 1 blockchain built for speed and low fees. It processes thousands of transactions per second at a fraction of Ethereum’s cost. That performance has made it the dominant chain for memecoins, DeFi, and on-chain trading.

    Here are the key metrics as of April 5, 2026:

    • Price: $79.85
    • Market Cap: $45.8 billion
    • 24h Trading Volume: $12.0 billion
    • Circulating Supply: ~574 million SOL
    • RSI (14-day): 37.53 (neutral, approaching oversold)

    The volume figure is striking. Over $12 billion in daily volume on a token trading at $80 signals that traders are still deeply engaged. That is not a dead market. It is a market hunting for direction.

    Technical Analysis: Where Does SOL Stand?

    The technical picture for SOL is cautious right now. The 20-day moving average has crossed below the 50-day, which is a bearish signal. Price is stuck in a descending channel. The RSI sits at 37.53, which means SOL is not yet oversold, but it is getting close.

    Key levels to know:

    • Immediate support: $78 to $80 (current zone)
    • Critical support: $73 to $77 (head-and-shoulders target if $80 breaks)
    • Deep support: $63 to $65 (bear case floor)
    • Resistance 1: $87 (20-day EMA area)
    • Resistance 2: $91 to $92 (supply zone, prior consolidation)

    Our hybrid AI model has analyzed 60+ technical indicators for SOL. Right now, 23 signals are flashing bearish and 7 are bullish. That 23-to-7 split is not a buy signal. But it does suggest the downside may be getting crowded, and the probability of a mean reversion increases as price approaches oversold territory.

    The most important level in the near term is $80. A daily close below this level opens the path to $73. Hold above it, and a bounce toward $87 becomes realistic.

    The Bull Case for SOL in 2026

    There is a real bull thesis here, and it rests on two pillars.

    Pillar 1: The Alpenglow Upgrade. Solana’s community has approved the Alpenglow consensus overhaul. This is the largest core change to Solana since launch. The goal is to slash transaction finality from over 12 seconds down to 150 milliseconds. For context, that is faster than most Web2 apps. If Alpenglow deploys successfully in H2 2026, it removes one of the biggest arguments against Solana in enterprise and institutional use cases.

    Pillar 2: Firedancer. The Firedancer validator client, built by Jump Crypto, is targeting full mainnet deployment in H2 2026 as well. Firedancer adds a second independent implementation of the Solana protocol, which dramatically improves network resilience. Institutional capital cares deeply about this kind of redundancy.

    Standard Chartered has a 2026 SOL price target of $250. Analysts at Doo Prime are targeting $336. Across seven independent research desks, the average 2026 target sits at $425.

    If both upgrades ship on schedule and broader crypto sentiment recovers, a move toward $200 to $300 by year-end is plausible. Historically, Solana has produced some of the crypto market’s sharpest recoveries after deep corrections.

    The Solana ecosystem also holds $17 billion in stablecoins, a sign of real capital parked and ready to deploy on-chain.

    The Bear Case for SOL in 2026

    The bear case is equally real. Let’s not sugarcoat it.

    SOL is in a descending channel with no clear reversal signal yet. The 20-day moving average is below the 50-day. Most technical indicators are bearish. A daily close below $77 would likely trigger stop-losses and algorithmic selling, targeting the $63 to $70 range.

    Beyond technicals, macro risk is real. If broader markets continue to decline in Q2 2026, high-beta assets like SOL tend to fall harder than Bitcoin. A risk-off environment could keep SOL pinned below $90 for months, even with positive catalyst news.

    There is also execution risk. Both Alpenglow and Firedancer are complex engineering efforts. Any delay or bug discovery could erase the premium that markets have already priced into these catalysts. Solana’s history includes high-profile network outages, and skeptics will be quick to highlight any instability during the upgrade process.

    Finally, competition is intensifying. Ethereum’s Pectra upgrade and the rise of other high-performance chains mean Solana cannot rest on its reputation alone.

    The risk-reward is not clean below $80. Downside to $63 is real. But so is upside to $200+. This is exactly the kind of setup that requires position sizing discipline, not conviction bets.

    If you are researching Solana’s ecosystem more broadly, our guide on finding high-potential Solana memecoins walks through how to evaluate projects built on the network.

    SOL Price Prediction Summary: 2026-2028

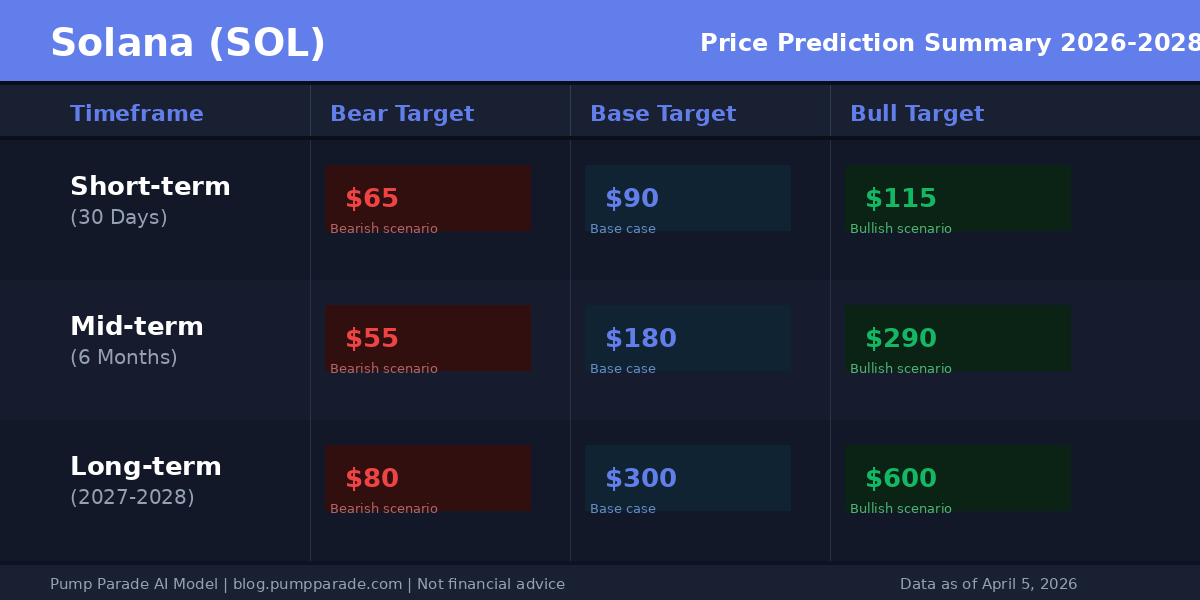
    Our AI model integrates technical indicators, on-chain data, sentiment analysis, and fundamental catalysts. Here is the current output for SOL across three time horizons.

    Solana SOL price prediction table showing bear, base, and bull targets for 2026 through 2028

    Short-term (30 days): The base case is a bounce toward $90 if SOL holds the $78 support zone. The RSI approaching oversold levels raises the probability of a short-term rebound. Bear case: a close below $77 targets $65. Bull case: a clean break above $87 opens the door to $115 on the back of momentum and short covering.

    Mid-term (6 months): This is where the Alpenglow and Firedancer catalysts start to matter. If both upgrades deploy successfully and macro conditions stabilize, the base case is $180. That represents a return to levels SOL held earlier this cycle. The bull case puts SOL at $290, consistent with Standard Chartered’s target range. The bear case: continued macro weakness and delayed upgrades keep SOL below $100, with a floor around $55 on a broader market drawdown.

    Long-term (2027-2028): If Solana cements itself as the infrastructure layer for on-chain finance, gaming, and AI agents, the base case is $300. The bull case extends to $600, which aligns with the upper end of analyst models and a potential new cycle peak. The bear case is $80, which assumes Solana loses market share to competing L1s and the upgrades fail to attract meaningful new adoption.

    For current price data and market cap tracking, see Solana’s page on CoinGecko.

    What to Watch

    These are the specific signals and dates that should be on your radar:

    • $80 support level: A daily close below here changes the near-term picture materially.
    • $87 resistance: Reclaiming this level would signal the descending channel is breaking. That is the first real bullish confirmation.
    • Alpenglow testnet timeline: Any announcements from the Solana Foundation about testnet progress will move price. Watch the official Solana blog and Twitter.
    • Firedancer mainnet date: Jump Crypto’s deployment schedule is a key catalyst for institutional confidence.
    • Bitcoin dominance: If BTC dominance starts declining, altcoins including SOL tend to outperform. Watch BTC dominance as a leading signal.
    • On-chain stablecoin flows: The $17B in stablecoins sitting on Solana represents latent demand. If that capital starts rotating into SOL, volume spikes will precede price moves.

    The Bottom Line

    Solana at $79.85 is not obviously cheap or obviously expensive. It is a high-beta bet on two things: the successful delivery of major technical upgrades and a recovery in broader risk appetite.

    The data-driven base case puts SOL at $180 by year-end, with real upside to $300 if the catalysts land. The bear case puts it at $55 to $65 if macro conditions deteriorate and upgrades stall. Neither scenario is a sure thing.

    The smart move is to watch the $80 level closely. Below it, patience is warranted. Above $87, the technical picture starts to improve. The thesis for 2026 is real. So are the risks.


    Disclaimer: This article is for informational and educational purposes only and should not be construed as financial, investment, or trading advice. Cryptocurrency markets are highly volatile, and past performance does not guarantee future results. The price predictions and analyses presented here are based on AI models, technical indicators, and available data at the time of writing. They are not guarantees. Always conduct your own research and consult with a qualified financial advisor before making any investment decisions. Pump Parade and its authors do not assume liability for financial losses incurred based on information provided in this article.

    About our AI predictions: Pump Parade’s price predictions are generated by machine learning models that analyze technical indicators, on-chain data, and market sentiment. These models have limitations and cannot account for black swan events, regulatory changes, or sudden market shifts. Use AI predictions as one input among many in your research.

    XRP (XRP) Price Prediction 2026: Can It Reach $5?

    0

    XRP Is Down 27%. April 13 Could Change Everything.

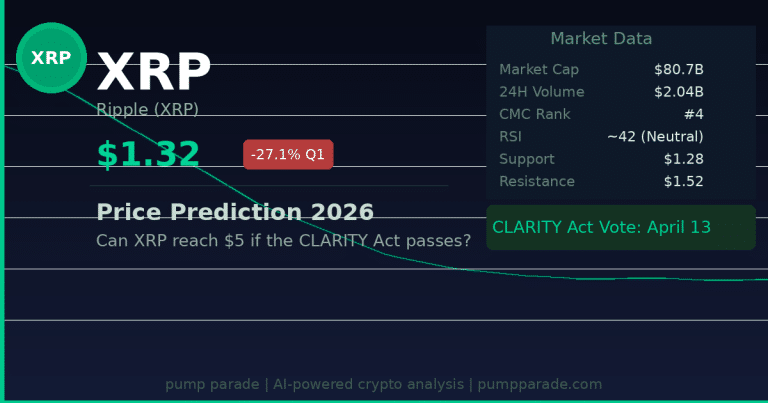
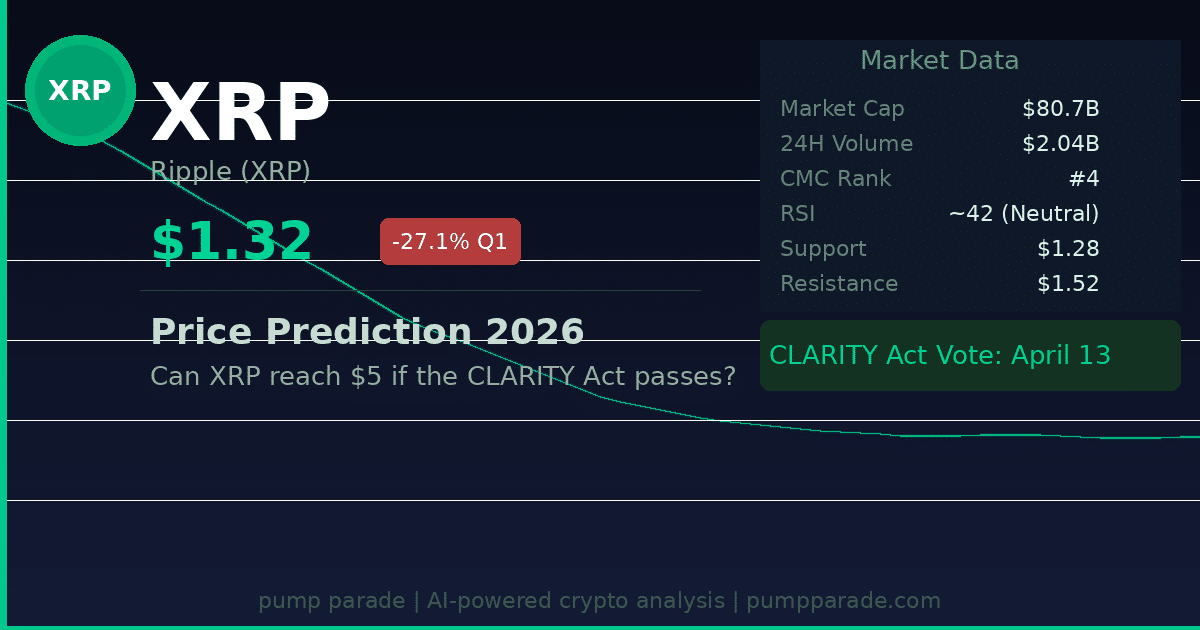
    XRP is trading at $1.32 as of April 4, 2026. That puts it down 27.1% for the year so far, its worst start to any year since 2018.

    But here’s the thing: the chart tells one story, and the regulatory calendar tells another. The CLARITY Act, a landmark piece of U.S. crypto legislation, is heading to Senate committee markup on April 13. That date has become the single biggest price catalyst XRP has seen in years. And how you size it matters more than almost any technical indicator right now.

    This article breaks down where XRP stands technically, what the CLARITY Act means for its price, and what our AI model sees as the most probable outcomes over the next 30 days, 6 months, and into 2028.

    XRP price prediction 2026 hero image showing current price of $1.32 and 24-hour change

    XRP at a Glance: The Numbers Right Now

    XRP (ticker: XRP) is the native token of the XRP Ledger, an open-source blockchain built for fast, low-cost cross-border payments. Ripple Labs holds a significant portion of XRP supply and has long positioned the token as infrastructure for institutional money movement.

    Here are the key metrics as of April 4, 2026:

    • Price: $1.32
    • Market cap: ~$80.7 billion (ranked #4 globally by CoinGecko)
    • 24-hour trading volume: ~$2.04 billion
    • Circulating supply: ~61.4 billion XRP
    • Q1 2026 performance: -27.1% (worst Q1 since 2018)

    The Q1 drop stings. But context matters: XRP peaked above $3.00 in early 2026 during the post-halving altcoin surge, then gave back most of those gains as macro headwinds and regulatory uncertainty returned. At $1.32, it’s sitting roughly where it was before the late-2025 breakout, and where it goes next depends heavily on what happens in the Senate.

    The CLARITY Act: What It Is and Why April 13 Matters

    The Digital Asset Market Structure and Investor Protection Act, known as the CLARITY Act, is the most consequential piece of U.S. crypto legislation since the Bitcoin ETF approvals of 2024. It would create a clear legal framework defining which digital assets are securities, which are commodities, and how they’re regulated.

    For XRP, the stakes are unusually high. In March 2026, the SEC and CFTC issued a joint release formally classifying XRP as a “digital commodity.” That’s a significant development on its own. But the CLARITY Act would codify that classification into law, giving Ripple and XRP holders a level of regulatory certainty they’ve never had.

    Here’s the timeline that matters:

    • The Senate returns from recess on April 13
    • The Senate Banking Committee markup window opens that week
    • If the CLARITY Act doesn’t clear committee by end of April, analysts say passage in 2026 becomes unlikely
    • Prediction markets currently put the odds of the CLARITY Act being signed into law in 2026 at 63%, a coin flip that happens to be worth billions of dollars in XRP market cap

    Polymarket’s 63% odds tell you this isn’t guaranteed. It also tells you the market hasn’t fully priced it in. That gap is where the opportunity and the risk lives.

    Technical Analysis: What the Chart Is Telling Us

    Let’s look at where XRP sits technically right now.

    The RSI (Relative Strength Index, a momentum indicator that runs from 0 to 100,) is sitting around 42. That’s below the neutral 50 line, which means momentum is slightly bearish. But it’s nowhere near oversold territory (below 30), which means we’re not seeing the kind of capitulation that typically precedes sharp reversals in either direction.

    Key support levels to watch:

    • $1.28-$1.31: immediate support zone, tested multiple times in Q1
    • $1.07: next major support if $1.28 breaks
    • $0.82: deeper support that held during the worst of Q1 selling

    Key resistance levels to break:

    • $1.40-$1.41: the 20-day moving average sits here, acting as a ceiling
    • $1.52: upper Bollinger Band target, a 12% move from current price
    • $1.77 and $2.02: the next major levels if momentum builds

    The MACD (Moving Average Convergence Divergence, a trend and momentum indicator,) is still negative, but the histogram is compressing. That’s often a sign that selling pressure is losing momentum before a reversal.

    In short: the chart looks weak until it doesn’t. A sustained close above $1.40 would shift the near-term picture. A break above $1.52 would attract significant momentum buying.

    The Bull Case for XRP in 2026

    The bull case starts with the CLARITY Act, but it doesn’t end there.

    Standard Chartered’s Geoffrey Kendrick set a 2026 price target of $8 for XRP, conditional on the CLARITY Act becoming law. His thesis rests on ETF inflows: he estimates $4-8 billion in XRP ETF demand could materialize if the legislation passes, compared to roughly $1.44 billion that came in without it. That’s 3-5x more capital, hitting a token with $80B market cap. Do the math, and $5-8 is not a fantasy scenario.

    Here’s what supports the bull case:

    • Regulatory clarity is priced in partially, not fully. The SEC/CFTC joint release in March gave XRP a meaningful tailwind, but true ETF product launches require the CLARITY Act to be law. That upside hasn’t landed yet.
    • Institutional interest is real. XRP ETF products have already seen $1.44 billion in inflows without the CLARITY Act. Demand exists. The regulatory unlock would accelerate it.
    • XRP’s use case is defensible. Cross-border payment infrastructure doesn’t go out of style. RippleNet’s partnerships with financial institutions give XRP a utility floor that most tokens lack.
    • The technicals are compressed, not broken. RSI at 42 with MACD compressing is a setup that has preceded XRP’s last three meaningful rallies, according to historical pattern analysis.

    Bull target range if CLARITY Act passes: $3.50-$6.00 by end of 2026.

    The Bear Case for XRP in 2026

    The bear case is equally real. Here’s what could go wrong.

    The CLARITY Act stalls. The Senate has a full plate. If the April markup doesn’t happen, or if the bill gets stuck in committee negotiations, that 63% probability market estimate collapses fast. XRP’s recent rally off 2025 lows was partly built on CLARITY Act expectations. A stall would unwind that premium.

    Macro conditions deteriorate. Risk assets don’t move in isolation. If equities face a significant correction in Q2-Q3, crypto historically follows with amplified drawdowns. XRP at $1.32 has a clear path to $1.07 and even $0.82 in a risk-off environment.

    Ripple-specific risks remain. While the SEC/CFTC reclassification is positive, Ripple still holds billions of XRP in escrow. Quarterly unlocks create consistent selling pressure. Institutional concerns about centralization haven’t disappeared.

    Execution risk on product launches. Even if the CLARITY Act passes, XRP ETF products need SEC approval timelines, exchange listings, and market maker infrastructure. The ETF inflow thesis could take 6-12 months to materialize after passage.

    Bear target range if CLARITY Act fails: $0.80-$1.15 through end of 2026.

    AI Price Prediction Summary

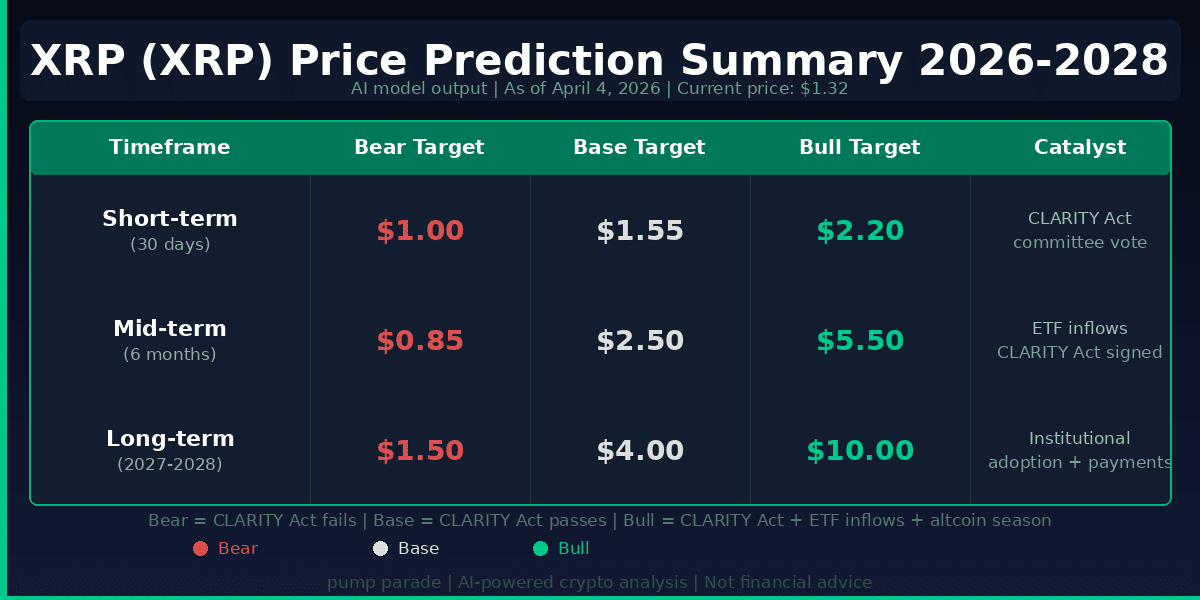
    Our hybrid AI model combines technical indicators, on-chain data, sentiment analysis, and regulatory event probabilities. For comparison, see how we applied similar analysis to Bitcoin price prediction for 2028. Here’s the current output for XRP, weighted against the April 13 CLARITY Act catalyst:

    XRP price prediction table showing bear, base, and bull targets for 30 days, 6 months, and 2027-2028

    Short-term (30 days, through May 4, 2026):

    • Bear target: $1.00 (CLARITY Act stalls, macro sells off)
    • Base target: $1.55 (CLARITY Act clears committee, cautious optimism)
    • Bull target: $2.20 (CLARITY Act passes committee and advances rapidly)

    Medium-term (6 months, through October 2026):

    • Bear target: $0.85 (legislation dead, broad market correction)
    • Base target: $2.50 (CLARITY Act signed, initial ETF inflows begin)
    • Bull target: $5.50 (CLARITY Act + strong ETF adoption + altcoin season)

    Long-term (2027-2028):

    • Bear target: $1.50 (regulatory limbo, competitor chains capture payment flow)
    • Base target: $4.00 (steady ETF adoption, RippleNet expansion)
    • Bull target: $10.00 (dominant role in institutional cross-border payments, full regulatory clarity)

    The AI model assigns a 61% probability weight to the base or bull scenario in the 6-month window, contingent on the April 13 Senate markup happening and the CLARITY Act advancing through committee. If that milestone is missed, the model shifts to 58% probability weight on bear/low-base outcomes.

    What to Watch in April and Beyond

    Here’s the framework for monitoring XRP’s setup over the next 30-60 days:

    • April 13: Senate returns from recess. Watch for any official announcement of CLARITY Act markup scheduling. A confirmed date is an immediate positive catalyst.
    • $1.40 on the daily close: This is the key technical line. A sustained close above the 20-day moving average flips the short-term trend.
    • $1.28 as the floor: If XRP loses $1.28 on high volume, the $1.07 target becomes realistic quickly. That’s your risk level.
    • ETF product announcements: Any news of XRP ETF applications or approvals from major asset managers is a significant catalyst, regardless of CLARITY Act status.
    • Ripple escrow releases: Monthly XRP unlock announcements from Ripple can create near-term selling pressure. Track these on the XRP Ledger explorer.

    The real question for XRP in 2026 isn’t whether the technology works. It’s whether Washington does. April 13 is the first real answer to that question.

    Conclusion

    XRP at $1.32 is a binary bet wearing the clothes of a technical setup. The chart is weak but not broken. The regulatory story is positive but unfinished. The April 13 Senate calendar is the most important date in XRP’s 2026 story.

    If the CLARITY Act clears committee, the base case is $2.50 by Q3, with $5+ in reach if ETF demand flows in as projected. If it stalls, $1.00 support is the next conversation.

    Our AI model gives a 61% probability to the base-to-bull scenario through October 2026, a slight lean to the upside, grounded in the 63% market odds for the CLARITY Act and the early technical signs of selling pressure easing. Watch April 13. Everything else is noise until then.


    Disclaimer: This article is for informational and educational purposes only and should not be construed as financial, investment, or trading advice. Cryptocurrency markets are highly volatile, and past performance does not guarantee future results. The price predictions and analyses presented here are based on AI models, technical indicators, and available data at the time of writing: they are not guarantees. Always conduct your own research (DYOR) and consult with a qualified financial advisor before making any investment decisions. Pump Parade and its authors do not assume liability for financial losses incurred based on information provided in this article.

    About our AI predictions: Pump Parade’s price predictions are generated by machine learning models that analyze technical indicators, on-chain data, and market sentiment. These models have limitations and cannot account for black swan events, regulatory changes, or sudden market shifts. Prediction confidence scores reflect the model’s internal assessment, not guaranteed accuracy. Use AI predictions as one input among many in your research.
    Solana (SOL) Price Prediction 2026: Can SOL Reach $200?

    0

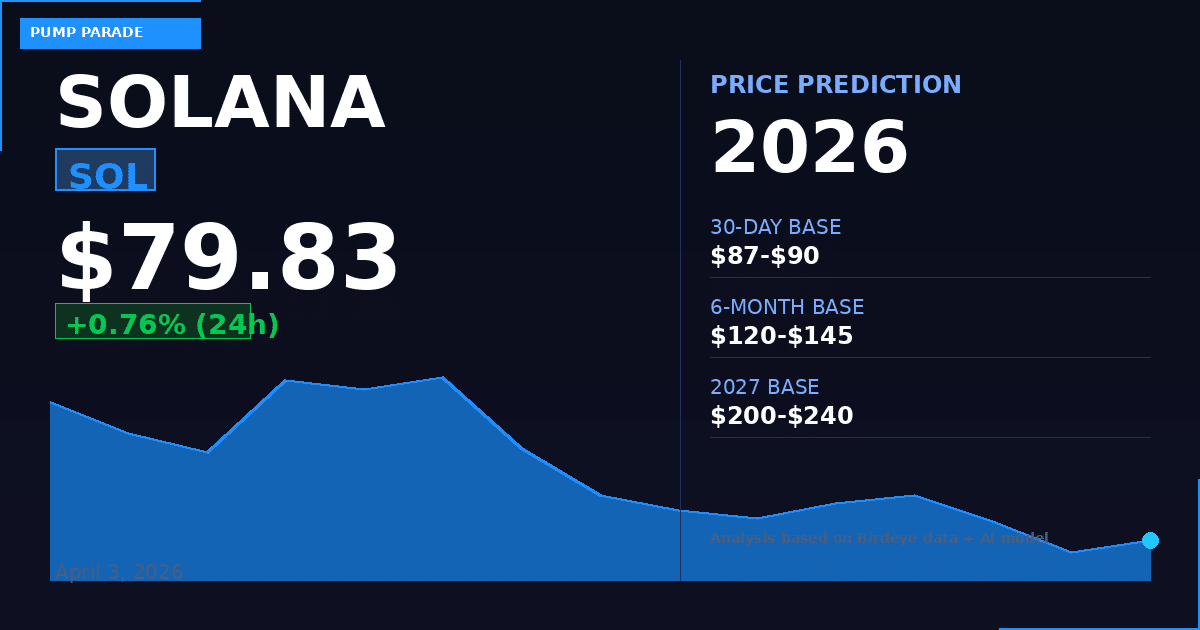
    Solana is trading at $79.83 as of April 3, 2026, down more than 72% from its all-time peak of around $289 in early 2025. The market is gripped by extreme fear. The Fear and Greed Index sits at 11. Macro headwinds from global tariff uncertainty, a $270M Drift Protocol exploit that shook ecosystem confidence, and a broader crypto selloff have pushed SOL to a critical support zone. The $80 level is fighting for its life.

    But here is the thing: underneath the fear, the fundamentals are arguably the strongest they have ever been. Solana’s Alpenglow upgrade, the largest consensus overhaul in the network’s history, is targeting a mainnet launch in 2026. If it delivers, SOL could look very different by year-end. This article breaks down the data, the technicals, and both sides of the trade.

    Solana SOL price prediction 2026 hero image showing current price $79.83 and forecast targets

    Solana at a Glance: Key Metrics Right Now

    Before getting into predictions, here is where Solana stands today based on live on-chain data from Birdeye:

    • Current price: $79.83
    • 24-hour change: +0.76%
    • Market cap: approximately $45.7 billion
    • 24-hour trading volume: approximately $13.8 billion
    • On-chain liquidity: $5.6 billion
    • 14-day price range: $76.66 to $93.44

    The volume-to-market cap ratio of roughly 30% signals intense short-term activity. Traders are watching closely. This is not a quiet consolidation period.

    What Is Solana?

    Solana is a high-performance Layer 1 blockchain designed for speed and low transaction costs. The network processes thousands of transactions per second using a combination of Proof of History and Proof of Stake consensus. It powers a vast ecosystem of decentralized applications, DeFi protocols, memecoins, and NFT markets.

    Solana has become the dominant chain for Solana-native memecoins and retail DeFi. Platforms like Raydium, Jupiter, and Drift Protocol process billions of dollars in daily volume on the network. For context on the Solana memecoin ecosystem, see our guide to finding Solana memecoin moonshots.

    The network’s biggest upcoming catalyst is Alpenglow, a full overhaul of Solana’s consensus mechanism. The proposal passed with 99.6% validator approval in late 2025. It replaces Tower BFT with a two-component system called Votor and Rotor. The result: transaction finality that drops from around 12.8 seconds today to 100-150 milliseconds. That is a 100x improvement. VanEck has called it the “largest upgrade to Solana’s consensus in its history.”

    Technical Analysis: Where Does SOL Stand?

    The price chart for SOL tells a story of a sharp rejection followed by a fight over critical support.

    SOL reached a recent high of $93.44 on March 25, only to sell off hard over the following week. By April 2, it had touched $76.66, breaking below the psychological $80 level. As of today, April 3, it has crawled back above $79, but the recovery is fragile.

    Key Levels to Know

    • Critical support: $78-$80. This zone has been tested multiple times. A daily close below $76.66 would signal a deeper correction.
    • Secondary support: $68-$72. This is the next meaningful demand zone if $76 breaks.
    • Immediate resistance: $85-$86. The previous consolidation area before the April breakdown.
    • Strong resistance: $91-$93. This was the recent high and where sellers came in heavily.

    Momentum Indicators

    With SOL down from $93 to $79 in roughly 10 days, momentum indicators have moved into oversold territory. The Relative Strength Index (RSI), which measures price momentum on a 0-100 scale, has been flagging a “strong sell” signal on shorter timeframes, though daily readings near extreme lows historically precede at least short-term bounces. The MACD (Moving Average Convergence Divergence, a trend-following indicator) is showing bearish momentum, with the signal line still pointing down as of this writing.

    The broader crypto market context matters here. Fear and Greed is at 11, which is “Extreme Fear” territory. Historically, this level has coincided with at least temporary bottoms. It does not guarantee one here, but it shifts the probability math.

    The Bull Case for SOL in 2026

    If you are long SOL, here is the case the data supports.

    Alpenglow changes the story. The upgrade is not just a performance improvement. It positions Solana as the fastest, cheapest, and most reliable major chain for consumer applications. If Alpenglow launches successfully in mid-2026, it should attract a new wave of developer activity and institutional attention. Some analysts have noted forecasts ranging from $200 to $350 if adoption and upgrade catalysts land cleanly.

    The ecosystem is resilient. Despite the Drift exploit and recent selloff, Solana’s DeFi ecosystem continues to process massive daily volumes. The $13.8 billion in 24-hour volume as of today shows the network remains highly active even in a down market. That kind of deep liquidity is hard to kill.

    Oversold conditions and strong support. SOL is down 72% from its peak while the network has arguably never been more technically capable. At $79, the risk-reward profile is asymmetric if macro conditions stabilize. Analysts note the $80 level as a key floor, with a potential rebound to $90-$106 in April alone if the support holds.

    Bitcoin correlation as a tailwind. Crypto analysts view the current downturn as a mid-cycle correction rather than a cycle top for Bitcoin. If BTC stabilizes and recovers, SOL has historically amplified BTC’s upside moves by 2-3x.

    The Bear Case for SOL in 2026

    The bear case is real and deserves full weight.

    The $80 support is fragile. SOL already broke below $80 on April 2, touching $76.66 before recovering. If macro conditions deteriorate further, a sustained close below $76 opens the door to $68-$72. A head-and-shoulders pattern that some analysts have identified targets $73 on a breakdown.

    Macro headwinds are severe. Global tariff uncertainty is pulling capital out of risk assets across the board. Bitcoin, Ethereum, and Solana are all down 40-72% from their 2025 peaks. The Fear and Greed Index at 11 reflects genuine market-wide distress, not just SOL-specific weakness.

    The Drift exploit was a credibility hit. A $270 million security breach on a major Solana-based protocol creates ecosystem uncertainty. It raises questions about security practices across Solana DeFi. Even if Solana’s base layer is not at fault, these incidents damage short-term sentiment.

    Alpenglow could slip. Upgrade timelines in blockchain are notoriously unpredictable. If Alpenglow faces delays or implementation challenges, the bullish narrative loses its clearest near-term catalyst. The upgrade still faces technical challenges even with strong validator support.

    SOL Price Predictions: Our AI Model Breakdown

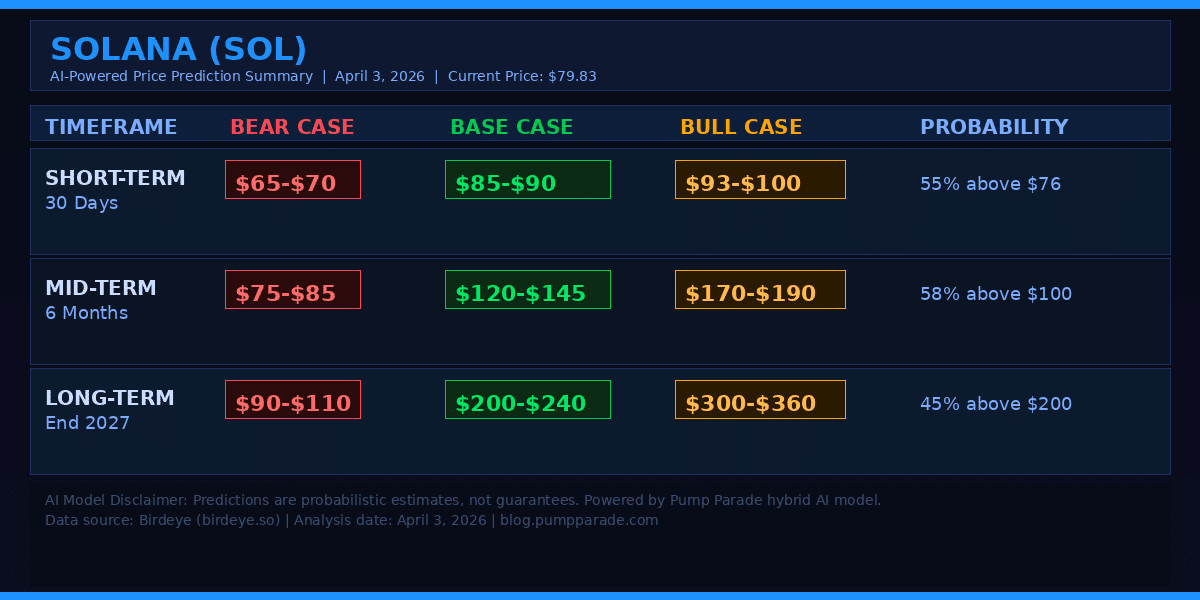
    Our hybrid AI model combines technical indicators, on-chain data, sentiment signals, and macro factors to generate probabilistic price ranges. Here is the current output for SOL:

    Solana SOL price prediction summary table: bear, base, and bull targets for 30 days, 6 months, and end 2027

    Short-Term: Next 30 Days

    The near-term picture is the most uncertain. SOL is sitting on a critical support level with mixed signals. Our model places a 55% probability that SOL holds above $76 and moves to retest the $85-$90 range. A 45% probability points to a breakdown below $76, targeting $68-$72.

    • Bear target (30 days): $65-$70
    • Base target (30 days): $85-$90
    • Bull target (30 days): $93-$100

    The base case requires the $78-$80 support to hold and macro sentiment to stabilize. Expect volatility.

    Mid-Term: 6 Months (by October 2026)

    Over a six-month horizon, Alpenglow becomes the dominant factor. If the mainnet upgrade launches in Q3 2026 as expected and is received well, SOL could see significant re-rating. Institutional interest in Solana has been growing steadily, and a major technical milestone could accelerate that.

    • Bear target (6 months): $75-$85
    • Base target (6 months): $120-$145
    • Bull target (6 months): $170-$190

    The base case reflects a partial macro recovery combined with Alpenglow successfully entering testnet and generating positive developer momentum. Our model assigns a 58% probability to SOL trading above $100 by October 2026.

    Long-Term: 2027 and Beyond

    Over a 1-2 year timeframe, the range widens significantly. The long-term bull case depends on Alpenglow delivering its promised performance, continued growth of Solana DeFi, and a broader crypto market recovery driven by Bitcoin’s next cycle.

    • Bear target (end 2027): $90-$110
    • Base target (end 2027): $200-$240
    • Bull target (end 2027): $300-$360

    The $200+ base case requires Alpenglow to land cleanly, macro conditions to normalize, and BTC to push into a new all-time high range. None of those conditions is guaranteed, but they are all within the realm of historical precedent for this cycle.

    What to Watch in the Coming Weeks

    If you are tracking SOL, here are the key signals that will determine which scenario plays out:

    • $76.66: The April 2 low. A daily close below this level changes the short-term thesis.
    • $85-$86: The first real resistance on a recovery. Getting back above this zone cleanly would signal selling pressure is exhausting.
    • Bitcoin price action: SOL does not move independently. Watch BTC. A break above $75,000 for BTC would likely pull SOL higher.
    • Alpenglow testnet timeline: Any official Solana Foundation announcement about the Alpenglow public testnet date is a potential catalyst.
    • DeFi volume stability: If daily DeFi volume on Solana stays above $10 billion per day, the ecosystem is absorbing the shock. A sustained drop below $5 billion would be a warning sign.

    Disclaimer: This article is for informational and educational purposes only and should not be construed as financial, investment, or trading advice. Cryptocurrency markets are highly volatile, and past performance does not guarantee future results. The price predictions and analyses presented here are based on AI models, technical indicators, and available data at the time of writing. They are not guarantees. Always conduct your own research and consult with a qualified financial advisor before making any investment decisions. Pump Parade and its authors do not assume liability for financial losses incurred based on information provided in this article.

    About our AI predictions: Pump Parade’s price predictions are generated by machine learning models that analyze technical indicators, on-chain data, and market sentiment. These models have limitations and cannot account for black swan events, regulatory changes, or sudden market shifts. Prediction confidence scores reflect the model’s internal assessment, not guaranteed accuracy. Use AI predictions as one input among many in your research.
    Photon Review 2026: Fees, Features & Verdict

    0

    Looking for the fastest way to trade tokens on Solana? Photon has become one of the most popular trading terminals in the Solana ecosystem, processing billions of dollars in volume and generating over $421 million in platform fees. But is it actually worth the cost?

    In this review, we break down everything you need to know about Photon in 2026: its features, fees, security, user experience, and whether it deserves a spot in your trading toolkit.

    Quick Verdict: 4.0 / 5.0

    Photon is the best web-based trading terminal for active Solana traders who rely on charts and want fast execution. Its real-time candlestick charts, one-click trading, and built-in security filters make it feel like a CEX-grade experience for on-chain trading. The main drawback is the 1% fee on every transaction, which adds up quickly for high-volume traders. If speed and visual feedback matter more to you than saving on fees, Photon is hard to beat.

    What Is Photon?

    Photon is a web-based Solana trading terminal that lets you discover, analyze, and trade tokens directly from your browser. Unlike Telegram-based bots like Trojan or BonkBot, Photon provides a full visual interface with live charts, real-time trade feeds, and portfolio tracking. Think of it as a Bloomberg terminal for Solana memecoin and token trading.

    The platform connects to your Solana wallet (Phantom, Backpack, or Solflare) and routes trades through Solana DEXs like Raydium and Jupiter. It has quickly become one of the highest-revenue applications in the entire Solana ecosystem, which says a lot about how many traders rely on it daily.

    Photon Solana Trading Terminal Review 2026

    Key Features

    Real-Time Charts and Market Data

    Photon’s standout feature is its charting interface. You get live candlestick charts with volume indicators, price alerts, and multiple timeframe options. The data refreshes significantly faster than standalone chart tools like DexScreener, giving active traders a real edge when timing entries and exits. The chart view also includes a color-coded transaction history that shows buys and sells in real time, so you can see exactly what other traders are doing on a pair.

    One-Click Buy and Sell

    Speed is everything in Solana trading, especially for new token launches. Photon offers one-click buy and sell buttons with preset SOL amounts (0.25, 0.5, 1, 2, 5, 10 SOL). You can paste a token contract address and execute a buy in seconds. The platform uses private node infrastructure for faster transaction landing, and you can customize slippage tolerance, priority fees, and Jito bribes for each trade.

    Token Discovery and Security Filters

    The “New Pairs” tab continuously streams newly launched tokens on Solana. What makes Photon different from a raw token scanner is the built-in security filter layer. Before you invest, Photon checks each token for red flags: mint authority status, freeze authority, LP burn percentage, and top-holder concentration. These checks help you avoid rug pulls and honeypot tokens before you commit any capital.

    Advanced Order Types

    Beyond simple market orders, Photon supports limit orders and DCA (Dollar-Cost Averaging) orders. Limit orders let you set a target price and walk away, while DCA orders automatically split your buy into multiple smaller purchases over time. These features bring a level of sophistication that you typically only find on centralized exchanges.

    MEV Protection

    Sandwich attacks are a real problem on Solana DEXs. Photon addresses this with Smart-MEV toggles that offer “Fast” and “Secure” modes. The Secure mode uses Jito bundles to ensure your transactions are not sandwiched by predatory bots. The Fast mode optimizes for speed with threshold-based Jito bribes to increase transaction inclusion during congestion periods.

    Multi-Wallet Support and Portfolio Tracking

    You can connect multiple wallets and switch between them within the Photon interface. The Holdings tab provides live portfolio tracking with real-time updates on token values, security risk assessments, and overall performance metrics. This makes it easy to monitor all your positions without switching between multiple tools.

    Fees and Pricing

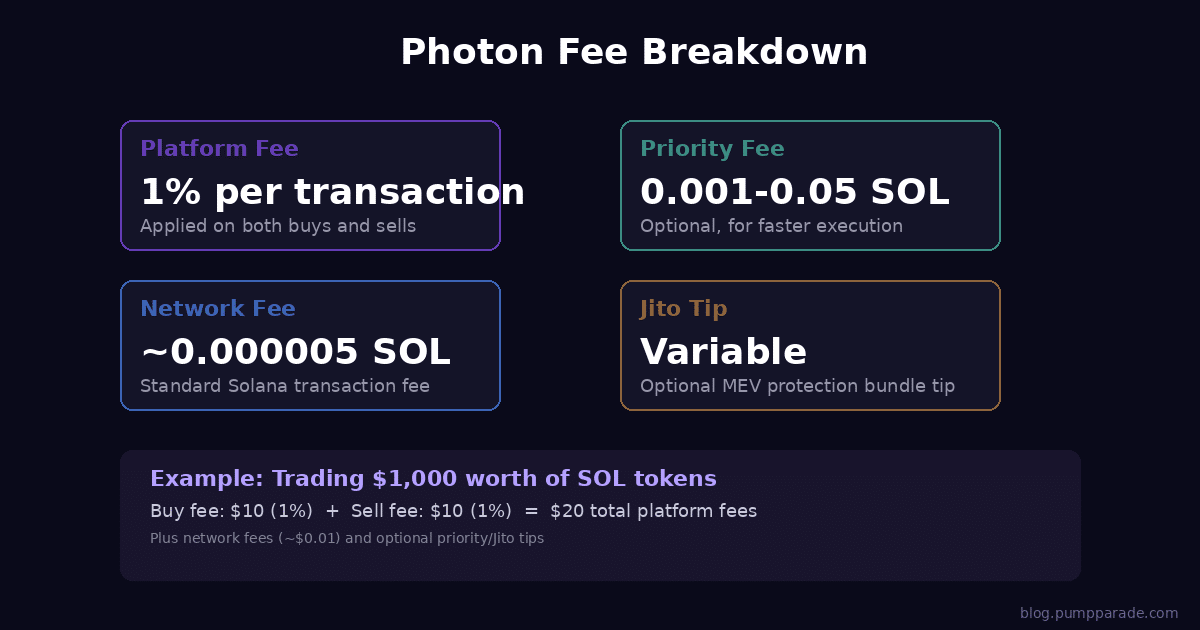
    Photon Fee Breakdown - 1% per transaction on buys and sells

    Photon charges a flat 1% platform fee on every transaction. This applies to both buys and sells, calculated on the SOL amount for buys and the gross sell proceeds for sells. So if you buy $1,000 worth of tokens, you pay $10 in platform fees on the buy, and another 1% when you sell.

    On top of the platform fee, standard Solana network fees apply (typically fractions of a cent). If you enable priority fees or Jito tips for faster execution, those costs are additional. Here is a quick breakdown of what you can expect to pay:

    • Platform fee: 1% on every buy and sell
    • Solana network fee: ~0.000005 SOL per transaction
    • Priority fee (optional): 0.001 to 0.05 SOL depending on congestion
    • Jito tip (optional): Variable, used for MEV protection bundles

    Is 1% expensive? Compared to alternatives like BullX (1% fee) and Trojan (0.9% fee), Photon is in the same ballpark. However, Jupiter’s native trading interface charges no platform fee at all, and some newer competitors offer 0.5% or lower. For high-frequency traders making dozens of trades per day, that 1% compounds significantly.

    Pros and Cons

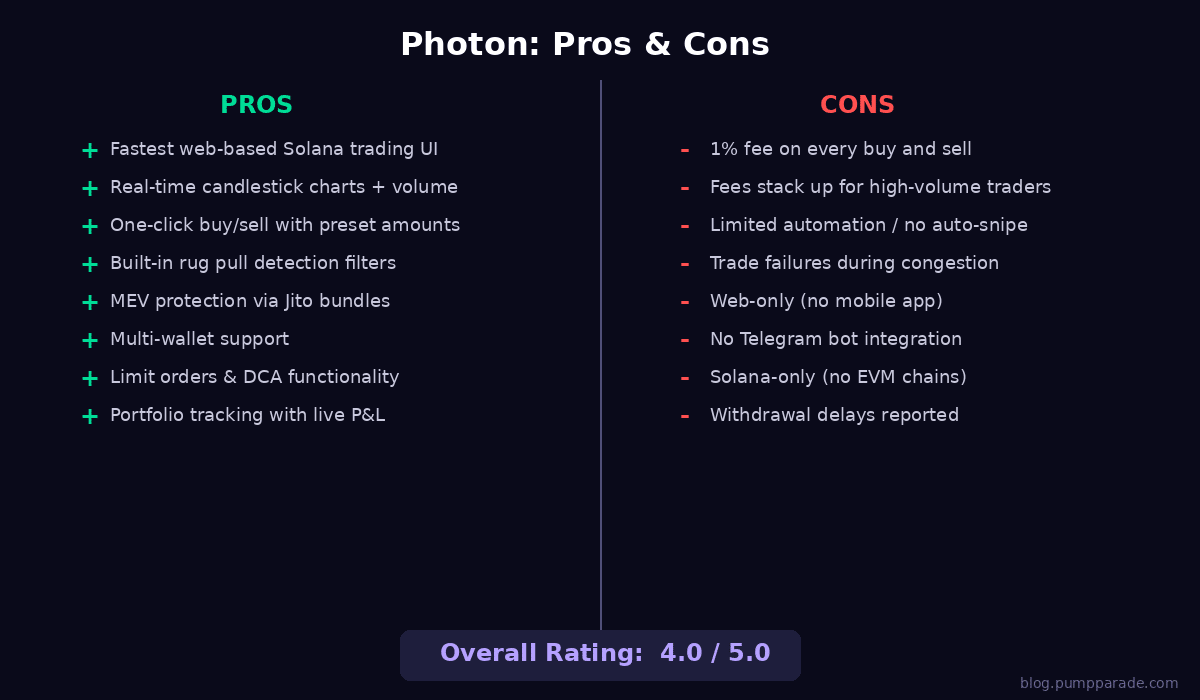
    Photon Pros and Cons Infographic

    Pros

    • Fastest web-based Solana trading UI with data refreshing faster than competing tools
    • Excellent visual interface with real-time candlestick charts, volume indicators, and color-coded trade histories
    • Built-in rug pull detection that checks mint authority, freeze authority, LP burns, and holder concentration
    • MEV protection via Jito bundles to prevent sandwich attacks
    • Limit orders and DCA for more sophisticated trading strategies
    • Multi-wallet support with easy switching between accounts
    • Portfolio tracking with live P&L and security risk monitoring

    Cons

    • 1% fee on every transaction adds up quickly for active traders
    • Transaction failures during congestion can cause missed opportunities, especially during memecoin launches
    • Limited automation compared to Telegram bots like Trojan or BonkBot
    • Web-only platform with no dedicated mobile app
    • Solana-only with no support for Ethereum or other EVM chains
    • Some reports of withdrawal delays from community members

    Security and Trust

    Photon is a non-custodial platform, meaning it never holds your funds. All trades are executed through your connected Solana wallet, and you maintain full control of your private keys at all times. The platform does not require KYC or account creation beyond connecting a wallet.

    On the security side, Photon’s built-in token scanning is one of its strongest features. The automated checks for mint authority, freeze authority, LP burn status, and holder concentration provide an extra layer of protection against rug pulls. However, no automated scanner is foolproof, and you should always do your own research before trading any token.

    The platform has generated over $421 million in cumulative fees, indicating a large and active user base. This track record, combined with its non-custodial architecture, gives it a reasonable trust profile. That said, the team behind Photon remains pseudonymous, which is common in the Solana trading bot space but worth noting.

    User Experience

    Getting started with Photon is straightforward. Visit photon-sol.tinyastro.io, connect your Phantom or Backpack wallet, and you are ready to trade. The interface is well-designed and feels responsive, with the trading dashboard loading quickly even on modest hardware.

    The learning curve is minimal if you have any experience with trading interfaces. The layout is intuitive: charts on the left, token info and trading controls on the right, with a navigation bar for New Pairs, Holdings, and Leaderboard. Power users will appreciate the ability to customize slippage, priority fees, and Jito settings for each trade.

    One area where Photon falls short is mobile. The platform is web-based and works in a mobile browser, but the experience is not optimized for small screens. If you do most of your trading on mobile, a Telegram-based bot like Trojan might be a better fit.

    If you are looking for a reliable Solana wallet to pair with Photon, check out our recent comparison of Phantom and Backpack.

    How Photon Compares to Alternatives

    Feature Photon BullX Trojan GMGN
    Platform Type Web terminal Web terminal Telegram bot Web + Telegram
    Fee 1% 1% 0.9% 1%
    Live Charts Yes Yes No Yes
    MEV Protection Yes (Jito) Yes Yes Yes
    Limit Orders Yes Yes Yes Yes
    DCA Orders Yes No Yes No
    Multi-Chain Solana only Multi-chain Multi-chain Multi-chain
    Mobile App No No Telegram Telegram
    Rug Detection Yes Yes Basic Yes

    Photon stands out for its charting quality and execution speed. BullX offers a similar web-based experience with multi-chain support. Trojan is the go-to for traders who prefer Telegram and want slightly lower fees. GMGN offers both a web interface and Telegram bot, making it a versatile option.

    Verdict: Is Photon Worth It in 2026?

    Rating: 4.0 / 5.0

    Photon is the best choice for active Solana traders who want a professional-grade visual trading experience. If you rely on charts, want fast execution, and appreciate built-in security scanning, Photon delivers all of that in a polished web interface.

    The 1% fee is the main consideration. For casual traders making a few swaps per week, it is a reasonable cost of convenience. For high-frequency traders or those working with large positions, the fees add up and you may want to consider routing larger trades through Jupiter directly.

    Use Photon if: You want the fastest charts, one-click trading, and built-in security on Solana. You value visual feedback and a desktop trading experience.

    Skip Photon if: You trade primarily on mobile, need multi-chain support, or make high-frequency trades where the 1% fee significantly cuts into your profits.

    Ready to try it? Visit Photon and connect your Solana wallet to get started.

    FAQ

    Is Photon safe to use?

    Photon is a non-custodial platform, so it never holds your funds. All trades execute through your connected wallet. The platform also includes built-in token security scans to help you avoid rug pulls. However, the team behind Photon is pseudonymous, which is standard for the Solana bot ecosystem.

    How much does Photon cost?

    Photon charges a 1% platform fee on every buy and sell transaction. Standard Solana network fees also apply, and you can optionally add priority fees or Jito tips for faster execution.

    Does Photon work on mobile?

    Photon is a web-based platform and can be accessed through a mobile browser, but the interface is optimized for desktop. For mobile trading, Telegram-based bots like Trojan or BonkBot offer a better experience.

    What wallets does Photon support?

    Photon supports Phantom, Backpack, Solflare, and other Solana-compatible wallets. You can also use multiple wallets simultaneously and switch between them in the interface.

    Can I use Photon for Ethereum or other chains?

    No. As of 2026, Photon is exclusively a Solana trading terminal. If you need multi-chain support, consider alternatives like BullX or GMGN that support Ethereum and other EVM chains alongside Solana.

    Pippin (PIPPIN) Price Prediction 2026: Can It Recover?

    Pippin (PIPPIN) is trading at $0.062 as of April 2, 2026. That puts it 93% below its all-time high of $0.89, set on February 26. Yet today it is trending as the number-four most active token on Birdeye, with 1,838 unique wallets trading it in the last 24 hours and $20.3 million in volume. The question every PIPPIN holder is asking is simple: is this a dead cat bounce, or the start of a real recovery?

    This article breaks down the data, the bull case, the bear case, and our AI model’s price targets for the next 30 days, 6 months, and through 2027-2028.

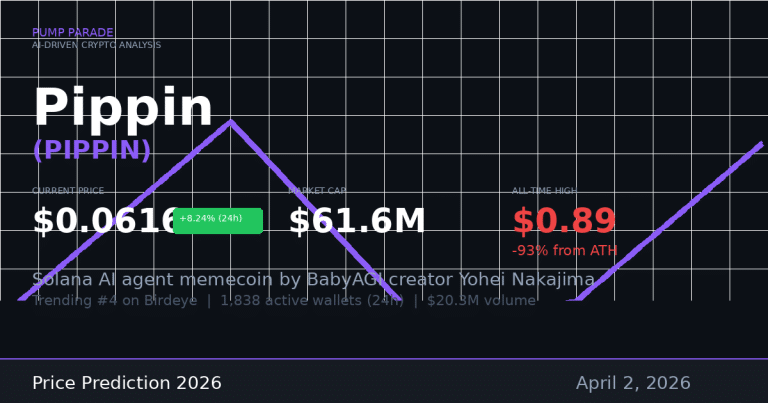
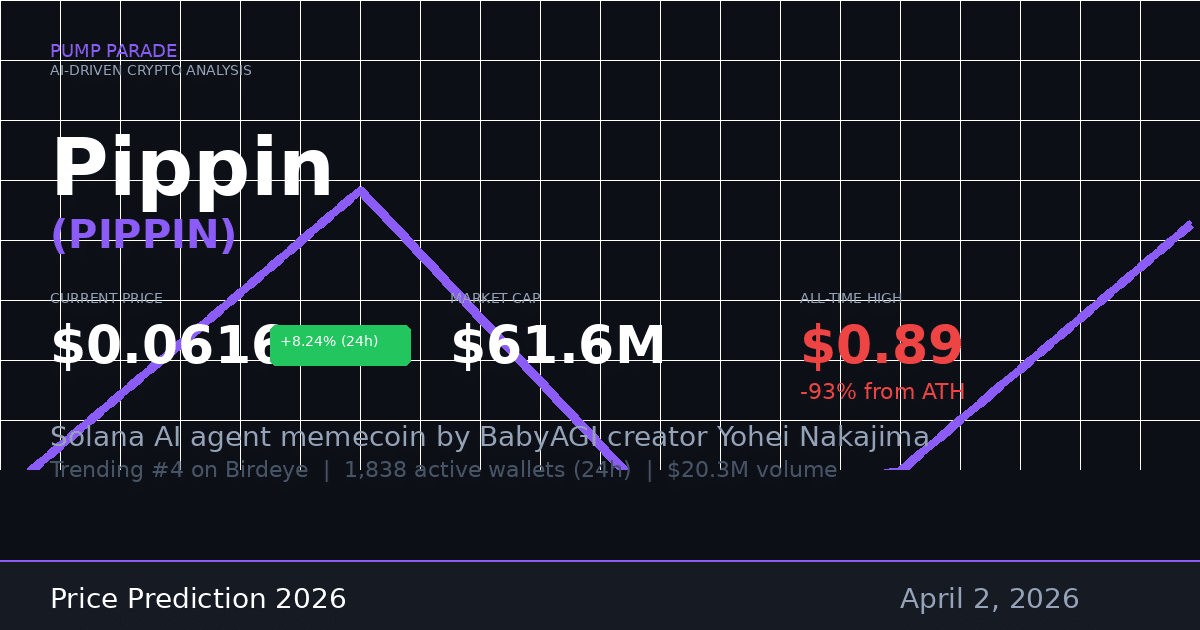
    Pippin PIPPIN price prediction hero image April 2026 showing current price $0.062 and market cap $61.6M

    What Is Pippin (PIPPIN)?

    Pippin is a Solana-based AI agent memecoin. It was created by Yohei Nakajima, the venture capitalist behind BabyAGI, the open-source autonomous AI agent framework. In late 2024, Nakajima used ChatGPT to generate an SVG unicorn image, gave it the name Pippin, and built an open-source autonomous agent framework around it on GitHub.

    The project sits at the intersection of two of 2024-2025’s biggest crypto narratives: Solana memecoins and AI agents. That combination drove it to a $900 million market cap peak in February 2026. Since then, the market has re-rated the token sharply lower, as investors questioned whether the AI-agent angle was substance or story.

    Key metrics as of April 2, 2026:

    • Current price: $0.0616
    • Market cap: $61.6 million
    • Circulating supply: ~1 billion PIPPIN
    • Liquidity (on-chain): $5.9 million
    • 24-hour trading volume: $20.3 million
    • Holder count: 45,492 wallets
    • All-time high: $0.89 (February 26, 2026)

    You can track the live price and on-chain data on CoinGecko’s Pippin page.

    PIPPIN Price History: From $0.89 to $0.06

    The PIPPIN chart tells a familiar story in crypto: a euphoric run, a brutal correction, and now a potential base formation.

    In early March 2026, PIPPIN was still trading around $0.028-$0.031. Then selling accelerated. By late March, prices had compressed into the $0.011-$0.015 range, a range that held for most of the last two weeks of the month. Volume on high-selling days hit $138 million, suggesting significant distribution took place.

    The sharp price decline was not without catalysts. Reporting from CryptoTimes noted that Bubblemaps on-chain data showed a high concentration of supply in interconnected insider wallets. That data spooked holders who were already watching the AI-agent narrative cool. The result: an 85-93% drawdown from peak in under 45 days.

    Today’s price of $0.062 is back above the late-March range. Whether that represents new demand or a short-term relief rally is what the technical picture and on-chain signals need to answer.

    Technical Analysis: Support, Resistance, and Key Levels

    Here is what the chart is telling us right now.

    Support Levels

    The $0.011-$0.015 zone acted as support throughout late March. PIPPIN tested this band multiple times over two weeks without breaking lower. That establishes it as the key near-term floor. A close back below $0.013 would be a bearish sign and would suggest the bounce has run out of energy.

    A secondary support sits around $0.025, which was the last area of consolidation before the late-March sell-off accelerated. If PIPPIN can hold above this level on any pullback, that is a constructive sign.

    Resistance Levels

    The first major resistance sits at $0.08-$0.10. This was a congestion zone in mid-to-late March before sellers took control. Flipping $0.10 into support would open the door to $0.15.

    Above that, the $0.20 level is significant. It was the last area where the price spent meaningful time on the way up to the ATH. Reclaiming $0.20 would change the narrative from “dead project” to “recovery in progress.”

    Volume and Momentum Signals

    The RSI (Relative Strength Index, a momentum indicator that measures overbought and oversold conditions) came off extremely oversold readings in late March. A bounce from oversold RSI territory is not a buy signal by itself. But the combination of rising price, rising volume, and a trend break above the late-March range gives the bulls a reasonable short-term setup.

    The 24-hour volume-to-market-cap ratio sits at roughly 33% today. That is high. It indicates either strong speculative interest or a short squeeze. Either way, it is worth watching.

    Bull Case for PIPPIN in 2026

    Here is the argument for why PIPPIN could recover meaningfully from current levels.

    The AI agent narrative is not dead. Broader AI agent tokens have shown resilience in 2026. Bittensor (TAO) and other AI-native projects have recovered strongly. If the sector rotates back into focus, PIPPIN is one of the more recognizable names in the Solana AI-agent space.

    Yohei Nakajima has credibility. The creator of BabyAGI is a genuine figure in the AI research community. His connection to the project gives it more legitimacy than a typical anonymous Solana memecoin. If he continues building the open-source agent framework on GitHub, the project maintains a story beyond pure speculation.

    The Solana ecosystem is strong. Solana continues to process more transaction volume than most competing chains. If you are looking for Solana memecoins with genuine on-chain activity, PIPPIN’s liquidity depth of $5.9 million and 45,000-plus holders give it more staying power than typical pump-and-dump tokens.

    The price base is forming. After weeks of sideways compression in the $0.011-$0.015 range, the token is showing signs of accumulation. Low-price ranges that hold over multiple weeks often precede trend reversals.

    Bear Case for PIPPIN in 2026

    The risks here are real and should not be minimized.

    High insider concentration. On-chain analysis from Bubblemaps found that roughly 80% of supply is controlled by interconnected wallets. This is a serious red flag. It means a relatively small group of holders can coordinate large sell pressure at any time, regardless of market conditions.

    No hard utility. Outside of the AI-agent GitHub framework and community storytelling, PIPPIN has no revenue, no protocol fees, and no DeFi integration. Its price is entirely sentiment-driven. When sentiment fades, there is no floor from fundamentals.

    The bounce may not hold. High-volume bounces from deeply oversold territory are common in crypto. Many of them fail within 2-4 weeks as sellers use the recovery to exit positions they could not sell at lower prices. The $0.062 price could mark the top of a dead-cat bounce rather than the start of a recovery.

    Broader macro risk. Bitcoin has been showing volatility in early April 2026. If BTC sees a sharp correction, speculative Solana memecoins with no fundamental floor are typically among the hardest-hit assets.

    PIPPIN Price Predictions: Short, Mid, and Long Term

    Our hybrid AI model combines technical indicator analysis, on-chain volume trends, liquidity data, and comparable-asset modeling. Here are the price prediction scenarios for three timeframes.

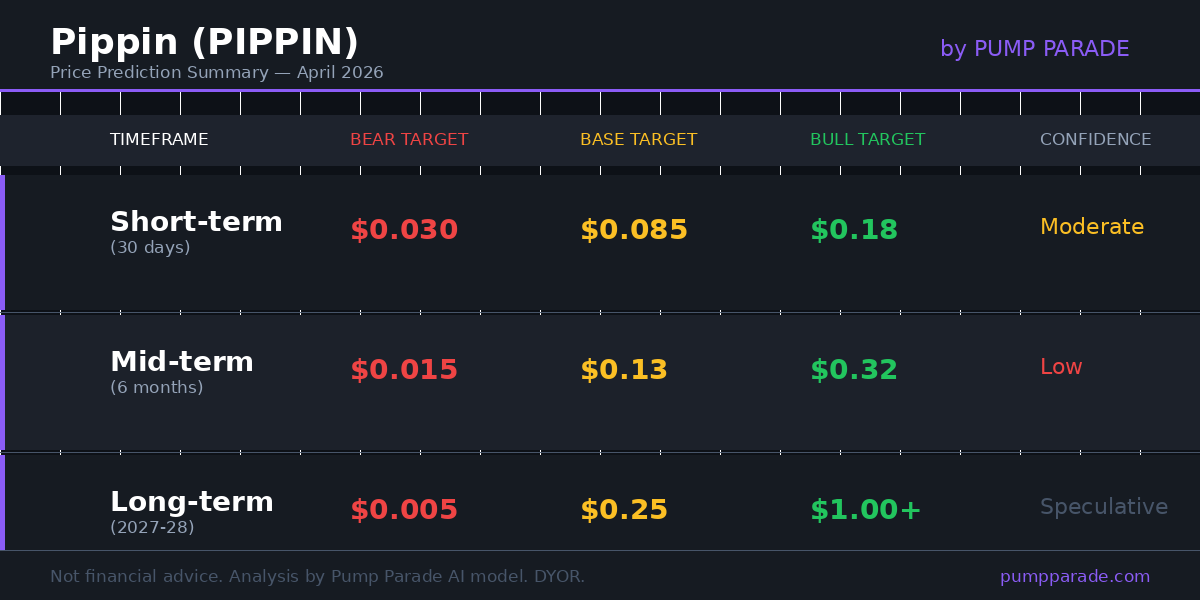
    Pippin PIPPIN price prediction summary table showing bear base and bull targets for 30 days 6 months and 2027-2028

    Short-Term: 30 Days (by May 2026)

    The immediate question is whether the current bounce holds or fails. The data points to a trading range rather than a strong directional move in the next 30 days.

    • Bear target: $0.030. A failure to hold above $0.05 support would likely see price drift back toward the late-March lows. $0.030 is a realistic landing zone on renewed selling.
    • Base target: $0.085. If volume stays elevated and the token holds above $0.05, a grind toward the first major resistance at $0.08-$0.10 is the most likely near-term path.
    • Bull target: $0.18. A positive catalyst (new Nakajima AI-agent announcement, Solana ecosystem momentum, or broad memecoin rotation) could push the token toward its next major resistance zone.

    Mid-Term: 6 Months (by October 2026)

    At the 6-month horizon, the uncertainty increases significantly. PIPPIN’s fate depends heavily on whether the AI-agent narrative regains momentum and whether the project can build any sustained utility.

    • Bear target: $0.015. If broader memecoin sentiment deteriorates and no new catalysts emerge, PIPPIN likely re-tests or breaks the late-March lows. At this level, the project risks becoming illiquid and orphaned.
    • Base target: $0.13. Moderate recovery in line with improved Solana sentiment and continued community activity. This would represent roughly a 2x from current levels.
    • Bull target: $0.32. If the AI-agent sector sees a strong narrative catalyst and PIPPIN captures the rotation, a recovery toward the 50% Fibonacci retracement from ATH is possible.

    Long-Term: 2027-2028

    Long-range price predictions for speculative memecoins carry very low confidence. That said, the model can still identify the scenario range.

    • Bear target: $0.005 or effectively zero. Most memecoins do not survive 2-3 year cycles without sustained utility development. If PIPPIN fails to build real use cases, it likely fades into irrelevance.
    • Base target: $0.25. If the project evolves alongside the broader AI agent ecosystem and maintains a community of active builders, PIPPIN could appreciate meaningfully with crypto market cycles.
    • Bull target: $1.00 and beyond. The bull case requires PIPPIN to become the canonical Solana AI-agent mascot and for the AI-agent narrative to drive a fresh wave of capital into the sector. This is a low-probability, high-upside scenario.

    What to Watch

    If you are tracking PIPPIN over the coming weeks, here are the key signals to monitor:

    • Price relative to $0.05: Holding above $0.05 on any pullback is the key near-term health signal.
    • Daily volume: Sustained daily volume above $10 million indicates real interest. Volume dropping below $3 million on a recovery attempt is a warning sign.
    • GitHub activity: Watch the pippin_moves GitHub repository for new commits. Development activity supports the long-term narrative.
    • Insider wallet movement: Monitor Bubblemaps for signs of large wallets distributing into strength. This is the single biggest tail risk for PIPPIN.
    • Solana ecosystem flows: PIPPIN tends to outperform on days when Solana sees strong overall volume. If Solana-wide trading activity picks up, small-cap Solana tokens often benefit.

    The Bottom Line

    PIPPIN is one of the more interesting risk-reward setups on Solana right now, but only for those who understand what they are buying. This is not a project with revenue, product-market fit, or a clear roadmap to utility. It is a speculative AI-flavored memecoin with a recognizable creator, a strong community, and a chart that has just bounced hard from a multi-week base.

    The bull case is real: a name-brand creator, genuine on-chain activity, and an AI-agent narrative that may not be finished. The bear case is also real: insider concentration, no utility floor, and a history of vicious drawdowns.

    Our model’s base case puts PIPPIN at $0.085 over the next 30 days and $0.13 by October 2026. The bull case targets $0.18 and $0.32 respectively. Neither of those targets looks unreasonable. But the $0.005 long-term bear scenario is just as mathematically possible if sentiment never returns.

    Trade the setup you see, not the story you want to believe.


    Disclaimer: This article is for informational and educational purposes only and should not be construed as financial, investment, or trading advice. Cryptocurrency markets are highly volatile, and past performance does not guarantee future results. The price predictions and analyses presented here are based on AI models, technical indicators, and available data at the time of writing. They are not guarantees. Always conduct your own research (DYOR) and consult with a qualified financial advisor before making any investment decisions. Pump Parade and its authors do not assume liability for financial losses incurred based on information provided in this article.

    About our AI predictions: Pump Parade’s price predictions are generated by machine learning models that analyze technical indicators, on-chain data, and market sentiment. These models have limitations and cannot account for black swan events, regulatory changes, or sudden market shifts. Prediction confidence scores reflect the model’s internal assessment, not guaranteed accuracy. Use AI predictions as one input among many in your research.
    Raydium (RAY) Price Prediction 2026

    0

    Raydium (RAY) Is Having a Moment

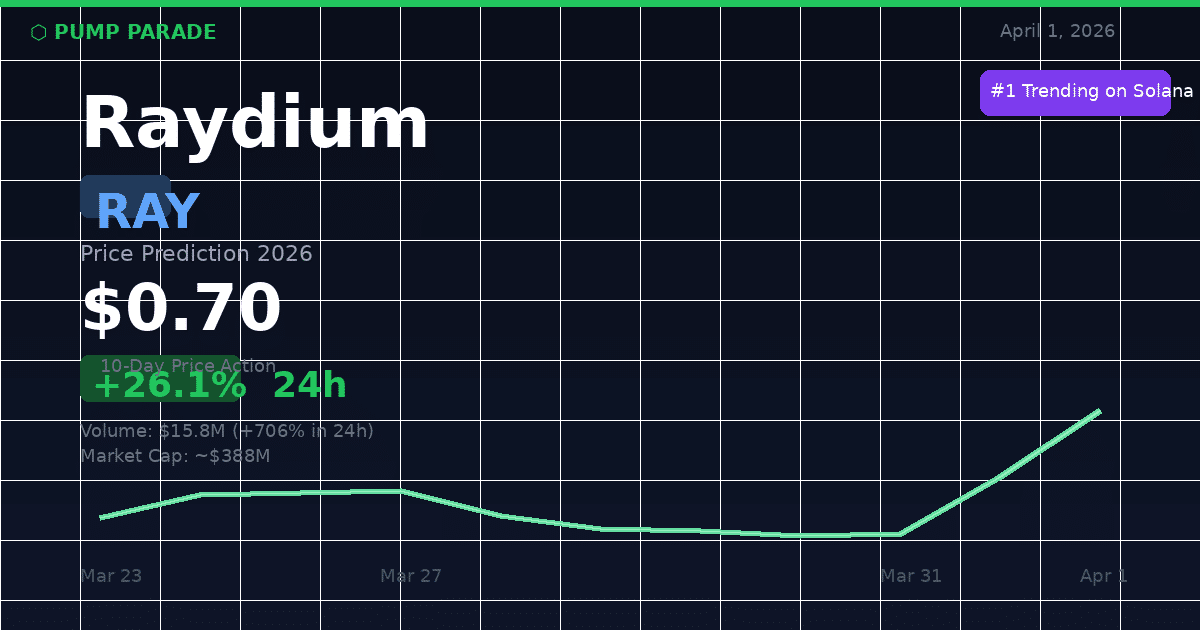
    Raydium is up 26% today. Its trading volume just spiked 706% in 24 hours. And it’s sitting at the top of Birdeye’s trending list for the Solana ecosystem.

    At time of writing, RAY is trading at $0.70, up from a recent low of $0.54 on March 29. That’s a 30% recovery in just three days. The question is whether this is a genuine trend reversal or a short-lived pump. Let’s look at the data.

    Raydium RAY price prediction 2026 hero image showing current price $0.70 and 26% 24h gain

    What Is Raydium?

    Raydium is one of Solana’s oldest and most important decentralized exchanges (DEXs). Think of it as the backbone of Solana’s trading infrastructure. It connects to Solana’s central order book and provides deep liquidity for thousands of token pairs.

    RAY is the protocol’s native token. It’s used for staking, governance, and as a fee-sharing mechanism for liquidity providers. More importantly, a portion of platform fees are used to buy back RAY from the open market. That buyback mechanism is central to RAY’s value thesis.

    Key metrics at time of writing:

    • Price: $0.70
    • 24h change: +26.1%
    • 24h volume: $15.8M (up 706% from prior day)
    • Market cap: ~$388M
    • Liquidity (on-chain): $10M

    What’s Driving the Surge?

    Two things are behind RAY’s price action right now.

    LaunchLab: Raydium’s Answer to Pump.fun

    Raydium launched LaunchLab, its own token launchpad that competes directly with Pump.fun. The platform allows anyone to create and launch tokens using customizable bonding curves. Third-party platforms can set their own fees on top.

    Here’s the part that matters for RAY holders: 25% of all LaunchLab fees go toward buying back RAY. Pump.fun had previously been routing $31.7B in trading volume through its own pools rather than Raydium’s. LaunchLab is designed to capture that revenue back.

    Since launch, LaunchLab has already facilitated over 3,700 new token creations. Pump.fun still leads daily token generation with over 60% market share, but the gap is narrowing.

    Broader Solana Ecosystem Momentum

    Solana is trading at $83.32 today, with $12.2B in 24-hour volume across the ecosystem. When Solana heats up, its DeFi tokens tend to follow. Raydium sits at the center of that activity, capturing fees from every trade that flows through it.

    If you want to understand where Solana is headed as a whole, check our Solana (SOL) price prediction for 2026 for full context on the network’s upgrade cycle.

    Technical Analysis: What the Chart Says

    RAY spent most of March consolidating between $0.56 and $0.62. That range held for nearly two weeks, building a solid base.

    On March 31, the first breakout candle appeared. Volume jumped to 8.9M units, more than double the prior week’s average. Today (April 1), volume has already hit 16.8M units with the session still open. Price pushed as high as $0.74 intraday.

    Here are the key levels to watch:

    • Support: $0.56 to $0.58 (prior consolidation base)
    • Secondary support: $0.62 (breakout level, now acting as floor)
    • Resistance: $0.74 to $0.75 (today’s intraday high)
    • Next resistance: $1.00 (psychological level)
    • Major resistance: $2.33 to $2.50 (RAY’s previous post-announcement high)

    The RSI on the 4-hour chart was running in neutral territory (45 to 50 range) before this breakout. That means the move started from an uncrowded position, not from an already overbought state. That’s a healthier setup than a spike from elevated RSI.

    The 50-day moving average on the 4-hour chart has been rising since March 18. That’s the first sign of sustained short-term momentum building. On the daily chart, the 200-day moving average is still declining. Until that flips, the longer-term recovery hasn’t fully confirmed. That’s the key tension in this setup.

    You can track RAY’s real-time price and volume data on Birdeye’s Raydium analytics page.

    The Bull Case for RAY

    The optimistic scenario rests on a few converging factors.

    Revenue flywheel from LaunchLab. If LaunchLab captures even 20 to 30% of Pump.fun’s current daily volume, the fee revenue flowing back to RAY buybacks could be substantial. More buying pressure on a relatively small float pushes price up.

    Perpetuals trading launch. Raydium has also launched a decentralized perpetuals trading platform. Perps are where the real fee volume lives in DeFi. Even a modest capture of Solana’s derivatives flow would move the needle for RAY.

    Solana ecosystem recovery. SOL is still down roughly 50% from its all-time high. If SOL recovers toward the $150 to $200 range (as many analysts expect through 2026), ecosystem tokens like RAY historically outperform the underlying chain on percentage gains.

    Historical context. When RAY had positive protocol momentum in late 2024 and early 2025, it traded above $5. That’s not a price target, it’s context. The protocol is more developed now, and the LaunchLab fee mechanism gives it a stronger fundamental anchor than it had then.

    The Bear Case for RAY

    The data also tells a more cautious story.

    Pump.fun still dominates. Over 60% of new Solana token launches still go through Pump.fun. Until LaunchLab meaningfully dents that lead, the fee revenue thesis depends on an outcome that hasn’t happened yet.

    Volume spikes can reverse fast. Today’s 706% volume increase is notable. But single-day volume explosions in mid-cap DeFi tokens often fade within 48 to 72 hours. If this is a short squeeze rather than a trend change, RAY could give back the gains quickly.

    Daily chart weakness. The 200-day moving average on the daily chart is still declining. Until that flips, the longer-term trend remains in question. Any macro selloff in crypto could send RAY back toward the $0.54 to $0.56 support zone.

    Competitor pressure. Meteora and Jupiter continue to gain liquidity share on Solana. Raydium’s dominance isn’t guaranteed in a competitive ecosystem.

    AI Price Prediction Summary

    Our hybrid AI model combines on-chain volume data, technical indicators, historical price patterns, and protocol revenue signals. Here’s what it outputs for RAY at current levels:

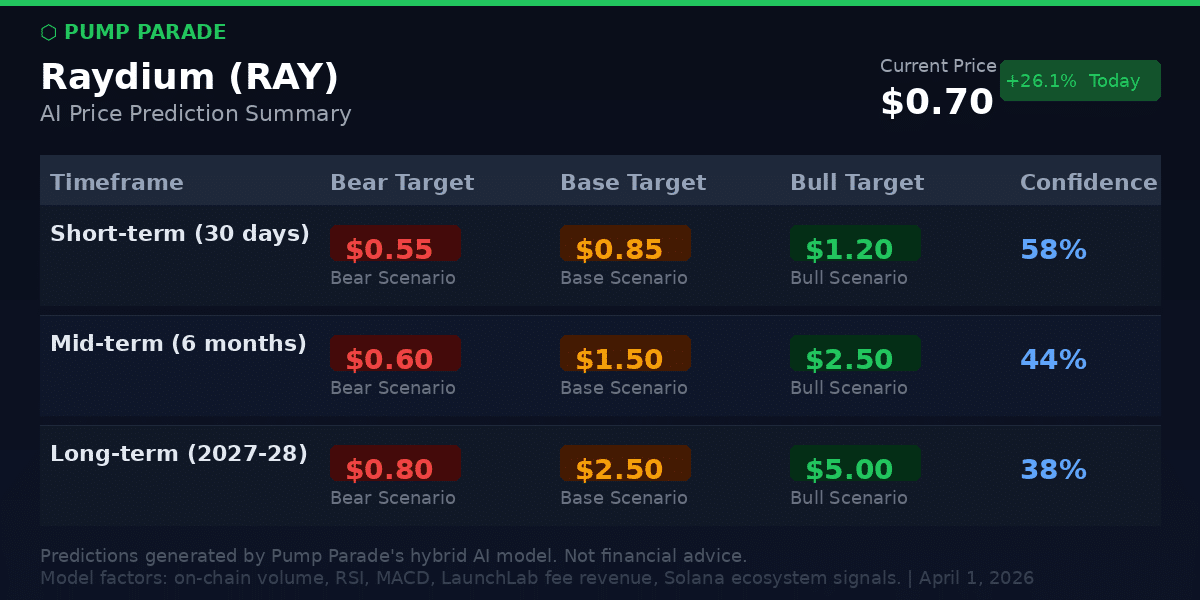
    Raydium RAY price prediction table showing bear, base, and bull targets for 30 days, 6 months, and 2027-2028

    The model assigns a 58% probability that RAY tests the $1.00 level within 30 days if today’s volume trend persists through the week. It assigns a 35% probability that RAY pulls back to the $0.56 to $0.62 range before attempting another leg higher. The remaining 7% accounts for extreme scenarios in either direction.

    For the medium and long term, the model’s base case assumes LaunchLab captures 15 to 20% of Solana launchpad volume by end of 2026. It also assumes the perpetuals platform generates meaningful fee revenue. Those assumptions drive the $1.50 to $2.00 medium-term range.

    What to Watch

    If you’re tracking RAY, here are the signals that matter:

    • LaunchLab daily volume relative to Pump.fun. If LaunchLab crosses 30% market share, that’s a meaningful bull signal.
    • RAY buyback data on-chain. More buybacks mean more genuine demand, not just speculative buying.
    • $0.74 to $0.75 resistance. A daily close above this level with sustained volume would confirm the breakout is real.
    • $0.56 support. A breakdown below this level on high volume would suggest the move was a false breakout.
    • SOL price action. RAY is highly correlated to Solana’s broader trajectory. If SOL drops below $75, expect RAY to follow.

    The Bottom Line

    Raydium has a genuine catalyst behind today’s move. LaunchLab’s fee buyback mechanism gives RAY real fundamental support that didn’t exist six months ago. The perpetuals platform adds another potential revenue stream.

    But this is still a mid-cap DeFi token on a chain that has its own volatility risks. Today’s 706% volume spike is exciting. It’s also a signal to be careful about chasing at the highs. The setup looks constructive if $0.62 holds as support on any pullback.

    The bull case is data-backed. So is the bear case. Monitor the levels, watch the LaunchLab volume share, and size your position accordingly.


    Disclaimer: This article is for informational and educational purposes only and should not be construed as financial, investment, or trading advice. Cryptocurrency markets are highly volatile, and past performance does not guarantee future results. The price predictions and analyses presented here are based on AI models, technical indicators, and available data at the time of writing. They are not guarantees. Always conduct your own research (DYOR) and consult with a qualified financial advisor before making any investment decisions. Pump Parade and its authors do not assume liability for financial losses incurred based on information provided in this article.

    About our AI predictions: Pump Parade’s price predictions are generated by machine learning models that analyze technical indicators, on-chain data, and market sentiment. These models have limitations and cannot account for black swan events, regulatory changes, or sudden market shifts. Prediction confidence scores reflect the model’s internal assessment, not guaranteed accuracy. Use AI predictions as one input among many in your research.
    Phantom vs Backpack: Best Solana Wallet 2026

    0

    Phantom has 17 million monthly active users. Backpack just launched its $BP token to a community that drove over $400 billion in cumulative trading volume. Both wallets claim to be the best way to interact with Solana and beyond. But they take fundamentally different approaches to what a crypto wallet should be.

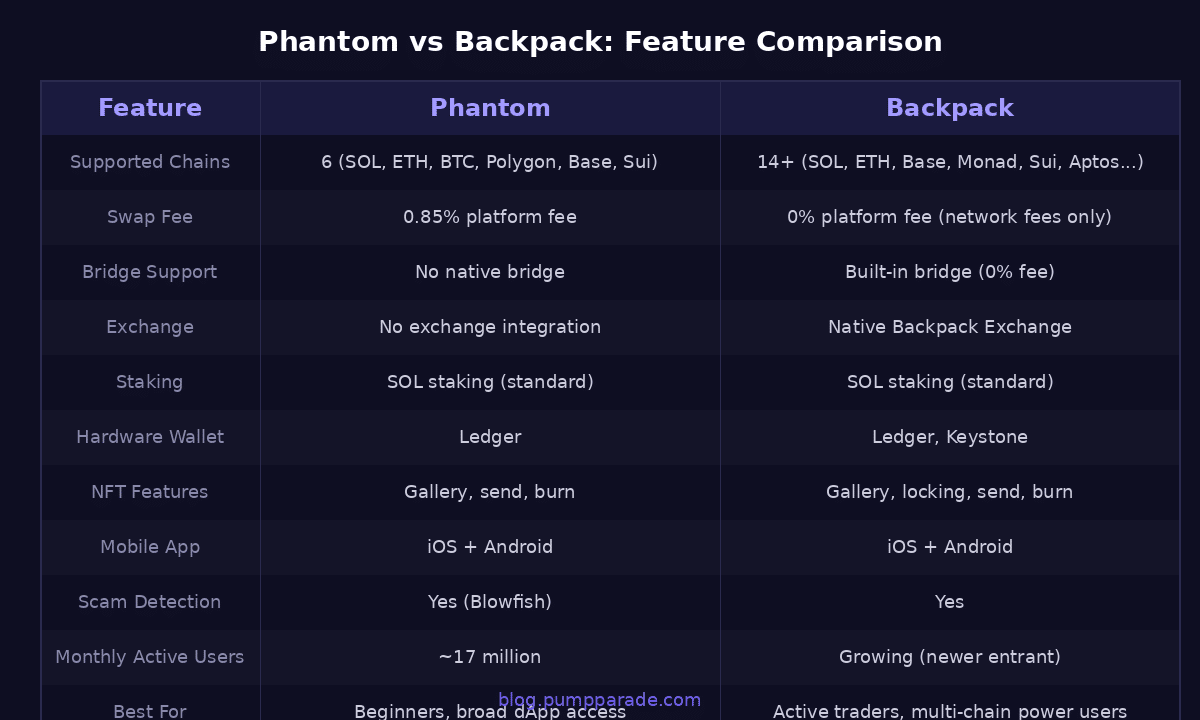
    Phantom is the established market leader with a 39.4% share of the Solana wallet ecosystem, a $3 billion valuation, and support across six blockchains. Backpack is the challenger that bundles a wallet with a regulated exchange, supports 14+ chains, and charges zero platform fees on swaps. If you’re choosing between them in 2026, the right pick depends on how you actually use crypto.

    Here’s the full breakdown.

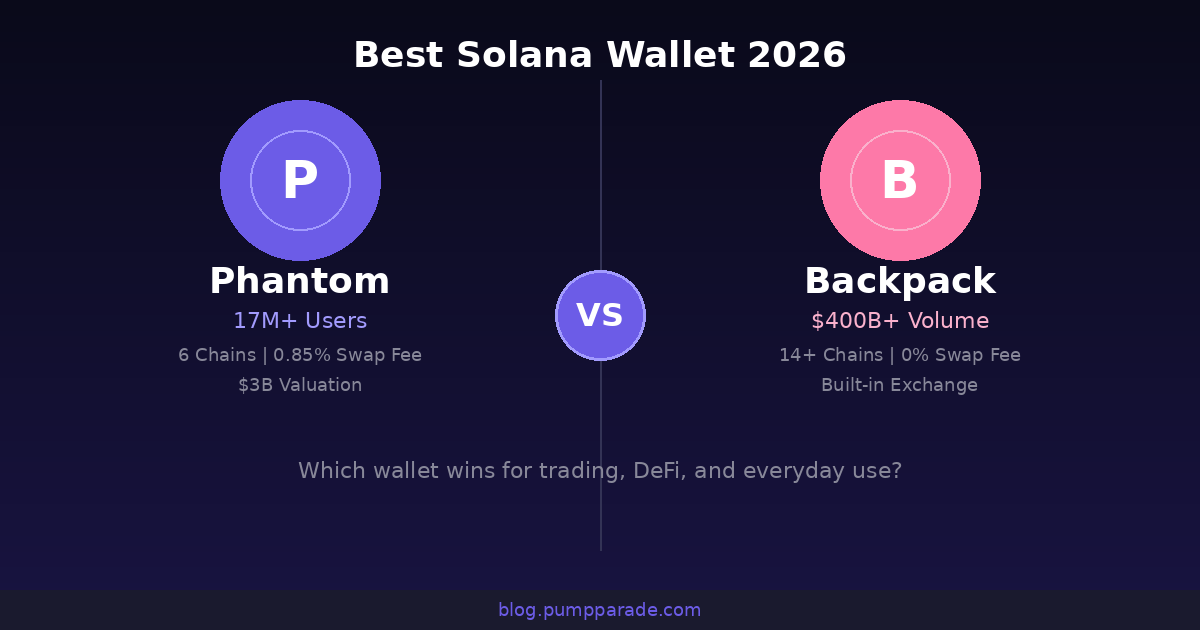
    Phantom vs Backpack Wallet comparison 2026 showing key stats for both Solana wallets

    Quick Verdict: Who Wins?

    Choose Phantom if you want the most battle-tested Solana wallet with the largest dApp ecosystem, beginner-friendly interface, and a proven security track record. Phantom is the safer default choice for most users.

    Choose Backpack if you’re an active trader who wants zero swap fees, built-in exchange access, support for 14+ chains, and features like NFT locking. Backpack offers more raw value for power users willing to adopt a newer platform.

    Bottom line: Phantom wins on trust and ecosystem reach. Backpack wins on fees and trader-focused features. Neither is a bad choice, but they serve different users.

    Product Overview

    Phantom

    Phantom launched in 2021 as a Solana-native wallet and quickly became the ecosystem’s dominant self-custodial option. In January 2025, it closed a $150 million Series C at a $3 billion valuation. By early 2026, it reports nearly 17 million monthly active users and has processed over 850 million on-chain transactions in a single year.

    The wallet has expanded to support six blockchains: Solana, Ethereum, Bitcoin, Polygon, Base, and Sui. In March 2026, Phantom secured a no-action letter from the CFTC, clearing a path for wallet-level access to regulated derivatives markets. That’s a regulatory milestone no other consumer wallet has achieved.

    Phantom is available as a browser extension (Chrome, Firefox, Brave, Edge) and mobile app (iOS and Android).

    Backpack

    Backpack started as an xNFT wallet built around executable NFTs, then pivoted to become a combined wallet-and-exchange ecosystem. The Backpack Exchange launched with regulatory licenses in multiple jurisdictions and the wallet acts as a seamless gateway to that exchange.

    On March 23, 2026, Backpack held its Token Generation Event for $BP, distributing 100% of its initial circulating supply to the community. The total supply is 1 billion tokens. The platform also introduced an on-chain IPO access service, allowing users to participate in initial public offerings settled through Solana.

    Backpack supports 14+ blockchains including Solana, Ethereum, Base, Monad, Sui, Aptos, BNB Chain, Arbitrum, Polygon, Sei, Optimism, and Berachain. It’s available as a browser extension and mobile app.

    Features Deep Dive

    Swaps and Trading

    This is where the two wallets diverge most sharply. Phantom charges a 0.85% platform fee on in-app swaps, plus network gas fees. On Solana mobile, gasless swaps are available at a 1.5% all-in fee when the trade qualifies. Cross-chain swaps add a bridge provider fee of approximately 0.3%.

    Backpack charges 0% platform fees on swaps and bridges within the wallet. Users pay only Solana network fees and liquidity-related costs. For frequent traders, that 0.85% difference adds up fast. On $10,000 in monthly swap volume, you’d save roughly $85 per month with Backpack.

    Multi-Chain Support

    Backpack supports more than double the chains Phantom does. With 14+ networks versus Phantom’s 6, Backpack covers emerging ecosystems like Monad, Aptos, Berachain, and HyperEVM that Phantom doesn’t touch yet. If you’re active across DeFi on newer L1s and L2s, Backpack gives you a single interface for all of them.

    That said, Phantom’s chain coverage includes Bitcoin (native and Taproot), which Backpack doesn’t offer. If you hold BTC alongside your SOL and ETH, Phantom is the only option here that consolidates everything.

    Exchange Integration

    Backpack’s built-in exchange connection is a feature Phantom simply doesn’t have. You can move funds between your Backpack wallet and the Backpack Exchange without bridging or withdrawal fees. For traders who need both a self-custodial wallet and centralized exchange access, this is a significant workflow advantage.

    Phantom has no exchange integration. To move funds to a CEX, you send a standard on-chain transfer like you would from any other wallet.

    Bridging

    Backpack includes a native bridge at 0% platform fee. Phantom does not have a built-in bridge. If you need to move assets between chains in Phantom, you’ll use a third-party bridge like Wormhole or deBridge, which means extra steps and potentially higher fees.

    NFT Features

    Both wallets offer NFT galleries, sending, and burning. Backpack adds NFT collection locking, which prevents unauthorized transfers of specific collections. This is a niche but valuable security feature if you hold high-value NFTs. Phantom includes scam NFT detection powered by Blowfish, automatically flagging suspicious airdrops.

    Staking

    Both support standard SOL staking through validators. Neither offers a meaningfully differentiated staking experience. If advanced validator selection and staking controls matter to you, Solflare (a Solana-only wallet) is actually the better option in that specific category.

    Fees and Pricing

    Phantom vs Backpack wallet comparison table showing features, fees, and supported chains
    Fee Type Phantom Backpack
    Swap Fee 0.85% 0%
    Gasless Swap (Solana Mobile) 1.5% N/A
    Bridge Fee No native bridge (~0.3% via third party) 0%
    Cross-Chain Swap 0.85% + ~0.3% bridge Network fees only
    Network Gas Standard (user pays) Standard (user pays)
    Staking Fee Validator-dependent Validator-dependent

    Backpack has a clear fee advantage across every category. The 0% swap fee is particularly notable because most competing wallets charge between 0.5% and 1%. Phantom’s 0.85% is in line with the industry but above what Backpack offers.

    Pros and Cons

    Phantom

    Pros:

    • Largest user base (17M+ MAUs) with the most extensive dApp compatibility on Solana
    • $3 billion valuation and $150M Series C signals long-term stability
    • CFTC no-action letter positions it for regulated financial products
    • Bitcoin support (native + Taproot) in addition to EVM and Solana
    • Blowfish-powered scam detection with proven track record
    • Tax software integrations (Koinly, CoinTracker) save time at tax season
    • Biometric authentication on mobile (Face ID, fingerprint)

    Cons:

    • 0.85% swap fee is higher than several competitors
    • No built-in bridge, requiring third-party solutions
    • Only 6 chains supported vs. competitors with 14+
    • No exchange integration for quick CEX access
    • No NFT locking feature

    Backpack

    Pros:

    • 0% platform fee on swaps and bridges is best-in-class
    • 14+ chain support covers more ecosystems than almost any competitor
    • Native exchange integration eliminates friction for active traders
    • NFT collection locking adds unique security layer
    • On-chain IPO access is a novel feature not available elsewhere
    • $BP token with community-first distribution (100% at TGE)
    • Hardware wallet support includes both Ledger and Keystone

    Cons:

    • Smaller user base and newer track record compared to Phantom
    • No Bitcoin support
    • Exchange-wallet integration creates dependency on Backpack Exchange’s stability
    • Fewer dApp integrations in some Solana ecosystem corners
    • Less established security audit history

    Security and Trust

    Both Phantom and Backpack are self-custodial wallets, meaning you control your private keys. Neither platform can access your funds.

    Phantom has the longer track record. It has processed hundreds of millions of transactions since 2021 without a major security breach affecting user funds. Its Blowfish integration scans transactions before you sign them, flagging malicious contracts and suspicious token approvals. Phantom also received the CFTC no-action letter in March 2026, which signals regulatory credibility.

    Backpack is newer but has been audited and holds regulatory licenses for its exchange operations. It offers scam detection and the unique NFT locking feature. However, its shorter operational history means there’s less real-world security data to evaluate.

    For users prioritizing proven security track records, Phantom has the edge. For users who want specific security features like NFT locking, Backpack offers more granular controls.

    User Experience

    Phantom’s interface is clean and beginner-friendly. The onboarding flow guides new users through wallet creation, and the main dashboard clearly displays token balances, NFTs, and recent activity. Swap functionality is accessible in two taps. The mobile experience mirrors the desktop extension closely.

    Backpack’s interface is slightly more complex due to its exchange integration and broader feature set. The learning curve is steeper if you’re new to crypto, but experienced users will appreciate having exchange, wallet, bridge, and DeFi tools in one place. The UI is modern and well-organized, though the sheer number of supported chains can make the network selector feel busy.

    Both wallets support hardware wallet connections (Ledger), biometric authentication on mobile, and offer dark mode by default.

    Verdict: Which Should You Choose?

    For beginners and general Solana users: Go with Phantom. The larger ecosystem, simpler interface, and longer security track record make it the lower-risk choice. If you’re holding SOL, a few NFTs, and occasionally swapping tokens, Phantom does everything you need.

    For active traders and DeFi power users: Backpack is the stronger pick. Zero swap fees, 14+ chains, built-in exchange access, and native bridging save both money and time. If you’re executing multiple trades per day or working across several chains, those savings compound quickly.

    For Bitcoin holders: Phantom is your only option here, since Backpack doesn’t support BTC.

    For multi-chain DeFi explorers: Backpack’s support for Monad, Aptos, Berachain, and other emerging chains makes it the better choice if you’re farming yields or testing new ecosystems.

    Both wallets are free to download and self-custodial. There’s nothing stopping you from using both, keeping Phantom as your primary Solana wallet and Backpack for multi-chain trading. Many users do exactly that.

    FAQ

    Is Phantom or Backpack safer?

    Both are self-custodial, so you control your keys in either case. Phantom has a longer operational history and a larger user base (17M+ MAUs), which gives it more real-world security validation. Backpack is newer but holds exchange regulatory licenses and offers unique features like NFT locking. Neither has experienced a major security breach affecting user funds.

    Can I use both Phantom and Backpack at the same time?

    Yes. Both install as browser extensions and mobile apps. You can use Phantom for Solana dApps and Backpack for multi-chain trading or exchange access. Many users run both wallets simultaneously.

    Why does Backpack charge 0% swap fees?

    Backpack monetizes through its integrated exchange (trading fees) and the broader $BP token ecosystem rather than charging wallet-level fees. This makes the wallet itself a free acquisition tool for their exchange platform.

    Does Phantom support Backpack Exchange?

    No. Backpack Exchange is directly integrated only with the Backpack wallet. To use Backpack Exchange with Phantom, you’d need to transfer funds to a Backpack wallet or deposit directly to the exchange from Phantom via an on-chain transfer.

    Which wallet has better NFT support?

    Phantom has the more mature NFT gallery with Solana-native features and scam NFT detection. Backpack offers NFT collection locking, which prevents unauthorized transfers. If NFT security is your priority, Backpack’s locking feature is unique. For general NFT browsing and management, both are capable.

    Looking for trading tools to pair with your wallet? Check out our Photon vs BullX comparison for the best Solana trading bots, or read our Jupiter Exchange review for the top Solana DEX aggregator.

    Disclaimer: This article is for informational and educational purposes only and should not be construed as financial, investment, or trading advice. Cryptocurrency markets are highly volatile, and past performance does not guarantee future results. The analyses presented here are based on publicly available data at the time of writing. Always conduct your own research (DYOR) and consult with a qualified financial advisor before making any investment decisions. Pump Parade and its authors do not assume liability for financial losses incurred based on information provided in this article.

    Bitcoin (BTC) Price Prediction 2026

    0

    Bitcoin is trading at $66,276 as of March 31, 2026. That’s down roughly 35% from its all-time high near $104,000. The Fear & Greed Index sits at 8, deep in “extreme fear” territory. Meanwhile, exactly one year has passed since the April 2024 halving reduced Bitcoin’s daily supply issuance by 50%.

    Here’s the thing: if you know crypto history, this setup looks familiar. The 12-to-18-month window after a halving is historically when Bitcoin’s biggest price moves happen. We’re sitting right in the middle of that window. So is this the bottom before the next major rally, or is there more downside ahead? Let’s look at the data.

    Bitcoin BTC price prediction 2026 hero image showing current price $66,276 with extreme fear index

    Bitcoin at a Glance: Key Metrics Today

    At time of writing, Bitcoin trades at $66,276 on major exchanges, reflecting a 24-hour decline of approximately 1.7%. Here are the key numbers:

    • Current price: $66,276
    • Market cap: Approximately $1.31 trillion
    • 24-hour trading volume: Over $28 billion globally
    • Year-to-date performance: Down roughly 35% from the January 2026 high near $104,000
    • Fear & Greed Index: 8 (Extreme Fear)
    • Halving date: April 19, 2024. Bitcoin is now in its post-halving expansion window.

    On the Solana network, wrapped Bitcoin (cbBTC) is showing $46.9 million in 24-hour trading volume. That’s a sign that Bitcoin demand remains active even across alternative ecosystems. According to CoinGecko, Bitcoin remains the largest cryptocurrency by market cap, commanding over 50% market dominance.

    What Happened to Bitcoin? The 2026 Correction Explained

    Bitcoin hit a high near $104,000 in January 2026. Since then, it has been in a steady downtrend. Several factors drove the correction.

    Macro headwinds. Persistent uncertainty around U.S. fiscal policy, sticky inflation, and a strong dollar put pressure on risk assets across the board. Bitcoin was not immune.

    Profit-taking after the post-halving surge. The 2024-2025 post-halving rally was significant. Large holders distributed into strength, creating overhead supply that is still working through the market.

    Sentiment collapse. A Fear & Greed Index of 8 reflects the kind of panic that often marks the late stages of a correction, not the beginning. Retail investors tend to sell at bottoms, not tops. This reading is worth paying attention to.

    Technical Analysis: Where Does BTC Stand?

    Bitcoin’s chart tells a story of compression. Here are the key levels to watch right now.

    Support Levels

    The most important support zone sits between $58,000 and $62,000. This range has been tested multiple times since the correction began. Every significant dip in Q1 2026 found buyers near $62,000. Below that, the $50,000 to $52,000 zone represents the next major floor. That level held through much of the 2024-2025 accumulation phase.

    Resistance Levels

    Bitcoin faces layered resistance on the upside. The first hurdle is $72,000 to $75,000, a zone where several failed rally attempts have reversed. Above that, the $80,000 level is a psychological wall. A clean break above $80,000 would change the technical picture significantly. The $100,000 level remains the big target. Psychologically and technically, it aligns with the previous breakout zone from late 2025.

    Indicator Readings

    The Relative Strength Index (RSI) on Bitcoin’s weekly chart is sitting near 35. That’s not yet at classic oversold territory (below 30) but approaching it. The last two times weekly RSI approached this zone in a bull cycle, BTC staged major reversals within four to six weeks.

    The 50-week moving average currently sits near $68,000, just above current price. Bitcoin has spent very little time below this level during the current macro bull cycle. Reclaiming it would be a meaningful signal.

    Net short positions have risen 52% in recent weeks, according to derivatives data. This is a double-edged signal: it shows bearish sentiment, but it also sets the stage for a short squeeze if positive catalysts emerge.

    The Bull Case: Why BTC Could Rally Sharply from Here

    There are several reasons to be constructive on Bitcoin at current levels.

    Post-halving timing is favorable. The April 2024 halving cut Bitcoin’s block reward from 6.25 BTC to 3.125 BTC. Historically, Bitcoin’s biggest moves occur 12 to 18 months after a halving. We are now exactly at the 12-month mark. The 2016 and 2020 halving cycles both saw their most explosive gains in this window.

    Institutional demand is structural, not cyclical. Spot Bitcoin ETFs absorbed an average of over 1,200 BTC per day in Q1 2026. That’s well above the approximately 450 BTC mined daily. The supply-demand math is straightforwardly bullish on a long enough timeline. Institutions are not panic-selling at Fear and Greed 8.

    Extreme fear is historically a contrarian signal. An index reading of 8 is in the bottom percentile of historical readings. The last time the Fear and Greed Index was this low, Bitcoin staged a 60% recovery within three months. Past performance is not a guarantee, but sentiment extremes tend to mean-revert.

    Short squeeze potential. A 52% spike in net short positions means a lot of traders are betting against Bitcoin right now. If a positive catalyst arrives, those shorts could unwind rapidly, adding fuel to any rally.

    Bull case price target: A recovery to $90,000 to $100,000 by Q3 2026, with a possible extension toward $110,000 to $130,000 by year-end if institutional flows accelerate and macro conditions improve.

    The Bear Case: What Could Go Wrong

    The bull case is compelling. But a good analysis also asks: what kills the thesis?

    Macro deterioration. If the U.S. economy enters a deeper recession, or if central banks stay restrictive longer than expected, risk assets could see another leg down. In this scenario, Bitcoin could retest the $50,000 to $55,000 range. A break below $50,000 would be technically significant and would challenge the bull cycle narrative.

    Regulatory risk. The post-election regulatory environment has been relatively friendly in the U.S. But a sudden shift, new restrictions on exchanges, ETF concerns, or a major international crackdown, could remove institutional appetite quickly.

    Miner pressure. Post-halving, Bitcoin miners face compressed margins. If Bitcoin stays below $65,000 for extended periods, some miners may be forced to sell holdings to cover costs. Miner capitulation events have historically added downward pressure during corrections.

    ETF outflows. The ETF bid has been a structural tailwind. But if institutional sentiment shifts, perhaps due to macro rotation into other assets, ETF outflows could accelerate selling pressure in a way not seen in previous cycles.

    Bear case price target: A retest of $50,000 to $55,000 in Q2 2026, with a worst-case scenario in the $42,000 to $45,000 range if multiple bearish catalysts combine.

    AI Price Prediction Summary for Bitcoin 2026

    Our hybrid AI model combines technical indicators, on-chain data, historical halving cycle patterns, and current market sentiment. Here is what the model outputs at current prices.

    Bitcoin BTC price prediction table showing bear, base, and bull targets for short-term, mid-term, and long-term

    Short-term (30 days, through May 2026):

    • Bear target: $56,000
    • Base target: $72,000
    • Bull target: $84,000

    The model assigns a 55% probability to the base case. Bitcoin is in a compression zone. A break above $75,000 or below $62,000 will define the next directional move. The Fear and Greed Index at 8 makes a downside breakdown slightly less likely than it appears. Extreme fear often resolves to the upside over a 30-day horizon.

    Medium-term (6 months, through September 2026):

    • Bear target: $48,000
    • Base target: $95,000
    • Bull target: $130,000

    The base case reflects a post-halving rally gaining traction by mid-year, supported by ETF inflows and improving macro conditions. At $95,000, Bitcoin would still be trading below its January 2026 all-time high. Conservative, but realistic given the current environment. The bull case of $130,000 requires a short squeeze, macro tailwind, and continued institutional accumulation to all materialize in sequence.

    Long-term (2027 to 2028):

    • Bear target: $72,000
    • Base target: $160,000
    • Bull target: $250,000

    If the current cycle follows the pattern of 2016-2017 and 2020-2021, the peak comes 18 to 24 months post-halving: roughly Q4 2025 to Q2 2026. But cycles are elongating as Bitcoin’s market cap grows. Our longer-range model, explored in depth in our Bitcoin 2028 price prediction, puts the base case peak in the $160,000 to $250,000 range by the next halving cycle in 2028.

    Key Levels and Catalysts to Watch

    Here is a practical framework for monitoring Bitcoin’s price action over the next 90 days.

    • $62,000: Key support. Holds here, the bull case stays intact.
    • $75,000: First major resistance. A weekly close above this level would signal a trend reversal.
    • $80,000: Psychological level. Breaking through here would likely trigger the short squeeze scenario.
    • $100,000: The big target. Reclaiming six figures would be a definitive signal that the bull cycle is resuming.
    • Fear and Greed Index: Watch for a recovery above 25. Historically, the move from Extreme Fear to Fear has been a reliable signal that selling is exhausting itself.
    • ETF flow data: Weekly net inflows from U.S. spot ETFs are the most important structural variable to track. Sustained outflows would be a warning sign.
    • Halving cycle clock: The 18-month post-halving mark hits October 2025. If history repeats, the window for maximum upside is Q2 to Q4 2026.

    Our Take

    Bitcoin at $66,000 with extreme fear and 12 months post-halving is, historically, a setup that has rewarded patient, risk-aware positioning. The data says the bull case is more likely than the bear case over a 6-to-12-month horizon. But “more likely” is not “guaranteed.” The macro backdrop is genuinely uncertain. Miner pressure is real. And short-term volatility could take BTC to uncomfortable levels before any sustained recovery.

    If you’re watching Bitcoin right now, watch the $62,000 support and the $75,000 resistance. Those two levels will tell you everything you need to know about the next directional move.


    Disclaimer: This article is for informational and educational purposes only and should not be construed as financial, investment, or trading advice. Cryptocurrency markets are highly volatile, and past performance does not guarantee future results. The price predictions and analyses presented here are based on AI models, technical indicators, and available data at the time of writing. They are not guarantees. Always conduct your own research (DYOR) and consult with a qualified financial advisor before making any investment decisions. Pump Parade and its authors do not assume liability for financial losses incurred based on information provided in this article.

    About our AI predictions: Pump Parade’s price predictions are generated by machine learning models that analyze technical indicators, on-chain data, and market sentiment. These models have limitations and cannot account for black swan events, regulatory changes, or sudden market shifts. Prediction confidence scores reflect the model’s internal assessment, not guaranteed accuracy. Use AI predictions as one input among many in your research.
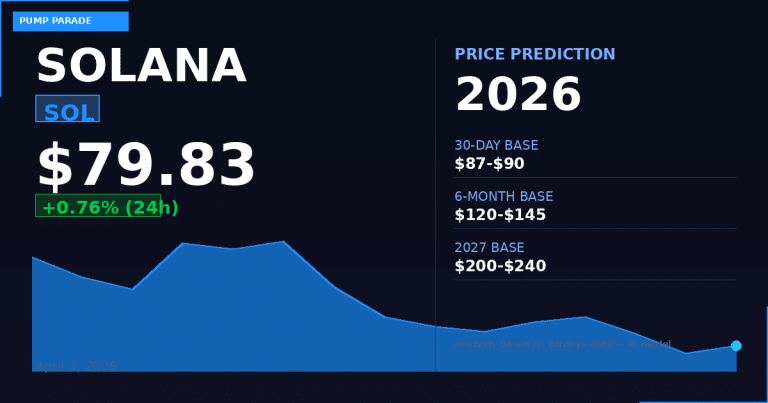
    Solana (SOL) Price Prediction 2026: Can SOL Hit $300?

    0

    Solana is trading at $83.00 today, March 31, 2026. That’s down 71.7% from its all-time high of $293.31. For a network processing over $13 billion in daily volume on-chain, that gap between performance and price tells an interesting story.

    The fundamentals are building. The Alpenglow upgrade is approaching, promising to cut transaction finality from 12 seconds to under 150 milliseconds. Solana ETFs have pulled in over $1.45 billion in cumulative inflows. Stablecoins on Solana have crossed $17 billion. And yet, SOL is sitting at $83.

    Can Solana close that gap? Our AI model has been running the numbers. Here’s what the data says about where SOL could be headed in 2026 and beyond.

    Solana (SOL) price prediction 2026 hero image showing current price of $83.00

    Solana at a Glance: Current Market Snapshot

    Before the analysis, let’s anchor to the facts as of March 31, 2026:

    • Price: $83.00 (Birdeye, real-time data)
    • 24h Change: -1.3%
    • Market Cap: $47.5 billion (ranked #7)
    • Circulating Supply: 572.6 million SOL
    • 24h Trading Volume: $3.3 billion
    • All-Time High: $293.31
    • Distance from ATH: -71.7%

    The RSI (Relative Strength Index, a momentum indicator) sits around 40 to 46. That’s neutral territory, leaning slightly oversold. It’s not flashing a screaming buy signal, but it’s also nowhere near the overheated readings that marked previous tops.

    What Is Solana? A Quick Overview

    Solana is a Layer 1 blockchain built for speed and scale. It uses Proof of History (PoH) combined with Proof of Stake (PoS) to process thousands of transactions per second at near-zero fees.

    The network has become the dominant home for memecoins, DeFi protocols, and on-chain trading. Its ecosystem now hosts over $17 billion in stablecoins. Institutional players including Fidelity and VanEck have launched Solana ETF products, and Goldman Sachs holds significant SOL exposure.

    In plain terms: Solana is the blockchain that made on-chain trading accessible to a new generation of crypto participants. The infrastructure is fast, cheap, and battle-tested.

    Key Catalysts Driving the 2026 Outlook

    The Alpenglow Upgrade

    This is the biggest technical development on Solana’s roadmap right now. Alpenglow is Solana’s largest core protocol change since launch. It replaces the existing consensus mechanism with a design targeting sub-150 millisecond finality for the entire network.

    Currently, Solana achieves 12-second finality. Under Alpenglow, that drops to 150 milliseconds. That’s faster than many centralized servers. For trading applications, DeFi protocols, and payment use cases, this is a meaningful upgrade.

    Multiple research desks have cited Alpenglow as a key catalyst for price targets in the $250 to $336 range by year-end 2026.

    Solana ETF Inflows

    Spot Solana ETF products have crossed $1.45 billion in cumulative inflows. Products from Bitwise (BSOL) and Fidelity (FSOL) have both seen significant traction. Goldman Sachs and Electric Capital now hold SOL exposure through these products.

    This creates a structural demand floor that was absent in previous cycles. Institutional buyers don’t panic-sell the same way retail does. Their presence tends to compress downside volatility.

    Stablecoin and DeFi Activity

    Stablecoins on Solana have hit $17 billion. That’s a proxy for real economic activity on the network. When people move stablecoins on-chain, they’re usually trading, providing liquidity, or transacting.

    Jupiter, Solana’s flagship DeFi aggregator, continues to route billions in daily swap volume. Raydium and Orca remain among the most active AMMs (Automated Market Makers, platforms that enable decentralized token swaps) in all of crypto.

    Commodity Status and Regulatory Clarity

    Solana has received de facto commodity classification in recent regulatory discussions. This reduces the legal overhang that weighed on the token for the past two years. Institutional allocators require that legal certainty before sizing positions. Now they have more of it.

    Technical Analysis: What the Chart Is Saying

    Here’s the current technical setup for SOL:

    • Immediate support: $80 to $82 (tested twice in March 2026)
    • Key support: $75 to $78 (break below this would be a bearish signal)
    • Immediate resistance: $92 to $95 (concentrated sell pressure in this zone)
    • Major resistance: $100 (psychological level with heavy overhead supply)
    • RSI: 40 to 46 (neutral, not overbought)

    Recent price action shows SOL bouncing from the $80 support level. A confirmed weekly close above $95 could open the path toward $100 and higher. But a break below $78 would likely push price toward the $67 range.

    The broader trend since late 2024 has been lower highs and lower lows. That structure needs to break before the bull case fully opens. The Alpenglow deployment could be the catalyst that breaks the pattern.

    The Bull Case for SOL in 2026

    The bull case rests on three pillars: technical execution, institutional demand, and narrative momentum.

    If Alpenglow ships on schedule and performs as designed, Solana would become the fastest finality chain at scale. That’s a real product upgrade. Developers building latency-sensitive applications would have a clear reason to build on Solana over competitors.

    On the institutional side, ETF inflows at $1.45 billion and rising suggest real allocator demand. If total ETF assets under management approach $3 to $5 billion by late 2026, the structural buying pressure could push prices significantly higher.

    Multiple analysts target $250 to $336 for SOL by end of 2026. The average across seven independent research desks sits at $425, with a range spanning $200 to $1,000. That wide range reflects genuine uncertainty, but the direction is clear: most analysts see meaningful upside from here.

    The Bear Case: What Could Go Wrong

    The bear case is real and shouldn’t be dismissed.

    First, the technical structure is still bearish. Lower highs since the $293 peak, a series of failed recoveries at the $100 level, and no weekly bullish reversal signal yet. Price can stay depressed longer than expected even when fundamentals improve.

    Second, macro risk. Crypto moves with broader risk appetite. A significant equity market correction in 2026 would not leave SOL unaffected. A 20% drop in major indices could push SOL back toward $55 to $65.

    Third, competition. Ethereum is recovering. Base, Arbitrum, and Sui are all competing for the same developers and users. Solana’s share of DeFi TVL (Total Value Locked, the amount of capital deployed in DeFi protocols) has grown, but it’s not guaranteed to hold.

    Fourth, upgrade risk. Technical upgrades can be delayed, bugged, or fail to generate the expected price response even when they ship. Markets sometimes buy the rumor and sell the news.

    Key level to watch on the downside: a weekly close below $75 would target the $55 to $60 range.

    AI Price Prediction Summary: SOL in 2026 and Beyond

    Our hybrid AI model draws on technical indicators, on-chain data, ETF flow trends, and historical cycle patterns. Here are the predictions for SOL across three time horizons as of March 31, 2026:

    Solana SOL price prediction summary table showing bear, base, and bull targets for short-term, mid-term, and long-term horizons

    Short-Term (April to June 2026)

    The model assigns a 55% probability to SOL trading in the $90 to $120 range by end of Q2 2026. The base case target is $105. The bear scenario keeps SOL in the $70 to $85 range. The bull scenario, triggered by early Alpenglow deployment or a broader market rally, puts SOL at $130 to $145.

    Mid-Term (End of 2026)

    By year-end 2026, the base case is $175 to $210. That assumes Alpenglow ships, ETF inflows continue at a moderate pace, and the broader market trades sideways to up. The bear case is $80 to $100. The bull case, requiring significant institutional acceleration, puts SOL at $300 to $336.

    Long-Term (2027 to 2028)

    Over a two-year horizon, the range widens considerably. The bear case: $60 to $90. The base case: $250 to $400. The bull case: $400 to $700, with some institutional models reaching $1,000 if Solana captures a dominant share of global on-chain activity.

    The model’s confidence is moderate (62%) in the base case direction but low in specific price points. This is normal for 24-month crypto predictions. Use these as scenario frames, not forecasts.

    For more ways to navigate the Solana ecosystem, including how to find high-potential tokens before they move, check out our guide on Solana memecoins and how to find massive moonshots.

    Key Levels and Catalysts to Watch

    Here’s what matters most for SOL over the next 90 days:

    • Above $95: Opens the door to $100 and beyond. Watch for volume confirmation.
    • Above $100: First major structural break. Signals a potential trend reversal.
    • Below $78: Bearish signal. Could accelerate toward $67.
    • Below $65: Deep bear scenario. Major reassessment required.

    Dates to watch: the Alpenglow upgrade deployment timeline (no hard date confirmed as of writing), SEC decisions on pending Solana ETF applications, and Q1 2026 on-chain activity reports from major analytics platforms.

    The Bottom Line

    Solana at $83 in March 2026 is a network that has built serious infrastructure and attracted real institutional capital. The price hasn’t caught up to the fundamentals yet. The Alpenglow upgrade is the clearest near-term catalyst. ETF inflows provide a structural demand floor.

    The base case by end of 2026 is $175 to $210. The upside scenario is $300. The downside is a return to the $70s or worse if the broader market turns against risk assets.

    This isn’t a call to buy or sell. It’s a framework. The data is in front of you.

    Current SOL price data sourced from CoinGecko.


    Disclaimer: This article is for informational and educational purposes only and should not be construed as financial, investment, or trading advice. Cryptocurrency markets are highly volatile, and past performance does not guarantee future results. The price predictions and analyses presented here are based on AI models, technical indicators, and available data at the time of writing. They are not guarantees. Always conduct your own research (DYOR) and consult with a qualified financial advisor before making any investment decisions. Pump Parade and its authors do not assume liability for financial losses incurred based on information provided in this article.

    About our AI predictions: Pump Parade’s price predictions are generated by machine learning models that analyze technical indicators, on-chain data, and market sentiment. These models have limitations and cannot account for black swan events, regulatory changes, or sudden market shifts. Prediction confidence scores reflect the model’s internal assessment, not guaranteed accuracy. Use AI predictions as one input among many in your research.