

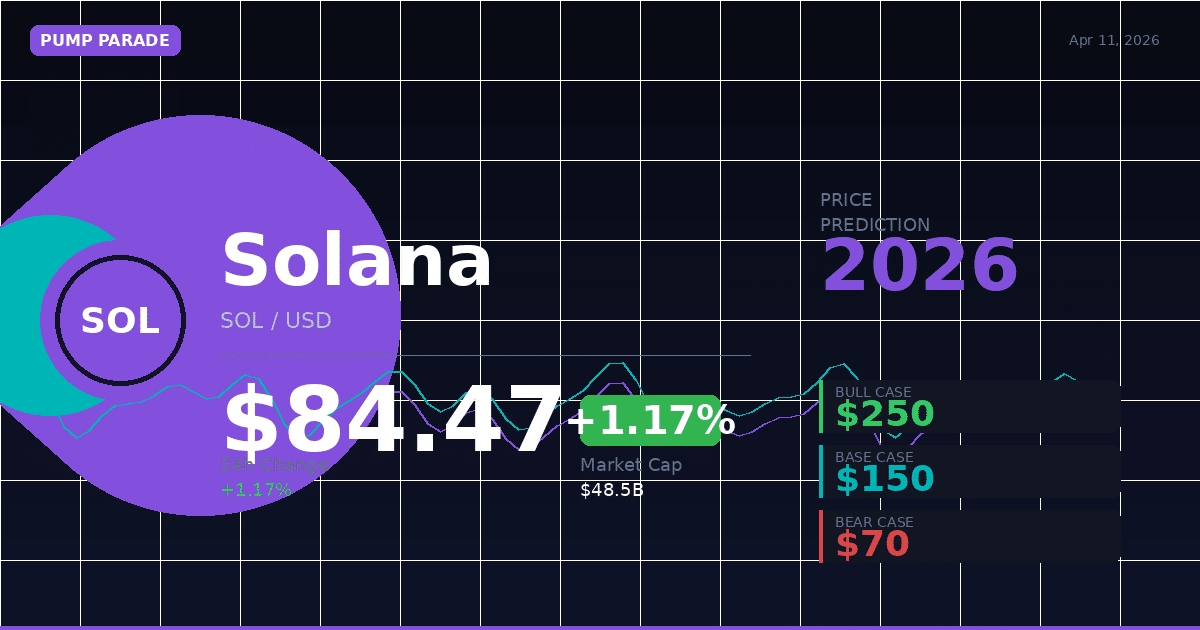
Solana is trading at $84.47 as of April 11, 2026. That is a steep 71% drop from its January peak of $293. Ouch.
But here is the thing: the fundamentals have not collapsed. The network is busier than ever, with $42.9 billion in 24-hour trading volume across the ecosystem. A major consensus upgrade is working its way toward mainnet. And institutional money is flowing in through spot ETFs.
So is this a fire sale or a falling knife? Our AI model has been running the numbers. Let us break it down.
What Is Solana (SOL)?
Solana is a high-performance Layer 1 blockchain built for speed and scale. It can process thousands of transactions per second at fractions of a cent per transaction. That makes it the home of choice for DeFi protocols, NFT marketplaces, memecoins, and trading applications.
Key metrics as of April 11, 2026:
- Current price: $84.47
- Market cap: $48.5 billion
- 24-hour volume: $42.9 billion
- Liquidity (on-chain): $5.93 billion
- 24h price change: +1.17%
Solana hit an all-time high of $293 in January 2026. Since then, it has shed nearly three-quarters of its value. The broader crypto market pullback has been brutal across the board. CoinGecko data shows SOL still ranks among the top five cryptocurrencies by market cap.
The Alpenglow Upgrade: Solana’s Biggest Bet
The most important thing happening in the Solana ecosystem right now is the Alpenglow upgrade, also known as SIMD-0326.
Here is what it does: it slashes transaction finality from roughly 12 seconds down to about 150 milliseconds. That is 80 times faster. For a network that already markets itself on speed, this is a game-changer.
The upgrade passed a validator vote with 98% approval in late 2025. It is currently in testnet. Mainnet deployment is expected in late 2026, pending security audits and community testing.
Why does this matter for the price? Faster finality means Solana becomes more competitive with centralized exchanges. That unlocks a new class of use cases: high-frequency trading, real-time settlement, and institutional-grade applications. More use cases means more demand for SOL to pay fees.
Institutional Tailwinds
The regulatory picture got a lot clearer in March 2026. U.S. regulators formally classified SOL as a digital commodity. That is significant. It provides legal certainty for staking, protocol activities, and institutional investment vehicles.
The money has followed. Goldman Sachs holds over $108 million in SOL ETF positions. Standard Chartered has published a $250 price target for SOL in 2026. These are not retail hype signals. This is institutional positioning.
Technical Analysis: Where Does SOL Stand?
SOL is in a challenging technical position right now. But it is not as bad as the headlines make it sound.
Key levels to know:
- Current price: $84.47
- Immediate support: $81.49 and $80.35
- Critical support floor: $78.31
- Resistance 1: $87.85 (near-term ceiling)
- Resistance 2: $91-$92 (strong supply zone)
- Key breakout level: $97
The 14-day RSI (Relative Strength Index, a measure of momentum) sits at around 47-52. That puts SOL in neutral territory. It is not oversold, which means there is no forced technical bounce. But it is also not overbought. There is room to move in either direction.
The longer-term picture is more cautious. The 50-day and 200-day moving averages are both sloping downward. That signals that the dominant trend is still bearish. Clearing the $97 level on a sustained daily close would change that picture meaningfully. Until then, the path of least resistance is sideways to lower.
The price action is shaping into a potential bear flag pattern in the short term. This is a pattern where a brief consolidation follows a downtrend, and it often resolves lower. The level to watch on the downside is $78. A confirmed break below that opens the door to the $60-$65 range.
The Bull Case for SOL in 2026
The optimistic path for Solana has three clear engines:
1. Alpenglow goes live and delivers. If mainnet Alpenglow launches smoothly in late 2026, it will be the biggest technical upgrade in Solana’s history. Expect a strong narrative-driven rally in the months leading up to launch. Standard Chartered’s $250 target is built around this catalyst.
2. Spot ETF inflows accelerate. The SOL commodity classification is already attracting institutional capital. If Bitcoin ETF inflows continue (Goldman Sachs, BlackRock, and others are all now holding SOL), demand for SOL will grow structurally. Each new institutional holder reduces circulating supply.
3. The broader crypto cycle turns. Bitcoin is sitting near $70,000 right now. If it breaks above the $85,000 range, the entire market typically follows. Solana, as a high-beta asset, often amplifies Bitcoin moves. In prior cycles, SOL has outperformed BTC by 3-5x on the upside when sentiment shifts. Our sister analysis covers the Bitcoin price prediction for 2028 and the macro setup in detail.
The Bear Case for SOL in 2026
The risks are real. A balanced take requires sitting with the uncomfortable scenarios.
1. Alpenglow gets delayed again. The upgrade’s mainnet timeline has already shifted from early 2026 to late 2026. Another delay, or a security incident during testnet, would hammer sentiment. Narrative-driven assets get crushed when the narrative misses its moment.
2. Macro deterioration. If global risk appetite collapses, crypto follows. SOL fell 71% from its ATH in a relatively benign macro environment. A real risk-off move could push SOL toward the $60-$65 range, and possibly lower.
3. Competition from Ethereum and Base. Ethereum’s L2 ecosystem (Base, Arbitrum, Optimism) has gotten significantly faster and cheaper. If Alpenglow delays, some of the use cases Solana was going to capture may flow to competing chains instead.
Solana Price Prediction 2026: Our AI Model Targets
Our hybrid AI model analyzes technical indicators, on-chain data, institutional flow data, and historical pattern recognition. It assigns probability weights to different scenarios. Here is what it outputs for SOL:
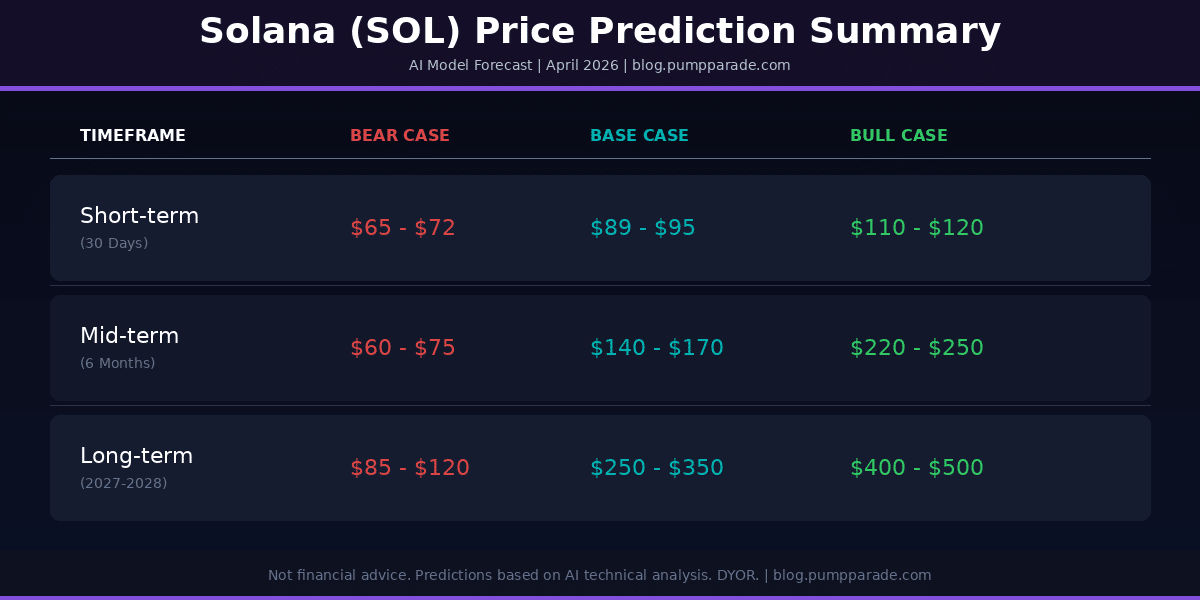
Short-Term Prediction (30 Days)
In the next 30 days, SOL needs to hold the $80-$81 support zone. If it does, a move back toward $89-$95 is the base scenario. That would be a 6-12% gain from current levels.
- Bear case: $65-$72 (breakdown below $78 floor)
- Base case: $89-$95 (reclaim key resistance)
- Bull case: $110-$120 (strong breakout with volume)
Mid-Term Prediction (6 Months, by October 2026)
By October 2026, Alpenglow should be in final testing or close to mainnet. That positions SOL for a narrative-driven re-rating.
- Bear case: $60-$75 (macro deterioration, upgrade delays)
- Base case: $140-$170 (Alpenglow approaching launch, ETF inflows steady)
- Bull case: $220-$250 (Alpenglow live early, BTC breakout, institutional surge)
Long-Term Prediction (2027-2028)
If Alpenglow delivers and the broader crypto cycle enters a new bull phase, the long-term upside for SOL is substantial.
- Bear case: $85-$120 (consolidation, no cycle, competition pressure)
- Base case: $250-$350 (Alpenglow live, adoption growth, post-halving BTC cycle lift)
- Bull case: $400-$500 (new all-time highs, institutional standard for L1 exposure)
Our model assigns a 58% probability to the base-case mid-term scenario. The bear case holds a 27% probability, and the bull case accounts for 15%. The balance of risks is tilted toward the downside in the near term. The medium-term picture depends almost entirely on the Alpenglow timeline.
What to Watch: Key Signals for SOL in 2026
Here is a practical framework for tracking the SOL thesis:
- The $78 support level. A daily close below this is the near-term danger sign. It changes the probability weighting toward the bear case.
- The $97 breakout level. A weekly close above this would flip the technical picture from bearish to neutral-bullish. Watch for volume confirmation.
- Alpenglow testnet progress. Monitor the Solana developer forums and GitHub for SIMD-0326 updates. Any mainnet timeline announcement will move the price.
- Bitcoin’s $85K test. BTC breaking above $85,000 with conviction typically drags the altcoin market higher. SOL would benefit disproportionately given its beta.
- ETF flow data. Track weekly SOL ETF inflows. Sustained inflows above $50M/week would be a strong institutional confirmation signal.
Disclaimer: This article is for informational and educational purposes only and should not be construed as financial, investment, or trading advice. Cryptocurrency markets are highly volatile, and past performance does not guarantee future results. The price predictions and analyses presented here are based on AI models, technical indicators, and available data at the time of writing. They are not guarantees. Always conduct your own research (DYOR) and consult with a qualified financial advisor before making any investment decisions. Pump Parade and its authors do not assume liability for financial losses incurred based on information provided in this article.
About our AI predictions: Pump Parade’s price predictions are generated by machine learning models that analyze technical indicators, on-chain data, and market sentiment. These models have limitations and cannot account for black swan events, regulatory changes, or sudden market shifts. Prediction confidence scores reflect the model’s internal assessment, not guaranteed accuracy. Use AI predictions as one input among many in your research.
