

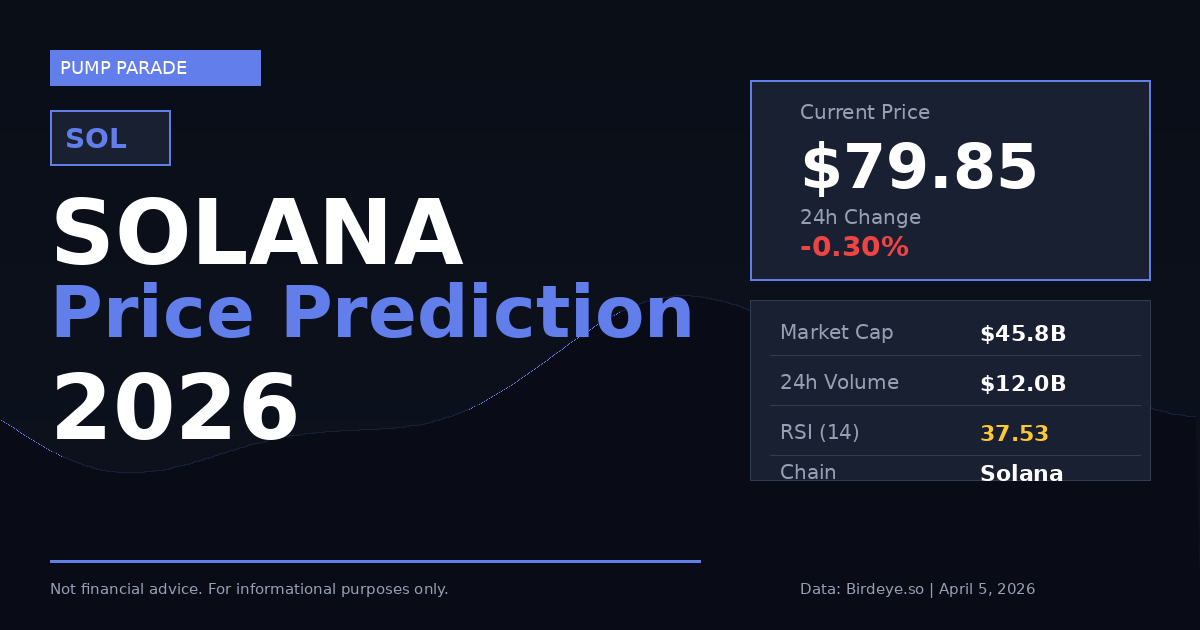
Solana is trading at $79.85 as of April 5, 2026. That is down more than 50% from its all-time high. The network sees over $12 billion in daily trading volume, which puts it firmly in the top tier of blockchain activity worldwide.
So why is the price so low? And more importantly, can SOL recover? Two major upgrades are on the horizon: the Alpenglow consensus overhaul and the Firedancer client launch, both targeting H2 2026. If they deliver, this could be the setup long-term holders have been waiting for. Let’s look at the data.
Solana at a Glance
Solana is a high-performance Layer 1 blockchain built for speed and low fees. It processes thousands of transactions per second at a fraction of Ethereum’s cost. That performance has made it the dominant chain for memecoins, DeFi, and on-chain trading.
Here are the key metrics as of April 5, 2026:
- Price: $79.85
- Market Cap: $45.8 billion
- 24h Trading Volume: $12.0 billion
- Circulating Supply: ~574 million SOL
- RSI (14-day): 37.53 (neutral, approaching oversold)
The volume figure is striking. Over $12 billion in daily volume on a token trading at $80 signals that traders are still deeply engaged. That is not a dead market. It is a market hunting for direction.
Technical Analysis: Where Does SOL Stand?
The technical picture for SOL is cautious right now. The 20-day moving average has crossed below the 50-day, which is a bearish signal. Price is stuck in a descending channel. The RSI sits at 37.53, which means SOL is not yet oversold, but it is getting close.
Key levels to know:
- Immediate support: $78 to $80 (current zone)
- Critical support: $73 to $77 (head-and-shoulders target if $80 breaks)
- Deep support: $63 to $65 (bear case floor)
- Resistance 1: $87 (20-day EMA area)
- Resistance 2: $91 to $92 (supply zone, prior consolidation)
Our hybrid AI model has analyzed 60+ technical indicators for SOL. Right now, 23 signals are flashing bearish and 7 are bullish. That 23-to-7 split is not a buy signal. But it does suggest the downside may be getting crowded, and the probability of a mean reversion increases as price approaches oversold territory.
The most important level in the near term is $80. A daily close below this level opens the path to $73. Hold above it, and a bounce toward $87 becomes realistic.
The Bull Case for SOL in 2026
There is a real bull thesis here, and it rests on two pillars.
Pillar 1: The Alpenglow Upgrade. Solana’s community has approved the Alpenglow consensus overhaul. This is the largest core change to Solana since launch. The goal is to slash transaction finality from over 12 seconds down to 150 milliseconds. For context, that is faster than most Web2 apps. If Alpenglow deploys successfully in H2 2026, it removes one of the biggest arguments against Solana in enterprise and institutional use cases.
Pillar 2: Firedancer. The Firedancer validator client, built by Jump Crypto, is targeting full mainnet deployment in H2 2026 as well. Firedancer adds a second independent implementation of the Solana protocol, which dramatically improves network resilience. Institutional capital cares deeply about this kind of redundancy.
Standard Chartered has a 2026 SOL price target of $250. Analysts at Doo Prime are targeting $336. Across seven independent research desks, the average 2026 target sits at $425.
If both upgrades ship on schedule and broader crypto sentiment recovers, a move toward $200 to $300 by year-end is plausible. Historically, Solana has produced some of the crypto market’s sharpest recoveries after deep corrections.
The Solana ecosystem also holds $17 billion in stablecoins, a sign of real capital parked and ready to deploy on-chain.
The Bear Case for SOL in 2026
The bear case is equally real. Let’s not sugarcoat it.
SOL is in a descending channel with no clear reversal signal yet. The 20-day moving average is below the 50-day. Most technical indicators are bearish. A daily close below $77 would likely trigger stop-losses and algorithmic selling, targeting the $63 to $70 range.
Beyond technicals, macro risk is real. If broader markets continue to decline in Q2 2026, high-beta assets like SOL tend to fall harder than Bitcoin. A risk-off environment could keep SOL pinned below $90 for months, even with positive catalyst news.
There is also execution risk. Both Alpenglow and Firedancer are complex engineering efforts. Any delay or bug discovery could erase the premium that markets have already priced into these catalysts. Solana’s history includes high-profile network outages, and skeptics will be quick to highlight any instability during the upgrade process.
Finally, competition is intensifying. Ethereum’s Pectra upgrade and the rise of other high-performance chains mean Solana cannot rest on its reputation alone.
The risk-reward is not clean below $80. Downside to $63 is real. But so is upside to $200+. This is exactly the kind of setup that requires position sizing discipline, not conviction bets.
If you are researching Solana’s ecosystem more broadly, our guide on finding high-potential Solana memecoins walks through how to evaluate projects built on the network.
SOL Price Prediction Summary: 2026-2028
Our AI model integrates technical indicators, on-chain data, sentiment analysis, and fundamental catalysts. Here is the current output for SOL across three time horizons.
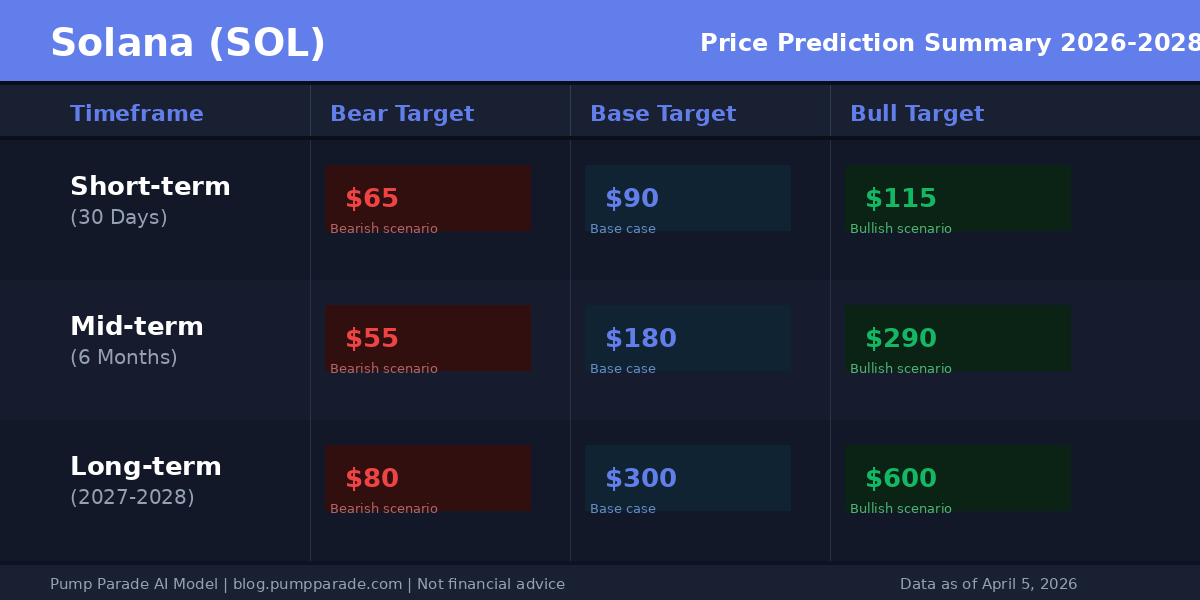
Short-term (30 days): The base case is a bounce toward $90 if SOL holds the $78 support zone. The RSI approaching oversold levels raises the probability of a short-term rebound. Bear case: a close below $77 targets $65. Bull case: a clean break above $87 opens the door to $115 on the back of momentum and short covering.
Mid-term (6 months): This is where the Alpenglow and Firedancer catalysts start to matter. If both upgrades deploy successfully and macro conditions stabilize, the base case is $180. That represents a return to levels SOL held earlier this cycle. The bull case puts SOL at $290, consistent with Standard Chartered’s target range. The bear case: continued macro weakness and delayed upgrades keep SOL below $100, with a floor around $55 on a broader market drawdown.
Long-term (2027-2028): If Solana cements itself as the infrastructure layer for on-chain finance, gaming, and AI agents, the base case is $300. The bull case extends to $600, which aligns with the upper end of analyst models and a potential new cycle peak. The bear case is $80, which assumes Solana loses market share to competing L1s and the upgrades fail to attract meaningful new adoption.
For current price data and market cap tracking, see Solana’s page on CoinGecko.
What to Watch
These are the specific signals and dates that should be on your radar:
- $80 support level: A daily close below here changes the near-term picture materially.
- $87 resistance: Reclaiming this level would signal the descending channel is breaking. That is the first real bullish confirmation.
- Alpenglow testnet timeline: Any announcements from the Solana Foundation about testnet progress will move price. Watch the official Solana blog and Twitter.
- Firedancer mainnet date: Jump Crypto’s deployment schedule is a key catalyst for institutional confidence.
- Bitcoin dominance: If BTC dominance starts declining, altcoins including SOL tend to outperform. Watch BTC dominance as a leading signal.
- On-chain stablecoin flows: The $17B in stablecoins sitting on Solana represents latent demand. If that capital starts rotating into SOL, volume spikes will precede price moves.
The Bottom Line
Solana at $79.85 is not obviously cheap or obviously expensive. It is a high-beta bet on two things: the successful delivery of major technical upgrades and a recovery in broader risk appetite.
The data-driven base case puts SOL at $180 by year-end, with real upside to $300 if the catalysts land. The bear case puts it at $55 to $65 if macro conditions deteriorate and upgrades stall. Neither scenario is a sure thing.
The smart move is to watch the $80 level closely. Below it, patience is warranted. Above $87, the technical picture starts to improve. The thesis for 2026 is real. So are the risks.
Disclaimer: This article is for informational and educational purposes only and should not be construed as financial, investment, or trading advice. Cryptocurrency markets are highly volatile, and past performance does not guarantee future results. The price predictions and analyses presented here are based on AI models, technical indicators, and available data at the time of writing. They are not guarantees. Always conduct your own research and consult with a qualified financial advisor before making any investment decisions. Pump Parade and its authors do not assume liability for financial losses incurred based on information provided in this article.
About our AI predictions: Pump Parade’s price predictions are generated by machine learning models that analyze technical indicators, on-chain data, and market sentiment. These models have limitations and cannot account for black swan events, regulatory changes, or sudden market shifts. Use AI predictions as one input among many in your research.
