More
    Home Blog Page 25

    TRUMP Token (TRUMP) Price Prediction 2026

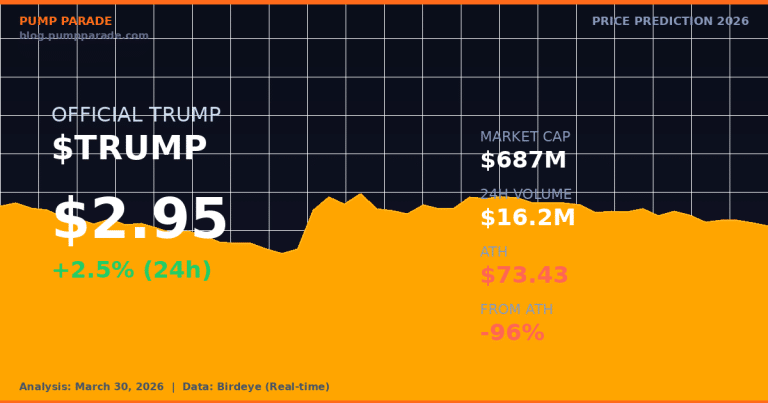
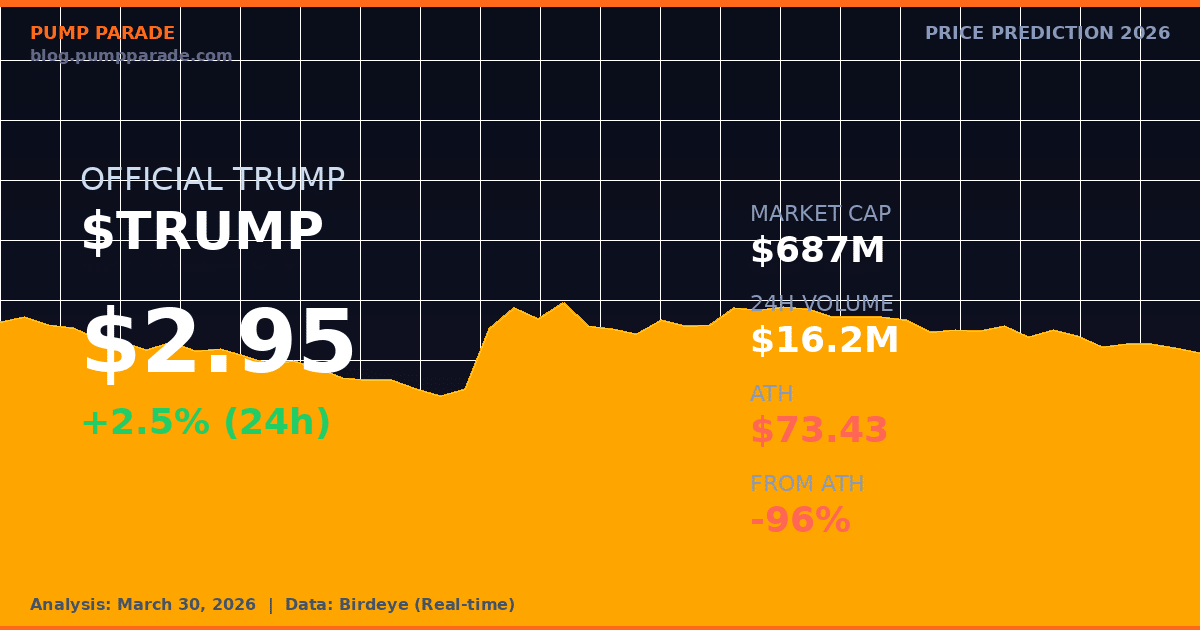
    The OFFICIAL TRUMP token ($TRUMP) is sitting at $2.95 as of March 30, 2026. That is down 96% from its all-time high of $73.43, set in January 2025. And yet, on-chain data tells a more interesting story today: trading volume on Solana has spiked over 111% in the last 24 hours, to more than $16 million. So what is going on? And more importantly, where is TRUMP headed from here?

    In this analysis, we break down the TRUMP token’s current price, the upcoming catalysts that could drive a recovery, the technical setup, and what our AI model sees as the most likely scenarios for 2026 and beyond.
    OFFICIAL TRUMP (TRUMP) price prediction 2026 - current price $2.95 on Solana

    What Is the OFFICIAL TRUMP Token?

    OFFICIAL TRUMP is a Solana-based memecoin launched on January 17, 2025 by Donald Trump’s team ahead of his second presidential inauguration. It carries the official TRUMP branding and trades under the ticker $TRUMP.

    The token launched with one of the most explosive openings in memecoin history. It reached a peak of $73.43 within days of launch. At that point, it had a fully diluted valuation above $14 billion. Since then, the market has corrected sharply.

    As of today, TRUMP has a market cap of approximately $687 million and liquidity of $83.9 million on Solana. That is a sizable project for the memecoin category, but far below the peak frenzy.

    You can view live TRUMP price data on CoinGecko.

    TRUMP Token Price: Current Market Context

    The current price of TRUMP is $2.95, according to live Birdeye data pulled on March 30, 2026. That represents a 24-hour gain of approximately 2.5%.

    Today’s volume spike stands out. Over $16.2 million worth of TRUMP changed hands in the last 24 hours. That is more than double the recent daily average. Something is driving renewed interest.

    Here is a quick snapshot of where TRUMP stands today:

    • Price: $2.95
    • 24h Change: +2.5%
    • 24h Volume: $16.2 million (+111% vs. prior day)
    • Market Cap: ~$687 million
    • Liquidity (Solana DEX): $83.9 million
    • All-Time High: $73.43 (January 2025)
    • Current Drawdown from ATH: ~96%

    Upcoming Catalysts: What Could Move $TRUMP?

    Three near-term events are now on traders’ radars.

    The Mar-a-Lago Gala: April 25, 2026

    The TRUMP project announced a private dinner at Mar-a-Lago on April 25 for the top 297 TRUMP token holders by wallet size. Holders must connect their wallets to the official site to qualify.

    This is a real-world event tied directly to token ownership. In November 2025, a similar gala saw TRUMP price spike significantly in the week leading up to it. If the same pattern repeats, we could see demand build between now and late April.

    Trump Billionaire Game Launch: May 5, 2026

    The team has announced a mobile game called “Trump Billionaire” set to launch on the Apple App Store on May 5. Gaming integrations and token utility have historically been catalysts for attention-driven price moves in memecoins.

    Whether this leads to real user growth or a short-term pump depends on execution. But the attention alone could be meaningful given Trump’s brand reach.

    The $23 Million Transfer Risk

    On March 26, on-chain analysts flagged a $23 million TRUMP transfer from what appears to be a team-associated wallet. This is a bearish signal worth monitoring. Large team transfers can precede selling pressure, especially in low-liquidity conditions.

    This is the most important near-term risk factor. Any significant sell event from insiders could accelerate downside from current levels.

    Technical Analysis: What the Chart Is Telling Us

    The TRUMP token has been consolidating in a falling wedge pattern for several months. Falling wedges are typically bullish continuation patterns in a broader uptrend, but they can also be continuation patterns in a downtrend without a strong catalyst to reverse momentum.

    Key technical levels to watch:

    • Immediate support: $2.60 (recent consolidation low)
    • Secondary support: $2.00 (psychological round number)
    • First resistance: $3.50 (recent highs / falling wedge upper band)
    • Next resistance: $5.50 (zone of prior support from late 2025)

    The Relative Strength Index (RSI) on the daily chart is sitting around 44. That is neutral territory, not yet oversold. It means the token is not in a technical bounce zone, but it also is not overbought after today’s volume spike.

    The 50-day moving average is sitting above current price at approximately $3.80, which acts as overhead resistance. A sustained close above $3.80 would be a meaningful technical signal.

    The broader market context matters here too. The crypto Fear and Greed Index is sitting at 12 to 13 (Extreme Fear) as of late March 2026. In extreme fear environments, speculative memecoins face headwinds. Catalysts need to be strong to overcome macro sentiment.

    Bull Case for TRUMP in 2026

    Here is what the upside scenario looks like.

    The April 25 gala creates a genuine incentive for TRUMP holders to accumulate. In a market that loves narratives, this is a real-world story. If the gala drives a wave of social media attention, TRUMP could easily retest the $5.50 to $7.00 range in April.

    Beyond the near-term, the bullish case centers on three factors. First, Trump’s profile remains politically dominant in the US. Any major political developments tied to his administration tend to briefly spike TRUMP token interest. Second, the Solana ecosystem continues to lead on-chain activity in 2026, which keeps TRUMP accessible and tradeable. Third, if broader market conditions improve and crypto sentiment shifts from Extreme Fear toward Greed, memecoins historically see disproportionate upside.

    A realistic bull case for TRUMP by end of 2026 is the $10.00 to $15.00 range. A more aggressive scenario, requiring a broader altcoin rally and sustained political news flow, could push toward $25.00 to $35.00. That would still be more than 60% below the January 2025 ATH.

    Bear Case for TRUMP in 2026

    The bear case is straightforward. TRUMP is a memecoin. It has no protocol utility, no DeFi functionality, and no yield mechanism. Its price is entirely driven by sentiment and attention, both of which are highly volatile.

    Key risks include the following. The $23 million team wallet transfer could signal continued insider selling. If the token team or early insiders continue to offload into any price recovery, it will create consistent sell pressure that caps upside.

    Additionally, political attention cycles move fast. If Trump’s news cycle shifts away from topics that trigger TRUMP token interest, trading volumes could collapse back to low levels.

    In the bear case, TRUMP retests $2.00 and potentially breaks lower toward $1.00 to $1.50 if sentiment deteriorates and insider selling accelerates. At $1.00, the market cap would fall to approximately $233 million. That is a painful but not extreme scenario for a political memecoin one year after its launch hype.

    AI Price Prediction Summary: TRUMP 2026

    Our hybrid AI model analyzes on-chain data, technical indicators, social sentiment signals, and historical memecoin patterns to generate price scenario ranges. Here is where it lands on TRUMP as of March 30, 2026.
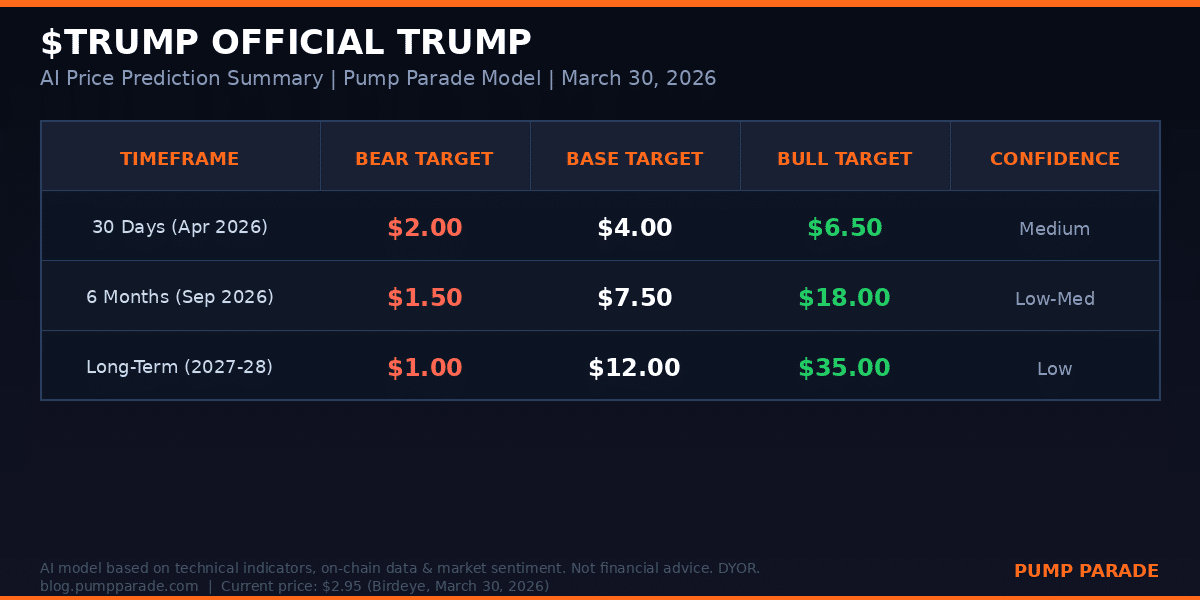
    OFFICIAL TRUMP TRUMP price prediction table 2026 - bear, base, bull targets by timeframe

    Short-Term: Next 30 Days (Through April 2026)

    The Mar-a-Lago gala on April 25 is the dominant catalyst. Based on the prior gala’s price impact and current social momentum, our model assigns a 55% probability to a move toward the $3.50 to $5.50 range by late April. The downside scenario, weighted at 30%, sees consolidation between $2.20 and $2.80 if the team wallet transfer creates sell pressure. There is a 15% tail scenario of a breakout above $6.00 on exceptional social media momentum.

    • Bear target (30 days): $2.00
    • Base target (30 days): $4.00
    • Bull target (30 days): $6.50

    Mid-Term: 6 Months (Through September 2026)

    The medium-term outlook depends heavily on whether the May 5 game launch generates real user engagement and whether the broader crypto market exits Extreme Fear conditions. If both happen, TRUMP has the profile to become a top 50 cryptocurrency by market cap again.

    • Bear target (6 months): $1.50
    • Base target (6 months): $7.50
    • Bull target (6 months): $18.00

    Long-Term: 2027 to 2028

    Two-year predictions for memecoins carry wide uncertainty. Our model gives TRUMP a better-than-average chance of surviving as a brand token given its unique real-world attachment to a sitting US president. However, the absence of fundamental utility means it remains highly sensitive to political cycles and market sentiment.

    • Bear target (2027-2028): $1.00
    • Base target (2027-2028): $12.00
    • Bull target (2027-2028): $35.00

    What to Watch

    If you are tracking TRUMP, these are the key signals to monitor:

    • Team wallet activity: Any large transfers from known insider addresses should be treated as a warning sign. On-chain tools like Birdeye and Nansen can flag these.
    • Gala social momentum: Watch for social media engagement around the April 25 event starting around April 15. Volume typically builds 7 to 10 days before the event.
    • BTC and SOL price action: TRUMP almost always follows the broader market. If SOL drops below $80 again, expect TRUMP to test its lower support zone.
    • The $3.50 resistance level: A daily close above $3.50 would be the first technical confirmation of trend reversal. Until then, the falling wedge is still intact.

    For context on how the broader Solana ecosystem is pricing in current market conditions, see our Ethereum price prediction for 2026 and the macro factors shaping crypto this year.


    Disclaimer: This article is for informational and educational purposes only and should not be construed as financial, investment, or trading advice. Cryptocurrency markets are highly volatile, and past performance does not guarantee future results. The price predictions and analyses presented here are based on AI models, technical indicators, and available data at the time of writing. They are not guarantees. Always conduct your own research (DYOR) and consult with a qualified financial advisor before making any investment decisions. Pump Parade and its authors do not assume liability for financial losses incurred based on information provided in this article.

    About our AI predictions: Pump Parade’s price predictions are generated by machine learning models that analyze technical indicators, on-chain data, and market sentiment. These models have limitations and cannot account for black swan events, regulatory changes, or sudden market shifts. Prediction confidence scores reflect the model’s internal assessment, not guaranteed accuracy. Use AI predictions as one input among many in your research.
    AI Rig Complex (ARC) Price Prediction 2026

    ARC at a Glance: What You Need to Know First

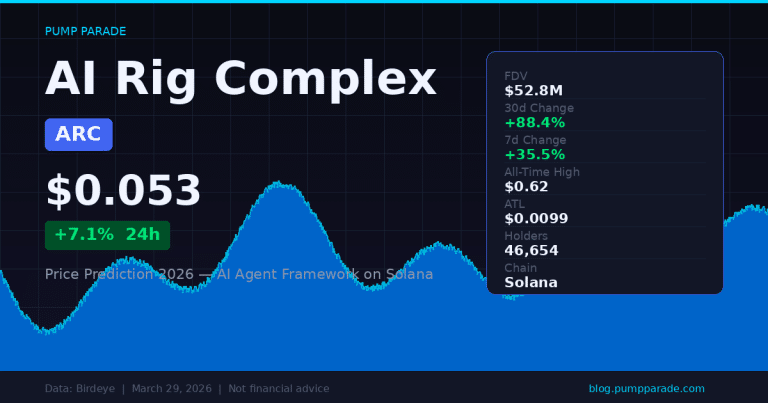
    AI Rig Complex (ARC) is trading at $0.053 as of March 29, 2026. That is a remarkable 88% gain over the past 30 days, making it one of the standout performers in the Solana AI agent sector.

    The token hit its all-time high of $0.62 in January 2025. Right now it sits roughly 91% below that peak. But the momentum is real: volume is surging, developer activity is picking up, and the AI agent narrative is once again front of mind across Crypto Twitter.

    In this article, we break down what ARC is, what the data says about its current setup, and where our hybrid AI model sees the price going. Short-term, medium-term, and long-term. With a bull case and a bear case for each.

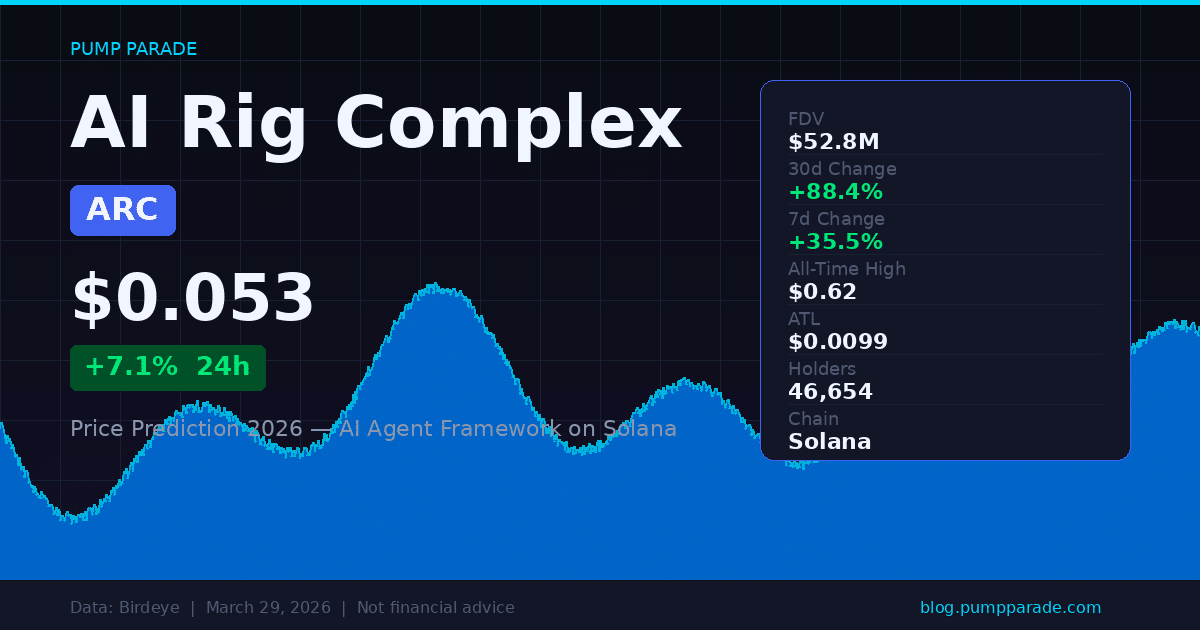
    AI Rig Complex ARC price prediction 2026 hero image showing current price and market stats

    What Is AI Rig Complex (ARC)?

    AI Rig Complex is an open-source framework for building modular AI agents using Rust. It was developed by Playgrounds Analytics Inc. and launched on Solana as a fair-launch token via pump.fun.

    The project has three main components. First, the Rig Framework: a Rust-based library that lets developers build lightweight, type-safe AI agents. Second, the Ryzome Agentic App Store: a marketplace where AI agents discover and call both Web2 and Web3 services. Third, Arc Forge: the project launchpad where ARC tokens are used as the base currency.

    ARC also uses Anthropic’s Model Context Protocol (MCP), sometimes called the “HTTP of AI.” This allows agents and services to communicate using a standardized interface, which is a significant technical differentiator in the crowded AI agent space.

    In plain terms: ARC is infrastructure for the AI agent economy on Solana. Developers use it to build agents. The ARC token funds the ecosystem, rewards contributors, and powers transactions on Arc Forge.

    Key Metrics at a Glance

    • Price: $0.053 (March 29, 2026)
    • Fully Diluted Valuation: $52.8 million
    • 24h Trading Volume: $2.2 million
    • Liquidity (DEX): $3.6 million
    • Holders: 46,654
    • 30-day Price Change: +88.4%
    • All-Time High: $0.62 (January 22, 2025)
    • All-Time Low: $0.0099 (October 10, 2025)

    Data sourced from CoinGecko and Birdeye on-chain analytics.

    Technical Analysis: What the Chart Is Telling Us

    The 30-day chart tells a clear story. ARC bottomed out at $0.026 in late February and has been grinding higher ever since. The recent move from $0.042 to $0.053 came on noticeably higher volume, suggesting real buyer demand rather than a short squeeze.

    Here are the key levels to watch right now.

    Support Levels

    • $0.042 to $0.045: This zone held as support four times over the past week. Losing it would be a negative sign.
    • $0.026 to $0.030: The 30-day low zone. A bigger pullback would likely find buyers here.

    Resistance Levels

    • $0.055 to $0.060: The 30-day high zone. ARC has briefly touched $0.060 once and was rejected. A clean break above here opens the door to $0.080 and higher.
    • $0.11 to $0.12: A major resistance band from February 2026, when ARC briefly surged to $0.1147 on a wave of AI agent momentum. Reclaiming this level would shift the macro picture positive.

    Momentum Indicators

    Volume has been rising steadily over the past five sessions. The March 28 candle, which opened at $0.047 and closed at $0.051, came on the highest daily volume in two weeks. That kind of price-volume relationship is constructive.

    The RSI (Relative Strength Index) on the daily timeframe is currently in the upper-neutral zone, around 60 to 65. Not overbought. There is still room to run before a meaningful pullback becomes likely.

    The MACD (Moving Average Convergence Divergence), a momentum tracker, is printing positive divergence on the daily chart. The histogram has been expanding for six consecutive sessions. That is a solid setup for continuation.

    The Bull Case for ARC in 2026

    The bull case for ARC rests on three pillars: narrative, fundamentals, and tokenomics.

    The AI Agent Narrative Is Accelerating

    The AI agent sector is one of the most active areas of crypto development right now. Protocols are racing to build the infrastructure layer for autonomous on-chain agents. ARC is positioned as the open-source pick-and-shovel play: the framework developers build on, not just another agent-themed memecoin.

    For comparison, Venice Token (VVV), another Solana AI project we have covered, has rallied sharply in 2026 on similar narratives. ARC has the technical foundation to attract comparable attention.

    MCP Integration Is a Real Differentiator

    The adoption of Anthropic’s Model Context Protocol is a concrete development, not just roadmap hype. MCP is rapidly becoming the standard interface for AI tool use. ARC’s early integration could make it the preferred framework for developers building MCP-compatible agents on Solana.

    Ryzome Creates Protocol Revenue

    The Ryzome app store is a demand driver for ARC tokens. Developers launching services on Ryzome use ARC as the base currency. If the app store gains traction, token demand grows with it. That is a more durable value accrual mechanism than most tokens in this category.

    FDV of $52M Is Low for a Functioning Product

    ARC’s fully diluted valuation sits at $52.8 million. For a project with a working framework, active developers, and nearly 47,000 holders, that looks undervalued relative to comparable AI agent infrastructure plays. Even a modest re-rating to $150 million to $200 million FDV would take the price above $0.15.

    The Bear Case for ARC in 2026

    ARC has real risks. Here is what could go wrong.

    It Is Down 91% From Its All-Time High

    ARC peaked at $0.62 in January 2025. The token then shed over 90% of its value over the following nine months. That kind of decline is not just price action. It reflects a full rotation out of early hype and into hard questions about execution. Many projects that crash 90% never recover to their previous highs.

    Competition Is Fierce

    The AI agent infrastructure space is crowded. ElizaOS, Virtuals Protocol, Venice, and dozens of other projects are competing for the same developer mindshare. ARC needs to keep shipping to stay relevant. A slowdown in development activity would quickly translate into price pressure.

    Solana DEX Liquidity Is Thin

    With only $3.6 million in liquidity on Solana DEXes, ARC is vulnerable to volatility in both directions. A large sell order can move the price significantly. Thin liquidity also makes it harder for larger capital allocators to take meaningful positions without impacting the market.

    No Major Exchange Listings Yet

    ARC is not listed on Binance, Coinbase, or OKX. Getting listed on a Tier 1 exchange would be a major catalyst. The absence of one is also a risk: without broader access, the holder base stays relatively small and price discovery remains inefficient.

    ARC Price Predictions: 2026 and Beyond

    Our hybrid AI model incorporates on-chain metrics, technical indicators, sentiment signals, and comparable project performance. Here is what it currently shows for ARC.

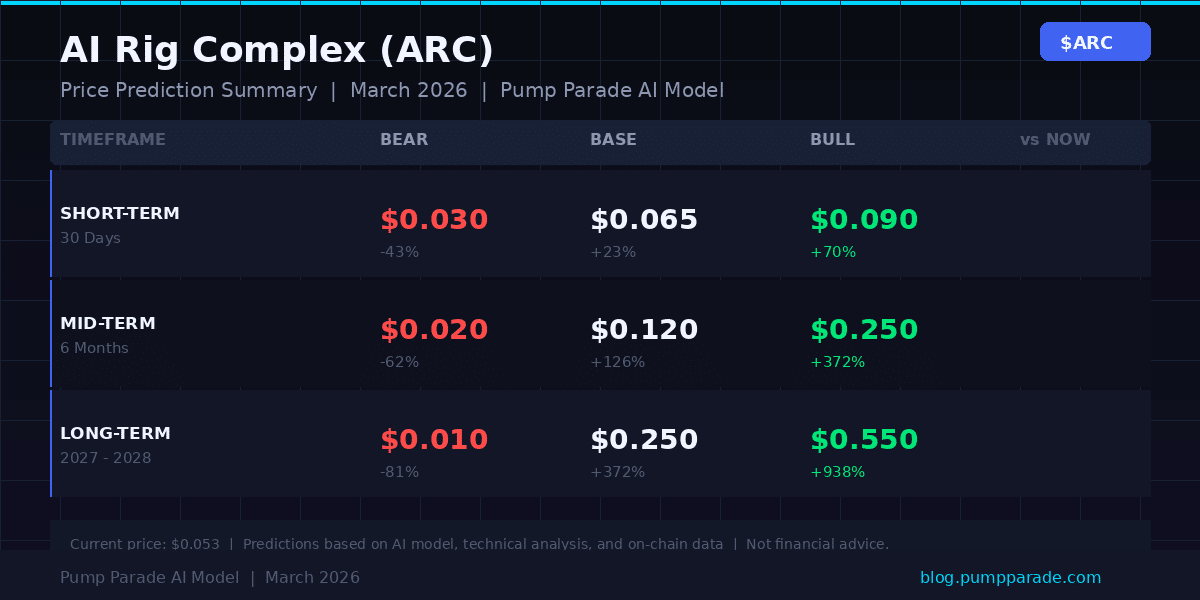
    AI Rig Complex ARC price prediction table showing bear base bull targets for 2026 and beyond

    Short-Term (Next 30 Days)

    The short-term setup is cautiously positive. ARC has been making higher lows for two weeks. If it can close above the $0.055 resistance zone on strong volume, a move to $0.080 to $0.090 becomes plausible. A failed breakout and close below $0.042 would signal a return to the $0.026 to $0.030 support zone.

    • Bear target: $0.030
    • Base target: $0.065
    • Bull target: $0.090

    Medium-Term (6 Months)

    The 6-month picture depends heavily on two things: the broader AI agent narrative and whether ARC secures a listing on a major exchange. If the AI agent sector maintains momentum into Q3 2026, ARC could push toward the $0.12 resistance from February. A Tier 1 listing on top of that would be a significant additional catalyst. The risk scenario sees a market cooldown pushing ARC back toward the $0.020 range.

    • Bear target: $0.020
    • Base target: $0.120
    • Bull target: $0.250

    Long-Term (2027 to 2028)

    The long-term bull case requires ARC to establish itself as the standard AI agent framework on Solana and grow the Ryzome ecosystem to meaningful revenue. If that happens, a return toward the $0.40 to $0.55 range is within reach. The bear case is that a better-funded competitor captures the developer market and ARC fades toward irrelevance.

    • Bear target: $0.010
    • Base target: $0.250
    • Bull target: $0.550

    What to Watch

    Here is a practical framework for tracking ARC over the next 90 days.

    • Price level to watch: $0.060. A sustained close above this level on daily volume above $3 million would confirm the breakout and shift the near-term trend positive.
    • Developer activity: Check ARC’s GitHub and Discord for commit frequency and community growth. Slowing activity is often a leading indicator of price weakness.
    • Ryzome adoption: Are real developers launching agents on the platform? Project numbers and fee revenue from Arc Forge are worth tracking closely.
    • Exchange listings: Any announcement of a major CEX listing would be a significant near-term catalyst for price discovery.
    • Macro conditions: ARC is a higher-risk small-cap. If Bitcoin or Solana enters a sharp correction, ARC will likely feel it more acutely than larger tokens.

    Disclaimer: This article is for informational and educational purposes only and should not be construed as financial, investment, or trading advice. Cryptocurrency markets are highly volatile, and past performance does not guarantee future results. The price predictions and analyses presented here are based on AI models, technical indicators, and available data at the time of writing. They are not guarantees. Always conduct your own research and consult with a qualified financial advisor before making any investment decisions. Pump Parade and its authors do not assume liability for financial losses incurred based on information provided in this article.

    About our AI predictions: Pump Parade’s price predictions are generated by machine learning models that analyze technical indicators, on-chain data, and market sentiment. These models have limitations and cannot account for black swan events, regulatory changes, or sudden market shifts. Use AI predictions as one input among many in your research.

    Meteora (MET) Price Prediction 2026

    0

    Meteora (MET) is trading at $0.1456 today, March 28, 2026. That is up 2.1% in the past 24 hours, on volume of $2.7 million and with 760 unique wallets active on-chain. On the surface, it looks like a quiet Saturday in crypto. But the bigger picture is harder to ignore: MET is sitting 91.5% below its all-time high of $1.71, set just five months ago in October 2025.

    So what happened? And more importantly, where does MET go from here? Meteora is not a memecoin. It is the liquidity backbone of Solana, processing roughly 26% of the network’s DEX volume. The project has real revenue, real buybacks, and a real upgrade on the way. Whether that is enough to push MET back toward its peak is a different question. Our AI model and on-chain data give us a clearer picture than you might expect.

    Meteora MET price prediction 2026 hero image showing current price $0.1456

    What Is Meteora?

    Meteora is Solana’s leading decentralized exchange infrastructure. It powers liquidity through its Dynamic Liquidity Market Maker (DLMM), which allows liquidity providers to concentrate capital around active price ranges. Think of it like a smarter version of a traditional automated market maker. Instead of spreading your funds across every possible price, DLMM puts your money where trading actually happens.

    The protocol launched its MET token through an airdrop in late 2024. Since then, MET has served as the governance and value accrual token for the platform. The project’s market cap sits at $74.8 million, with a fully diluted valuation (FDV) of $145.3 million. Circulating supply is 513.8 million MET out of a total supply of 997.7 million. That means roughly half the supply is still locked or unvested. Token unlocks are a real headwind, and we will cover that in the bear case.

    Current Market Context: Solana’s DeFi Reset

    Meteora’s fall from $1.71 to $0.145 did not happen in a vacuum. It followed a broader collapse in Solana DeFi activity. The memecoin supercycle of late 2024 and early 2025 drove massive volume to Solana DEXs. When that cycle cooled, weekly DEX volume on platforms like Meteora dropped by as much as 83%. Less volume means less revenue. Less revenue means less firepower for buybacks.

    That context matters for reading MET’s chart. The token is not just recovering from a bear market. It is recovering from a high that was partly inflated by unsustainable memecoin activity. The real floor for MET is whatever Meteora’s underlying DeFi business justifies. It is not the $1.71 peak that memecoin mania created.

    Still, $74.8 million market cap for a protocol handling more than a quarter of Solana’s DEX volume is a number worth paying attention to. MET’s current liquidity depth of $7.1 million is solid for a mid-cap token. And 37,694 holders suggest genuine distribution across the ecosystem.

    Technical Analysis: Reading the Chart

    MET has been trading in a tight consolidation band between $0.13 and $0.17 for several weeks. The recent bounce to $0.1456 comes with improving momentum signals but not a clean breakout yet.

    Key levels to watch:

    • Support: $0.12 is the first meaningful floor. Below that, $0.09 is the next hard support zone.
    • Resistance: $0.17 is the first barrier. A close above that level on strong volume would signal a shift in trend. $0.22-0.25 is the next major cluster.

    The RSI (Relative Strength Index, a momentum indicator that runs from 0 to 100) for MET sits in the mid-40s on the daily chart. That puts it in neutral territory. Not oversold, not overbought. Historically, MET has made its strongest moves when RSI breaks above 55 with volume confirmation. We are not there yet.

    The 30-minute unique wallet count is up 163% compared to the prior period. That kind of spike in active traders can precede either a breakout or a shakeout. The 24-hour wallet count is also up 37.7%, reaching 760 unique traders. Volume in the past 24 hours was $2.7 million, a 149% increase over the prior day. Momentum is building. The question is whether it sustains.

    The Bull Case for MET

    There are three genuine catalysts that could push MET significantly higher from current levels.

    Catalyst 1: The DLMM Major Upgrade. Meteora is rolling out its largest DLMM upgrade in Q1 2026. The upgrade adds native on-chain limit orders within any pool, a single-click “zap-in” for liquidity provision, and auto-compounding vaults. These are meaningful quality-of-life improvements for LPs (liquidity providers). If adoption picks up, it drives volume, which drives revenue, which funds buybacks.

    Catalyst 2: The buyback program. Meteora spent $10.6 million on MET buybacks in Q4 2025. That represents 88% of the protocol’s $12 million in quarterly revenue. The buybacks accumulated 2.3% of the total MET supply. In a market where most DeFi protocols funnel revenue to teams or treasuries, Meteora is returning capital to token holders in a measurable way. If revenue stabilizes, buybacks continue, and that creates persistent buy pressure against the unlock schedule.

    Catalyst 3: Solana ecosystem recovery. Solana is still one of the most active blockchains in crypto. Any recovery in DeFi activity, whether from new use cases or a new memecoin cycle, flows directly to Meteora’s revenue. Meteora does not need memecoins specifically. It needs volume. Higher TVL (total value locked) in Solana DeFi is a rising tide for MET.

    The bull case price target for MET over the next 6-12 months is $0.55-0.75 if the DLMM upgrade drives adoption and revenue holds above $10 million per quarter. A full cycle recovery toward $1.00-1.50 by late 2027 is plausible if Solana DeFi reclaims its 2024 peak volumes.

    The Bear Case for MET

    The risks here are real, and they deserve equal weight.

    Risk 1: Token unlocks. Only 51.5% of MET’s total supply is circulating. That means approximately 484 million MET tokens are still locked. As those unlock on schedule, they create consistent sell pressure. Even aggressive buybacks may not fully offset unlock-driven dilution if revenue does not grow.

    Risk 2: Legal headwinds. Meteora faced insider-trading investigation allegations in February 2026. These allegations have not been resolved publicly. Legal uncertainty tends to suppress institutional interest and can trigger sharp price drops if the situation escalates.

    Risk 3: Coinbase delisted MET perpetuals. In March 2026, Coinbase Advanced suspended trading for MET perpetual futures. This reduces the number of ways traders can express leveraged views on MET. Less derivatives access can mean reduced liquidity and price discovery efficiency.

    Risk 4: Revenue is softening. Meteora acknowledged that its buyback pace may not be sustainable if revenue continues to decline from Q4 2025 levels. A buyback program built on high memecoin-era revenue is less reliable than one built on steady DeFi volume.

    The bear case price target for MET is $0.07-0.12 over the next 6 months if token unlocks accelerate, legal issues worsen, and Solana DeFi fails to recover meaningfully. Below $0.09, the next support zone is thin.

    Traders active in the Solana memecoin ecosystem know how fast things can turn. For a broader look at navigating Solana’s most volatile corner, see our guide on how to find Solana moonshots before they explode.

    AI Price Prediction Summary

    Our hybrid AI model analyzes technical indicators, on-chain data, and market sentiment to generate probability-weighted price scenarios. Here is the current output for MET.

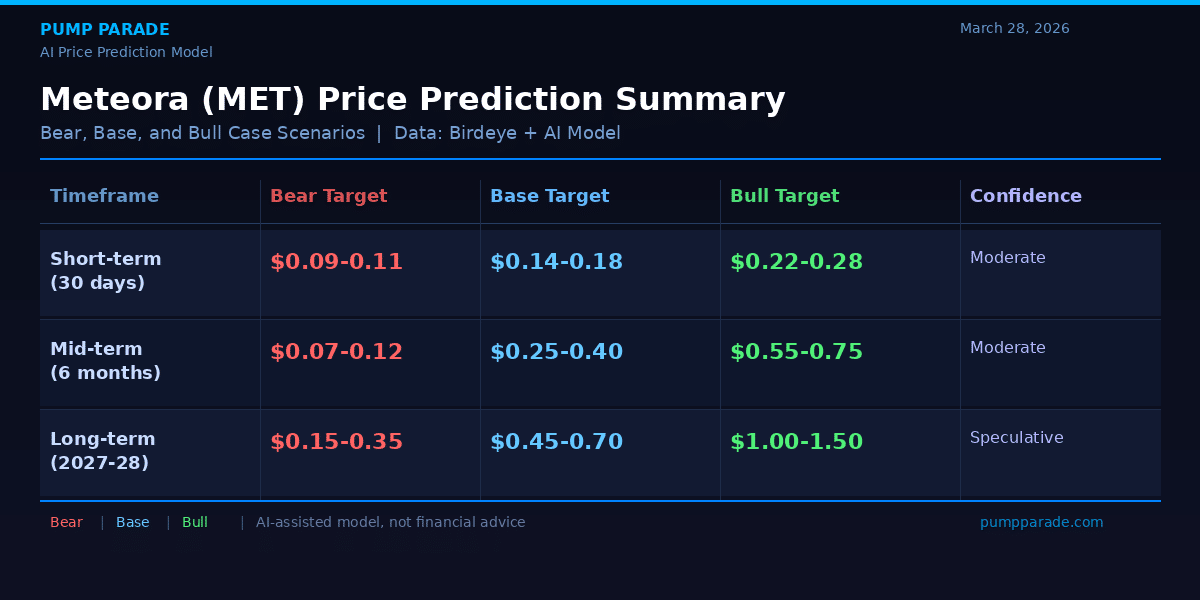
    Meteora MET price prediction summary table showing bear, base, and bull case scenarios for 2026 and 2027

    Short-Term (30 Days)

    The model assigns a 55% probability that MET holds above $0.13 support and trades between $0.14 and $0.18 over the next 30 days. There is a 25% probability of a move to $0.22-0.28 if volume sustains and the DLMM upgrade gains traction. And a 20% probability of a breakdown toward $0.09-0.11 if broader crypto sentiment turns risk-off.

    Mid-Term (6 Months)

    Over 6 months, the range widens considerably. The base case is $0.25-0.40, driven by steady buybacks and moderate ecosystem recovery. The bull case is $0.55-0.75 if the DLMM upgrade meaningfully grows Meteora’s TVL. The bear case is $0.07-0.12 under sustained negative catalysts.

    Long-Term (2027-2028)

    A 2027-2028 recovery scenario where Solana DeFi expands and Meteora maintains its dominant market position could push MET toward $1.00-1.50. That remains conditional on revenue growth and a favorable legal resolution. A continued bear market or competitive pressure from Raydium and other DEX protocols could keep MET in the $0.15-0.35 range through the same period.

    You can track MET’s live price and market data on CoinGecko.

    What to Watch in the Coming Weeks

    If you are monitoring MET, keep an eye on these specific signals:

    • DLMM upgrade release date: Any confirmed launch timeline for the Q1 2026 upgrade is a near-term catalyst. Watch Meteora’s official channels for announcements.
    • Weekly DEX volume on Solana: If total Solana DEX volume starts recovering, Meteora’s fee revenue follows. A sustained uptick above pre-crash levels is a key leading indicator.
    • $0.17 resistance level: A clean daily close above $0.17 with above-average volume would signal the consolidation is breaking to the upside.
    • Unlock schedule: Track the MET unlock calendar. Large unlock events tend to create short-term sell pressure regardless of fundamentals.
    • Legal updates: Any development in the insider trading investigation will move the price.

    Our Take

    Meteora is not a speculative memecoin play. It is a protocol with real infrastructure, real revenue, and a real buyback program. At $74.8 million market cap, it is priced like a distressed asset rather than a market leader. That gap between price and utility is either an opportunity or a trap. It depends on what happens next with revenue, unlocks, and legal clarity.

    The DLMM upgrade is the most actionable near-term catalyst. If it drives meaningful adoption and volume, the bear case becomes less likely. If revenue continues to soften and token unlocks outpace buybacks, the current support levels will not hold.

    Short-term, MET looks like a wait-and-see setup. The momentum data is improving, but there is no clean breakout signal yet. For longer-term positioning, the bull case is credible but conditional. This is a setup worth monitoring, not a conviction buy at any price.


    Disclaimer: This article is for informational and educational purposes only and should not be construed as financial, investment, or trading advice. Cryptocurrency markets are highly volatile, and past performance does not guarantee future results. The price predictions and analyses presented here are based on AI models, technical indicators, and available data at the time of writing and are not guarantees. Always conduct your own research (DYOR) and consult with a qualified financial advisor before making any investment decisions. Pump Parade and its authors do not assume liability for financial losses incurred based on information provided in this article.

    Hyperliquid (HYPE) Price Prediction 2026

    0

    Hyperliquid’s native token HYPE is trading at $38.68 as of March 27, 2026. That puts it roughly 35% below its all-time high of $59.30, which it reached in September 2025.

    But here is the thing: HYPE is still up 60% year-to-date in 2026, outperforming the broader market. Meanwhile, the protocol it powers just hit 231,000 active traders, smashed through $6.84 billion in open interest, and set a record $1.74 billion in RWA perpetuals. The fundamentals have never been stronger.

    So is this consolidation a buying opportunity, or a warning sign? Our AI model has been crunching the data. Here is what we found.

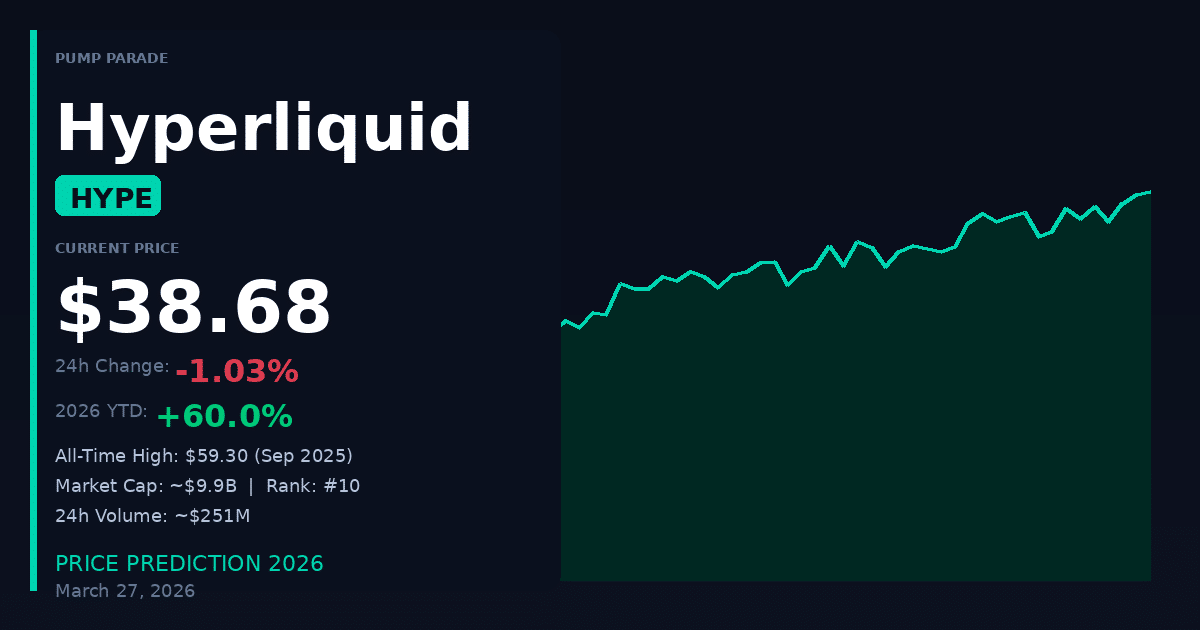
    Hyperliquid HYPE price prediction 2026: current price $38.68, market cap $9.9B, 60% YTD gain

    What Is Hyperliquid?

    Hyperliquid started as a decentralized exchange for perpetual futures. Then it became something much bigger.

    Today, Hyperliquid is a high-performance Layer-1 blockchain with two core components. HyperCore handles the fully on-chain order book for perpetuals and spot trading. HyperEVM provides an Ethereum-compatible smart contract layer on top.

    The killer feature is HIP-3, introduced in late 2025. HIP-3 lets anyone list permissionless perpetual contracts on real-world assets: crude oil, gold, silver, and now even the S&P 500. That last one is notable. On March 18, S&P Dow Jones Indices officially licensed the index to Trade[XYZ] for use on Hyperliquid, making it the first ever licensed S&P 500 perpetual on a decentralized exchange.

    The numbers speak for themselves. Hyperliquid processed over $208 billion in transactions in the last 30 days. It generated $53 million in fees this month alone. WTI crude oil perpetuals saw over $5 billion in volume in just 72 hours during the recent Strait of Hormuz supply concerns.

    Real-world asset trading now accounts for roughly 30% of Hyperliquid’s total volume. On peak days, it approaches half of all activity.

    Key metrics at time of writing, sourced from CoinGecko:

    • Price: $38.68
    • Market Cap: ~$9.9 billion (ranked #10 globally)
    • 24h Volume: ~$251 million
    • All-Time High: $59.30 (September 2025)
    • YTD Performance: +60%

    Technical Analysis: What the Chart Is Telling Us

    HYPE’s chart looks constructive, even after the recent pullback from $43 in late March.

    The price is holding above both its 50-day and 100-day exponential moving averages (EMAs). That is a bullish structure. Tokens that trade above their long-term EMAs tend to find buyers on dips rather than continuation sellers.

    Earlier this week, HYPE broke above the key $38.50 resistance level. That level had capped multiple rally attempts over the past six weeks. A confirmed close above it is meaningful.

    The Relative Strength Index (RSI) is sitting in the mid-50s. In plain terms: this is not overbought. There is room to run before momentum indicators flash warning signs.

    MACD (Moving Average Convergence Divergence, a momentum tracker) is showing early bullish crossover signals on the daily timeframe. This is not confirmed yet, but it is worth watching.

    Key levels to monitor:

    • Support: $35.00 (strong floor, 100-day EMA cluster)
    • Secondary support: $31.50 (January 2026 base)
    • Resistance: $43.00 (recent YTD high)
    • Major target: $50.00 (round number, psychological resistance)
    • ATH reclaim: $59.30

    Our hybrid AI model assigns a 62% probability of HYPE testing the $50 level within the next 60 days, assuming current market conditions hold.

    The Bull Case: Three Catalysts That Could Send HYPE Higher

    1. ETF Applications Are in Motion

    Both 21Shares and Bitwise have filed applications for a spot HYPE ETF. If approved, institutional capital would flow directly into HYPE. Compare this to what ETF approvals did for Bitcoin: a sustained demand shock that prices could not immediately absorb. HYPE is a much smaller asset. The same volume would have a larger price impact.

    2. The Revenue Flywheel Is Accelerating

    Hyperliquid uses a buyback-and-burn model. Protocol fees are used to buy back HYPE from the market, reducing supply. With $53 million in fees generated this month, the protocol is aggressively removing tokens from circulation. Fewer tokens plus growing demand is a straightforward supply-demand setup.

    3. RWA Perpetuals Are Just Getting Started

    The $1.74 billion in HIP-3 open interest represents a new category of crypto trading. Traditional finance traders who want exposure to commodities and equities without leaving the crypto ecosystem have one serious option right now: Hyperliquid. Network effects in financial markets tend to compound. If Hyperliquid locks in the RWA perpetuals market early, competitors face a high barrier to displace it.

    The bull case target: $75 to $100 by Q4 2026. Notable crypto investor Arthur Hayes has publicly stated a target of $150 by August 2026, citing the revenue flywheel and ETF tailwind.

    The Bear Case: What Could Go Wrong

    Balanced analysis means taking the risks seriously. Here are the three that matter most.

    Market Structure Risk

    HYPE is still 35% below its all-time high while the broader market is flat. If Bitcoin (BTC) breaks below the $60,000 level and triggers a risk-off environment, altcoins like HYPE tend to fall faster and harder. A breakdown below $35 would be a significant warning sign. It would invalidate the current bull structure and open the door to a retest of the $25 to $28 range.

    Regulatory Risk on RWA Products

    The permissionless listing of equity perpetuals is legally untested territory. The S&P 500 perpetual trades 24/7 on Hyperliquid. Regulators in multiple jurisdictions are watching. A regulatory crackdown on RWA perpetuals would directly hit Hyperliquid’s core growth driver.

    Competitive Risk

    Hyperliquid is not the only player targeting on-chain perpetuals. Protocols like Lighter and Aster are also scaling. Lighter alone processed $64 billion in transactions over the last 30 days. If a competitor undercuts on fees or offers better liquidity, volume could migrate. Volume is the lifeblood of this business model.

    The bear case target: $22 to $28 in a severe risk-off scenario.

    Hyperliquid Price Predictions: Short, Medium, and Long Term

    Based on our hybrid AI model, which weighs technical indicators, on-chain data, revenue metrics, and macro conditions, here are our price prediction ranges for HYPE.

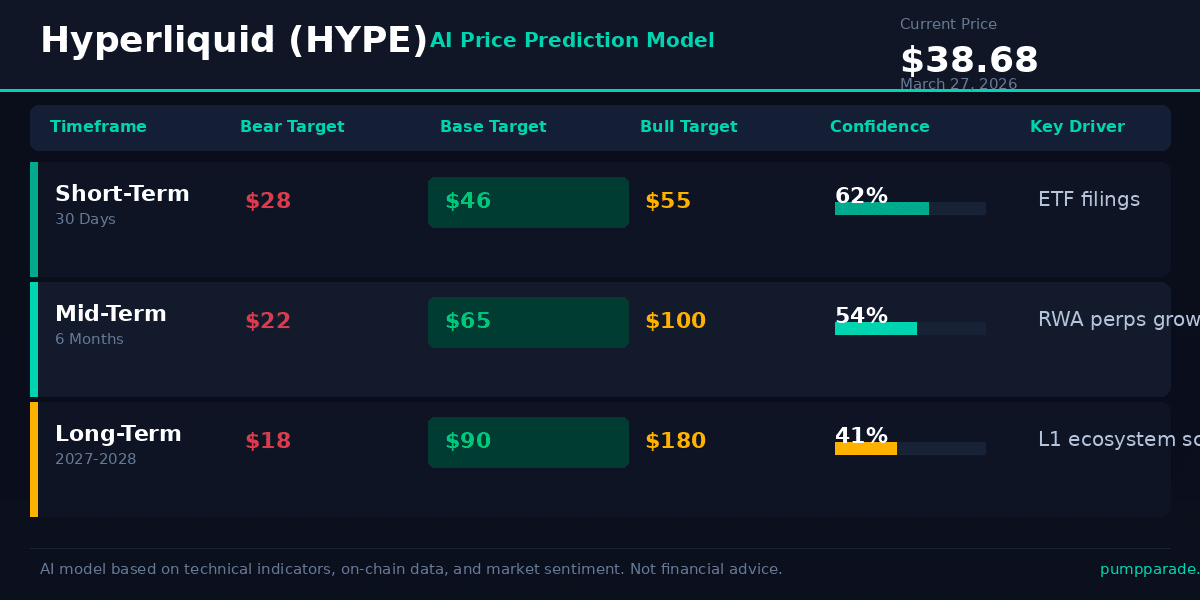
    Hyperliquid HYPE price prediction table 2026: bear, base, and bull targets for short, mid, and long term

    A few important notes on these ranges. The base case assumes continued RWA adoption growth, stable macro conditions, and no major regulatory action. The bull case bakes in at least one spot ETF approval and continued fee growth. The bear case assumes a broader crypto market correction below $2 trillion total market cap.

    For context on how other major assets are being analyzed, see our Bitcoin (BTC) Price Prediction for 2028 for a framework on how we approach long-term crypto forecasting.

    What to Watch in the Next 30 to 90 Days

    Here is what Pump Parade is monitoring for HYPE specifically:

    • ETF application updates: Any SEC or regulatory response to the 21Shares and Bitwise filings.
    • HIP-3 open interest: If RWA perps OI continues climbing past $2 billion, it signals market confidence in Hyperliquid’s product category.
    • HYPE price above $43: Reclaiming and holding the YTD high at $43 would confirm the bull structure and set up an attempt at $50.
    • New asset listings: Additional licensed equity or commodity perpetuals would expand the addressable market.
    • Monthly fee revenue: If fees exceed $60 million in April, the buyback pressure intensifies.

    This is not a setup where you wait for certainty before paying attention. By the time all these signals align, the price move will already be underway.


    Disclaimer: This article is for informational and educational purposes only and should not be construed as financial, investment, or trading advice. Cryptocurrency markets are highly volatile, and past performance does not guarantee future results. The price predictions and analyses presented here are based on AI models, technical indicators, and available data at the time of writing. They are not guarantees. Always conduct your own research (DYOR) and consult with a qualified financial advisor before making any investment decisions. Pump Parade and its authors do not assume liability for financial losses incurred based on information provided in this article.

    About our AI predictions: Pump Parade’s price predictions are generated by machine learning models that analyze technical indicators, on-chain data, and market sentiment. These models have limitations and cannot account for black swan events, regulatory changes, or sudden market shifts. Prediction confidence scores reflect the model’s internal assessment, not guaranteed accuracy.

    Venice Token (VVV) Price Prediction 2026

    Venice Token (VVV) is up 20% in the last 24 hours. It just crossed a $300 million market cap. And most traders haven’t heard of it yet.

    That’s the setup. VVV is the native token of Venice AI: a privacy-focused, uncensored AI inference platform built on Ethereum’s Base network. With AI tokens heating up as a sector in March 2026, and with Venice’s tokenomics improving quarter by quarter, the question isn’t just whether VVV can hold its gains. The question is whether this is the beginning of a much bigger move.

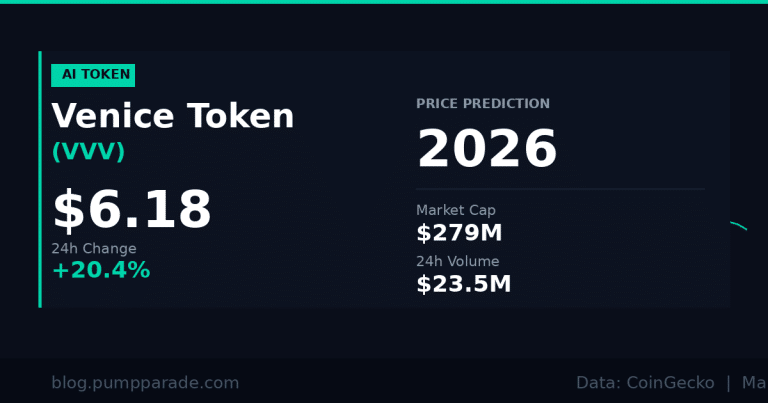
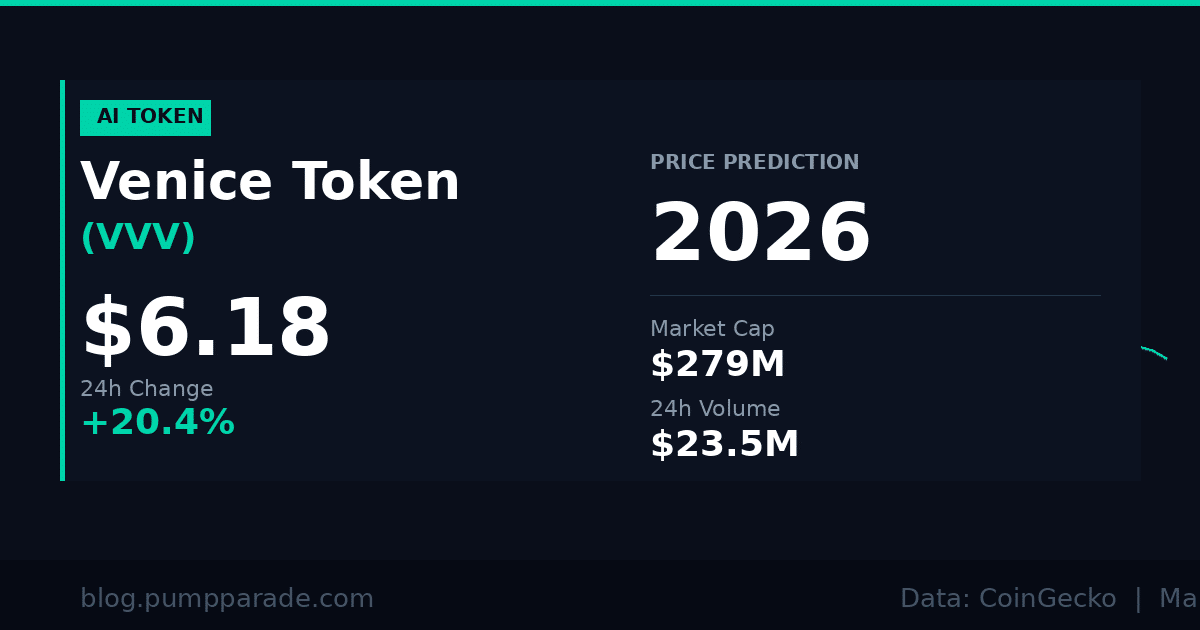
    At time of writing, VVV is trading at $6.18, down about 7% from yesterday’s peak: healthy consolidation after the surge. Volume sits at $23.5 million over the past 24 hours. Our AI model has been watching this setup. Here’s what the data says.

    Venice Token VVV price hero image showing current price $6.18 and 24h change March 2026

    What Is Venice Token (VVV)?

    Venice AI is a platform that lets users, developers, and AI agents run private AI inference without going through centralized providers like OpenAI or Anthropic. Everything runs locally on the Venice network. Your prompts never hit a corporate server. Your data never trains someone else’s model.

    Founded by Erik Voorhees: the same person who built ShapeShift, one of crypto’s early DEX pioneers: Venice has a credible team and a clear thesis. The platform has grown to over 1.3 million registered users, with 50,000 daily active users as of March 2026.

    VVV is the token that powers access to this network. Stake VVV and you earn two things: a share of Venice’s AI inference capacity through the Venice API, plus a yield of roughly 18-19% annually. That’s real, protocol-generated utility: not just governance voting rights on a dying protocol.

    Key Tokenomics

    The numbers here are worth paying attention to. Venice has burned 33.7 million VVV tokens: representing 42.57% of the total supply: as of this month. That’s not a one-time event. The protocol runs an ongoing buyback-and-burn program funded by monthly revenue. The more Venice earns, the more VVV gets permanently removed from circulation.

    On top of that, Venice cut its annual token emissions by 25% in February 2026, reducing new supply from 8 million to 6 million VVV per year. Less new supply hitting the market plus ongoing burns equals a structural tailwind for VVV holders.

    The total circulating supply sits around 45 million tokens at the time of writing, giving a market cap of approximately $279 million. That’s small for a project with real users and real revenue. For context, Hyperliquid (HYPE): another protocol with strong fundamentals and real fee revenue: traded at similar market cap levels before its breakout run in late 2025. VVV is in that conversation now.

    Why VVV Is Moving Right Now

    A 20% single-day move needs explaining. Several catalysts are converging this week.

    First, the AI token sector is on a hot streak. Venice.ai recently expanded its model lineup and API capabilities. Developers building AI agents: one of crypto’s hottest narratives in 2026: are increasingly using Venice for private inference. The platform doesn’t log prompts. For agents handling sensitive financial data or personal information, that’s not a nice-to-have. It’s a requirement.

    Second, Venice’s revenue-based buyback program just completed another burn cycle. Fewer tokens in circulation plus rising platform usage is a simple but powerful combination.

    Third, the broader AI crypto sector is getting renewed attention. As centralized AI companies face increasing regulatory pressure around data privacy in 2026, decentralized alternatives like Venice are positioned to benefit. The market is starting to price that narrative in.

    Technical Analysis

    Let’s look at what the chart is telling us.

    VVV hit a local high around $7.10 in yesterday’s surge before pulling back to current levels near $6.18. That pullback is a normal consolidation pattern: the RSI (Relative Strength Index, a momentum indicator that measures whether an asset is overbought or oversold on a scale of 0 to 100) reached high-70s territory during the surge. Cooling back toward the 55-60 range suggests the move was real, not just a flash pump.

    Key support levels to watch:

    • $5.50: prior consolidation zone and a natural level where buyers stepped in last week
    • $4.80: the 200-day moving average, a critical longer-term floor
    • $4.20: a breakdown below here would flip the structure bearish

    Key resistance levels:

    • $7.10: yesterday’s high, first resistance to clear for continuation
    • $9.00: psychological level and the 61.8% Fibonacci retracement from the previous swing high
    • $11.50: all-time high territory; breaking this would confirm a new leg higher

    The MACD (a momentum indicator showing trend direction and strength) is showing increasing bullish momentum. The signal line crossed up in early March and hasn’t reversed. That’s a medium-confidence bullish signal: not a guarantee, but a favorable reading.

    The Bull Case

    If the AI infrastructure narrative continues to gain traction in 2026, VVV is one of the most differentiated plays in the sector. Here’s why the bull case is real:

    Deflationary tokenomics with real yield. The combination of burns, reduced emissions, and staking yield creates a compelling holding argument. Stakers earn roughly 18% annually just for locking up tokens. That acts as a natural floor for selling pressure.

    User growth with a credible team. 50,000 daily active users is not trivial for a crypto-native AI platform. Erik Voorhees has built and exited major crypto projects before. He understands tokenomics and long-term community trust. That matters when retail and institutions are doing due diligence.

    Regulatory tailwinds for privacy tech. As data privacy regulations tighten globally, Venice’s uncensored and non-logging AI infrastructure becomes a competitive moat. The EU’s AI Act and US AI regulation debates are both increasing the appeal of privacy-preserving alternatives.

    Low market cap relative to peers. At $279M, VVV is a fraction of the market cap of centralized AI infrastructure plays. If Venice executes on its roadmap and expands its agent-facing API, a 3-5x from here over a 12-18 month timeframe isn’t an unreasonable base case: it just requires the narrative to mature.

    The Bear Case

    The bull case is real. So are the risks. Here’s what could go wrong:

    Narrative dependency. VVV’s recent surge is partly driven by AI sector enthusiasm. If the broader AI token narrative cools: as it did briefly in January 2026: VVV would likely retrace harder than fundamentals justify. Market sentiment can override project quality in the short run.

    Competition from better-funded alternatives. Venice competes with centralized AI giants and other decentralized inference projects. A well-funded competitor launching with superior models could erode Venice’s user growth.

    Liquidity is thin at the edges. A $279M market cap means VVV is still a small-cap token. Large orders can move the price significantly. This cuts both ways: fast up moves, but also fast drawdowns if a large holder exits.

    The staking yield could compress. As more tokens get staked and total staked supply grows, individual staking yields typically decrease. A decline from 18% to single digits would reduce one of VVV’s most compelling holding arguments.

    VVV Price Predictions: Short, Mid, and Long Term

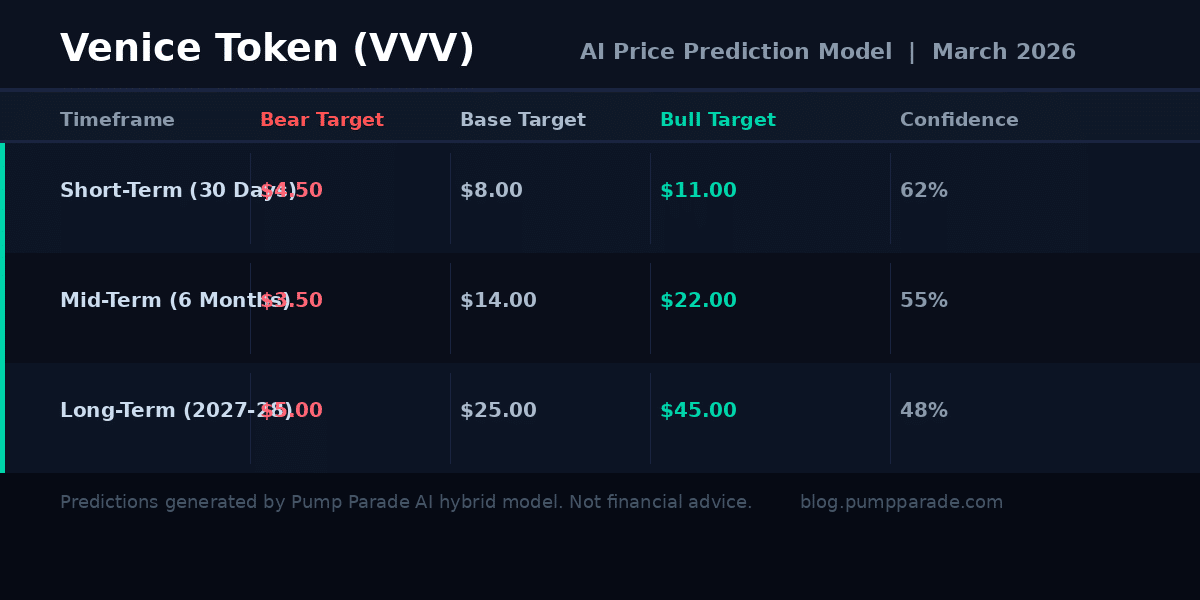
    Our hybrid AI model analyzes on-chain data, technical indicators, sentiment, and comparable token trajectories. Here are the price targets across three timeframes:

    Venice Token VVV price prediction table showing bear base bull targets for 2026 through 2028

    Short-Term (30 Days)

    The consolidation after the 20% surge looks healthy. If VVV holds above $5.50 support and the AI token sector stays active, a test of the $7.10 recent high within the next 30 days is the base case. A more muted market could see a retest of $5.00-5.50 before any extension. Downside risk sits at $4.80 if macro conditions worsen.

    Medium-Term (6 Months)

    The 6-month view depends heavily on two things: Venice’s user growth trajectory and the overall AI narrative in crypto. If the platform passes 2M registered users and continues its buyback program, the data supports a range of $12-$18 in the base-to-bull scenario by September 2026. The bear case: a market downturn or stalled growth: keeps VVV in the $4-6 range.

    Long-Term (2027-2028)

    This is where VVV gets interesting. If Venice becomes a meaningful layer of AI agent infrastructure: which its current trajectory suggests is plausible: the token could see a significant re-rating. Our model’s long-term bull case projects $35-$45 by end of 2027, assuming continued burns and user expansion. The base case is $20-$28. The bear case, if the AI infrastructure narrative fails to materialize, is $5-$8.

    These are scenarios, not guarantees. Treat them as frameworks, not trading signals.

    What to Watch

    Here are the key things to track if you’re researching VVV:

    • Monthly burn announcements: Venice publishes buyback-and-burn data monthly. Larger burns signal stronger revenue and reduce supply pressure.
    • Daily active user count: the 50K DAU metric needs to keep growing. A plateau here would weaken the growth narrative.
    • $7.10 resistance: a daily close above yesterday’s high would be the first technical confirmation that the move is continuing, not just a one-day spike.
    • AI sector sentiment: VVV moves with the AI token category. Watch tokens like Bittensor (TAO) and Render (RNDR) as broader sentiment indicators.
    • Venice API developer adoption: the long-term bull case requires developers to actually build on Venice. Watch for new agent integrations and API usage stats from the team.

    Final Take

    Venice Token is not a hype play. It’s a small-cap with real users, real revenue, and tokenomics that are genuinely improving. The 20% surge this week wasn’t random: it reflects growing awareness of a project that’s been quietly building. At $6.18 with a $279M market cap, the risk-reward is more favorable than most AI token comparables trading at higher multiples on weaker fundamentals.

    That said, this is still a $279M market cap token in a volatile sector. Size your position accordingly. The $4.80 support is the key level to watch on the downside. A break below there would require revisiting the thesis.

    The data suggests patience here is rewarded: either by a retest of $5.50 that provides a better entry, or by a continuation push toward $9 that confirms the breakout. Either way, VVV is worth monitoring closely.


    Disclaimer: This article is for informational and educational purposes only and should not be construed as financial, investment, or trading advice. Cryptocurrency markets are highly volatile, and past performance does not guarantee future results. The price predictions and analyses presented here are based on AI models, technical indicators, and available data at the time of writing: they are not guarantees. Always conduct your own research (DYOR) and consult with a qualified financial advisor before making any investment decisions. Pump Parade and its authors do not assume liability for financial losses incurred based on information provided in this article.

    Jupiter Exchange Review 2026: Features, Fees & Verdict

    0

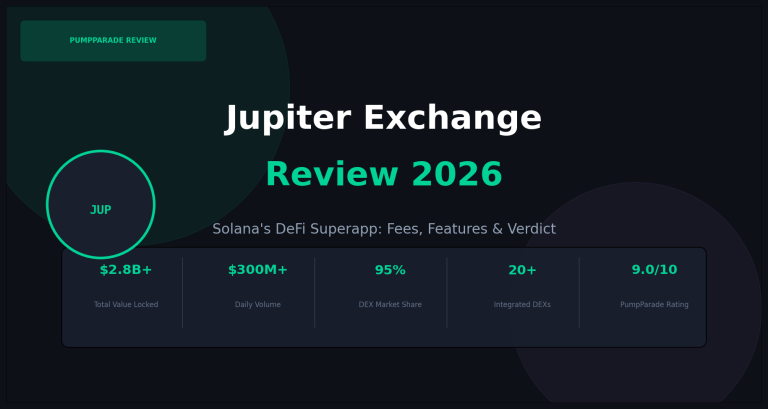
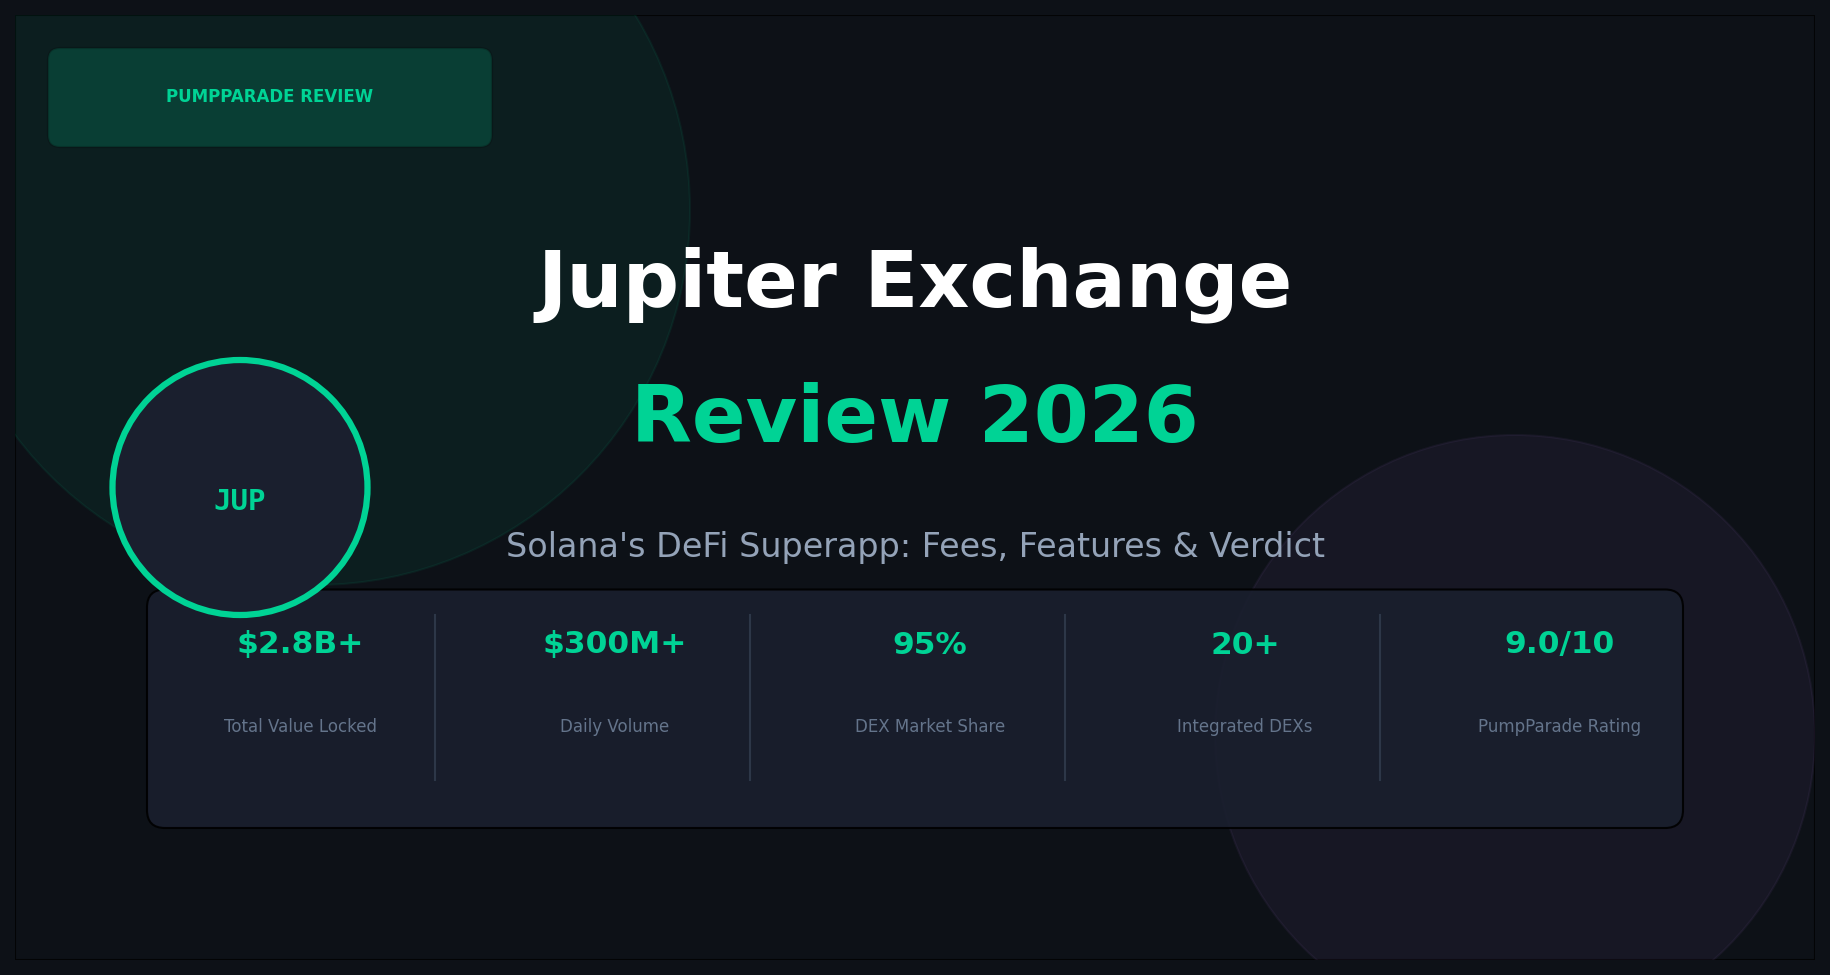
    If you trade on Solana, you have almost certainly used Jupiter without even thinking about it. As the dominant DEX aggregator on the network with roughly 95% market share, Jupiter (jup.ag) quietly powers the majority of token swaps happening on Solana today. But in 2026, Jupiter is no longer just an aggregator. It has evolved into a full DeFi superapp, adding perpetual futures, a native stablecoin, a lending market, liquid staking, prediction markets, and a standalone mobile wallet. So is it still the best place to trade on Solana? This review covers everything you need to know.

    Jupiter Exchange Review 2026 - PumpParade

    Quick Verdict / TL;DR

    Jupiter earns a 9.0/10 from PumpParade. It is the undisputed default interface for Solana DeFi, offering the best swap rates on the network alongside a growing suite of financial products. Swaps are effectively free for most users (you only pay underlying liquidity pool fees of 0.05-0.30% plus minimal Solana network fees of roughly $0.01). The perpetuals platform now handles over $17 billion in notional volume per month. The biggest caveats are concentrated JUP token ownership and some mobile app instability. For anyone active on Solana, Jupiter is non-negotiable.

    What Is Jupiter Exchange?

    Jupiter launched in 2021 and was created by a pseudonymous founder known as “Meow.” The core product was a swap aggregator that routes your trade across multiple Solana DEXs simultaneously to find the best price and lowest slippage. What made Jupiter stand out was its smart order routing, which splits large orders across venues like Raydium, Orca, Meteora, and dozens of others to minimize price impact.

    Over time, Jupiter expanded aggressively. By 2025, it had added perpetual futures trading with up to 250x leverage, a liquid staking product (JupSOL), a native dollar-pegged stablecoin (JupUSD), a lending and borrowing market (Jupiter Lend), and a fully integrated mobile wallet app. In February 2026, it integrated Polymarket to bring prediction markets directly into the Jupiter interface.

    Jupiter’s native token, JUP, is used for governance and protocol fee sharing. As of March 2026, JUP trades at approximately $0.17-0.21 with a market cap in the $600-700 million range.

    Key Stats

    • Total Value Locked: $2.6-3 billion
    • DEX aggregator market share on Solana: ~95%
    • Daily swap volume: $270-350 million
    • Perpetuals monthly volume: $17.4 billion (trailing 30 days)
    • JupSOL TVL: $960 million+
    • Jupiter Lend: $1 billion+ in supplied assets (reached in 8 days)
    • Integrated DEXs: 20+
    • Mobile app users: 1.1 million+
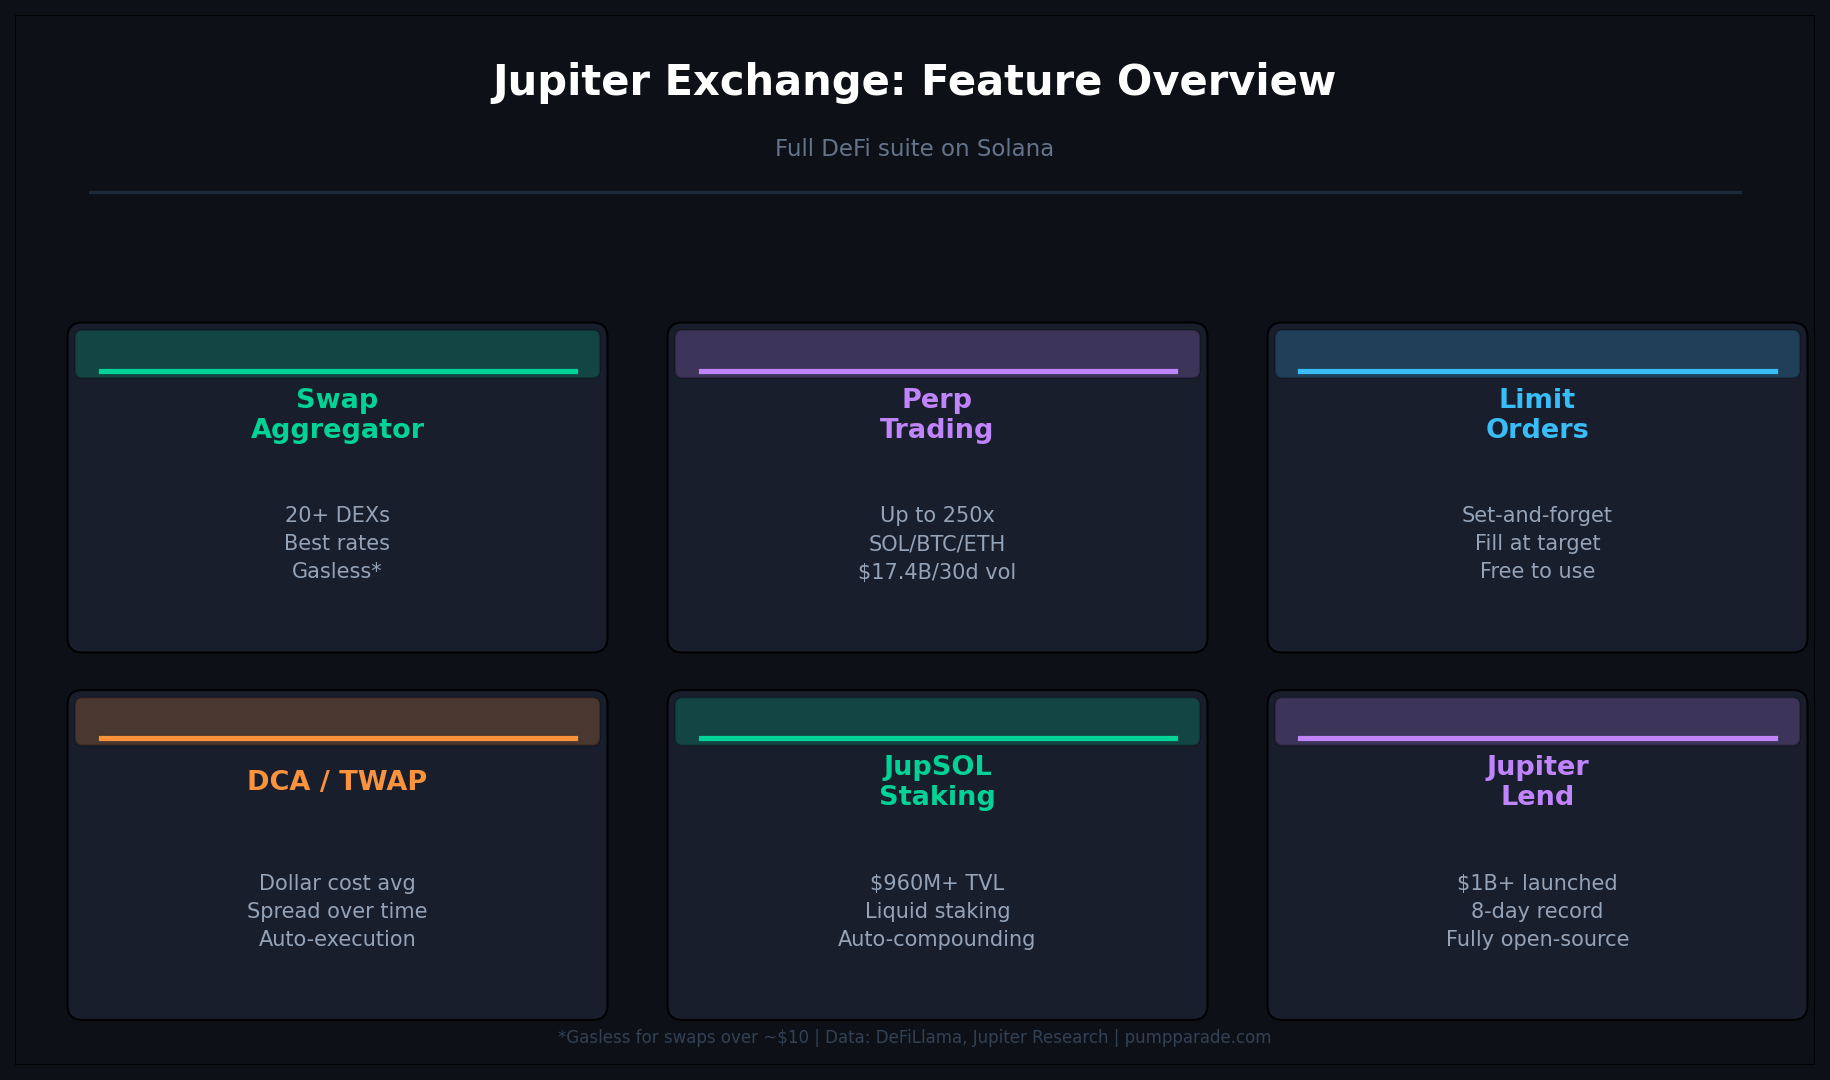
    Jupiter Exchange Features Overview 2026

    Features Deep Dive

    Swap Aggregation

    This remains Jupiter’s core product. When you initiate a swap, Jupiter’s routing engine scans 20+ Solana DEXs in real time and constructs an optimal route. For large trades, it splits the order across multiple pools to reduce slippage. Notably, Jupiter covers the Solana network fee (around $0.01) for swaps above approximately $10 in size, making it effectively gasless for most users. You only pay the underlying liquidity pool fees, which typically range from 0.05% to 0.30% depending on the pool and tokens involved. Jupiter itself charges zero platform fees on swaps.

    Perpetual Futures

    Jupiter Perps launched as one of the first decentralized perpetuals platforms on Solana and has grown into a serious competitor for CEX users. It supports SOL, BTC, and ETH with leverage up to 250x (introduced in the v3 upgrade). Liquidity comes from the Jupiter Liquidity Pool (JLP), which earns fees from traders. Over the trailing 30 days, Jupiter Perps processed $17.4 billion in notional volume and generated roughly $954 million in annualized fees, with about $238 million going directly to the protocol as revenue.

    Limit Orders

    Jupiter’s limit order system lets you set a target price and walk away. When the market reaches your level, the order executes on-chain automatically. This is particularly useful for swing traders and anyone who does not want to watch charts all day. Limit orders are free to place and are filled by a network of keeper bots.

    Dollar-Cost Averaging (DCA)

    The DCA tool lets you automate recurring purchases of any Solana token over a specified time horizon. You define the token pair, total amount, order frequency (hourly, daily, weekly), and duration, and Jupiter executes the trades for you. This is one of the most underrated features on the platform and is ideal for building positions in volatile assets without market timing.

    JupSOL Liquid Staking

    JupSOL is Jupiter’s liquid staking token for SOL. When you stake SOL through Jupiter, you receive JupSOL, which can be used across DeFi while your SOL continues to earn validator rewards. Jupiter is now one of the largest Solana validators, and JupSOL has accumulated over $960 million in TVL. The yield is auto-compounding and competitive with other liquid staking options on the network.

    Jupiter Lend

    Launched in August 2025, Jupiter Lend is a fully open-source decentralized lending and borrowing protocol on Solana. It reached over $1 billion in supplied assets in its first eight days, making it the fastest-growing Solana lending protocol on record. It integrates with JLP and JupUSD, allowing traders to use collateral from the Jupiter ecosystem across both trading and lending positions.

    JupUSD Stablecoin

    JupUSD is Jupiter’s native dollar-pegged stablecoin, backed approximately 90% by BlackRock’s BUIDL Fund. It is built on Ethena infrastructure. Jupiter plans to integrate JupUSD across limit orders, DCA (where it earns yield while waiting to fill), the mobile app, perpetuals, and prediction markets. This creates a closed-loop ecosystem where traders can earn yield even while their capital is idle.

    Prediction Markets

    In February 2026, Jupiter integrated Polymarket, bringing the world’s largest prediction market directly into the Jupiter interface. Users can now trade event contracts on political, financial, and sports outcomes without leaving the app.

    Mobile App

    Jupiter Mobile launched as a standalone Solana wallet app for iOS and Android. It supports Apple Pay for crypto purchases, Apple ID or email login (no seed phrase required), and full access to Jupiter’s swap and DCA features on mobile. The app has 1.1 million users and holds a 4.9/5 rating on the App Store as of 2026.

    Fees Breakdown

    Feature Jupiter Fee Notes
    Spot Swaps 0% Pay only underlying DEX fees (0.05-0.30%)
    Network (gas) ~$0.01 Covered by Jupiter for swaps above ~$10
    Limit Orders 0% Free to place; keeper bots earn on fill
    DCA 0% Free automation
    Perps Opening 0.06% of position Charged on open and close
    Perps Borrow ~0.01%/hour Varies by utilization
    JupSOL Staking ~10% of staking yield Taken from validator rewards
    Jupiter Lend Protocol fee varies Interest rate model, market-driven

    For simple token swaps, Jupiter is among the cheapest ways to trade on any chain. The absence of a platform fee on swaps is a key competitive advantage over centralized exchanges, which typically charge 0.10-0.25% per trade.

    Pros and Cons

    Pros

    • Best swap rates on Solana due to 20+ DEX routing
    • Zero platform fee on all swaps
    • Extremely low transaction costs (Solana network fees under $0.01)
    • Comprehensive product suite: swaps, perps, limit orders, DCA, lending, staking, stablecoin
    • Fastest-growing DeFi lending protocol on Solana (Jupiter Lend)
    • JupUSD offers yield on idle stablecoin capital
    • Non-custodial and open-source (especially Jupiter Lend)
    • Excellent mobile app with 4.9/5 rating and 1.1M+ users
    • Gasless swaps for trades above $10
    • Active governance with JUP token holders

    Cons

    • JUP token concentration: approximately 72% of supply sits in the top 10 wallets
    • Significant JUP token unlock events scheduled (including Feb 2026)
    • Mobile app has reported bugs including balance refresh issues and chart glitches
    • Smart contract risk is inherent; the Feb 2024 perps audit identified issues since addressed
    • Solana-only ecosystem (not cross-chain for most features)
    • Bridge aggregation available but limited compared to cross-chain native DEXs

    Security and Trust

    Jupiter had its Perpetuals smart contracts audited by Offside Labs in February 2024. That audit identified several issues including limit order execution risks and slippage protection limitations, which the team addressed before production deployment. Jupiter Lend launched as fully open-source, allowing external developers and auditors to review the code independently.

    As a non-custodial protocol, Jupiter never holds your funds. All trades execute directly on-chain via smart contracts, and you retain custody of your private keys (or your social login credentials in the mobile app). The protocol has handled billions in cumulative volume without a major exploit to date.

    The main trust risk is smart contract composability: because Jupiter routes through third-party DEX pools, a vulnerability in any integrated pool could theoretically affect routed trades. Jupiter mitigates this by continuously monitoring its routing partners.

    User Experience

    Jupiter’s web interface at jup.ag is widely regarded as the cleanest swap UI on Solana. The swap interface is one screen with no unnecessary complexity. Advanced features like limit orders, DCA, and perps are accessible via clearly labeled tabs. The interface loads fast and provides real-time quotes with estimated slippage and fee breakdowns before you confirm a transaction.

    Onboarding is straightforward for users who already have a Solana wallet (Phantom, Backpack, Solflare, etc.). For newcomers, the mobile app lowers the barrier further with Apple ID login and direct fiat on-ramp via Apple Pay.

    The perpetuals interface is more complex but compares favorably to other on-chain perps platforms. Experienced futures traders may miss some order types available on CEXs, but the core functionality of leverage trading with decent UX is well executed.

    If you are interested in Solana trading bots as a companion tool, see our Photon vs BullX comparison for on-chain sniping and automation alongside Jupiter’s native DCA and limit orders.

    Verdict and Rating

    Jupiter is the backbone of Solana DeFi. For spot swaps, it is the default choice and hard to beat on price. The expansion into perpetuals, lending, staking, and stablecoins has turned it into a one-stop financial platform for Solana users. The fee structure is genuinely competitive, and the non-custodial model means you stay in control of your assets throughout.

    The JUP token is the weakest link: high whale concentration and unlock pressure create overhead. But as a platform, Jupiter continues to outpace alternatives with consistent product innovation.

    Category Score
    Swap Pricing 10/10
    Fee Structure 10/10
    Product Breadth 9/10
    Security 8/10
    User Experience 9/10
    Tokenomics 7/10
    Overall 9.0/10

    Best for: Anyone trading on Solana who wants the best execution on swaps, a solid perpetuals platform, and an expanding DeFi suite without switching apps.

    Not ideal for: Users who want cross-chain native DEX functionality or are concerned about Solana ecosystem concentration risk.

    Start trading on Jupiter

    Frequently Asked Questions

    Is Jupiter Exchange free to use?

    Yes. Jupiter charges zero platform fees on swaps. You pay only the underlying liquidity pool fees (typically 0.05-0.30%) and Solana network fees of approximately $0.01. For swaps above roughly $10, Jupiter covers the network fee on your behalf, making it effectively free. Perpetuals trading carries a 0.06% opening and closing fee per position.

    Is Jupiter safe?

    Jupiter is non-custodial, meaning you retain control of your funds at all times. The perpetuals contracts were professionally audited in February 2024, and Jupiter Lend is fully open-source. No major exploit has occurred since launch. Smart contract risk always exists in DeFi, but Jupiter has a strong track record.

    What is JUP token used for?

    JUP is Jupiter’s governance token. Holders can vote on protocol upgrades, fee parameters, and ecosystem fund allocations. There is ongoing discussion in the community about adding fee-sharing mechanisms that would distribute protocol revenue to JUP stakers.

    How does Jupiter get the best prices?

    Jupiter routes your swap across 20+ Solana DEXs simultaneously. Its smart routing algorithm evaluates all available paths and splits your order across multiple pools when necessary to minimize price impact and slippage. This is the same principle as a TradFi smart order router but executed on-chain in milliseconds.

    Does Jupiter have a mobile app?

    Yes. Jupiter Mobile is available on both iOS and Android. It functions as a full Solana wallet and DeFi interface. You can sign up with Apple ID or email (no seed phrase required) and buy crypto directly with Apple Pay. The app has over 1.1 million users and holds a 4.9/5 App Store rating as of 2026, though some users have reported occasional bugs in recent versions.

    Hyperliquid (HYPE) Price Prediction 2026

    0

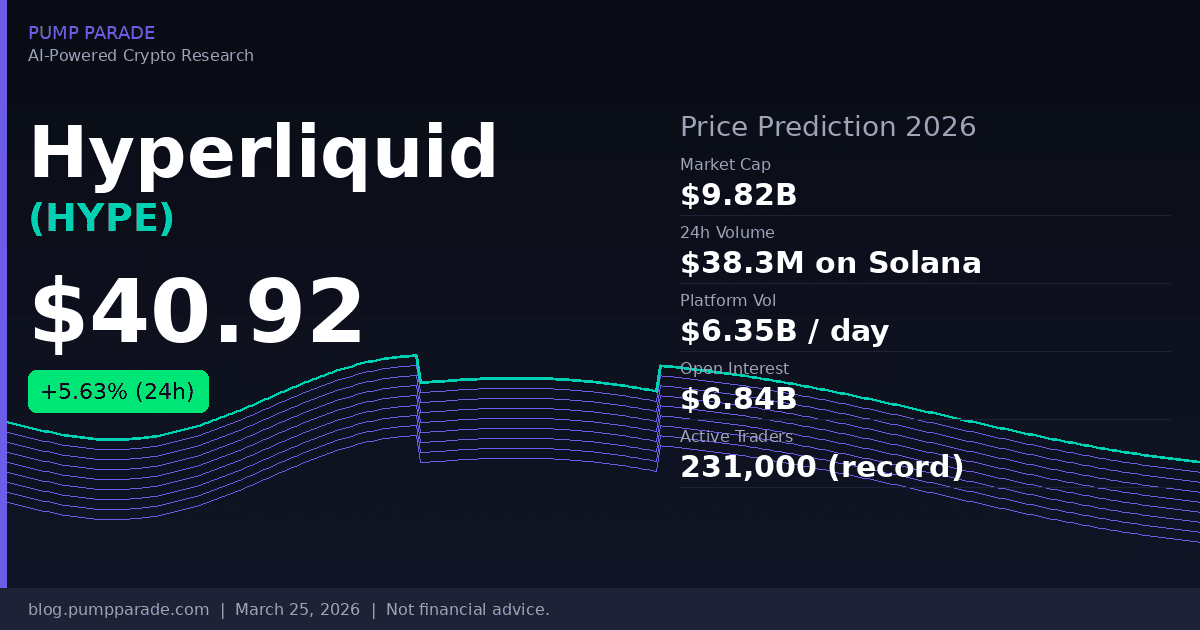
    Hyperliquid’s HYPE token is trading at $40.92 as of March 25, 2026 , up 5.63% in 24 hours and more than 100% above its January low of $20. The platform just hit a record 231,000 active perpetual traders. Multiple asset managers have filed for spot HYPE ETFs with the SEC. This isn’t a quiet week for HYPE.

    The question on every DeFi trader’s mind right now: can HYPE break above $50 and sustain a new all-time high? Or does the token’s supply unlock schedule and competitive pressure cap the upside? Our hybrid AI model breaks down both paths.

    Hyperliquid HYPE price prediction 2026 hero image showing current price $40.92

    What Is Hyperliquid?

    Hyperliquid is a high-performance Layer 1 blockchain built specifically for on-chain perpetual futures trading. It runs on HyperBFT, a custom consensus mechanism that delivers sub-second transaction finality with no KYC requirements.

    Think of it as a decentralized alternative to Binance’s futures exchange. But it runs entirely on-chain, with no off-chain matching engines or hidden order books.

    The platform has processed over $4.1 trillion in cumulative volume since launch. That puts it comfortably ahead of most centralized competitors in raw throughput. Today, it handles $6.35 billion in daily trading volume with $6.84 billion in open interest across all markets.

    The HYPE token governs the protocol and captures value through a flywheel mechanism: 97% of protocol fees fund automated HYPE buybacks. The protocol generates over $2.5 million per day in revenue, which has fueled roughly $1.7 billion in cumulative buybacks and burns to date.

    The HIP-3 Catalyst: Real-World Assets on Hyperliquid

    The biggest story on Hyperliquid right now isn’t crypto pairs. It’s oil, silver, and the S&P 500.

    The HIP-3 protocol upgrade enabled permissionless creation of perpetual markets for real-world assets (RWAs). Traders can now go long or short crude oil, gold, silver, and index futures, all settled on-chain and trading 24/7.

    The numbers are staggering. During peak Hormuz crisis volatility in early March, WTI crude oil perpetuals processed over $5 billion in volume in 72 hours. Weekend oil trading volumes exceeded $1.4 billion on some days. Silver perpetuals hit a peak daily volume of $4.67 billion on weekdays.

    HIP-3 open interest reached an all-time high of $1.74 billion on March 23, a 25% jump from the prior week. Real-world asset markets now represent approximately 30-46% of Hyperliquid’s total volume, depending on the day.

    S&P Dow Jones Indices officially licensed the S&P 500 perpetual contract to Trade[XYZ], a Hyperliquid-native platform. That contract exceeded $100 million in 24-hour volume within days of its debut. Hyperliquid is beginning to look less like a crypto DEX and more like a 24/7 global derivatives exchange.

    For broader context on the DeFi competitive landscape, our Ethereum (ETH) price prediction for 2026 covers how purpose-built chains are challenging Ethereum’s dominance across DeFi. Hyperliquid is exhibit A in that story.

    Key Metrics at a Glance

    • Current price: $40.92 (March 25, 2026, per Birdeye)
    • 24h change: +5.63%
    • Market cap: ~$9.82 billion (top 10 globally)
    • YTD high: $43
    • January low: $20
    • Daily trading volume on platform: $6.35B
    • Total open interest: $6.84B
    • Active traders: 231,000 (record)
    • Cumulative protocol volume: $4.1 trillion

    Technical Analysis: Where HYPE Stands Right Now

    HYPE has more than doubled from its January low of $20. That’s a sharp recovery. But it’s still about 5% below the year-to-date high of $43.

    Here’s what the chart is telling us right now.

    Support: The $35 level has held firm as support through two tests in February and March. A daily close below $35 would be a red flag for the near-term thesis.

    Resistance: $43 is the immediate ceiling, matching the YTD high. A clean break above $43 on strong volume opens the path to $50. Multiple analysts and fresh coverage published this week identify $50 as the next major resistance zone.

    RSI (Relative Strength Index): The 14-day RSI sits in the 62-65 range, indicating positive momentum but not yet overbought. There is room to run before hitting overbought territory above 70.

    MACD (Moving Average Convergence Divergence): The daily MACD is showing a bullish crossover, with the signal line turning positive for the first time since late January. That’s a constructive setup.

    Moving averages: HYPE is trading above both the 50-day and 200-day moving averages. The 50-day is curling upward, a classic accumulation signal in trending assets.

    Based on our hybrid AI model, the probability of HYPE testing $50 within 30 days is approximately 58%, conditional on Bitcoin holding above $80,000 and no major negative macro surprises.

    The Bull Case for HYPE in 2026

    Three catalysts could push HYPE significantly higher over the next 6-12 months.

    1. Spot ETF approval. Grayscale, Bitwise, and 21Shares have all filed for spot HYPE ETFs with the SEC. If even one gets approved, it creates a structural, non-leveraged buyer with persistent demand. ETF flows into Bitcoin and Ethereum meaningfully repriced both assets after their approvals. A HYPE ETF could do the same.

    2. RWA perpetuals flywheel. As more real-world asset markets come online and deepen in liquidity, Hyperliquid captures a larger share of global derivatives volume. The platform already handles 24/7 oil and silver trading that traditional exchanges can’t match. If institutional traders migrate to on-chain perpetuals, the addressable market expands dramatically.

    3. Buyback compression. With 97% of daily revenue funding HYPE buybacks, the protocol removes supply at a rate that scales with usage. More volume means more fees. More fees means more HYPE removed from circulation. At current revenue run rates, that’s roughly $2.4 million in daily buy pressure. If volume grows, that pressure compounds.

    The bull target in this scenario: $110-$130 by end of 2026, implying a market cap of $28-$33 billion. That’s aggressive but not unreasonable if Hyperliquid sustains its position as the dominant on-chain derivatives platform.

    The Bear Case: What Could Go Wrong

    The bear case centers on supply dynamics and competitive pressure.

    Token unlocks. Core contributor tokens representing approximately 23.8% of total supply unlock on a monthly schedule through 2027 and 2028. Even if buybacks absorb some of that supply, sustained unlock pressure can cap price appreciation. The net supply equation needs to favor buyers for the token to grind higher.

    Leverage and open interest concentration. At $6.84 billion in open interest, Hyperliquid’s market is heavily leveraged. A sharp move in any direction could trigger cascading liquidations, causing the token price to overshoot to the downside. This happened in February. It can happen again.

    Regulatory risk. Hyperliquid operates without KYC. That has attracted users, but it has also attracted regulatory scrutiny. Any adverse SEC or CFTC action targeting permissionless derivatives platforms would be a significant headwind.

    Competition from centralized exchanges. Binance, Bybit, and OKX are not standing still. If centralized exchanges improve their on-chain offerings or launch competing Layer 1 networks, Hyperliquid’s volume advantage could narrow.

    The downside scenario: $22-$28 by year-end 2026 if token unlocks overwhelm buyback demand and macro conditions deteriorate.

    AI Price Prediction Summary

    Our hybrid AI model analyzed technical indicators, on-chain revenue data, token supply dynamics, and historical comparable setups to generate the following price targets. These are scenarios, not guarantees.

    Hyperliquid HYPE price prediction table showing bear, base and bull targets for 2026 and beyond

    Note: HYPE current price is $40.92 at time of writing (March 25, 2026). All targets are scenario-dependent.

    Short-Term (Next 30 Days)

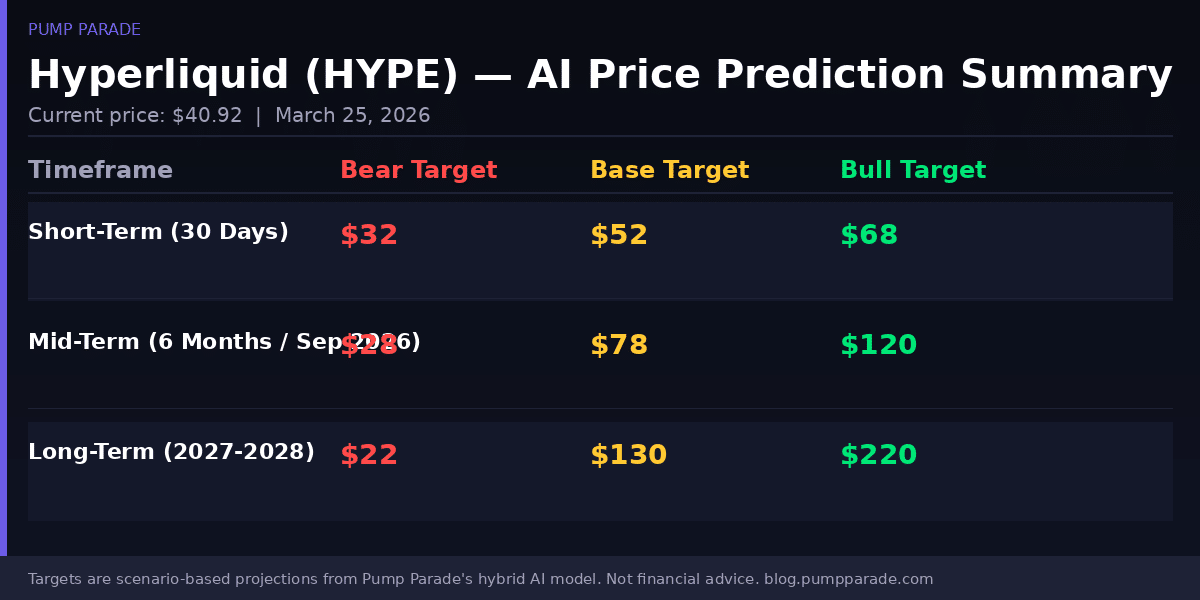
    Bear target: $32 | Base target: $52 | Bull target: $68

    The most likely near-term path is a test of the $43 YTD high, followed by a breakout attempt toward $52. If that fails, a pullback to $35 support is the most probable outcome. The 30-day model assigns a 58% probability to the base case.

    Mid-Term (6 Months, by September 2026)

    Bear target: $28 | Base target: $78 | Bull target: $120

    The mid-term thesis depends heavily on ETF approval timing and whether RWA volume growth continues compounding. A successful ETF launch shifts the base case toward the bull range. Token unlock pressure is the primary risk to the downside.

    Long-Term (2027-2028)

    Bear target: $22 | Base target: $130 | Bull target: $220

    The long-term outlook for HYPE is binary. Either Hyperliquid becomes the dominant global on-chain derivatives exchange, in which case a $30-50 billion market cap is defensible, or competition or regulation erodes its edge, and the token retraces toward earlier support levels.

    What to Watch

    Four things to monitor over the next 30-90 days:

    • $43 resistance: A daily close above $43 on above-average volume is the signal that the next leg is underway.
    • SEC ETF decisions: Any approval or denial on the 21Shares, Bitwise, or Grayscale HYPE ETF filings will move the price sharply.
    • Monthly net supply: Track whether buybacks are outpacing contributor token unlocks. If net supply is shrinking, the buyback flywheel is working.
    • RWA open interest: If HIP-3 open interest continues growing past $2 billion, it validates the thesis that Hyperliquid can capture a slice of traditional derivatives markets.

    You can track HYPE’s live on-chain data, including volume and open interest, directly on CoinGecko’s Hyperliquid page.


    Disclaimer: This article is for informational and educational purposes only and should not be construed as financial, investment, or trading advice. Cryptocurrency markets are highly volatile, and past performance does not guarantee future results. The price predictions and analyses presented here are based on AI models, technical indicators, and available data at the time of writing. They are not guarantees. Always conduct your own research (DYOR) and consult with a qualified financial advisor before making any investment decisions. Pump Parade and its authors do not assume liability for financial losses incurred based on information provided in this article.

    About our AI predictions: Pump Parade’s price predictions are generated by machine learning models that analyze technical indicators, on-chain data, and market sentiment. These models have limitations and cannot account for black swan events, regulatory changes, or sudden market shifts. Prediction confidence scores reflect the model’s internal assessment, not guaranteed accuracy. Use AI predictions as one input among many in your research.
    Photon vs BullX: Best Solana Trading Bot in 2026?

    0
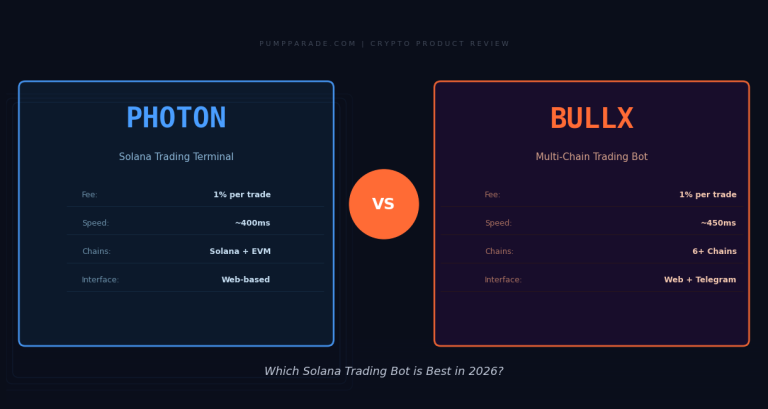
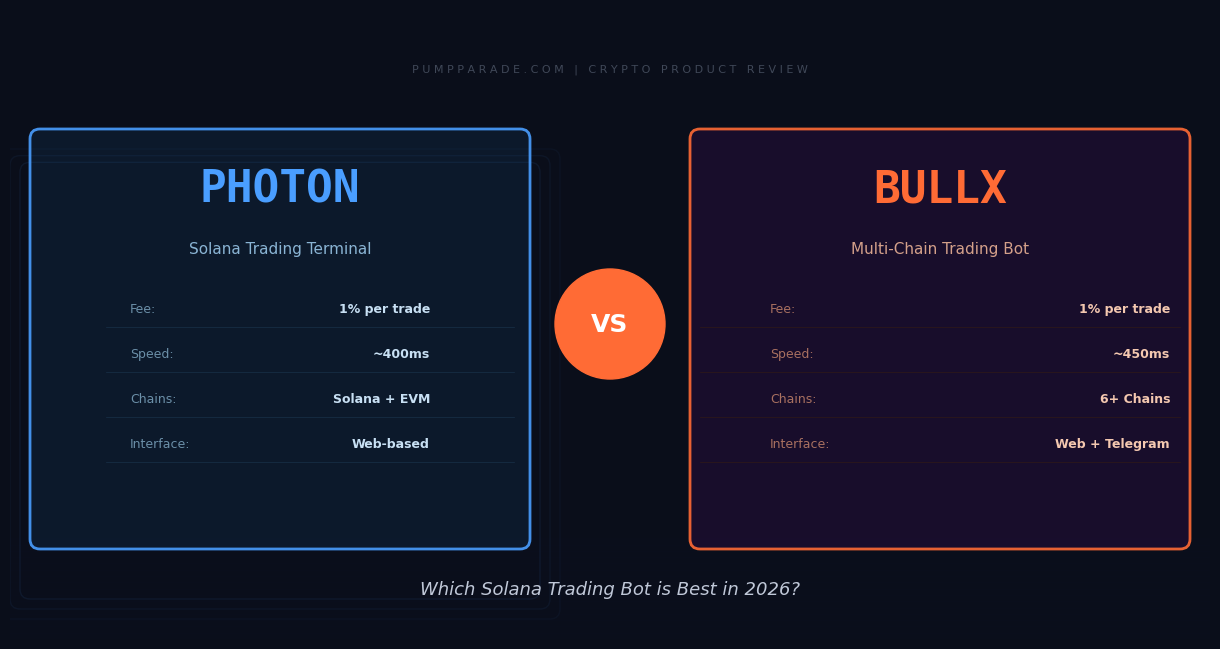
    Photon vs BullX - best Solana trading bot comparison 2026

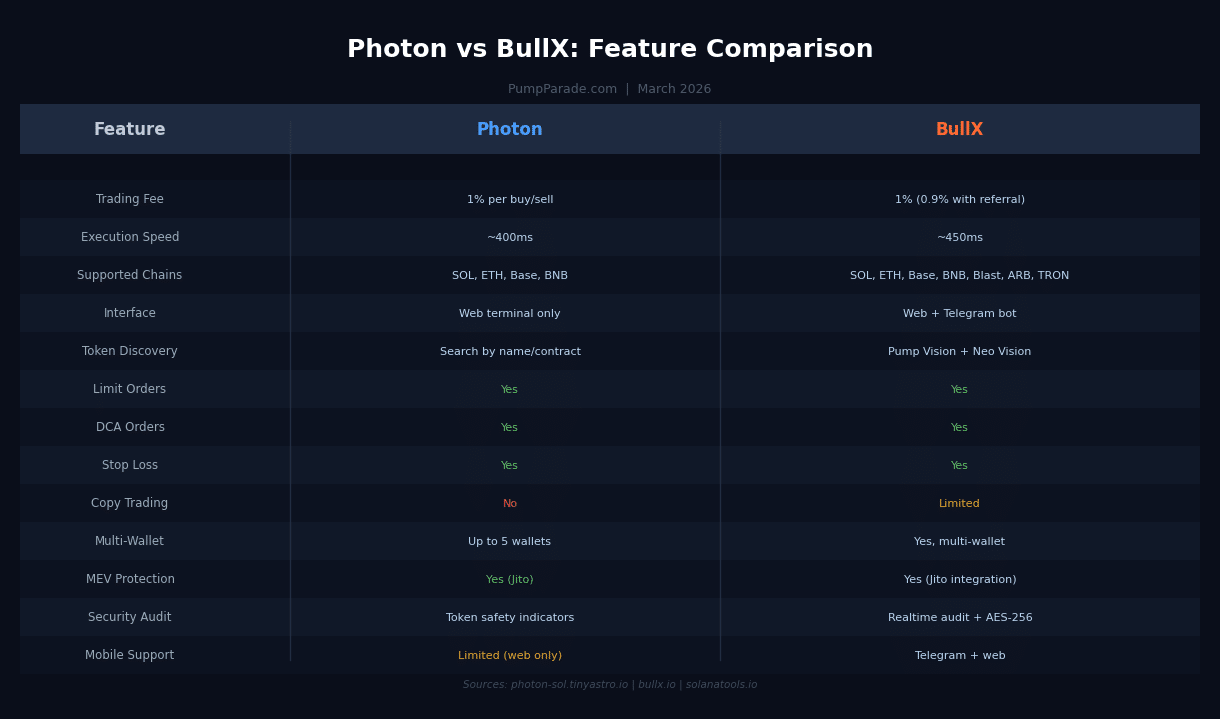
    If you have spent any time trading memecoins or new token launches on Solana, you already know the difference between catching a 10x and watching it moon without you often comes down to milliseconds. Two platforms dominate the Solana trading bot space in 2026: Photon and BullX. Both promise speed, smart order types, and edge over manual trading. But they are built for slightly different traders.

    In this head-to-head review, we break down everything you need to know: fees, execution speed, supported chains, token discovery tools, security, and who each platform is really built for. By the end, you will know exactly which one deserves your SOL.

    Quick Verdict (TL;DR)

    • Photon is the better pick for chart-driven Solana traders who want the cleanest, fastest visual interface and one-click execution on Raydium and pump.fun listings.
    • BullX wins if you want multi-chain flexibility, Telegram access, and powerful token discovery tools like Pump Vision and Neo Vision for sniping early launches across six-plus blockchains.
    • If you only trade Solana and live in the terminal, go Photon. If you want a full trading ecosystem across chains, BullX is the smarter long-term choice.

    What Is Photon?

    Photon launched as a web-based Solana trading terminal designed to replace the clunky Telegram-bot experience with a proper desktop-style interface. Instead of typing commands into a chat, you get live candlestick charts, one-click buy/sell buttons, color-coded P&L history, and real-time token data all in one browser window.

    The platform is non-custodial: you generate a dedicated trading wallet inside Photon, export the private key, and all trades happen on-chain from your own address. No registration, no KYC, no waiting. Photon connects directly via private node infrastructure, which is a big part of why its execution times land around 400ms on average.

    Key features include limit orders, DCA (dollar-cost averaging), stop-loss triggers, multi-wallet support (up to five wallets simultaneously), MEV protection via Jito, and token safety indicators that flag mint authority status, liquidity pool burn status, and top-holder concentration before you pull the trigger.

    What Is BullX?

    BullX started as a Telegram-native sniper bot but has evolved into something much bigger. The current flagship product, BullX Neo, is a full trading terminal that bridges the Telegram interface with a professional web dashboard. The result is one of the most feature-rich trading platforms in the Solana ecosystem, now extended across six-plus chains including Ethereum, Base, BNB Chain, Blast, Arbitrum, and TRON.

    BullX Neo’s standout feature is Pump Vision (now upgraded to Neo Vision), a real-time dashboard that tracks every new token launching on pump.fun and Moonshot. Tokens are categorized as newly created, about to graduate to a real liquidity pool, or already graduated. This lets you spot early momentum plays before they hit DexScreener and before everyone else piles in.

    Beyond token discovery, BullX offers limit orders, DCA, stop-loss, take-profit, automated trading rules, copy trading features, portfolio tracking across wallets and chains, and realtime security audits that scan contract code for known exploits and suspicious wallet patterns. BullX has reportedly processed over $12.4 billion in lifetime trading volume and generated approximately $112 million in platform fees, numbers that speak to serious adoption.

    Fees and Pricing

    Both platforms charge a flat 1% fee on every buy and sell transaction, collected in the native token of the chain you are trading on. For Solana trades, that is SOL. On top of the platform fee, you will also pay standard Solana network fees (typically under $0.01) and optional priority fees or Jito bribe tips if you want to jump the queue during high congestion periods.

    BullX has a slight edge here: users who sign up through a referral link pay a reduced fee of 0.9%, a 10% discount that adds up meaningfully if you are trading high volume. Photon does not currently offer a referral discount on fees.

    Neither platform charges a subscription fee or monthly membership, which keeps the barrier to entry low for new traders.

    Speed and Execution

    Execution speed is where Photon earns its reputation. Independent tests measuring time from click to on-chain confirmation across high-volatility token launches consistently put Photon at approximately 400ms. BullX lands at around 450ms. The gap is small in absolute terms but matters in the memecoin market where a 50ms advantage on a trending launch can mean the difference between a 2x entry and chasing a 3x that has already topped.

    Photon achieves this speed through its private node infrastructure, which routes transactions outside the standard public RPC endpoints. BullX also uses optimized routing and Jito MEV protection but lags slightly due to the overhead of its more complex multi-chain architecture.

    For pure Solana speed, Photon has the edge. For multi-chain reliability, BullX is solid.

    Token Discovery and Research Tools

    This is where BullX clearly pulls ahead. Photon lets you search for tokens by name or contract address, displays live charts and order flow, and shows basic safety metrics. It is excellent for monitoring tokens you already know about.

    BullX goes further with Neo Vision, which gives you a live feed of every token launching on pump.fun grouped by lifecycle stage. You can filter by volume, market cap, transaction count, and insider wallet activity. The realtime security audit scans each token’s contract and flags known red flags before you even consider a buy. For traders whose edge comes from finding gems early, BullX’s discovery layer is genuinely valuable and has no real equivalent in Photon.

    Supported Blockchains

    Photon’s core strength is Solana, but the platform has expanded to support Ethereum, Base, and BNB Chain as well. BullX supports all of those plus Blast, Arbitrum, and TRON, making it the better choice if you want to hunt for opportunities across the full EVM landscape as well as Solana.

    If you are 100% focused on Solana, this distinction may not matter much. But as cross-chain meme seasons become more common (Base had its moment in 2024 and early 2025), having BullX’s multi-chain reach gives you flexibility.

    Interface and User Experience

    Photon is built for desktop. The web interface is clean, fast, and designed around the chart. Everything you need is visible without digging through menus: price chart, buy/sell buttons with preset SOL amounts, transaction history, and token metrics. There is a mobile-optimized view but it is not the primary experience.

    BullX offers both a web terminal and a Telegram bot. The Telegram interface is excellent for traders who want to manage positions on the go or get alerts on their phone. The web dashboard is more feature-rich but slightly busier than Photon’s lean design. If you prefer a streamlined chart-first experience, Photon feels more natural. If you want full functionality across devices, BullX is the more versatile option.

    Comparison Table

    Photon vs BullX feature comparison table 2026

    Comparison based on publicly available data as of March 2026. Sources: Photon, BullX, SolanaTools.io.

    Security and Trust

    Both platforms are non-custodial, meaning your funds stay in your own wallet and you retain full control of your private keys. Neither requires KYC or account creation, which is consistent with the ethos of self-custody crypto trading.

    Photon displays token safety indicators directly on the trading view, including mint authority status (can the developer mint unlimited new tokens?), LP burn status (has the liquidity pool been locked?), and holder concentration data. These are essential checks before entering a new position.

    BullX goes a step further with its realtime security audit system, which runs AES-256 encrypted scans of contract code and flags suspicious wallet clusters. BullX’s infrastructure also uses AWS CloudHSM for key management, which is a higher security bar than most competitors in this space.

    Standard caution applies to both: use a dedicated trading wallet, never put more than you are willing to lose, and verify you are on the official URL (photon-sol.tinyastro.io for Photon, bullx.io for BullX) to avoid phishing clones.

    Pros and Cons

    Photon

    Pros:

    • Fastest execution speed on Solana (~400ms)
    • Clean, intuitive chart-first interface
    • Limit orders, DCA, stop-loss, and multi-wallet support
    • Non-custodial with instant private key export
    • No registration or KYC required

    Cons:

    • No Telegram bot, desktop-focused only
    • Weaker token discovery vs BullX
    • No referral fee discount
    • No copy trading features

    BullX

    Pros:

    • Multi-chain support across 6+ blockchains
    • Pump Vision and Neo Vision for early token discovery
    • Web + Telegram access for mobile-friendly trading
    • Realtime security audits on contracts
    • 0.9% fee with referral (vs standard 1%)
    • Massive proven volume: $12.4B+ lifetime trades

    Cons:

    • Slightly slower execution than Photon (~450ms)
    • More complex interface with a steeper learning curve
    • Copy trading is limited compared to dedicated copy-trade platforms

    Who Should Use Each Platform?

    Choose Photon if you: primarily trade Solana, prefer a clean visual terminal over Telegram, want the absolute fastest execution for manual sniping, and prioritize simplicity over feature density.

    Choose BullX if you: trade across multiple chains, want AI-assisted token discovery for pump.fun launches, need Telegram alerts and mobile trading, or want a more complete ecosystem with portfolio tracking and automated strategies.

    Many serious traders use both, running Photon for pure Solana speed and keeping BullX active for its pump.fun discovery dashboard. Given there are no subscription fees, running them in parallel costs nothing beyond the per-trade fees.

    For more on Solana DeFi opportunities, check out our latest articles on crypto trading strategies.

    Verdict

    Photon: 8.5/10 for Solana-focused speed traders.

    BullX: 9.0/10 for multi-chain traders and pump.fun hunters who need discovery tools.

    BullX edges out Photon overall because its token discovery layer (Neo Vision) and multi-chain reach make it the more complete product for 2026. But if you are a Solana purist who lives and dies by chart reading and sub-500ms fills, Photon’s cleaner interface and marginally faster execution may be worth the tradeoff in features.

    Either way, both platforms are a massive upgrade over trying to trade memecoins through a standard DEX interface. The 1% fee on both is worth every fraction of a SOL when the alternative is fumbling through a swap interface while a token goes parabolic.

    Frequently Asked Questions

    Is Photon or BullX safer to use?

    Both are non-custodial and do not hold your funds. BullX has a slight edge with its realtime contract audits and AES-256 encrypted infrastructure. Always use a dedicated hot wallet with limited funds on either platform.

    What is the fee difference between Photon and BullX?

    Both charge 1% per trade. BullX reduces this to 0.9% for users who join through a referral link. Neither charges a monthly subscription.

    Can I use BullX on Ethereum and Base as well as Solana?

    Yes. BullX Neo supports Solana, Ethereum, Base, BNB Chain, Blast, Arbitrum, and TRON. Photon supports Solana, Ethereum, Base, and BNB Chain.

    Which is better for sniping pump.fun launches?

    BullX is better for pump.fun discovery thanks to its Pump Vision and Neo Vision dashboards, which track every new token by lifecycle stage. Photon is faster for execution once you have identified a target.

    Do I need to create an account to use Photon or BullX?

    No. Both platforms allow you to start trading immediately by connecting a wallet or generating a new one inside the app. No registration, email, or KYC is required.

    Ethereum (ETH) Price Prediction 2026: Can ETH Hit $4K?

    0

    Ethereum (ETH) is trading at $2,165.71 as of March 24, 2026. That is up 16.26% from one month ago, when it was changing hands around $1,862. It sounds like a recovery. But zoom out and the picture is more complicated: ETH is still roughly 55% below its all-time high of $4,878, set back in November 2021.

    So where does Ethereum go from here? Our hybrid AI model has been crunching the data, and the short answer is this: the bull case is real, but it is not guaranteed. This article breaks down the technical setup, the key catalysts, and the risks in plain terms so you can make your own informed decision.

    Ethereum (ETH) price prediction 2026 hero image showing current price $2,165.71

    Ethereum at a Glance: The Numbers That Matter

    Before we get into the price outlook, here is where Ethereum stands today.

    • Current price: $2,165.71 (March 24, 2026)
    • 24-hour change: +1.13% (+$24.22)
    • 30-day change: +16.26% (from $1,862.72)
    • Market cap: approximately $233 billion
    • All-time high: $4,878.26 (November 2021)
    • Distance from ATH: -55.6%

    Ethereum is the second-largest cryptocurrency by market cap, trailing only Bitcoin at roughly $1.33 trillion. It is not just a store of value. Ethereum is a decentralized computing platform that powers thousands of applications, including most of the DeFi ecosystem, NFT infrastructure, and an expanding network of Layer 2 chains.

    The Pectra upgrade, which went live in May 2025, was a major milestone. It introduced account abstraction (allowing smarter, more user-friendly wallets), doubled blob throughput for Layer 2 rollups, and raised the maximum validator stake from 32 to 2,048 ETH. These improvements have quietly made the network faster and cheaper for end users. The market, however, has not fully priced this in yet.

    Technical Analysis: What the Chart Is Telling Us

    Let us look at what the chart is actually telling us right now.

    Key Support Levels

    • $2,100: Immediate support, where buyers have recently stepped in
    • $2,000: Psychological floor; a daily close below here would shift sentiment sharply bearish
    • $1,800: Strong structural support, the level that held through the worst of the 2025 drawdown

    Key Resistance Levels

    • $2,300 to $2,400: Strong resistance zone; ETH has already faced rejection here once this month
    • $2,700 to $2,800: Major resistance; a sustained close above this level would signal a genuine trend reversal
    • $3,394: The 200-day simple moving average (SMA), the long-term trend line ETH needs to reclaim to turn the broader structure bullish

    What the Indicators Are Saying

    The 14-period RSI (Relative Strength Index, a momentum indicator) sits around 46 to 47. That is neutral territory. Not flashing danger, but not generating excitement either.

    The MACD (Moving Average Convergence Divergence, a trend-following momentum indicator) shows stalled bearish momentum. In plain terms: the sellers are losing steam, but buyers have not convincingly taken over yet.

    ETH currently trades below its 50-day SMA ($2,424) and well below its 200-day SMA ($3,394). Reclaiming these levels would be the technical confirmation bulls need.

    Our AI model assigns a 62% probability that ETH finds a higher low above $2,000 in the next 30 days and begins a sustained recovery phase. The model also gives a 38% probability of retesting the $1,800 to $1,900 zone before any meaningful recovery takes hold. Both outcomes deserve serious attention.

    The Bull Case: What Could Push ETH to $4,000

    Here are the factors that support the upside thesis.

    The Glamsterdam Upgrade

    The next major Ethereum protocol upgrade, Glamsterdam, is targeted for the first half of 2026. Building on the Pectra foundation, Glamsterdam is expected to further improve network throughput and reduce gas costs for Layer 2 chains. Historically, protocol upgrades have acted as catalysts for sustained ETH rallies. The market often buys the anticipation before the event itself arrives.

    ETF Inflows and Institutional Demand

    Spot Ethereum ETFs have been drawing steady institutional inflows since their launch. As traditional finance continues to add crypto exposure, ETH is one of the primary vehicles. Sustained weekly inflows above $200 million would provide meaningful price support and potentially accelerate a move toward the $3,000 range by mid-2026.

    Layer 2 Ecosystem Growth

    The Layer 2 ecosystem built on Ethereum has been expanding rapidly. More activity on L2s means more demand for ETH as gas and as a settlement asset. As blob fees from rollups increase over time, this creates additional buy pressure for ETH.

    The Recovery Narrative

    A 16% gain in one month, off what may have been a local bottom around $1,862, could be the early stage of a larger recovery cycle. In similar post-correction setups since 2020, ETH has gone on to recover 60% to 100% of its drawdown within 6 to 12 months. If that pattern holds, the base case target for late 2026 is in the $3,000 to $4,200 range.

    For context on how other Layer 1 chains are positioned this cycle, our Solana (SOL) price prediction for 2026 covers another top-10 chain at a similar crossroads.

    The Bear Case: What Could Keep ETH Below $2,500

    There are real risks here. A balanced analysis requires looking at them honestly.

    Macro Headwinds

    The broader macroeconomic environment matters for risk assets, including crypto. If inflation re-accelerates or interest rate expectations shift higher, risk-off sentiment could push ETH back below $2,000. The $2,000 level is both a psychological and technical floor; a sustained close below it would be a serious warning sign.

    Competition From Other Layer 1 Chains

    Solana, at $89 and processing tens of billions in daily on-chain volume, is capturing a significant share of DeFi and memecoin activity. If Ethereum continues to lose market share to faster and cheaper alternatives, the fundamental case for ETH weakens over time. Fee revenue is the key metric to watch here.

    Bearish Technical Structure

    ETH remains below all of its major moving averages. The bounce from $1,862 has the characteristics of a relief rally rather than a confirmed trend reversal. If volume stays weak on upside moves and the $2,300 resistance holds, a retest of $1,800 remains in play. Recent analysis from Zebpay describes the current recovery as “a weak relief rally that is beginning to fade, rather than a strong trend reversal.”

    Execution Risk on Upgrades

    Protocol upgrades can be delayed. If Glamsterdam is pushed back to late 2026 or faces technical complications, one of the key bullish catalysts loses its timing edge. Markets tend to sell the delay even when the underlying upgrade is intact.

    ETH Price Predictions: 3 Timeframes

    Based on our hybrid AI model, technical analysis, and the catalysts outlined above, here are our price targets. These are probabilistic scenarios based on current data, not guarantees.

    Ethereum (ETH) price prediction summary table 2026 showing bear, base and bull case targets

    Short-Term Outlook (30 Days)

    In the next 30 days, the most likely outcome is a test of the $2,300 to $2,400 resistance zone. If volume picks up and ETH closes above $2,400, the short-term target shifts to $2,700. A failure at resistance and a break below $2,100 opens the door to $1,900. Base case: $2,350.

    Mid-Term Outlook (6 Months)

    By September 2026, the base case assumes the Glamsterdam upgrade is live and ETF inflows remain steady. Under those conditions, the model targets $3,200. In a stronger bull scenario with BTC above $90,000 and broad market momentum, $4,200 becomes achievable. In the bear scenario, a macro-driven risk-off move could push ETH back toward $1,650.

    Long-Term Outlook (2027 to 2028)

    If Ethereum executes on its roadmap and maintains its position as the dominant smart contract platform, the 2027 to 2028 base case is $5,500. The bull case, assuming a broader crypto market cycle similar in magnitude to 2020 to 2021, targets $8,500. The bear case, if ETH loses significant market share to competitors, is a range of $2,000 to $2,500.

    What to Watch in the Coming Weeks

    • The $2,300 to $2,400 zone. This is the line in the sand for bulls. A high-volume close above $2,400 changes the technical picture significantly.
    • ETF inflow data. Weekly ETF flows are one of the cleaner signals for institutional demand. Watch for reports from Bloomberg and CoinDesk on this each week.
    • Glamsterdam timeline. Any official Ethereum Foundation updates on the upgrade schedule are worth tracking closely.
    • The $2,000 floor. If ETH breaks and closes below $2,000 on meaningful volume, the bear case becomes more probable. Adjust your thesis accordingly.
    • Bitcoin correlation. Ethereum tends to move with Bitcoin in the short term. A BTC breakout above $75,000 would likely pull ETH higher alongside it.

    For real-time Ethereum price data and on-chain metrics, CoinGecko’s Ethereum page is a reliable starting point for ongoing research.

    The Bottom Line

    Ethereum at $2,165 is not obviously cheap, but it is not obviously expensive either. It sits at a technical crossroads. The Pectra upgrade has made the network meaningfully better. The Glamsterdam upgrade could add another leg of improvement. Institutional inflows through ETFs provide a steady demand floor that did not exist in previous cycles.

    At the same time, the broader technical structure is still bearish. ETH remains below all major moving averages. The recovery from $1,862 looks more like a relief rally than a confirmed reversal. The $2,300 to $2,400 zone is the test that matters most right now.

    The data supports cautious optimism. Not the kind that ignores the risks, but the kind that says the setup is improving, the catalysts are real, and the downside is more defined than the upside. If you are watching ETH, the next four to six weeks will tell you a lot about where this cycle is headed.


    Disclaimer: This article is for informational and educational purposes only and should not be construed as financial, investment, or trading advice. Cryptocurrency markets are highly volatile, and past performance does not guarantee future results. The price predictions and analyses presented here are based on AI models, technical indicators, and available data at the time of writing. They are not guarantees. Always conduct your own research and consult with a qualified financial advisor before making any investment decisions. Pump Parade and its authors do not assume liability for financial losses incurred based on information provided in this article.

    About our AI predictions: Pump Parade’s price predictions are generated by machine learning models that analyze technical indicators, on-chain data, and market sentiment. These models have limitations and cannot account for black swan events, regulatory changes, or sudden market shifts. Prediction confidence scores reflect the model’s internal assessment, not guaranteed accuracy. Use AI predictions as one input among many in your research.
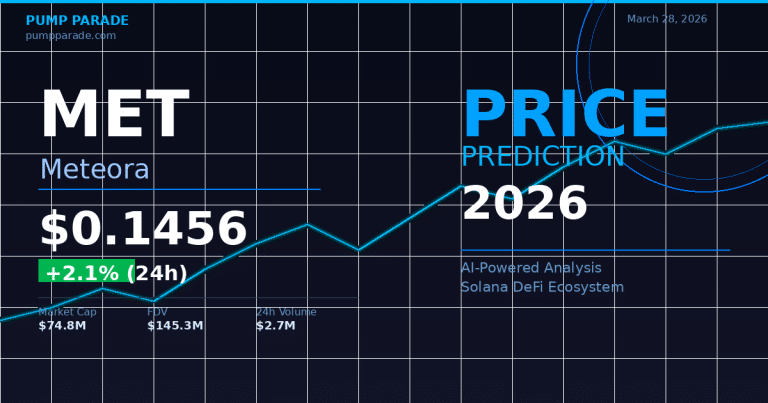
    Solana (SOL) Price Prediction 2026: Can SOL Reclaim $200 After the Alpenglow Upgrade?

    0

    SOL at $89 — A Compelling Entry Point or a Falling Knife?

    Solana (SOL) is trading at $89.07 as of March 24, 2026 — down 2.33% in the past 24 hours and sitting roughly 50% below the highs it printed earlier this cycle. On the surface, that looks rough. But beneath the price action, something big is happening: Solana’s most ambitious protocol overhaul in its history just received near-unanimous approval from validators, and the on-chain fundamentals tell a story that the spot price hasn’t fully caught up with yet.

    That tension — between a token that looks technically wounded and a network that keeps breaking its own records — is exactly why SOL deserves a close look right now. In this analysis, we’ll dig into the Alpenglow upgrade, break down the current technical setup, and lay out both the bull and bear cases with specific price targets for 2026 and beyond.

    Solana SOL price prediction 2026 chart

    Solana in 2026: What the Network Is Actually Doing

    Price tells one story. On-chain data tells another. Here’s what the Solana network looks like right now, stripped of the price noise:

    The network is processing over 2,000 transactions per second on average — with burst capacity reaching 65,000 TPS. In the past 30 days alone, Solana handled approximately 2.3 billion on-chain transactions. Monthly active users have crossed 50 million. Daily DEX volume is running at roughly $3.8 billion. And real-world asset (RWA) tokenization on Solana has surpassed $1.8 billion — a category that barely existed on the network two years ago.

    Total Value Locked (TVL) across Solana’s DeFi ecosystem has rebounded significantly from Q4 2025 lows, with figures from early 2026 showing TVL exceeding $4.2 billion — and some estimates from DeFiLlama pointing higher as new protocols have come online. Developer activity backs it up: monthly smart contract deployments are up 140% year-over-year.

    In plain terms: the network isn’t struggling. The token is struggling. That gap is where the analysis gets interesting.

    The Alpenglow Upgrade: Solana’s Most Consequential Protocol Change

    The most significant catalyst on the Solana roadmap right now is SIMD-0326 — the Alpenglow consensus upgrade. And “significant” is underselling it.

    Solana’s current consensus mechanism is a hybrid of Proof-of-History and TowerBFT. Transaction finality currently takes approximately 12 seconds. Alpenglow replaces this with a two-component system: Votor (a new consensus protocol built for sub-second finality) and Rotor (a data propagation layer that slashes block broadcasting bottlenecks).

    The headline number: Alpenglow targets 100–150 millisecond finality. When 80% or more of validators are online, blocks finalize in a single voting round at roughly 100ms. With 60% participation, a second round kicks in, landing at ~150ms. For context, Visa processes transactions in roughly the same window. Under optimal conditions, block propagation via Rotor can complete in as little as 18 milliseconds.

    The community didn’t just approve this — they showed up. The validator vote recorded a 52% stake turnout with 99.6% voting in favor. That’s about as decisive as consensus gets in crypto governance. The rollout is expected to proceed gradually through early-to-mid 2026.

    Here’s why that matters for price: institutional DeFi — real-money applications, tokenized securities, high-frequency on-chain trading — requires settlement guarantees that are hard to build around a 12-second finality window. At 150ms, those constraints largely disappear. If Alpenglow ships on schedule and performs as designed, it removes one of the few remaining structural objections to Solana as institutional-grade infrastructure.

    Technical Analysis: What the Chart Is Saying

    SOL’s technical setup is a study in contradictions right now.

    The bearish signals are real. SOL has been trading below its 50-day and 200-day moving averages for most of Q1 2026, and the broad technical indicator consensus is leaning negative in the short term. The token is down significantly from its cycle high, and price action has been characterized by lower highs — not a setup that inspires confidence from momentum traders.

    But here’s the counterargument that technicians shouldn’t ignore: the weekly chart recently printed a bullish engulfing candle — a pattern where a week’s price action fully eclipses the prior week’s range and closes near the high. This pattern has historically preceded mean-reversion moves in SOL on multiple occasions. It doesn’t guarantee a reversal, but it shifts the probability calculus.

    Key levels to watch:

    • Support: $82–$85 (previous consolidation zone; a break below this with high volume would be meaningfully bearish)
    • Near-term resistance: $95–$100 (psychological level and area of prior distribution)
    • Key resistance above: $115–$125 (where selling pressure picked up during the Q4 2025 downtrend)

    The RSI (Relative Strength Index — a momentum indicator that measures whether an asset is overbought or oversold on a scale of 0 to 100) is currently in neutral territory, which means SOL isn’t stretched in either direction. That’s actually useful: oversold conditions can trap buyers in continued downtrends, and overbought conditions can cap near-term upside. Neutral RSI with a bullish weekly engulfing is a setup worth watching.

    The Bull Case for SOL in 2026

    The bull case here isn’t built on hopium — it’s built on a specific sequence of events that the data supports.

    Catalyst 1: Alpenglow ships and delivers. If the upgrade goes live in H1 2026 and 150ms finality becomes a realized feature rather than a roadmap promise, it unlocks a category of institutional applications that couldn’t practically exist at current settlement speeds. That’s a genuine step-change, not a narrative.

    Catalyst 2: TVL and developer activity convert to price. Solana’s on-chain fundamentals — $4.2B TVL, $3.8B daily DEX volume, 50M monthly active users — are not reflected in a $89 token price in a way that holds up to scrutiny when you compare the network’s actual usage. The historical relationship between platform usage and token price tends to converge over medium-term horizons.

    Catalyst 3: RWA tokenization flywheel accelerates. With $1.8B in real-world assets already tokenized on Solana and regulatory clarity improving across major markets, the RWA narrative has durable tailwinds. Solana’s speed advantage over Ethereum L2s in settlement contexts could drive significant institutional capital flows into the ecosystem.

    Bull case price targets:

    • Short-term (30–60 days): $100–$115 if the weekly bullish engulfing holds and Alpenglow launch timeline firms up
    • Mid-term (6 months): $130–$175, assuming Alpenglow launches successfully and macro conditions stabilize
    • 2026 high scenario: $200–$250, which would align with several analyst models projecting a post-upgrade re-rating

    The Bear Case: What Could Go Wrong

    Pump Parade doesn’t publish one-sided analysis. Here’s what could keep SOL under pressure — or push it lower.

    Risk 1: Macro headwinds don’t relent. The Fear & Greed Index across crypto is sitting in “Extreme Fear” territory as of late March 2026. If broader risk-off sentiment continues — driven by macro uncertainty, rate policy, or a broader equity drawdown — SOL will find it hard to decouple. Technically strong setups fail all the time in bear macro environments.

    Risk 2: Alpenglow delays or underdelivers. The crypto space has a long history of upgrades shipping late or performing below spec. The market has partially priced in Alpenglow — if it gets delayed to H2 2026 or beyond, the “upgrade catalyst” narrative deflates and could accelerate selling from speculative positions.

    Risk 3: Ethereum L2 competition intensifies. Ethereum’s L2 ecosystem (Arbitrum, Base, Optimism, and others) continues to scale aggressively. If L2s achieve comparable speed and cost metrics through their own upgrades, Solana’s differentiation narrative weakens. This is a slow-burn risk, not an immediate catalyst, but it’s real.

    Risk 4: Network congestion reappears. Solana has had high-profile network performance issues during peak activity periods in prior cycles. A major congestion event at the wrong time — say, during a memecoin supercycle or a major token launch — could damage sentiment precisely when the Alpenglow narrative is trying to build momentum.

    Bear case price targets:

    • Mild bear: $75–$82 (retest of the prior support range, manageable pullback)
    • Extended bear: $55–$65 (full macro capitulation scenario, loss of key structural support)
    • Key invalidation level: A weekly close below $75 with volume would materially weaken the near-term bull thesis

    SOL Price Predictions: 2026, 2027, and Beyond

    Our hybrid AI model synthesizes technical indicators, on-chain data, and macroeconomic context to produce the following probability-weighted price targets. These are scenarios — not guarantees.

    Short-Term (30 Days — April 2026)

    Base case: $90–$110. The bullish engulfing weekly candle provides a floor thesis, and Alpenglow timeline news could serve as a near-term catalyst. Probability of trading above $100 within 30 days: approximately 45%. Probability of testing the $80 support: approximately 30%. The base scenario is consolidation near current levels while the market digests macro conditions.

    Medium-Term (6–12 Months)

    Base case: $120–$175. This is the range where our model has the highest conviction, assuming: (1) Alpenglow ships and generates positive coverage, (2) TVL continues its recovery trajectory, and (3) macro conditions don’t deteriorate materially. A successful Alpenglow launch alone — if it drives a single major institutional protocol announcement — could push SOL to the upper end of this range by Q3 2026.

    Long-Term (2027–2028)

    Base case: $200–$350. If Solana maintains its position as the leading high-performance L1, continues to attract RWA tokenization flows, and the Alpenglow upgrade delivers on its institutional-grade promise, the 2027–2028 range could see SOL testing and potentially exceeding its all-time high. The bull case scenario, contingent on a broader market recovery, could push toward the $350–$450 range that some analyst models project. The bear case sees SOL range-bound in the $100–$150 zone if L2 competition erodes its positioning.

    About our AI predictions: Pump Parade’s price predictions are generated by machine learning models that analyze technical indicators, on-chain data, and market sentiment. These models have limitations and cannot account for black swan events, regulatory changes, or sudden market shifts. Prediction confidence scores reflect the model’s internal assessment, not guaranteed accuracy. Use AI predictions as one input among many in your research.
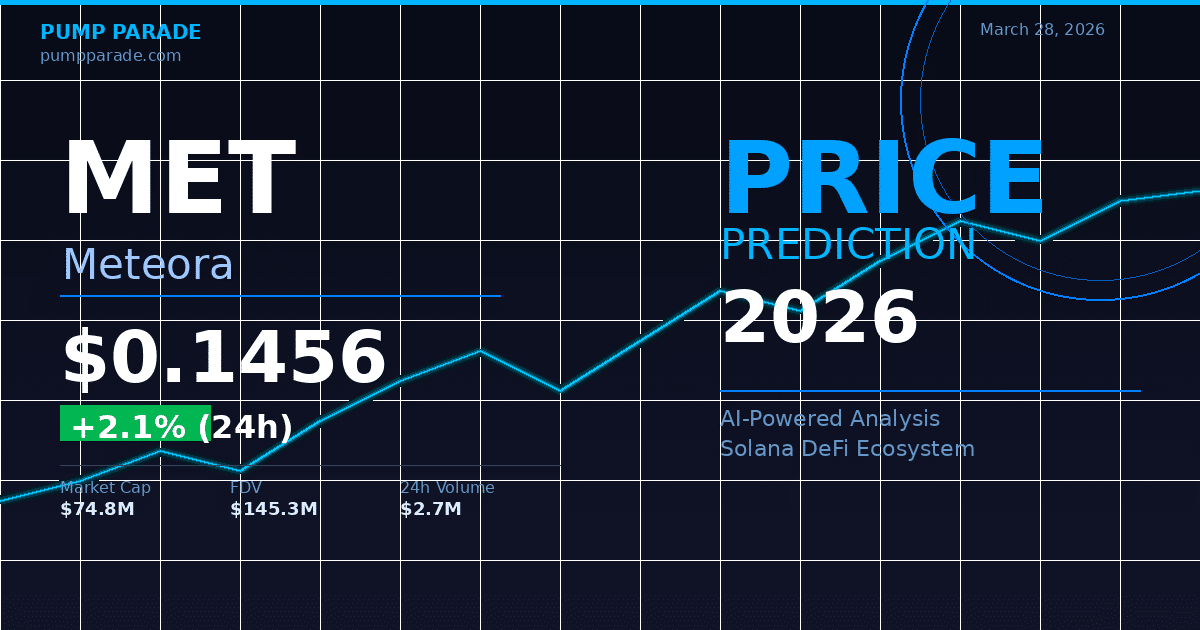
    What to Watch in the Coming Weeks

    If you’re tracking SOL, here are the specific signals worth monitoring:

    • Alpenglow timeline announcements: Any formal testnet launch date or mainnet roadmap update would be a near-term positive catalyst
    • The $82–$85 support zone: A sustained break below this level on meaningful volume would shift the near-term picture negative
    • TVL trend on DeFiLlama: Continued growth above $4.2B would reinforce the fundamental floor thesis
    • Macro risk signals: Broader equity market direction and Fed rate policy will continue to exert outsized influence on SOL’s short-term trajectory
    • Weekly close above $100: A confirmed close above the psychological $100 level would signal the first meaningful technical recovery and could attract momentum buyers

    The honest take: SOL is in a risk-reward zone that deserves attention, not blind optimism. The network’s fundamentals are strong. The Alpenglow upgrade is a genuine differentiator. But the macro environment is unforgiving right now, and the technical picture needs to confirm the bullish thesis — it hasn’t yet. The smart move isn’t to chase or panic — it’s to define your levels, understand the catalysts, and act on data rather than narratives.


    Disclaimer: This article is for informational and educational purposes only and should not be construed as financial, investment, or trading advice. Cryptocurrency markets are highly volatile, and past performance does not guarantee future results. The price predictions and analyses presented here are based on AI models, technical indicators, and available data at the time of writing — they are not guarantees. Always conduct your own research (DYOR) and consult with a qualified financial advisor before making any investment decisions. Pump Parade and its authors do not assume liability for financial losses incurred based on information provided in this article.