

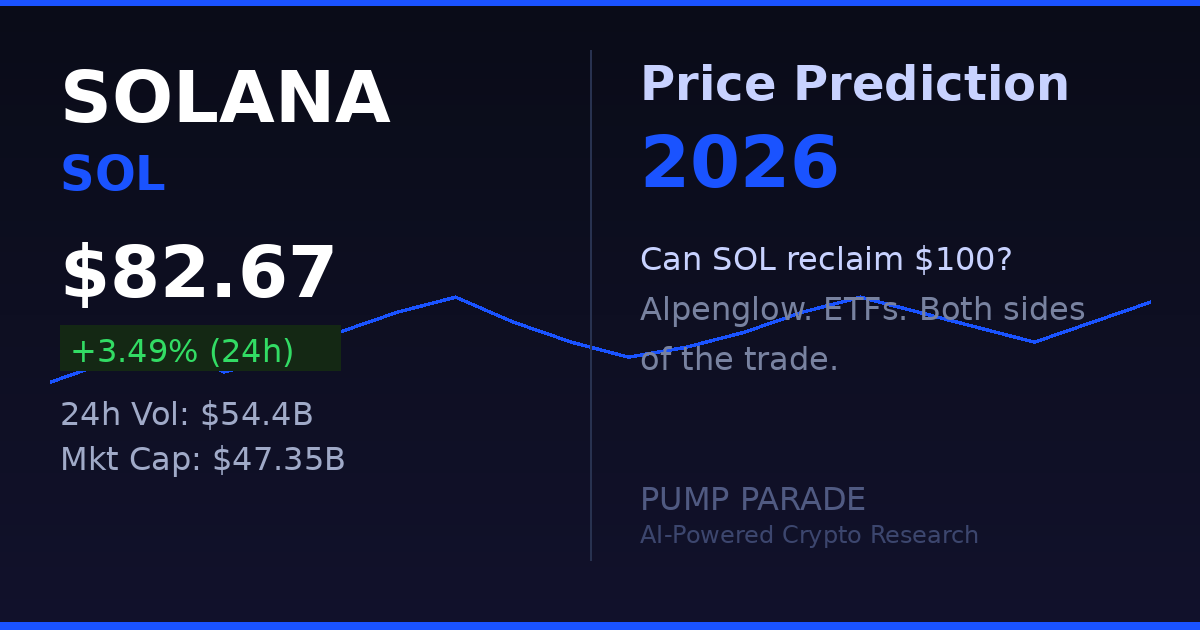
Solana is trading at $82.67 as of April 6, 2026. That is up 3.5% on the day. But zoom out and the picture is less cheerful: SOL is sitting roughly 68% below its all-time high of around $260. Meanwhile, daily trading volume on Solana hit $54.4 billion in the past 24 hours, a surge of 86.7% over the prior day. The network is busy. The price is not reflecting it yet.
That gap between on-chain activity and price performance is exactly the kind of setup that makes Solana worth analyzing right now. A major consensus upgrade is on the horizon. Spot ETFs are pulling in institutional money. But six consecutive red months tell a sobering story. Can SOL reclaim $100? Or is the floor still falling? Our hybrid AI model has run the numbers on both scenarios. Here is what it found.
Solana at a Glance: Key Metrics (April 2026)
Before getting into the analysis, here is where Solana stands right now, based on live Birdeye data:
- Price: $82.67
- 24h Change: +3.49%
- 24h Trading Volume: $54.4 billion (+86.7%)
- Market Cap: ~$47.35 billion
- Liquidity (on-chain): ~$5.95 billion
- Distance from ATH (~$260): -68%
The volume spike is notable. SOL is the most-traded asset on the Solana network by a wide margin. That kind of volume does not happen in a dead market. Something is building. The question is whether it translates into price.
What Is Solana? A Quick Refresher
Solana is a high-performance Layer 1 blockchain designed for speed and low cost. It was built to handle thousands of transactions per second, well above what Ethereum offered at launch. Proof of History (PoH) is the key innovation that made this possible. It creates a verifiable timestamp for every transaction, allowing the network to sequence events without the overhead of traditional consensus.
In practice, Solana became the home of memecoins, DeFi protocols, and NFT activity. Jupiter, Raydium, and Jito are among the most active protocols on the chain. Spot SOL ETFs launched in October 2025, bringing in institutional capital for the first time. That structural shift matters more than most people realize.
The Alpenglow Upgrade: Solana’s Biggest Bet
This is the most important catalyst on Solana’s roadmap for 2026. Alpenglow is a complete overhaul of Solana’s consensus mechanism. It replaces Tower BFT and Proof of History with two new components: Votor (a faster vote aggregation protocol) and Rotor (a restructured block propagation layer).
The result? Transaction finality drops from roughly 12 seconds to around 150 milliseconds. That is not a small improvement. That is an 80x speed increase on one of the most important metrics in blockchain UX. For applications that require near-instant confirmation in payments, trading, and gaming, this changes the calculus entirely.
The governance vote passed in September 2025 with 99.6% approval and 52% of validator stake participating. Mainnet deployment is targeted for 2026. VanEck called it “the largest upgrade to Solana’s consensus in its history.”
Markets tend to price in upgrades before they happen. If Alpenglow deployment stays on schedule, the months leading up to launch could generate significant buying pressure.
Technical Analysis: Where SOL Stands on the Chart
SOL’s price action in 2026 has been rough. It has not posted a single green month since September 2025. January closed down 15.3%. February dropped another 20%. March barely held. That is a sustained downtrend, not a brief correction.
Here is what the chart is telling us right now:
- Key support zone: $79 to $80. This level has been tested twice in the past two weeks. A close below $79 on meaningful volume would signal further downside.
- First resistance: $90. This is where sellers have shown up repeatedly. A clean breakout above $90 would be the first meaningful higher high since the downtrend began.
- Critical resistance: $100. The psychological level. It also aligns with the 50-day moving average. Reclaiming $100 and holding it would shift the medium-term structure from bearish to neutral.
- Momentum: The RSI (Relative Strength Index) is recovering from oversold territory. The 24h volume surge today suggests accumulation, not just noise.
Our AI model flags a 58% probability of a test of the $90 resistance within 30 days, contingent on Bitcoin holding above its current support zone. If BTC rolls over, SOL will follow.
The Bull Case for SOL in 2026
Three factors build a credible bull thesis here.
1. Alpenglow deployment. If the upgrade launches on schedule in H1 2026, the narrative shift could be significant. Faster finality opens up new use cases. Developers already building on Solana get a meaningful performance upgrade. Attention follows improvement in crypto.
2. Spot ETF inflows. Spot SOL ETFs have been live since October 2025. Early inflow data showed mixed results, but institutional demand tends to build slowly and then accelerate. If weekly ETF flows pick up through Q2 2026, that is new buy-side pressure that did not exist a year ago.
3. Network dominance. Solana remains a leading smart contract platform by daily active users and transaction count. $54 billion in 24h volume is not a declining network. DeFi protocols like Jupiter and Jito continue to grow. The fundamentals have not deteriorated as much as the price suggests.
The bull target for a 6-month recovery is $105 to $145, depending on macro conditions and the Alpenglow timeline.
The Bear Case: What Could Keep SOL Down
Balanced analysis means looking at what could go wrong. Here are the real risks.
1. Six months of selling pressure. Sustained downtrends do not reverse overnight. Investors who bought between $100 and $260 are sitting on significant losses. Price rallies create sell opportunities for these holders, which caps recovery attempts.
2. Weak ETF inflows. March data showed spot SOL ETF inflows at their weakest since launch. If institutional interest is fading rather than building, one of the key bull pillars disappears.
3. Macro headwinds. Geopolitical tension and Federal Reserve policy are keeping risk assets under pressure. SOL is a high-beta asset. In a risk-off environment, it tends to fall harder than the broader market.
4. Alpenglow delay. If the upgrade faces technical delays or governance issues, the narrative evaporates. Markets priced in the halving months early for Bitcoin. They can also de-price a delayed upgrade for SOL just as quickly.
The bear case target for the next 6 months is $62 to $75 if support at $79 breaks decisively.
SOL Price Predictions: Short, Medium, and Long Term
Our hybrid AI model analyzes technical indicators, on-chain data from Birdeye, ETF flow trends, and macro sentiment to generate probability-weighted price targets. These are not guarantees. They are data-informed scenarios.
Short-Term (30 Days)
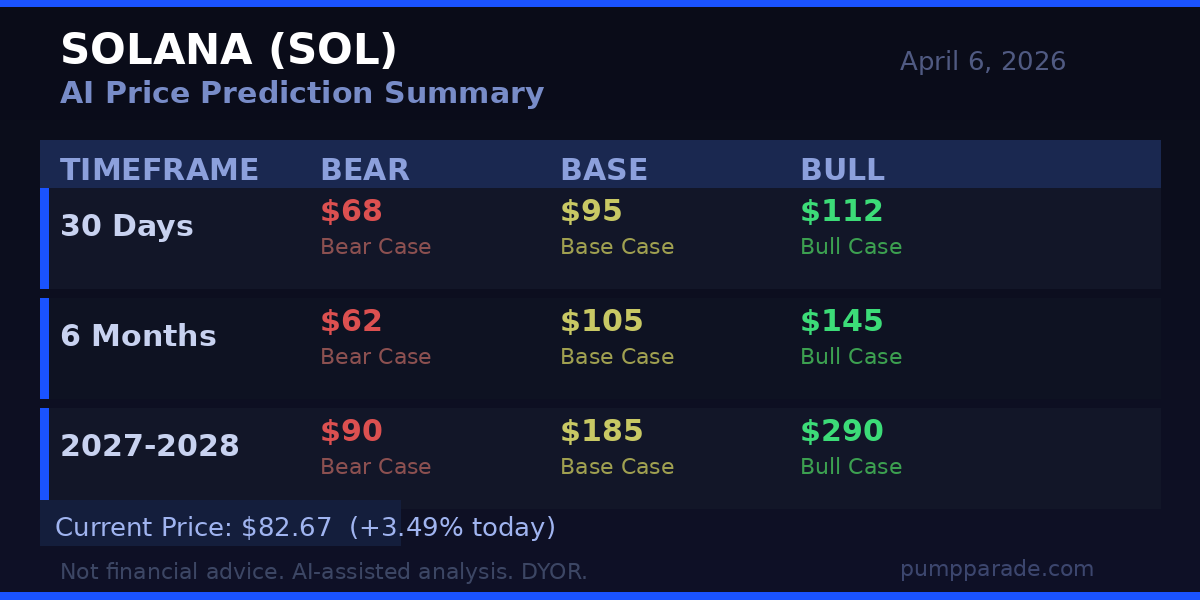
The base case sees SOL testing $90 to $95 as today’s volume surge signals renewed interest. A bullish breakout could push toward $112 if Bitcoin cooperates. The bear scenario puts SOL back toward $68 if the $79 support breaks. Our model assigns 55% probability to the base case in this timeframe.
Mid-Term (6 Months)
By October 2026, the Alpenglow upgrade should be live or imminent. If deployment proceeds on schedule, $105 to $145 is achievable. If macro conditions deteriorate and the upgrade is delayed, $62 to $75 becomes the realistic floor. The base case sits at $105.
Long-Term (2027-2028)
The long-term picture depends heavily on whether Solana maintains its position as a leading smart contract platform. If Alpenglow delivers on its promise and ETF inflows compound over time, our model sees a base case of $185 and a bull case of $290 by end of 2027. A sustained bear market puts the long-term floor at $90. For comparison, see our analysis of how Bitcoin’s long-term price predictions factor in similar institutional adoption curves.
What to Watch in the Next 30 Days
Three things matter most for SOL price direction right now:
- Bitcoin price action. SOL’s correlation with BTC remains high. A BTC breakout above $75K would lift most altcoins, including SOL.
- Alpenglow testnet progress. Watch for developer updates on the Rotor and Votor protocol components. Any public testnet milestone is a positive signal.
- Spot ETF weekly inflows. If the data shows improvement from March’s weak numbers, institutional interest is building. If not, selling pressure may persist.
- The $79 support level. This is the line in the sand. Hold it and the recovery narrative stays alive. Lose it and $68 or lower becomes realistic quickly.
The Bottom Line
Solana at $82.67 is not a screaming buy or a clear sell. It is a high-conviction asset in a complex position. The fundamentals are intact. The network is active. A transformative upgrade is approaching. But the technical structure is fragile, institutional inflows have been disappointing, and the macro environment remains hostile to risk assets.
The risk-reward at current levels favors patience over urgency. The $79 to $80 support zone is the key level to watch. A hold there and a subsequent breakout above $90 would be the first technical evidence that the worst is behind SOL. Until then, the data favors caution over conviction.
Disclaimer: This article is for informational and educational purposes only and should not be construed as financial, investment, or trading advice. Cryptocurrency markets are highly volatile, and past performance does not guarantee future results. The price predictions and analyses presented here are based on AI models, technical indicators, and available data at the time of writing. They are not guarantees. Always conduct your own research (DYOR) and consult with a qualified financial advisor before making any investment decisions. Pump Parade and its authors do not assume liability for financial losses incurred based on information provided in this article.
About our AI predictions: Pump Parade’s price predictions are generated by machine learning models that analyze technical indicators, on-chain data, and market sentiment. These models have limitations and cannot account for black swan events, regulatory changes, or sudden market shifts. Prediction confidence scores reflect the model’s internal assessment, not guaranteed accuracy.
