
Bitcoin is having a rough summer, and the numbers do not lie. BTC trades at $63,044 as we write, down 1.7% on the day and sitting a full 50% below its all-time high of $126,080 set on October 6, 2025. The Fear and Greed Index is stuck at 27. Search interest for “is bitcoin dead” is climbing again. Everyone wants to know one thing: will Bitcoin reclaim $100K in 2026, or has the four-year cycle finally caught up with the reserve asset of crypto?
Here is where our Bitcoin price prediction 2026 lands, before we walk through the receipts. Standard Chartered just cut its year-end target twice this year, from $300K to $150K to $100K, and warns a $50K retest is on the table first. Bernstein still sees $150K by December. Polymarket, meanwhile, prices Bitcoin at only a 16.5% chance of touching $90K before 2027. That is the spread we are trading inside.
This article walks through the current setup, the three catalysts that could put BTC back above $100K, the three risks that could send it toward $50K, and specific price targets by timeframe. No hopium, no doom porn, just the data.
- Bitcoin trades at $63,044, down 50% from its $126,080 October 2025 all-time high. This is the largest drawdown of the current cycle.
- Spot ETF flows just flipped positive after their worst month on record (net $4.5B in outflows in June 2026). The July 28 to 29 Federal Reserve meeting is the next major macro catalyst.
- Base case for year-end 2026: $78K to $92K. Bull case: $120K to $150K. Bear case: $50K to $58K retest before recovery.
- Standard Chartered targets $100K by year-end 2026. Bernstein targets $150K. Both cite institutional flows over halving math.
- The four-year halving cycle is not dead, but ETF flows now dominate the marginal price. That is a structural shift traders should not ignore.

Where Bitcoin Stands Today
Let’s start with the tape. Bitcoin closed the last 24 hours at $63,044, a 1.67% decline. Zoom out and the picture is uglier: BTC is down 2.74% over 30 days and 16.75% over 90 days, according to CoinGecko market data. The 90-day range has been $58,551 on the low end and $82,146 on the high end. Every rally attempt above $75K has been sold hard.
| Metric | Value |
|---|---|
| Price (BTC/USD) | $63,044 |
| 24h change | -1.67% |
| Market cap | $1.264 trillion |
| 24h volume | $23.9 billion |
| CoinGecko rank | 1 |
| All-time high | $126,080 (Oct 6, 2025) |
| % from ATH | -50.00% |
| Fear and Greed Index | 27 (Fear) |
Fear and Greed at 27 usually shows up near cycle inflection points. In 2022, similar readings preceded the November bottom by about six weeks. In 2020, they preceded the March COVID low. That is not a buy signal by itself, but it is context worth holding on to.
Why is Bitcoin falling in 2026?
Two things are dragging BTC lower right now. First, Federal Reserve Chair Kevin Warsh held rates steady at the June 17 meeting and pushed back on the September cut the market had priced in. Every risk asset from Nasdaq to gold got hit that day. Bitcoin took it worse because it had rallied the hardest on the cut narrative.
Second, spot Bitcoin ETFs bled a record $4.5 billion in June alone, the worst month since launch. BlackRock’s IBIT, Fidelity’s FBTC, and the smaller issuers all saw net redemptions. When the marginal ETF buyer turns into a marginal ETF seller, the effect on price is direct and mechanical. There is no on-chain nuance to hide behind.
The good news, if you can call it that: ETF flows just flipped positive on July 15 with a modest $46.6 million net inflow. One green print is not a trend, but it does end the streak. If the July 28 to 29 Federal Reserve meeting delivers even a hint of dovish language, that trickle could turn into a flood. For context on how Ethereum is trading the same macro setup, the pattern is nearly identical.
Can Bitcoin Reclaim $100K by Year End?
This is the question that matters. Below we break the setup into three catalysts on the bull side and three risks on the bear side. Each has a specific trigger, a specific price implication, and a specific timeframe. That is how we frame every prediction, and it is how you should read every prediction from anyone else.
The Bull Case
1. Fed cuts finally arrive
The July 28 to 29 Federal Reserve meeting is the big one. If Warsh signals cuts are back on the table for September, we get the reflex trade every time: DXY drops, real yields fall, Bitcoin catches a bid. History says the first cut after a pause is usually good for a 15% to 30% move higher in BTC over the following 60 days. That alone puts $78K on the map.
2. Corporate treasury demand keeps stacking
Michael Saylor’s MicroStrategy added another 8,700 BTC in Q2 2026 despite the drawdown. He is not alone. Roughly $10 billion has flowed into corporate Bitcoin treasuries and spot ETFs this year, per Bernstein estimates. That flow does not care about weekly candles. It is a mechanical bid that shows up regardless of sentiment, and it puts a soft floor under the market.
3. The halving supply squeeze is still real
Miners produce roughly 450 BTC per day post-halving, versus 900 before April 2024. That is $28.4 million of new supply per day at current prices. Spot ETFs alone can absorb that in a single hour of inflows during a bull run. The supply side of the equation has not changed. What has changed is the demand side, and demand is starting to come back.
The Bear Case
1. The four-year cycle plays out on schedule
Bitcoin’s 27.7% decline in 2026 maps almost perfectly onto the post-halving bear market pattern from 2014, 2018, and 2022. If history repeats, the bottom does not come until October 2026, roughly 12 months after the October 2025 top. That timing points to a $50K to $55K low before the next leg up. StoneX called it “one more quarter of pain before a major bottom” in their H2 2026 outlook.
2. ETF flows stay negative
June’s $4.5 billion outflow was not a one-off panic. It reflected structural profit-taking from investors who bought at $30K to $50K in 2024 and rode BTC to $120K plus. If those holders keep trimming into every rally, the ceiling stays at $75K and the floor keeps sinking. This is the risk factor institutional strategists worry about most.
3. Regulatory or geopolitical black swan
Nobody prices tail risk correctly. A hostile SEC ruling on custody rules, a stablecoin failure, a Taiwan crisis, or a Bitcoin-specific tax proposal in the 2026 US election cycle could all reset expectations violently. Bitcoin’s beta to macro shocks has risen with institutional adoption. Higher correlation cuts both ways.
Bitcoin Price Prediction 2026: Targets by Timeframe
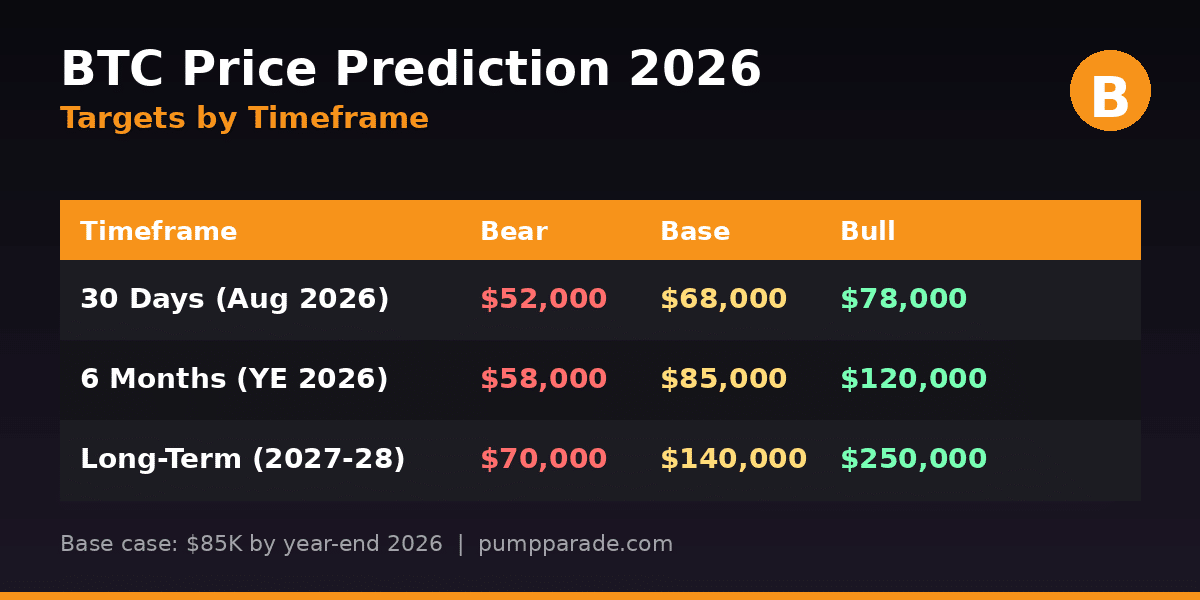
Here is how we see the risk-reward stacking across three horizons. These are scenarios, not guarantees. Every path assumes ETF flows and Fed policy as the dominant variables, with halving supply dynamics as a secondary tailwind.
| Timeframe | Bear | Base | Bull |
|---|---|---|---|
| 30 days (August 2026) | $52,000 | $68,000 | $78,000 |
| 6 months (year-end 2026) | $58,000 | $85,000 | $120,000 |
| Long-term (2027 to 2028) | $70,000 | $140,000 | $250,000 |
Short-term (30 days)
The July 28 to 29 Federal Reserve meeting dominates the calendar. If Chair Warsh keeps the hawkish tone, we retest the $58K to $60K support zone. If he pivots dovish, BTC rips to $72K to $78K on ETF inflow acceleration. Base case: chop between $60K and $70K.
6 months (year-end 2026)
Base case puts Bitcoin at $85K by December, roughly aligned with Standard Chartered’s $100K call but slightly more conservative given the fresh Q4 seasonality data. Bull case matches Bernstein’s $150K target if inflows sustain at 2024 highs. Bear case is the $50K to $58K retest StoneX flagged.
Long-term (2027 to 2028)
If institutional adoption holds and the next Fed easing cycle arrives on schedule, $140K by end of 2027 and $250K by end of 2028 are reasonable base and bull scenarios. Bear case assumes structural regulatory friction or a corporate treasury unwind. Cathie Wood at ARK Invest still holds a $1.25 million target for 2030, which we file under aspirational rather than base case.
How does Bitcoin compare to Ethereum in 2026?
The other major asset in the room is Ethereum, and the divergence tells its own story. Here is the head-to-head as of today.
| Metric | Bitcoin | Ethereum |
|---|---|---|
| Price | $63,044 | $1,837 |
| Market cap | $1.264T | $221.6B |
| 24h change | -1.67% | -2.61% |
| % from ATH | -50.0% | -62.1% |
| Spot ETF | Yes (Jan 2024) | Yes (Jul 2024) |
| Institutional narrative | Reserve asset | Yield asset |
| Supply dynamic | Halving (deflationary) | Burn-based (variable) |
Bitcoin’s drawdown is smaller. Its ETF flows are larger. Its corporate treasury narrative is uncontested. That is why BTC dominance has quietly climbed from 52% to 58% during the drawdown, and why Bitcoin volume on major exchanges keeps outpacing ETH. In risk-off tape, capital rotates to the highest-liquidity, most-institutional asset. That is BTC. For a deeper look at how sector rotation is playing out in perp DEX volume, our Hyperliquid price prediction covers where the risk-taking capital is moving instead.
What Would Change Our View
Three things would force a rewrite of this thesis:
1. A weekly close above $75K on rising ETF volume. That confirms the ETF selling exhaustion thesis and puts $92K back on the map for Q3.
2. A weekly close below $55K. That breaks the 200-week moving average and opens the door to $42K to $48K. In that scenario, our base case falls to $65K by year end.
3. Federal Reserve pivots to cuts before September. Cross-asset reflation trade fires, DXY breaks 100 to the downside, Bitcoin lifts to $80K to $95K within 60 days. Cathie Wood’s $500K long-term call starts to look less crazy.
Frequently Asked Questions
Will Bitcoin reach $100,000 by end of 2026?
Standard Chartered assigns roughly a 45% probability to Bitcoin closing 2026 above $100K, according to their February 2026 note. Our base case sits slightly lower at $85K. The path runs through the Federal Reserve pivoting to rate cuts and sustained ETF inflows returning. A $100K print is possible, but not the most likely outcome by December 31.
Is Bitcoin a good investment in 2026?
That depends on your time horizon and risk tolerance. For a 5-year plus horizon, the risk-reward at $63K looks reasonable versus historical drawdowns and institutional adoption trends. For a 3-month trade, volatility is elevated and downside to $52K is a real scenario. Bitcoin has never lost money for anyone who held for 4 plus years, but past performance does not guarantee future results.
Why is Bitcoin price falling in 2026?
Two main drivers: Federal Reserve hawkishness under Chair Kevin Warsh, and spot ETF outflows totaling $4.5 billion in June 2026. The June sell-off was the worst month on record for Bitcoin ETFs since launch. When institutional flows turn negative, price follows. The July 28 to 29 Fed meeting is the next major catalyst.
Is the Bitcoin halving cycle dead?
No, but it has evolved. The four-year rhythm from previous cycles still shows up in the current drawdown. What has changed is that ETF flows now dominate the marginal price, not miner supply. Bitcoin is still following the halving script directionally, but institutional capital determines the magnitude and duration of the moves.
How low can Bitcoin go in 2026?
Standard Chartered’s bear case is $50,000. StoneX flagged $52,000 as a realistic retest zone. The 200-week moving average currently sits around $55,000 and has held every major cycle low since 2016. Below $50K would require a serious macro shock or regulatory event, both of which are possible but not our base case.
Should I buy Bitcoin now?
We do not give financial advice, but here is the framework: Bitcoin at $63K, with Fear and Greed at 27, has historically been a favorable entry zone for long-term holders. Short-term traders should wait for a weekly close above $67K or a clean bounce off the $58K to $60K support zone. Never allocate more than you can afford to lose to any single crypto asset.
The Honest Take
Here is where we land. Bitcoin at $63,044 is not dead. It is not broken. It is in a textbook post-halving bear market that happens to look ugly because it is playing out on Bloomberg terminals for the first time. The cycle has evolved. Halving supply constraints matter less. ETF flows and Federal Reserve policy matter more. That is a structural shift, not a bug.
The base case for year-end 2026 sits at $85K, which is neither victory nor catastrophe. The bull case at $120K to $150K requires the Federal Reserve to blink and ETF inflows to sustain. The bear case at $50K to $58K requires ETF outflows to resume and macro to worsen. All three are live scenarios. Position accordingly.
What is not on the table? A moonshot from here to $500K by December. That is not analysis, it is fantasy. And a total collapse to $20K without a systemic financial crisis is equally unlikely given institutional structural bids. The range is $50K to $150K. That is the honest take.
Disclaimer: This article is for informational and educational purposes only and should not be construed as financial, investment, or trading advice. Cryptocurrency markets are highly volatile, and past performance does not guarantee future results. The price predictions and analyses presented here are based on AI models, technical indicators, and available data at the time of writing. They are not guarantees. Always conduct your own research (DYOR) and consult with a qualified financial advisor before making any investment decisions. Pump Parade and its authors do not assume liability for financial losses incurred based on information provided in this article.