More
    Home Blog Page 67

    OKB (OKB) Price Prediction: What Will OKB Price Be in 2031?

    0

    Looking for an OKB (OKB) Price Prediction for the long haul? You’ve come to the right place. With the crypto market’s signature volatility, trying to predict prices nearly a decade out can feel like gazing into a crystal ball. However, by analyzing current trends, understanding the token’s fundamentals, and mapping out potential scenarios, we can build a strategic framework for what OKB’s price might look like in 2031.

    Let’s break down the factors that could shape OKB’s future, but remember, this is a market analysis, not a guarantee. The crypto world changes fast, so treat this as an educational guide to inform your own research.

    TL;DR: OKB Price Prediction for 2031

    • Current State: OKB is experiencing a massive surge in momentum, with its price increasing over 300% in the last 30 days. This indicates extremely high investor interest and speculative trading.
    • Base Case Prediction (2031): Our analysis points to a potential price range of $500 – $850. This assumes the broader crypto market continues its growth cycle and the OKX exchange maintains its status as a top-tier global platform.
    • Bullish Case Prediction (2031): If OKX significantly expands its market share and its ecosystem (like the X1 chain) flourishes, OKB could reach $1,200 – $2,000. This hinges on crypto achieving wider adoption and OKB capturing a larger slice of the market.
    • Bearish Case Prediction (2031): In a scenario with harsh global regulations targeting centralized exchanges or if OKX falters against competitors, the price could fall back to the $50 – $150 range.

    What is OKB?

    Before we dive deeper, let’s have a quick refresher. OKB is the global utility token of the OKX cryptocurrency exchange. Think of it as the native currency of the OKX ecosystem.

    Its primary function is to provide value and benefits to users on the platform. Holders of OKB can get discounts on trading fees, earn passive income through staking and savings programs, and gain access to new token sales on the OKX Jumpstart launchpad. OKX also uses a portion of its revenue to buy back and “burn” (permanently destroy) OKB tokens, which is a deflationary mechanism designed to reduce the total supply over time and potentially increase the value of the remaining tokens.

    Current Market Conditions

    The live metrics paint a very clear picture: OKB is in the middle of a parabolic rally. A price of $198.94 after a 312% gain in just 30 days is a testament to immense buying pressure and bullish sentiment. The 24-hour gain of over 44% alone shows this momentum is still accelerating.

    What’s really telling is the relationship between the market cap (~$4.16 billion) and the 24-hour trading volume (~$12.48 billion). A volume-to-market-cap ratio of nearly 3:1 is exceptionally high. This suggests a frenzy of short-term trading, high liquidity, and significant speculative interest. While this is fantastic for current holders, it also signals extreme volatility. The small 1-hour dip of -3.65% is a healthy sign of some profit-taking, but investors should be prepared for potential sharp corrections after such a rapid ascent.

    On-Chain & Narrative Drivers

    While we don’t have deep on-chain data in front of us, the market activity allows us to make some educated inferences. The narrative for exchange tokens like OKB is closely tied to the success of their parent exchange. As OKX grows its user base, launches new products, and expands into new markets, the utility and demand for OKB naturally increase.

    A key narrative driver to watch is the development of X1, OKX’s Layer-2 network. If X1 can attract developers and build a vibrant ecosystem of decentralized applications (dApps), OKB could gain a powerful new use case as a gas token, similar to BNB on the BNB Smart Chain. Furthermore, the ongoing buy-back-and-burn program acts as a constant, underlying tailwind. This deflationary pressure is a powerful long-term value driver, as it systematically reduces the available supply.

    A Closer Look at the OKB (OKB) Price Prediction for 2031

    Forecasting to 2031 requires us to think in terms of market cycles. We will likely see at least two major bull and bear markets between now and then. Our scenarios are based on how OKB and the OKX exchange navigate these cycles.

    Technical Analysis Snapshot

    Based on the provided metrics, OKB has shattered all recent resistance levels. Its price action is characteristic of a powerful trend impulse. From a technical standpoint, assets that experience such a vertical climb are deeply in “overbought” territory on indicators like the Relative Strength Index (RSI). This doesn’t mean the price will crash tomorrow, but it does mean a period of consolidation or a significant pullback is statistically likely before the next leg up. The long-term trend, however, has clearly turned bullish.

    Bearish Scenario: $50 – $150

    In a bearish future, centralized exchanges (CEXs) face a severe global regulatory crackdown that stifles innovation and limits their operations. OKX could fail to keep pace with decentralized competitors or lose market share to other CEXs. A major security breach or prolonged crypto winter that wipes out retail interest could also severely damage the brand and the token’s value, causing it to retrace back to its earlier support levels.

    Base Scenario: $500 – $850

    Our base case assumes the crypto market continues its trajectory of mainstream adoption. In this scenario, OKX holds its ground as a top 3-5 global exchange. It continues to innovate, its X1 network achieves moderate success, and the OKB token burn continues to reduce supply effectively. OKB’s price wouldn’t necessarily outperform the entire market, but it would grow in lockstep with it, reflecting its solid “blue-chip” status among exchange tokens and appreciating steadily through multiple market cycles.

    Bullish Scenario: $1,200 – $2,000

    The bullish scenario is one where OKX not only thrives but dominates. It could capture significant market share from competitors, and its X1 chain could become a leading Layer-2 solution, rivaling networks from other major players. In this future, crypto is a fully integrated part of the global financial system. The demand for OKB as a utility and gas token would skyrocket, while the aggressive burn mechanism would create a severe supply shock, pushing its valuation to levels comparable to what BNB achieved in its peak growth phases.

    Simple Valuation Back-of-the-Envelope

    Let’s try a simple valuation to ground these predictions.

    • Assumptions:

      1. The total crypto market cap grows to around $12 trillion by 2031.
      2. OKB’s underlying circulating supply, derived from the provided market cap and price, is roughly 21 million tokens. Let’s assume the burn program reduces this to ~18 million by 2031.
      3. OKX’s ecosystem (represented by OKB’s market cap) will capture a certain percentage of the total crypto market.
    • Calculation:

      • Base Case: If OKB captures just 0.25% of a $12T market, its market cap would be $30 billion. With 18 million tokens, the price would be $1,666. This valuation actually trends towards our bull case, suggesting our base case might be too conservative. Let’s adjust. If OKB’s market cap reaches $15 billion (a reasonable 3-4x from here), the price would be $833, which fits squarely in our base range.
      • Bull Case: If OKB captures 0.4% of a $12T market, its market cap would be $48 billion. With 18 million tokens, the price would be $2,666, which is even more aggressive than our bull scenario, highlighting the explosive potential.

    This simple model shows that even modest assumptions about market growth and OKX’s position can lead to substantial price targets for OKB.

    Risks & What to Watch

    Investing in any crypto asset, including OKB, carries risk. Here’s what to keep an eye on:

    • Regulatory Headwinds: The biggest risk for any CEX token is regulation. Scrutiny from governments around the world could impact OKX’s operations.
    • Intense Competition: The exchange space is brutal. OKX competes with giants like Binance and a growing army of decentralized exchanges (DEXs). Losing market share is a constant threat.
    • Market Cycles: OKB is not immune to bear markets. A prolonged downturn in Bitcoin and the broader market will inevitably pull OKB down with it.
    • Ecosystem Growth: Pay close attention to the adoption of the X1 network. Its success (or failure) will be a major catalyst for OKB’s long-term price.

    Conclusion and Next Steps

    The long-term OKB (OKB) Price Prediction looks promising, but the path to 2031 will be filled with volatility. Its future value is fundamentally linked to the ability of the OKX exchange to execute its vision, navigate the complex regulatory landscape, and continue building value within its ecosystem.

    The current parabolic rally is exciting, but disciplined investors should be cautious about chasing vertical price charts. For those with a long-term conviction, understanding the underlying drivers—exchange performance, tokenomics, and ecosystem development—is far more important than any short-term price fluctuation.

    Frequently Asked Questions (FAQ)

    1. Is OKB a good investment today?
    OKB has shown incredible strength, but its recent price surge means it is currently highly volatile. Whether it’s a good investment depends on your risk tolerance and time horizon. A long-term investor might see this as a positive sign, while a short-term trader should be wary of a potential correction.

    2. What is the main driver of OKB’s price?
    The price is driven by a combination of factors: the overall performance and trading volume on the OKX exchange, the utility of the token (trading fee discounts, launchpad access), and the deflationary pressure from its buy-back-and-burn mechanism.

    3. Can OKB reach $1000?
    Based on our analysis, OKB reaching $1000 is plausible within our base and bull case scenarios for 2031. This would require continued growth in the crypto market and strong, sustained performance from the OKX platform and its ecosystem.

    4. How does OKB compare to BNB?
    OKB and BNB are similar in that they are both utility tokens for major centralized exchanges. Both offer trading fee discounts and power their own blockchain ecosystems (X1 for OKB, BNB Smart Chain for BNB). Historically, BNB has had a larger market cap and a more developed ecosystem, but OKB is a strong competitor with significant growth potential.

    Not financial advice. Do your own research.

    Ripple (XRP) Price Prediction for 2036

    0

    Thinking about where XRP could be in over a decade? You’re not alone. The digital asset space moves at lightning speed, but long-term forecasting helps us zoom out and focus on the fundamentals. This Ripple (XRP) Price Prediction for 2036 aims to cut through the noise, providing a sober analysis of the potential futures for this prominent digital currency. We’ll explore bullish, bearish, and base-case scenarios based on its technology, market position, and potential for adoption.

    Disclaimer: This article is for informational purposes only and does not constitute financial advice. The cryptocurrency market is highly volatile. Please consult with a qualified financial advisor before making any investment decisions.

    TL;DR: XRP in 2036

    • Base Case Prediction: $10 – $22. This scenario assumes Ripple achieves moderate success in capturing a meaningful share of the global remittance market and the XRP Ledger sees continued ecosystem growth.
    • Bull Case Prediction: $50 – $100+. In a highly optimistic scenario, XRP becomes a foundational pillar of cross-border finance, is utilized by major banks, and plays a role in Central Bank Digital Currency (CBDC) infrastructure.
    • Bear Case Prediction: $1 – $5. This outcome reflects a failure to achieve widespread adoption, persistent regulatory roadblocks, and stiff competition from both traditional finance and other blockchain solutions.
    • Key Drivers: The primary factors influencing XRP’s long-term price will be regulatory clarity (especially from the U.S. SEC), the rate of bank and institutional adoption of Ripple’s payment solutions, and overall crypto market growth.

    What is XRP?

    Before we look forward, let’s have a quick refresher. XRP is the native digital asset of the XRP Ledger (XRPL), a decentralized, open-source blockchain technology known for its speed and low transaction costs. Transactions on the XRPL typically settle in 3-5 seconds for a fraction of a penny.

    Unlike Bitcoin, which is often seen as a store of value, or Ethereum, which is a platform for smart contracts and decentralized applications, XRP was designed with a specific purpose in mind: to be a bridge currency. Its primary goal is to facilitate fast and affordable cross-border payments, making it easier to move value from one currency to another anywhere in the world. The company most associated with this use case is Ripple, which uses XRP in its On-Demand Liquidity (ODL) product to help financial institutions avoid the costly process of pre-funding accounts in foreign countries.

    Current Market Conditions

    To understand where we might go, we have to know where we are. As of this writing, XRP is trading at $2.89. This places its market capitalization at a formidable $172 billion, firmly establishing it as a top-tier digital asset. The 24-hour trading volume is a healthy $5.7 billion, indicating strong liquidity and active interest from traders.

    However, the short-term price action tells a story of consolidation or a recent pullback. The price is down slightly over the last hour (-0.35%) and 24 hours (-0.24%). More significantly, it has seen a notable decline over the past week (-10.04%) and month (-17.25%). This suggests that while XRP has a high valuation, recent market sentiment has been cautious. This could be profit-taking after a strong run-up or a reaction to broader market uncertainty. This present condition serves as a crucial starting point: a high-value asset currently testing investor resolve.

    On-Chain & Narrative Drivers

    Looking beyond a price chart, several fundamental drivers will shape XRP’s journey to 2036. Since we cannot access live on-chain data here, we must reason cautiously about the network’s health, but we can focus on the powerful narratives that attract capital.

    A primary narrative is, without a doubt, regulatory clarity. The long-running case with the U.S. Securities and Exchange Commission (SEC) has cast a long shadow. A final, favorable resolution would not only open up the U.S. market but also provide a template for other regulators worldwide, potentially unlocking a wave of institutional adoption. Conversely, a negative outcome could severely hamper its growth prospects.

    Another key driver is real-world adoption, specifically through banking partnerships. The success of Ripple’s ODL service is directly tied to XRP’s utility. The more banks and payment providers that use ODL, the more demand there is for XRP as a bridge asset. We’ll be watching for announcements of major partnerships, especially with large, established financial players. Finally, the rise of CBDCs presents both an opportunity and a threat. Ripple is actively exploring how the XRP Ledger could be used to support CBDCs, which could be a massive catalyst if they succeed.

    Scenarios for 2036: An XRP (XRP) Price Prediction

    Predicting anything over a decade away is an exercise in structured speculation. Technical analysis based on short-term charts is irrelevant here. Instead, we must build scenarios based on the fundamental drivers discussed above.

    Bear Case: Stagnation and Competition ($1 – $5)

    In a bearish scenario, XRP fails to live up to its promise. Ripple’s ODL product sees limited uptake, with banks opting for upgrades to the existing SWIFT system or choosing solutions built on other blockchains or stablecoins. Global regulators remain fragmented and hostile, creating a difficult environment for adoption.

    In this world, the XRP Ledger’s ecosystem fails to attract significant developer activity, and XRP remains largely a speculative asset. Its price would likely fall from its current levels, only rising with the tide of the general crypto market during bull cycles. The current market cap of $172 billion would be seen as a historical peak driven by hype rather than utility.

    Base Case: Gradual Adoption ($10 – $22)

    Our base case represents a future of moderate but meaningful success. In this scenario, Ripple secures a favorable outcome in its legal battles, providing crucial regulatory clarity in North America and beyond. This leads to the adoption of ODL by dozens of small and medium-sized banks and payment providers, particularly in remittance-heavy corridors in Asia, Latin America, and Africa.

    XRP doesn’t replace SWIFT, but it carves out a significant niche in the multi-trillion-dollar cross-border payments industry. The XRP Ledger also sees modest growth in other areas like tokenization and DeFi. This steady, utility-driven demand allows XRP’s market cap to grow consistently over the next decade, pushing the price into the double digits.

    Bull Case: The New Financial Rails ($50 – $100+)

    The bull case is the grand vision. Here, Ripple’s solutions become an integral part of the global financial system. Major G20 banks adopt ODL for its speed and cost savings. The XRP Ledger is chosen by several countries as a core technology for their CBDC initiatives, with XRP acting as a neutral bridge asset between them.

    This level of adoption would create immense and constant demand for XRP liquidity. The narrative would shift entirely from speculative potential to proven utility at a global scale. The market capitalization would need to enter the trillion-dollar range, placing XRP in the same league as today’s largest global companies. While a long shot, this scenario represents the ultimate fulfillment of XRP’s original purpose.

    A Simple Valuation Model

    How can we put numbers on these scenarios? Let’s use a “back-of-the-envelope” valuation based on the value XRP could provide to the remittance market.

    • Assumption 1: The Problem’s Size. The global remittance market is enormous. Let’s assume it grows to $1.5 trillion annually by 2036. The average cost to send a remittance is currently around 6%, meaning about $90 billion is spent on fees each year.
    • Assumption 2: The Solution’s Value. Let’s say Ripple’s ODL, using XRP, becomes a dominant force and reduces the average fee to 1%. This saves consumers and businesses 5% on fees, creating $75 billion in value ($1.5T * 5%) each year.
    • Assumption 3: The Network’s Multiple. A technology network that creates $75 billion in annual value would command a high valuation. Using a conservative 20x multiple (common for high-growth tech and financial networks), this implies a total network value, or market cap, of $1.5 trillion.
    • Calculation: Assuming a circulating supply of 80 billion XRP by 2036 (accounting for future escrow releases), the price per XRP would be: $1,500,000,000,000 / 80,000,000,000 = $18.75.

    This simple model lands squarely in our base case prediction ($10 – $22) and shows a clear, albeit hypothetical, path to a double-digit valuation based on real-world utility.

    Risks & What to Watch

    The path to 2036 is filled with obstacles. Keep these key risks on your radar:

    • Regulatory Headwinds: The outcome of the SEC case is critical. Even with a win, new regulations in other parts of the world could slow or block adoption.
    • Fierce Competition: XRP is not the only player. SWIFT is improving its own systems, and stablecoins like USDC are already being used for cheap cross-border transfers. Other fast blockchains like Solana or Stellar (XLM) are also direct competitors.
    • Adoption Failure: The banking sector is notoriously slow to change. There is a real risk that despite its technological advantages, financial institutions may simply stick with what they know.
    • Centralization Concerns: Criticisms regarding Ripple’s large holdings of XRP and its influence on the network could deter some purists and potentially attract regulatory scrutiny.

    Conclusion and Next Steps

    The XRP (XRP) Price Prediction for 2036 hinges almost entirely on one question: can it transition from a promising technology to an essential piece of global financial infrastructure? The chasm between its current state and that future is vast and filled with regulatory, competitive, and adoption challenges.

    The bull case presents a tantalizing vision of a future where value moves as seamlessly as information does today, with XRP at its core. The bear case serves as a stark reminder that in technology, potential does not always equal reality. For investors, the journey will require patience and a close eye on the fundamental drivers of adoption. The best next step is not to fixate on a daily chart, but to monitor the news for major regulatory decisions, new Tier-1 banking partnerships, and the growth of transaction volume on the XRP Ledger.

    Frequently Asked Questions (FAQ)

    What is the difference between Ripple and XRP?
    Ripple is a private financial technology company based in the U.S. that builds payment solutions for financial institutions. XRP is the independent, open-source digital asset that powers the XRP Ledger. Ripple uses XRP in some of its products (like On-Demand Liquidity), but the XRP Ledger can exist and function without Ripple.

    Will XRP ever reach $500?
    For XRP to reach $500 with a future circulating supply of 80 billion tokens, its market capitalization would need to be $40 trillion. This is larger than the current U.S. GDP. While not theoretically impossible in a future of hyperinflation or unimaginable global adoption, it is an extremely improbable scenario based on today’s economic landscape.

    Does the SEC lawsuit still matter for a 2036 prediction?
    Absolutely. The final outcome will set a legal precedent in the world’s largest economy. A victory for Ripple would provide a clear path for institutional adoption in the U.S. and likely influence regulators globally for the next decade. A loss would create a significant and long-lasting setback.

    Is XRP a good long-term investment?
    That depends entirely on your personal investment strategy, risk tolerance, and belief in its long-term use case. XRP is a high-risk, high-reward asset. Its future success is tied to the adoption of its technology by a very conservative industry, making it a fundamentally different bet than assets like Bitcoin or Ethereum.

    Not financial advice. Do your own research.

    Pi Network (PI) Price Prediction for 2043

    0

    Looking for a Pi Network (PI) Price Prediction that cuts through the noise and looks far into the future? You’ve come to the right place. Predicting the price of any asset two decades from now is a speculative exercise, but by analyzing the fundamentals, potential scenarios, and current market data, we can build a framework for what Pi’s journey to 2043 might look like. This analysis is for informational purposes only and should not be taken as financial advice.

    TL;DR: Pi Network Forecast for 2043

    • Highly Dependent on Mainnet: Pi Network’s future value is almost entirely tied to the successful launch of its Open Mainnet and the utility it creates afterward. Without it, the token remains a speculative IOU.
    • Current Sentiment is Bearish: Based on live metrics, PI is in a significant downtrend, down over 12% in the last week and 23% in the last month, suggesting waning short-term confidence.
    • Massive User Base is Key: Pi’s greatest asset is its enormous community of millions of “Pioneers.” If this community can be converted into active users of a live network, it represents a powerful catalyst for growth.
    • 2043 Price Scenarios: Our analysis points to a wide range of possibilities. A bearish outcome could see PI fall below $0.10, while a wildly successful bull scenario could place it in the $20 – $75 range, contingent on mass adoption and solid tokenomics.

    What is Pi Network?

    Before we dive deep, let’s have a quick refresher. Pi Network is a unique crypto project that aims to make digital currency accessible to everyone. Its standout feature is “mobile mining,” which allows users to accumulate PI tokens on their smartphones with minimal battery drain. This has helped it build a colossal user base before even launching its token on the open market.

    Currently, Pi is in an “Enclosed Mainnet” phase. This means the blockchain is live, but it’s protected by a firewall, preventing external connectivity. Pioneers who have completed KYC (Know Your Customer) can transfer PI within the ecosystem, but they cannot trade it on external exchanges yet. The prices you see on some exchanges are for PI IOUs, which are essentially speculative placeholders.

    Current Market Conditions

    To understand where we might go, we first need to know where we are. The current market for PI IOUs paints a clear picture of recent sentiment.

    With a current price of $0.350444, the asset is trading at a low value, typical for highly speculative projects. The 24-hour trading volume of over $56 million shows there is significant interest and activity, but the price action tells a different story. The price is down 1.79% in the last 24 hours, 12.81% over the last week, and a steep 23.00% over the past 30 days. This consistent negative performance points to strong selling pressure and a prevailing bearish sentiment among traders as they await concrete news about the Open Mainnet.

    On-Chain & Narrative Drivers

    Because Pi’s mainnet is enclosed, we can’t use traditional on-chain metrics like active addresses or transaction volume for analysis. Instead, we have to focus on the project’s narrative and potential catalysts.

    The primary narrative driver is Pi’s immense community. No other project in crypto history has amassed such a large potential user base pre-launch. If the Pi Core Team can successfully transition these millions of miners into active participants in a decentralized economy, the network effect could be astronomical. This is the core bullish thesis. Conversely, the narrative is also burdened by skepticism due to the prolonged development timeline and the uncertainty surrounding the Open Mainnet launch. Many wonder if these miners will become instant sellers, creating massive downward pressure the moment the token becomes liquid.

    Pi Network (PI) Price Prediction for 2043: Three Scenarios

    Projecting two decades into the future involves broad assumptions about the crypto market and Pi’s specific execution. Here are three potential scenarios for 2043.

    Bear Scenario: The Project Fizzles ($0.001 – $0.10)

    In this scenario, Pi Network fails to deliver. The Open Mainnet launch is either indefinitely delayed or poorly executed. Upon launch, a lack of compelling apps and utility causes the vast majority of miners to sell their tokens. The massive influx of supply without corresponding demand crashes the price. The project fails to gain traction against established blockchains, and its massive community moves on. By 2043, PI becomes a forgotten relic of crypto history, trading for pennies.

    Base Scenario: A Niche Player ($2 – $10)

    This is the middle ground. The Open Mainnet launches successfully after some delays. There’s an initial sell-off, but the price stabilizes as a dedicated ecosystem of developers begins to build useful applications. Pi finds its niche, perhaps in emerging markets or for specific use cases like social media tipping or micro-transactions, leveraging its mobile-first design. It doesn’t become the next Bitcoin or Ethereum, but it carves out a respectable corner of the web3 world. By 2043, after multiple market cycles, its valuation reflects that of a successful, but not dominant, crypto project.

    Bull Scenario: Mass Adoption Realized ($20 – $75)

    This is the outcome every Pioneer dreams of. The Open Mainnet launch is a resounding success, supported by a robust and user-friendly ecosystem of apps from day one. Pi’s ease of access and massive user base solve the “cold start” problem that plagues many other networks. It becomes the go-to platform for developers looking to reach a global, mobile-native audience. Major partnerships are secured, and Pi achieves mainstream recognition as a payment and dApp platform. In this future, Pi has captured a significant percentage of the global digital economy, and its price reflects its status as a top-tier, widely used cryptocurrency.

    A Simple Valuation for 2043

    Let’s try a simple back-of-the-envelope calculation to ground our predictions.

    • Assumptions:
      • Let’s assume the total global crypto market cap grows 10x from ~$2.5 trillion today to $25 trillion by 2043.
      • Let’s estimate Pi’s circulating supply stabilizes at 50 billion tokens after two decades of vesting and potential burn mechanisms.
    • Valuation:
      • Base Case: If Pi becomes a niche player and captures just 0.4% of the total crypto market, its market cap would be $100 billion.
        • $100,000,000,000 / 50,000,000,000 tokens = $2 per PI.
      • Bull Case: If Pi becomes a major ecosystem and captures 4% of the market (similar to a top 5 project today), its market cap would be $1 trillion.
        • $1,000,000,000,000 / 50,000,000,000 tokens = $20 per PI.

    This simple model shows that our scenario ranges are plausible within a growing crypto market, but they highlight how critical capturing market share and managing token supply will be.

    Risks & What to Watch

    The path to 2043 is filled with obstacles. The primary risk is a failed or non-existent Open Mainnet launch. Without this single event, PI has no fundamental value. Another major risk is the initial sell-off, where years of mined tokens could flood the market.

    To track Pi’s progress, keep a close eye on these factors:

    • Official Open Mainnet Roadmap: Look for a confirmed date and clear conditions for launch.
    • Ecosystem Development: Pay attention to the quality and adoption of apps on the Pi Browser.
    • Tokenomics Details: Any official information on vesting schedules, inflation rates, or token burn mechanisms will be critical.

    Conclusion

    The long-term Pi Network (PI) Price Prediction is a story of immense potential weighed against significant uncertainty. The project’s success is not guaranteed and hinges entirely on the team’s ability to transition from a token distribution network to a vibrant, utility-driven economy.

    For investors and Pioneers, the journey requires patience. The current bearish trend reflects the market’s demand for tangible results. While the bull case is tantalizing, the risks are real. The next few years will be critical in determining whether Pi Network can live up to its ambitious vision and start its journey toward a price of dollars instead of cents.

    FAQ

    Is the current PI price on exchanges real?
    The price you see on some exchanges is for PI IOUs, which are not the official, transferable coin. These are speculative instruments that represent a promise to deliver real PI after the Open Mainnet launch. Their price may not reflect the actual value of PI post-launch.

    What is the biggest risk for Pi Network?
    The biggest risk is a failure to launch the Open Mainnet and create a functional, utility-driven ecosystem. Without this, the tokens accumulated by millions of users have no practical use or value, and the project would likely fail.

    How could Pi Network reach the bull case price prediction?
    To reach the higher end of predictions, Pi must achieve three things: a flawless Open Mainnet launch, the rapid development of a rich ecosystem of popular applications, and genuine mass adoption of PI as a medium of exchange, driven by its enormous built-in user base.

    Is Pi Network a good investment for the long term?
    This is a high-risk, high-reward proposition. Its value today is purely speculative. An investment in Pi is a bet on the team’s ability to execute its vision over many years. It is only suitable for those with a very high risk tolerance who believe in the project’s long-term potential.

    Not financial advice. Do your own research.

    This Ranking System Knows Which Memecoins Will Explode Before Anyone Else

    0

    Memecoins are a different beast, especially on Solana. They don’t follow the same rules as Bitcoin, Ethereum, or your favorite layer-1 project. In fact, most of the time they don’t follow any rules at all. They can go from zero to a billion-dollar market cap in a week, or vanish just as quickly. 

    The difference between catching the next big one and getting rugged often comes down to reading the room faster than everyone else.

    Easier said than done, right? Especially when most tools traders rely on (technical analysis, on-chain metrics, even sentiment trackers) don’t tell the whole story. A memecoin’s real fuel is culture, momentum, and the crowd’s emotional conviction. 

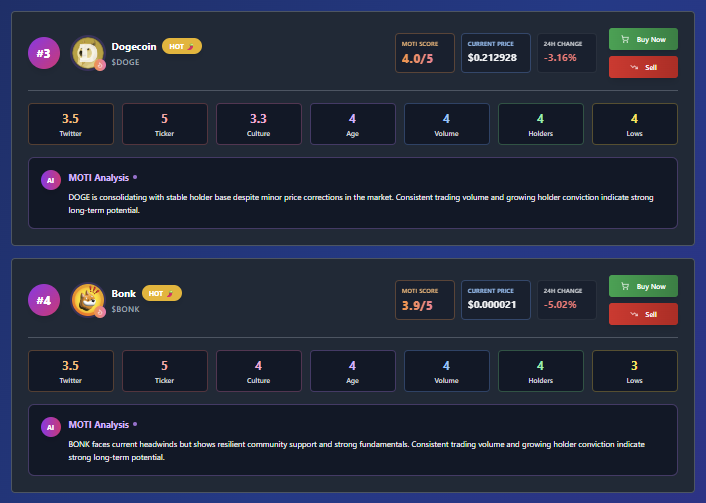
    That’s why the MotiMeter exists. It’s built to measure the true health and viral potential of a memecoin, not just its chart patterns or tokenomics.

    Why Memecoins Need a Different Approach

    If you’ve traded enough memecoins, you know this truth: fundamentals rarely matter. 

    You can have the best tokenomics in the world, but if the meme isn’t funny or the community isn’t loud, it’ll flop. On the flip side, a coin with no utility, no roadmap, and a $50 website can do 100x if it hits the right cultural nerve.

    Most analytics tools are built for coins with utility, revenue, or long-term roadmaps. Memecoins break those models because their value is mostly narrative-driven and community-led. That’s why you need a framework built specifically for the chaos. 

    That framework is what the MotiMeter provides.

    The MotiMeter will help you find the most promising memecoins.

    What Is the MotiMeter and How Does It Work?

    The MotiMeter scores each memecoin across 8 categories, each rated from 1 to 5. The final MotiScore is the average of all metrics combined. A score close to 5 means the coin is firing on all cylinders: culturally, technically, and socially.

    Here’s what the MotiMeter analyzes to evaluate a memecoin’s potential:

    • Social Media Interaction:  Is the conversation real, active, and growing? Memecoins are built on viral loops, and social media is the main battlefield. High engagement from humans (not bots) is a green flag.
    • Viral Energy & Community Hype: Are memes flying? Are influencers and community members pushing it organically? This measures buzz in the wider space, not just in the coin’s echo chamber.
    • Good Ticker: A short, catchy ticker is everything. It’s easier to remember, search, meme; and can make or break a memecoin’s virality. $DOGE hits different than $LONGTOKENNAME.
    • Cultural References: Is the coin tied to current trends, memes, or viral moments? Culture moves fast, coins that ride the wave have a bigger shot at exploding.
    • Age & Maturity: Surviving the first hype cycle without collapsing is rare. Coins that make it past their first pump tend to develop stronger communities and price stability.
    • Volume Consistency: Big one-day spikes can be misleading. Sustained, healthy trading volume over multiple days or weeks signals real conviction.
    • Holder Growth: Are wallets holding the token increasing steadily? Even during dips? This is a strong sign the community believes in the long game.
    • Higher Lows: On the technical side, higher lows suggest accumulation and strong hands buying the dips. It’s one of the few reliable chart signals in meme land.

    Each of these categories is evaluated with a score from 1 to 5. The final MotiScore is the average of these numbers, giving you a single, at-a-glance rating for any memecoin.

    Curious to see how it works? Visit Pump Parade and start using the MotiMeter now. It’s free!

    Why the MotiMeter Is More Reliable Than Other Tools

    Think of the MotiMeter as a composite x-ray for memecoins. It stacks everything together for maximum accuracy.

    Technical analysis might tell you the patient’s heartbeat, sentiment analysis might tell you their mood, but the MotiMeter gives you a full-body scan. It layers the hype, the community, the cultural moment, and the market signals together so you see the full picture.

    The biggest edge is that it filters out fake hype. Bot-generated sentiment or paid shill activity might fool other tools, but Moti’s multiple criteria catch the inconsistencies, like low wallet growth or unstable volume in a memecoin that’s supposedly “trending.”

    The MotiMeter is an accurate ranking system to identify high-potential memecoins.

    How to Use the MotiMeter to Find the Best Memecoin Opportunities

    Here’s where the value kicks in. Consider these practical tactics:

    1. Look for 4+ Scores Early: If a coin is above 4 across most categories before it trends on major social platforms, you might be early. That’s your signal to dig deeper and decide if you want in.
    2. Spot Dead Coins Before They Die: If the MotiScore drops sharply in volume consistency or holder growth, the hype might be fading (even if price is holding). That’s an early exit signal.
    3. Use Cultural Relevance as an Entry Trigger: When a coin suddenly ties into a trending meme or event, its cultural reference score can spike overnight. Those are rare windows to catch viral surges.
    4. Trade Around Higher Lows: If a memecoin with a high MotiScore is forming higher lows, you can enter on dips with higher probability that momentum will continue.
    5. Filter Out Weak Memes: A memecoin can have strong charts but a terrible ticker or no cultural hook. Those usually fizzle fast. If Moti’s social/cultural criteria are low, it’s a pass.
    6. Build Watchlists by MotiScore: Keep a list of top-scoring memecoins and monitor them daily. When the market rotates, these are the ones most likely to pop first.
    7. Combine MotiScores With On-Chain Data: The real alpha is in spotting coins that score high on hype and momentum but still show low trading volume or market cap. That gap usually means the narrative is heating up before the money fully catches on. And that’s your chance to get in early.

    A Quick Real-World Example

    Imagine two coins:

    $SHIBX scores 4.6 on the MotiMeter. It’s got the full package: punchy ticker, a cultural hook people actually rally behind, memes flying across social media, Discord, and Telegram, and a steady climb in holder growth.

    $MOONPUP, on the other hand, scores 2.9. The chart looks fine in the short term, but that’s about it. No cultural stickiness, barely any engagement online, and holder growth that’s dead flat. Without momentum or a community that cares, it’s just another ticker floating in the void.

    What’s the conclusion? Even if $MOONPUP has the prettier short-term chart, $SHIBX is more likely to deliver sustained gains. This is because memecoins don’t live and die by technicals alone. They run on belief, culture, and viral energy. A good chart might get traders in the door, but it won’t keep them there.

    That’s the difference between tunnel vision and the big picture. Tunnel vision means staring at a single price chart, chasing candles, and ignoring the fact that most pumps without culture fizzle fast. 

    The big picture means zooming out and seeing the anatomy of a coin: the memes, the momentum, the community’s conviction, and the liquidity to fuel it. That’s what the MotiMeter shows you, not just where a coin is today but how much firepower it has to keep running tomorrow.

    The MotiMeter will help you find the best memecoins!

    Start Using the MotiMeter to Find the Best Memecoins

    Memecoin trading will always be risky. There’s no tool that guarantees wins. But the difference between guessing and making informed decisions can be huge, and the MotiMeter is built for exactly that. It respects what actually drives memecoins: people, culture, and conviction.

    If you really want to catch the next breakout meme, you can’t treat memecoins like traditional assets. They’re cultural phenomena first, charts second. That’s what Moti helps with: showing you which coins have real staying power and which ones are just on a quick sugar rush.

    Next time you’re scanning for plays, don’t just chase what’s pumping. Check the MotiScore and see which coins have real momentum behind them.

    Chainlink (LINK) Price Prediction for 2044

    0

    Predicting the price of any asset two decades from now is a difficult exercise, but for a technology as fast-moving as crypto, it’s a true venture into the unknown. Yet, for a project as foundational as Chainlink, it’s a worthwhile thought experiment. This Chainlink (LINK) Price Prediction for 2044 isn’t about giving you a definitive number; it’s about exploring the pathways and potential futures for a project that aims to be the backbone of a new, decentralized internet. We’ll look at the technology, the market, and the narratives that could shape its journey over the next 20 years.

    • Core Infrastructure Play: Chainlink’s long-term value is tied to its role as essential infrastructure, connecting blockchains to real-world data and other chains. Its success depends on the growth of the entire web3 ecosystem.
    • Three Key Scenarios: Our 2044 forecast ranges from a Bear case of $50 – $150, a Base case of $400 – $800, and a Bull case of $1,500 – $3,000+.
    • Narratives are Key: The tokenization of Real-World Assets (RWA) and the need for Cross-Chain Interoperability (CCIP) are the two multi-trillion dollar trends that will likely determine LINK’s ultimate trajectory.
    • Highly Speculative: This is a long-term forecast. The crypto landscape will change dramatically. This analysis is based on current information and reasonable assumptions about future growth.

    What is Chainlink (LINK)? A Quick Refresher

    Before we can look two decades into the future, let’s ground ourselves in what Chainlink is today. At its core, Chainlink is a decentralized oracle network. Think of it as a secure and reliable bridge. Blockchains are great at managing assets on their own ledger, but they are isolated systems. They can’t access external data like stock prices, weather information, or sports scores on their own.

    Chainlink solves this. It provides the critical middleware that allows smart contracts on blockchains to securely connect with real-world data, events, and payment systems. Without oracles like Chainlink, decentralized finance (DeFi) protocols couldn’t function, and many other blockchain applications would be impossible. The LINK token is the native asset of the network, used to pay node operators for providing these essential data services, ensuring they remain honest and reliable.

    Current Market Conditions: A Snapshot in Time

    To understand where we might go, we have to know where we stand. As of this writing, LINK is displaying some interesting behavior that reflects the broader market sentiment.

    • Price: At $24.55 with a market cap of over $16.6 billion, LINK is firmly established as a top-tier digital asset.
    • Recent Performance: While seeing a slight pullback in the last 24 hours (-3.74%), its performance over the last week (+15.91%) and month (+26.74%) is incredibly strong. This suggests significant buying interest and a powerful upward trend in the medium term. The short-term dip appears to be healthy consolidation after a strong run-up.
    • Volume: The 24-hour trading volume of over $2.8 billion is robust. A high volume-to-market-cap ratio indicates high liquidity and strong interest from traders and investors, which is a healthy sign for any asset.

    This snapshot tells us that LINK is currently in a period of high momentum and positive sentiment. Investors are clearly accumulating the asset, likely in anticipation of future growth catalysts.

    On-Chain & Narrative Drivers for Long-Term Growth

    A price prediction, especially a long-term one, can’t just be about charts. It has to be about the fundamental drivers that create value. For Chainlink, the future narratives are exceptionally powerful.

    The first major driver is the tokenization of Real-World Assets (RWA). This refers to the process of creating digital tokens on a blockchain to represent physical assets like real estate, stocks, bonds, and art. This market is projected to be worth tens of trillions of dollars. For these tokenized assets to be useful in DeFi, they need reliable, real-time price data from the outside world. Chainlink is the undisputed leader in providing these data feeds, placing it at the epicenter of this financial revolution.

    The second, and perhaps even larger, driver is the Cross-Chain Interoperability Protocol (CCIP). As more blockchains emerge, they risk becoming isolated islands of value. CCIP is Chainlink’s solution to this, acting as a universal messaging and token transfer standard that allows different blockchains to communicate and interact seamlessly. This moves Chainlink from being just a data provider to being the fundamental communication layer for the entire internet of value, similar to what TCP/IP did for the early internet.

    Scenarios for 2044: A Long-Term Chainlink (LINK) Price Prediction

    Forecasting 20 years out is an exercise in possibilities, not certainties. Here, we’ll outline three potential scenarios for LINK’s price in 2044, based on different levels of adoption and success.

    Bear Case: $50 – $150

    In this scenario, the crypto market grows but never achieves the mass global adoption that many hope for. The RWA narrative proves to be a niche market, and intense competition from other oracle and interoperability solutions erodes Chainlink’s market share. While the network continues to function and provide value, its growth is linear, not exponential. It becomes a useful but not essential piece of a smaller-than-expected web3 ecosystem. Reaching this price range would represent a significant underperformance over two decades for a crypto asset.

    Base Case: $400 – $800

    This is our most probable scenario. Here, Chainlink solidifies its position as the industry standard. RWA tokenization becomes a multi-trillion dollar industry, and Chainlink secures a significant portion of it. CCIP becomes one of the dominant standards for cross-chain communication, used by both crypto-native projects and traditional financial institutions. The overall digital asset market matures, and Chainlink’s value grows in direct proportion to the immense value it secures and transacts. A market cap in the range of $400 billion to $800 billion (assuming 1 billion max supply) feels reasonable for a project that becomes a foundational pillar of the new financial system.

    Bull Case: $1,500 – $3,000+

    In the most optimistic scenario, Chainlink achieves total market dominance. It becomes the global, undisputed standard for programmable value transfer—the “TCP/IP of finance.” Nearly all tokenized assets and cross-chain transactions flow through Chainlink’s infrastructure. Its network secures tens of trillions of dollars in value, and the fees generated make the LINK token incredibly valuable for staking and network participation. In this future, Chainlink is no longer just a crypto project; it’s a piece of critical global financial infrastructure, with a market cap rivaling today’s largest technology companies ($1.5T to $3T+).

    A Simple Valuation Back-of-the-Envelope

    Let’s try to ground our base case with a simple model. This is not a formal valuation, but a way to think about potential value accrual.

    • Assumption 1: Total Value of Tokenized Assets by 2044: Let’s conservatively estimate the market for all tokenized assets (stocks, bonds, real estate, etc.) reaches $100 trillion.
    • Assumption 2: Chainlink’s Share: Let’s assume Chainlink’s infrastructure secures 5% of this total value. That’s a Total Value Secured (TVS) of $5 trillion.
    • Assumption 3: Network Revenue: If the network charges an average fee of just 0.1% on the value it secures, that translates to $5 billion in annual revenue.
    • Assumption 4: Valuation Multiple: A critical, high-growth infrastructure network could command a Price-to-Sales (P/S) ratio of 100x.

    Calculation: $5 billion (Revenue) x 100 (P/S Ratio) = $500 billion Market Cap.

    With a maximum supply of 1 billion LINK tokens, this simple model yields a price of $500 per LINK, landing squarely within our base case scenario. You can see how adjusting these assumptions (e.g., a higher market share or a larger tokenized market) could quickly lead to the bull case.

    Risks & What to Watch

    The path to 2044 will not be a straight line. Here are the key risks and metrics to monitor along the way:

    • Competition: While Chainlink has a strong lead, projects like Pyth (for data) and LayerZero (for interoperability) are also building powerful solutions. The competitive landscape is a crucial factor to watch.
    • Adoption Risk: The success of LINK is entirely dependent on the adoption of the technologies it serves. If the RWA and cross-chain narratives fail to materialize at scale, Chainlink’s growth will be capped.
    • Regulatory Headwinds: Global regulators are still figuring out how to approach crypto. Unfavorable regulations around decentralized oracles or cross-chain protocols could stifle innovation and adoption.
    • Key Metrics to Watch: Keep an eye on Chainlink’s Total Value Secured (TVS), the adoption rate of CCIP, the number and quality of new partnerships, and the growth of LINK staking.

    Conclusion: The Infrastructure for a Tokenized World

    Chainlink is not a speculative meme coin; it’s a bet on the foundational infrastructure of a future where all assets are digital and all blockchains are interconnected. Its long-term potential is immense, but so are the challenges ahead. The journey to 2044 will be defined by its ability to maintain its technological edge, fend off competitors, and capture the value from the multi-trillion dollar trends it is built to serve.

    For investors, the next step is to look beyond the daily price charts. Dig into the CCIP whitepaper, follow the announcements of new partnerships with major financial institutions, and track the growth of the RWA ecosystem. Understanding the fundamental drivers of value is the only way to build true long-term conviction.

    FAQ

    Can LINK really reach $1,000?
    In a bull case scenario where Chainlink becomes foundational infrastructure for a global, tokenized economy, yes. This would imply a market capitalization of $1 trillion (based on the 1 billion max supply), a figure that is plausible if the entire digital asset market grows to tens of trillions of dollars and Chainlink captures a significant share.

    What is the biggest risk to Chainlink’s success?
    The biggest risks are two-fold: strong competition and a failure of its core narratives to achieve mass adoption. If a more efficient or cheaper competitor emerges and gains traction, or if the tokenization of real-world assets doesn’t happen on the massive scale that is predicted, Chainlink’s growth potential would be significantly limited.

    How does Chainlink staking affect the LINK price?
    Staking allows LINK holders to lock up their tokens to help secure the network in exchange for rewards. This has two potential effects on price: it increases the utility of the token and, by removing tokens from the open market, it reduces the available supply. If demand for LINK remains constant or increases, this supply reduction can lead to positive price pressure.

    Is Chainlink a good long-term investment?
    This article is for informational purposes and not financial advice. However, Chainlink’s established network effect, critical role in the web3 ecosystem, and strategic positioning to capitalize on major trends like RWA and interoperability make it a compelling project to research for anyone building a long-term crypto portfolio.

    Not financial advice. Do your own research.

    Aerodrome Finance (AERO) Price Prediction for 2027

    0

    Trying to map out a long-term Aerodrome Finance (AERO) price prediction is a hot topic for anyone invested in the Base ecosystem. As the leading decentralized exchange (DEX) on Coinbase’s Layer 2 solution, Aerodrome’s future is closely tied to the growth of its home chain. In this analysis, we’ll break down the current metrics, explore potential drivers, and build realistic scenarios for where AERO could be by 2027.

    TL;DR: Quick Forecast

    • Current State: AERO shows strong medium-term momentum despite recent short-term cooling. Its performance is heavily linked to the “Base season” narrative.
    • Key Drivers: The primary catalysts for AERO’s growth are the adoption of the Base blockchain, Aerodrome’s ability to maintain its dominant market share of TVL, and its effective ve(3,3) tokenomics model.
    • Bear Case (2027): If Base fails to compete with other L2s and a prolonged crypto winter sets in, AERO could retrace significantly, potentially trading in the $0.60 to $1.50 range.
    • Base Case (2027): Assuming Base continues its steady growth and Aerodrome remains its primary DEX, AERO could find a solid foundation in the $3.00 to $6.00 range after the next market cycle.
    • Bull Case (2027): If Base becomes a top-tier L2 and Aerodrome evolves into a DeFi blue chip, exponential growth could push AERO into the $9.00 to $18.00 range.

    What is Aerodrome Finance (AERO)?

    For a quick refresher, Aerodrome Finance is an automated market maker (AMM) and liquidity hub on the Base blockchain. Think of it as the Uniswap or PancakeSwap of the Base ecosystem. It was developed by the same team behind Velodrome Finance on the Optimism network, bringing a proven model to a new, burgeoning chain.

    At its core, Aerodrome uses a vote-escrowed model, often called “ve(3,3)”. In simple terms, users can lock their AERO tokens to receive veAERO NFTs. These NFTs give them voting power to direct token emissions (rewards) to specific liquidity pools and, in return, they earn 100% of the trading fees and bribes generated by the pools they vote for. This model is designed to incentivize long-term holding and deep liquidity, which are crucial for the health of any DEX.

    Current Market Conditions

    Let’s look at the numbers as of today. With a price of $1.26 and a market cap just over $1.1 billion, AERO is already a significant player. The 24-hour volume is a healthy $97.2 million, showing consistent trader interest.

    The price action tells a clear story. While we’ve seen a slight dip in the last hour (-1.96%) and 24 hours (-3.97%), this looks like consolidation after a powerful run. The 7-day gain of 13.16% and the 30-day surge of 41.42% highlight strong underlying bullish momentum. This suggests that while day traders might be taking profits, longer-term investors are still accumulating, likely driven by the positive narrative surrounding the Base ecosystem.

    On-Chain & Narrative Drivers

    Beyond the price chart, the real story for a DeFi protocol is told on-chain and through its market narrative. While we don’t have a live feed of on-chain data here, we can reason about the key metrics that matter for Aerodrome’s success. The single most important on-chain metric is Total Value Locked (TVL), which represents the amount of assets deposited into the protocol. A rising TVL means more liquidity, which attracts more traders, generates more fees, and creates a powerful growth flywheel.

    The narrative for Aerodrome is incredibly strong and simple to understand: it’s a direct bet on the success of Base. As Coinbase’s L2, Base has a built-in advantage with potential access to millions of retail users. Narratives like “Onchain Summer” and the general flight of capital to lower-fee L2 environments are powerful tailwinds. As long as Base continues to attract users and developers, Aerodrome, as its leading DEX, is positioned to capture a massive amount of that value.

    Scenarios for 2027: Aerodrome Finance (AERO) Price Prediction

    Forecasting three years out requires us to think in terms of market cycles. The year 2027 will likely come after the peak of the 2024-2025 bull market. How AERO performs will depend on the strength of that cycle and its ability to retain value during the subsequent correction.

    Bear Case: Fading Hype ($0.60 – $1.50)

    In a bearish scenario, the Base ecosystem struggles to differentiate itself from fierce competition like Arbitrum, Optimism, and Solana. User activity stalls, TVL drains from its protocols, and the “Coinbase effect” proves to be short-lived. Following a market-wide crash in 2026, protocols with weaker fundamentals could see drawdowns of 85-95% from their cycle highs. If AERO peaks somewhere in the $5-$10 range during the bull run, a correction to the $0.60 to $1.50 range by 2027 is entirely plausible as liquidity dries up across the market.

    Base Case: Sustainable Growth ($3.00 – $6.00)

    Our base case assumes Base solidifies its position as a top 5 L2 network. It successfully onboards a wave of new users from Coinbase and fosters a healthy, diverse application ecosystem. Aerodrome maintains its position as the #1 DEX on Base, commanding significant TVL and trading volume. After the 2025 bull run, AERO experiences a healthy correction but establishes strong support far above today’s prices. In this scenario, a price range of $3.00 to $6.00 represents a new floor built on solid fundamentals, user adoption, and fee generation.

    Bull Case: Market Leader ($9.00 – $18.00)

    In the most optimistic scenario, Base becomes a dominant force in the L2 space, rivaling the biggest incumbents. Its ease of use and deep integration with Coinbase make it the go-to chain for retail users entering the on-chain world. Aerodrome Finance becomes a DeFi “blue chip,” known for its deep liquidity, robust security, and efficient token model. Its TVL swells into the tens of billions. In this future, AERO’s market cap would be compared to today’s giants like Uniswap. A valuation of this magnitude could see the AERO token price push into the $9.00 to $18.00 range, even during a post-bull run consolidation period.

    Simple Valuation Back-of-the-Envelope

    Let’s try a simple valuation based on TVL, a common metric for DeFi protocols. The key is the ratio of Market Cap to TVL. A 1:1 ratio is often seen as fair, while a higher ratio suggests bullish sentiment.

    Assumptions for 2027:

    • Future Circulating Supply: Let’s conservatively estimate the circulating supply grows to around 1 billion AERO due to emissions.
    • Market Cap to TVL Ratio: We’ll use a range from 0.8x (Bear) to 1.5x (Bull).

    Calculations:

    • Bear Case: Aerodrome’s TVL settles back to $1 billion in a bear market.
      • $1B TVL * 0.8 Ratio = $800M Market Cap.
      • $800M / 1B tokens = $0.80 per AERO.
    • Base Case: Aerodrome secures a strong TVL of $4 billion.
      • $4B TVL * 1.0 Ratio = $4B Market Cap.
      • $4B / 1B tokens = $4.00 per AERO.
    • Bull Case: Aerodrome becomes a powerhouse with $12 billion in TVL.
      • $12B TVL * 1.2 Ratio = $14.4B Market Cap.
      • $14.4B / 1B tokens = $14.40 per AERO.

    This simple model shows how the price scenarios align with the fundamental growth of the protocol’s core metric: its Total Value Locked.

    Risks & What to Watch

    Investing in AERO isn’t without risk. Here’s what to keep an eye on:

    • Competition: New DEXs could launch on Base and attempt to steal market share through “vampire attacks” or more innovative models.
    • Smart Contract Risk: Like any DeFi protocol, Aerodrome is subject to the risk of hacks or undiscovered bugs.
    • Base Ecosystem Health: Monitor key metrics for Base itself, such as daily active users, transaction counts, and developer activity. A decline here is a red flag for AERO.
    • Token Emissions: Keep an eye on the AERO emissions schedule. High inflation without corresponding growth in TVL and fee revenue can put downward pressure on the price.

    Conclusion

    Aerodrome Finance represents a high-leverage bet on the success of the Base blockchain. Its proven tokenomics, experienced team, and first-mover advantage position it for significant growth. By 2027, AERO could either be a case study of fading hype or a foundational piece of the DeFi landscape, depending entirely on the long-term adoption of its underlying ecosystem.

    For potential investors, the path forward involves closely monitoring the growth of Base and the TVL within Aerodrome. If the protocol continues to attract liquidity and generate real yield for its holders, its future looks very bright.

    Frequently Asked Questions (FAQ)

    Is Aerodrome Finance a good investment?
    Aerodrome has strong potential due to its position as the leading DEX on the rapidly growing Base network. However, its success is tied to Base’s adoption, and it faces risks like competition and general market volatility. Like any crypto asset, it should be considered a high-risk, high-reward investment.

    What will AERO be worth in 2025?
    2025 is expected to be the peak of the next crypto bull market. If the Base narrative remains strong, it’s plausible for AERO to see significant price discovery, potentially reaching the $5 to $12 range or higher, depending on overall market euphoria and TVL growth. This is highly speculative.

    How does Aerodrome Finance make money?
    The protocol generates revenue from a small fee charged on every token swap conducted through its liquidity pools. These fees are then distributed entirely to veAERO holders who vote on the pools, creating a direct incentive to lock AERO and participate in governance.

    Who is behind Aerodrome Finance?
    Aerodrome was launched by the same team that created Velodrome Finance, the top DEX on the Optimism network. This team has a proven track record of successfully building and managing a ve(3,3) DEX, which adds a layer of credibility to the project.

    Not financial advice. Do your own research.
    Solana (SOL) Price Prediction for 2028

    0

    Trying to make a Solana (SOL) price prediction for 2028 is a bit like forecasting the weather years in advance. We can look at the patterns, understand the climate, and make an educated guess, but unexpected storms can always roll in. Solana has cemented itself as a top contender in the blockchain space, known for its lightning-fast speed and low transaction costs. But what does the future hold?

    This article will break down the potential future for Solana, looking at its current market position, the technology driving it, and several possible scenarios for its price in 2028. We will analyze the fundamentals, the narratives, and the risks to give you a comprehensive overview. Remember, this is for informational purposes only and should not be considered financial advice.

    TL;DR: Quick Forecast for Solana in 2028

    • Bull Case: Solana could trade between $800 – $1,200 if it achieves mass adoption for consumer applications, successfully implements upgrades like Firedancer, and the overall crypto market enters a strong bull cycle.
    • Base Case: A more conservative estimate places SOL in the $400 – $600 range. This assumes it maintains its market share, sees steady ecosystem growth, and the crypto market grows at a moderate pace.
    • Bear Case: The price could fall below $100 if Solana suffers from renewed network instability, loses significant market share to competitors like Ethereum Layer 2s, or if a prolonged crypto winter takes hold.
    • Key Drivers: Watch for developer activity, daily active user growth, the success of the DePIN narrative, and overall network performance.

    What is Solana (SOL)? A Quick Refresher

    Solana is a high-performance blockchain designed for scalability. Think of it as a superhighway compared to a city street. It was built to support decentralized applications (dApps) and crypto projects that require incredibly high transaction speeds without sacrificing affordability.

    Its unique consensus mechanism, a combination of Proof-of-Stake and a novel concept called Proof-of-History, allows it to process tens of thousands of transactions per second. This has made it a popular home for everything from meme coins and NFT projects to complex decentralized finance (DeFi) platforms and, more recently, a burgeoning ecosystem of decentralized physical infrastructure networks (DePIN).

    Current Market Conditions

    To understand where Solana might go, we first need to see where it stands today. Based on the latest metrics, Solana is a major player with significant market activity.

    • Price and Market Cap: At a price of $183.4 and a market capitalization of over $99 billion, SOL is firmly established as a top-tier crypto asset. This valuation reflects strong investor confidence in its long-term potential.
    • Volume and Volatility: A 24-hour trading volume of over $5.5 billion shows that there is deep liquidity and high interest in SOL. However, the recent price action tells a mixed story. While it’s up over 2% for the week and 4% for the month, the 5.6% drop in the last 24 hours indicates short-term selling pressure. This kind of volatility is normal in crypto, often driven by profit-taking after a run-up or reactions to broader market trends. The current state suggests a market in consolidation, building a foundation after a period of positive momentum.

    On-Chain & Narrative Drivers for Growth

    Price is just one part of the story. The real long-term value of a blockchain is driven by its usage and the narratives that attract developers and users.

    Solana’s on-chain activity has exploded in the last year. The number of daily active users and transactions has surged, largely fueled by the meme coin frenzy and the growth of user-friendly applications. This isn’t just speculation; it’s a sign that real people are using the network, which is a powerful indicator of product-market fit.

    Beyond the metrics, two key narratives are pushing Solana forward. The first is DePIN, where projects use crypto incentives to build real-world infrastructure like wireless networks (Helium) or GPU rendering farms (Render). Solana’s speed and low cost make it the ideal platform for such high-transaction projects. The second is its focus on becoming the go-to blockchain for consumer-facing applications, including payments and mobile experiences. If Solana can become the backend for apps that feel as seamless as traditional web applications, it could unlock a massive new wave of users.

    Solana (SOL) Price Prediction: Three Scenarios for 2028

    Forecasting four years out requires us to think in terms of broad scenarios rather than exact numbers. Here is a Solana (SOL) price prediction broken down into three distinct possibilities, complete with the technical and fundamental rationale behind each.

    The Bear Case: A Fall to the $50 – $120 Range

    In a bearish scenario, several factors could work against Solana. The primary risk is a failure to permanently solve its historical network stability issues. Even with upgrades like Firedancer on the horizon, any significant outage could shatter investor confidence. Intense competition from ever-cheaper and faster Ethereum Layer 2 solutions could also erode its user base, siphoning away developers and capital.

    Technically, a bear market would see SOL break below critical support levels, particularly the psychological support at $100. If the broader crypto market enters a prolonged downturn similar to 2018 or 2022, even fundamentally strong projects can see their valuations drop by 80-90% from their peaks. In this world, SOL would struggle to regain momentum and would likely trade based on the whims of the wider market.

    The Base Case: A Steady Climb to $400 – $600

    This is the most pragmatic scenario, assuming Solana continues on its current path. In this future, the Firedancer upgrade is successfully implemented, dramatically improving network reliability and capacity. The DePIN and consumer app narratives mature from concepts into fully-fledged ecosystems with real-world revenue and adoption.

    From a technical perspective, this scenario would involve Solana decisively breaking its previous all-time high of around $260 and turning that level into a new floor of support. From there, price discovery would begin. Using Fibonacci extension levels from the previous major market cycle, a 1.618 or 2.618 extension is a common target in a healthy bull market, placing the price squarely in the $400 to $600 range. This represents steady, sustainable growth without the parabolic hype of a market top.

    The Bull Case: A Parabolic Rise to $800 – $1,200+

    The bull case is a world where everything goes right for Solana. It not only solves its technical challenges but also becomes the undisputed leader for several key blockchain use cases. Imagine a future where Solana Pay is integrated into mainstream payment apps, and top mobile games are built on its network. In this scenario, Solana isn’t just an “Ethereum killer”; it’s a parallel financial and consumer technology stack that has onboarded hundreds of millions of users.

    This level of adoption would be reflected in a massive market cap expansion. Technically, this would push the price into higher Fibonacci extension targets like the 3.618 or 4.236 levels, which often get tested during periods of market euphoria. Reaching a price of $1,000 would imply a market cap of over $600 billion (assuming future supply increases), making it one of the most valuable digital assets in the world.

    A Simple Valuation Back-of-the-Envelope

    Let’s try a simple model to ground these predictions. This is not a guarantee, but a way to think about valuation.

    1. Total Crypto Market Cap in 2028: Let’s assume the entire crypto market grows to a conservative $8 trillion by 2028.
    2. Solana’s Market Dominance: Let’s assume Solana solidifies its position and captures 6% of the total market.
    3. Resulting SOL Market Cap: 6% of $8 trillion is $480 billion.
    4. SOL Circulating Supply in 2028: With its inflation schedule, Solana’s circulating supply might be around 600 million SOL by 2028.
    5. Implied Price: $480 billion / 600 million SOL = $800 per SOL.

    This simple model shows that a price in the high hundreds is mathematically plausible under a bullish but not outrageous set of assumptions about the growth of the overall crypto market and Solana’s place within it.

    Risks & What to Watch

    Investing in Solana is not without risk. Here are the key things to keep an eye on between now and 2028:

    • Network Performance: The single most important factor. The successful rollout and adoption of the Firedancer client is non-negotiable for long-term success.
    • Competition: The race for scalability is fierce. Track the progress of Ethereum Layer 2s like Arbitrum and Optimism, as well as other high-performance blockchains.
    • Developer Mindshare: A blockchain is nothing without its builders. Watch for signs of developer activity moving to or away from Solana’s ecosystem.
    • Regulation: Unfavorable regulatory changes in major jurisdictions could impact the entire crypto market, including Solana.

    Conclusion and Next Steps

    Solana has a clear path to becoming a dominant force in the blockchain industry. Its focus on speed, low cost, and a seamless user experience gives it a powerful edge in the race for mass adoption. However, its journey is filled with challenges, from technical hurdles to intense competition.

    For investors, the key is to look past the daily price fluctuations and focus on the fundamental drivers of growth: user adoption, developer activity, and network health. If Solana can continue to execute on its vision, its price in 2028 could make today’s levels look like a bargain. But if it stumbles, the risks are just as significant. The next step is to continue learning about the projects building on Solana and to monitor its progress against its competitors.

    Frequently Asked Questions (FAQ)

    Can Solana (SOL) realistically reach $1,000?
    Yes, it is possible within a very bullish scenario. As our valuation model showed, if the total crypto market cap expands significantly and Solana captures a meaningful share of it (around 5-6%), a price of $800 to $1,000 is mathematically achievable. This would require near-perfect execution and a very favorable market environment.

    What is the biggest risk to a long-term Solana investment?
    The biggest risk remains twofold: technical reliability and competition. While Solana has improved dramatically, any future major network outage would severely damage its reputation. Simultaneously, Ethereum’s Layer 2 ecosystem is growing rapidly and could potentially offer a similar user experience with the added security and decentralization of Ethereum.

    Is Solana a good investment for 2028?
    Solana is a high-risk, high-reward asset. Its potential upside is substantial if it can achieve its goals of becoming a foundational layer for consumer finance and applications. However, it is also a volatile asset in a competitive market. Whether it is a “good” investment depends entirely on your personal risk tolerance and belief in its long-term vision.

    How does Solana’s technology compare to Ethereum’s?
    Solana uses a monolithic architecture, meaning it does everything on a single, ultra-fast main chain. This leads to very low fees and high speed but can create challenges for decentralization. Ethereum is pursuing a modular approach with Layer 2s, where transactions are processed on separate chains and secured by the main Ethereum network. This may offer better long-term decentralization and security, but the user experience can be more fragmented.

    Not financial advice. Do your own research.

    Bitcoin (BTC) Price Prediction for 2028

    0

    Trying to create a Bitcoin (BTC) Price Prediction for a date years in the future is a bit like forecasting the weather for a specific afternoon in four years—we can use historical patterns and fundamental drivers to make an educated guess, but a lot can change. Still, by analyzing Bitcoin’s core principles and the market landscape, we can build a logical framework for what to expect by 2028.

    This article explores potential scenarios for Bitcoin’s price in 2028. We’ll look at the current market, fundamental drivers, and potential risks to give you a comprehensive picture. This is for informational purposes only and is not a crystal ball.

    TL;DR: Bitcoin Price in 2028

    • Base Case Prediction: Our base scenario places Bitcoin in the $180,000 to $250,000 range, driven by the 2028 halving event and continued institutional adoption.
    • Key Drivers: The primary catalysts for this growth are Bitcoin’s programmed supply reduction (the halving), increasing integration into the traditional finance system via products like ETFs, and its growing narrative as a “digital gold” or inflation hedge.
    • Bullish Scenario: A more aggressive bull case could see BTC push towards $350,000 to $500,000, fueled by major sovereign or corporate adoption and a highly favorable macroeconomic environment.
    • Major Risks: The biggest threats to Bitcoin’s price are harsh, coordinated global regulations, a prolonged global recession that dampens investor risk appetite, or an unforeseen technological flaw.

    What is Bitcoin? A Quick Refresher

    Before we look forward, let’s quickly glance back. Bitcoin is the world’s first decentralized digital currency, created in 2009 by the anonymous entity Satoshi Nakamoto. It operates on a technology called blockchain, a public ledger that records all transactions.

    What makes Bitcoin unique is its scarcity. There will only ever be 21 million BTC created. This fixed supply is the foundation of its value proposition as “digital gold”—a store of value that cannot be inflated or controlled by any central bank or government. This core principle is essential for any long-term price prediction.

    Current Market Conditions

    As of today, Bitcoin is trading at $115,518. This gives it a massive market capitalization of approximately $2.3 trillion, placing it among the world’s most valuable assets. Over the last 24 hours, trading volume sits around a healthy $39 billion.

    However, the short-term price action tells a story of consolidation. While the hourly change is a minor 0.4% gain, the price is down 2.2% over the past day and 4.6% over the last week. This suggests the market is taking a breather after a significant run-up. A price above $100,000 indicates that major bullish catalysts, such as the approval of spot ETFs, have already played out successfully, and the market is now searching for its next major narrative.

    On-Chain & Narrative Drivers for 2028

    We don’t have a crystal ball, but we do have powerful data points and narratives that will almost certainly shape Bitcoin’s journey to 2028. Lacking specific on-chain data for this analysis, we can reason cautiously based on established fundamentals.

    The most important driver is the Bitcoin Halving. Roughly every four years, the reward for mining new Bitcoin is cut in half. The next halving is scheduled for 2028. Historically, halvings create a supply shock that precedes a major bull run. The price action in 2028 will be heavily influenced by anticipation of this event and the subsequent supply squeeze.

    Another key factor is institutional and sovereign adoption. Spot Bitcoin ETFs have already paved the way for traditional capital to flow into the asset. By 2028, we could see the next evolution of this trend: pension funds, corporate treasuries, and even sovereign wealth funds making strategic allocations to Bitcoin as a reserve asset. This would represent a monumental influx of new, stable capital.

    Bitcoin (BTC) Price Prediction: Scenarios for 2028

    Based on these drivers, we can outline three potential scenarios for Bitcoin’s price in 2028. Remember, 2028 is a halving year, so prices could be volatile, potentially starting the year lower and ending it higher as the bull market kicks in.

    Bear Case: $70,000 – $120,000

    In a bearish scenario, Bitcoin fails to gain significant new momentum and revisits its prior cycle highs. This could be caused by a severe global recession that forces investors out of risk assets, or a coordinated and restrictive regulatory crackdown by major governments like the U.S. and E.U.

    Under this outlook, the 2028 halving narrative would be muted by overwhelming macroeconomic headwinds. Institutional inflows would stagnate, and retail interest would wane. In this world, Bitcoin survives but struggles to find its next gear, essentially moving sideways in a very wide range.

    Base Case: $180,000 – $250,000

    This is the most probable scenario, where existing trends continue along their expected path. The 2028 halving acts as a powerful catalyst, just as previous halvings have. The resulting supply shock, combined with steady demand from institutional and retail investors, pushes the price to a new all-time high.

    In this scenario, Bitcoin solidifies its role as “digital gold” and a legitimate alternative asset class within traditional portfolios. Regulation becomes clearer but not punitive, providing a stable runway for growth. The price action would reflect a maturing asset with diminishing, yet still powerful, four-year cycle returns.

    Bull Case: $350,000 – $500,000+

    The bull case sees an acceleration of all positive drivers. This scenario would likely involve one or more “hyper-adoption” events. For example, a major sovereign wealth fund or a G20 nation could announce a significant Bitcoin allocation for its reserves, triggering a global rush.

    Furthermore, if global inflation remains stubbornly high or fiat currencies show signs of instability, Bitcoin’s value proposition as a non-sovereign store of value would shine. In this world, the 2028 halving supply shock meets an unprecedented demand shock, sending the price into the high six figures.

    A Simple Valuation Model (Back-of-the-Envelope)

    How can we ground these numbers in reality? One popular method is to compare Bitcoin’s market cap to gold’s, as they share a similar “store of value” thesis.

    • Assumption 1: Gold’s total market cap, currently around $16 trillion, grows to roughly $18 trillion by 2028.
    • Assumption 2: Bitcoin’s circulating supply will be approximately 20.5 million by 2028.
    • Assumption 3: Bitcoin continues to eat into gold’s market share as the preferred “digital gold.”

    If Bitcoin captures just 25% of gold’s projected 2028 market cap, its own market cap would be $4.5 trillion.

    Calculation: $4,500,000,000,000 / 20,500,000 BTC = ~$219,500 per BTC.

    This simple model lands squarely in our base case scenario, providing a logical foundation for a price target in the low $200,00s.

    Risks & What to Watch

    No investment is without risk, and Bitcoin is no exception. The path to 2028 will be volatile.

    • Regulation: This remains the single biggest unknown. A coordinated global effort to stifle Bitcoin could severely impact its price. Conversely, clear and supportive regulation could be a massive catalyst.
    • Macroeconomic Environment: As a risk asset, Bitcoin is sensitive to global liquidity. A prolonged period of high interest rates and tight financial conditions would be a major headwind.
    • Competition & Technology: While Bitcoin is the undisputed leader, the crypto space is always evolving. Keep an eye on technological developments, including the theoretical threat of quantum computing and the health of the Bitcoin network itself.

    Conclusion: The Road to 2028

    Predicting a precise price for Bitcoin in 2028 is impossible, but building a framework based on its fundamental properties is not. The 2028 halving is the most significant event on the horizon, providing a predictable supply shock that has historically driven bull markets.

    The key variable will be demand. If institutional and retail adoption continues its current trajectory, our base case of $180,000 – $250,000 seems like a reasonable expectation. As an investor, the best next step is not to fixate on a single number, but to understand these drivers and build a strategy that aligns with your own risk tolerance and long-term goals.

    Frequently Asked Questions (FAQ)

    1. How does the 2028 Bitcoin halving affect the price?
    The halving cuts the new supply of Bitcoin in half. Assuming demand stays the same or increases, this reduction in supply (a “supply shock”) puts upward pressure on the price. Historically, the 12-18 months following a halving have been a period of significant price appreciation for Bitcoin.

    2. Is it too late to invest in Bitcoin?
    Many investors felt it was “too late” when Bitcoin first hit $1,000, then $10,000, and again at $100,000. While the days of 1000x returns are likely over, if Bitcoin continues on its adoption curve and captures a larger share of the global store of value market (like gold), there is still significant upside potential from current levels.

    3. What is the biggest risk to this Bitcoin (BTC) price prediction?
    The most significant risk is systemic regulatory action. If major economic powers decide to severely restrict or ban the use and trading of Bitcoin, it would undermine institutional confidence and accessibility, creating a major headwind against any bullish thesis.

    4. Could Bitcoin reach $1 million by 2028?
    While not impossible, reaching $1 million per BTC by 2028 would require a “perfect storm” of hyper-bullish catalysts. This would mean Bitcoin capturing over 60% of gold’s entire market cap in just four years, alongside massive sovereign adoption and a flight from fiat currencies. It falls well outside of our base and even bull case scenarios.

    Not financial advice. Do your own research.

    Chainlink (LINK) Price Prediction for 2027

    0

    Trying to map out a Chainlink (LINK) price prediction for 2027 feels a bit like forecasting the weather years in advance. While we can’t know for sure, we can analyze the fundamental drivers, market trends, and potential scenarios to build an informed perspective. Chainlink isn’t just another crypto; it’s a critical piece of infrastructure aiming to connect blockchains to real-world data, and its future price will depend heavily on its success in becoming the go-to standard for this.

    This article breaks down the factors that could influence LINK’s price by 2027. We’ll look at its current standing, future potential, and the risks involved, giving you a comprehensive framework for your own research.

    TL;DR: Quick Forecast

    • Current Momentum is Strong: LINK shows significant strength with a 30-day price increase of over 39%, indicating strong buying interest and positive market sentiment.
    • Fundamental Growth is Key: Chainlink’s value is tied to its adoption as a core piece of Web3 infrastructure. Its success with the Cross-Chain Interoperability Protocol (CCIP) and in the Real World Asset (RWA) sector will be major price catalysts.
    • Base Case Prediction for 2027: $50 – $100: Assuming a healthy crypto market cycle and continued adoption, LINK could realistically reclaim its previous all-time high and establish a new price range.
    • Bull & Bear Scenarios Exist: In a widespread crypto bull market fueled by RWA and CCIP dominance, prices could push towards $150+. Conversely, a prolonged bear market or failure to execute could see prices fall back to the $10 – $25 support range.
    • This is Not a Guarantee: All predictions are speculative. This analysis is for informational purposes only and should not be considered financial advice.

    Before diving into predictions, let’s have a quick refresher. Chainlink is a decentralized “oracle” network. In simple terms, blockchains are great at managing assets on their own network, but they can’t access outside information on their own. They can’t check the weather, the price of a stock, or the winner of a sports game.

    Chainlink solves this. It acts as a secure bridge between blockchains and real-world data sources, APIs, and payment systems. This is a crucial service that enables more advanced smart contracts, from decentralized finance (DeFi) protocols that need accurate price feeds to insurance contracts that pay out based on real-world events. The LINK token is used to pay for these oracle services, creating a direct link between the token’s value and the network’s utility.

    Current Market Conditions

    As of this writing, LINK is trading around $24.89 with a market cap of approximately $16.87 billion. The recent price action paints a very bullish picture. A 7-day gain of over 13% and a 30-day gain of over 39% show powerful upward momentum. This isn’t just a slow drift up; it’s a decisive move backed by significant interest.

    The 24-hour trading volume of over $3.15 billion is also very healthy. The volume-to-market-cap ratio is nearly 19%, which suggests high liquidity and strong trader participation. This kind of activity often precedes or confirms significant price moves. While the short-term 1-hour chart shows a minor pullback, the broader trend remains firmly positive, suggesting that buyers are currently in control and absorbing any small dips.

    On-Chain & Narrative Drivers

    Beyond the daily charts, Chainlink’s long-term value is driven by its underlying fundamentals and the narratives it’s a part of. We don’t need a crystal ball to see that Chainlink is positioning itself at the center of two of the biggest potential growth areas in crypto.

    First is the Cross-Chain Interoperability Protocol (CCIP). This technology aims to be a universal standard for sending data and value between different blockchains, much like TCP/IP is for the internet. If CCIP becomes the go-to solution for banks and institutions to interact with various blockchains, the demand for Chainlink’s services—and by extension, the LINK token—could be enormous.

    Second is the Real World Asset (RWA) narrative. This involves tokenizing traditional assets like real estate, stocks, and bonds and bringing them onto the blockchain. For this to work, you need reliable, real-time price data from the real world. Chainlink is the undisputed leader in providing these price feeds. As major financial institutions like BlackRock and Franklin Templeton explore tokenization, Chainlink stands to be a primary beneficiary of this multi-trillion-dollar market shift.

    Chainlink (LINK) Price Prediction Scenarios for 2027

    Forecasting three years out requires us to think in scenarios, not certainties. The price of LINK in 2027 will largely depend on the overall health of the crypto market and Chainlink’s ability to execute its vision.

    Bear Case: $10 – $25

    In a bearish scenario, the crypto market could enter another prolonged downturn or a “crypto winter.” This would suppress the valuations of all assets, including fundamentally strong ones like LINK. Other factors could include a major competitor like Pyth Network gaining significant market share, a slowdown in CCIP adoption, or a major security vulnerability in the Chainlink network.

    From a technical perspective, a failure to break and hold above the key $25-$30 resistance zone could lead to a retest of lower support levels. In this scenario, LINK could find itself trading back in its previous consolidation range, with strong support found between $10 and $15.

    Base Case: $50 – $100

    This is the most probable scenario, assuming the crypto market experiences another bull cycle between now and 2027. In this case, Chainlink continues its steady growth, CCIP sees meaningful adoption from both crypto-native projects and traditional finance, and the RWA narrative continues to build. LINK’s network effect solidifies its position as the dominant oracle provider.

    Technically, this scenario involves LINK decisively breaking its previous all-time high of around $52. Once an asset breaks its old high, it enters a phase of “price discovery.” A conservative target would be a 2x from its previous high, placing it in the $100 range. This would value the network between approximately $60-$70 billion, a reasonable valuation for critical market infrastructure during a bull run.

    Bull Case: $150 – $250+

    The bull case is a blue-sky scenario where everything goes right. The next crypto bull market is larger than the last, fueled by institutional adoption and the explosion of RWA tokenization. Chainlink’s CCIP becomes the undisputed industry standard for cross-chain communication, integrated by major banks and financial systems.

    In this world, Chainlink is no longer just a crypto project; it’s seen as fundamental internet infrastructure for a new financial system. Valuations would likely detach from previous norms. A market cap of $150 billion or more wouldn’t be out of the question, which, depending on the token supply in 2027, could place the LINK price well above $200. This is a high-end estimate, but it’s grounded in the sheer size of the markets Chainlink aims to serve.

    A Simple Valuation Back-of-the-Envelope

    Let’s try a simple valuation exercise. It’s not precise, but it helps frame the potential.

    Major institutions like BlackRock and Citi have predicted the RWA market could reach $10 trillion by 2030. Let’s be conservative and say it’s $5 trillion by 2027.

    1. Assumption 1: Chainlink is a critical infrastructure for 10% of this RWA market. That means it helps secure or price $500 billion worth of assets.
    2. Assumption 2: The Chainlink network is valued at 2% of the total value it helps enable. This is a common way to value utility networks.
    3. Calculation: 2% of $500 billion is a $10 billion market cap.

    Wait, that’s lower than today’s market cap. This shows the market is already pricing in a lot of future growth. So let’s adjust our assumptions for a bull case.

    1. Assumption 1 (Bullish): Chainlink’s CCIP and data feeds become integral to 20% of the $5 trillion RWA market, enabling $1 trillion in value.
    2. Assumption 2 (Bullish): During a bull market, the network is valued at a premium, say 15% of the value it enables.
    3. Calculation: 15% of $1 trillion is a $150 billion market cap.
    4. Price: Assuming a circulating supply of around 650 million LINK by 2027, a $150 billion market cap would translate to a price of ~$230 per LINK.

    This simple model shows how powerful the RWA and CCIP narratives are. The final price depends entirely on which assumptions you believe are most realistic.

    Risks & What to Watch

    Investing in LINK is not without risks. Here’s what to keep an eye on:

    • Competition: Oracle services are a competitive space. Projects like Pyth Network and Band Protocol are also vying for market share. Watch their progress and partnership announcements.
    • Tokenomics: A significant portion of the LINK supply is not yet in circulation. The rate at which new tokens are released to the market could create selling pressure and dilute the price if demand doesn’t keep pace.
    • Market Dependency: Chainlink’s success is ultimately tied to the health of the broader crypto and blockchain ecosystem. A prolonged bear market will negatively impact LINK, regardless of its own progress.
    • Execution Risk: The vision for CCIP and RWA dominance is ambitious. Chainlink must continue to execute flawlessly on its technical roadmap to realize this potential.

    Conclusion and Next Steps

    Chainlink holds a unique and vital position in the digital asset world. It’s less of a bet on a single application and more of a bet on the growth of the entire multi-chain ecosystem. Its future price will be a reflection of its success in becoming the indispensable data and interoperability layer for Web3.

    The path to 2027 is long, and the crypto market is famously volatile. While the base case of $50-$100 seems plausible given current trends, investors should be prepared for both the bearish and bullish scenarios. The next steps for any potential investor are to look beyond the price charts and dig into the fundamentals. Follow their partnership announcements, track CCIP adoption, and understand the role they play in the growing RWA space.

    FAQ

    What is a realistic Chainlink (LINK) price prediction for 2027?
    A realistic base case prediction for LINK in 2027 is between $50 and $100. This assumes continued adoption of its services and a generally positive crypto market cycle, allowing it to surpass its previous all-time high.

    Can Chainlink reach $1000?
    For LINK to reach $1000, its market cap would need to be around $600-$700 billion, depending on the circulating supply at the time. This would make it larger than Ethereum’s market cap today. While never impossible in crypto, this is an extremely optimistic target that would require Chainlink to become a core pillar of the global financial system.

    Is Chainlink a good long-term investment?
    Chainlink’s fundamental role as a provider of essential infrastructure gives it a strong long-term value proposition. Unlike many crypto projects that rely on hype, Chainlink provides a tangible, in-demand service. However, like any investment, it carries risks and its success is not guaranteed.

    Who are Chainlink’s main competitors?
    Chainlink’s main competitors in the oracle space include Pyth Network, which focuses on high-frequency financial data, and Band Protocol. While Chainlink currently has a significant lead in market share and integrations, the space remains competitive.

    Not financial advice. Do your own research.
    Aerodrome Finance (AERO) Price Prediction for 2028

    0

    Navigating the crypto market can feel like charting a new world. One of the most talked-about projects recently is Aerodrome Finance (AERO), the leading liquidity hub on the Base blockchain. As investors look toward the next market cycle, many are asking: what could AERO be worth by 2028?

    This article provides a detailed Aerodrome Finance price prediction for 2028, analyzing its fundamentals, market position, and potential growth trajectories. We’ll break down the bull, bear, and base cases to give you a comprehensive overview.

    TL;DR: Aerodrome (AERO) Price Prediction 2028

    • Bear Case: If the Base ecosystem stagnates and a crypto winter sets in, AERO could struggle to maintain momentum, potentially trading in the $0.75 to $2.00 range.
    • Base Case: With steady growth in the Base ecosystem and a healthy crypto bull market, AERO could solidify its position as a key DEX, reaching a price of $6.00 to $12.00.
    • Bull Case: If Base achieves mass adoption through its Coinbase integration and Aerodrome becomes a dominant player in DeFi, AERO could see exponential growth, potentially targeting $18.00 to $30.00+.
    • Key Driver: AERO’s long-term value is fundamentally tied to the success and adoption of the Base layer-2 network.

    What is Aerodrome Finance (AERO)?

    Before diving into predictions, let’s have a quick refresher. Aerodrome Finance is an automated market maker (AMM) and liquidity protocol on Base, a layer-2 scaling solution for Ethereum built by Coinbase. Think of it as the central trading and liquidity hub for the entire Base ecosystem.

    It uses a powerful tokenomics model known as “ve(3,3)” which was pioneered by Velodrome on the Optimism network. In simple terms, users can lock their AERO tokens to receive veAERO (vote-escrowed AERO). These veAERO tokens give them governance rights and, more importantly, the power to direct AERO token emissions to specific liquidity pools. Projects then bribe veAERO holders to vote for their pools, creating a competitive and dynamic system that drives value back to long-term token holders. This mechanism is designed to attract and retain deep liquidity, which is the lifeblood of any decentralized exchange.

    Current Market Conditions

    Let’s analyze the live metrics to understand where AERO stands today. With a current price of $1.34 and a market cap of over $1.17 billion, AERO is no longer a small, under-the-radar project. It has firmly established itself as a major player in the DeFi space.

    The 24-hour trading volume is a healthy $141 million. A simple way to gauge market interest is the Volume to Market Cap ratio, which here is around 0.12. Anything over 0.10 generally suggests robust and sustained trading activity. The price action tells an interesting story: while down slightly in the last hour and 24 hours ( -1.1% and -6.2% respectively), it shows significant strength over longer timeframes with 10.2% gains in the last week and a massive 50.5% gain over the last 30 days. This pattern often indicates a period of healthy consolidation after a strong upward trend, where the market digests recent gains before its next move.

    On-Chain & Narrative Drivers

    AERO’s future isn’t just about its own technology; it’s deeply connected to broader market narratives. The most powerful driver is the growth of the Base ecosystem. As a layer-2 incubated by Coinbase, Base has a unique advantage: direct access to Coinbase’s massive user base of over 100 million people. This creates a powerful funnel to bring retail users on-chain, and Aerodrome is positioned as the primary destination for their trading activity.

    While we don’t have deep, real-time on-chain data in this analysis, the key metrics to watch are Total Value Locked (TVL), daily trading volume, and the number of veAERO lockers. An increasing TVL shows that more capital is flowing into the ecosystem and trusting Aerodrome with its assets. A rising number of veAERO lockers indicates that more participants are committed to the protocol’s long-term success. If these metrics continue to trend upward, it serves as a strong fundamental validation of AERO’s value proposition.

    Scenarios for 2028

    Predicting prices four years out is speculative, but we can build logical scenarios based on market cycles and fundamentals. By 2028, we will be past the next Bitcoin halving, and the market will likely have experienced another full bull and bear cycle.

    Bear Case: $0.75 – $2.00

    In a bearish scenario, the Base ecosystem fails to capture significant market share from competitors like Arbitrum, Optimism, or new layer-2s. The “Coinbase-effect” narrative fades, and user growth stalls. Furthermore, if the overall crypto market enters a prolonged bear phase, DeFi yields could compress, making protocols like Aerodrome less attractive. In this environment, AERO’s utility would diminish, and its price could fall back towards its early 2024 support levels, finding a floor somewhere between $0.75 and $2.00.

    Base Case: $6.00 – $12.00

    This is the most probable scenario in our view. Here, the Base ecosystem continues its steady growth, becoming one of the top 3 layer-2 networks by activity and TVL. Aerodrome maintains its dominant position as the go-to DEX on Base. The next crypto bull market, expected between 2025-2026, propels DeFi valuations to new highs. AERO, as a blue-chip asset on a thriving chain, would likely see its market cap grow 5-10x from current levels. This would place its price firmly in the $6.00 to $12.00 range, assuming a moderate increase in token supply due to emissions.

    Bull Case: $18.00 – $30.00+

    The bull case is where things get exciting. In this scenario, Base doesn’t just succeed; it becomes the leading consumer-facing blockchain, onboarding tens of millions of new users directly from Coinbase. This “on-chain summer” narrative plays out in full. Aerodrome, as the central liquidity engine, processes tens of billions in daily volume and generates substantial protocol revenue. Its market cap could rival that of today’s largest DeFi protocols like Uniswap during its peak. A valuation of $20-30 billion would not be out of the question, potentially pushing the AERO price to $18.00 to $30.00, or even higher depending on tokenomics and market euphoria.

    Simple Valuation Back-of-the-Envelope

    Let’s try a simple model to ground our base case. This is not a precise science, but it helps frame the potential.

    1. Assumption 1: Base Ecosystem TVL. In a mature 2028 bull market, let’s assume the Base ecosystem’s Total Value Locked (TVL) reaches $60 billion. This would make it a dominant layer-2.
    2. Assumption 2: Aerodrome’s Market Share. We’ll assume Aerodrome, as the primary DEX, captures 25% of that TVL, which is $15 billion.
    3. Assumption 3: Market Cap to TVL Ratio. Historically, top-tier DEXs in a bull market trade at a Market Cap to TVL ratio between 0.3 and 0.6. Let’s use a conservative 0.4.
    4. Assumption 4: Circulating Supply. AERO has token emissions. By 2028, it’s reasonable to estimate the circulating supply could be around 1.2 billion AERO.

    Calculation: $15 billion (Aerodrome TVL) * 0.4 (MC/TVL Ratio) = $6 billion (Projected Market Cap).
    Then, $6 billion (Market Cap) / 1.2 billion (Circulating Supply) = $5.00 per AERO.

    This simple model lands on the lower end of our base case, suggesting our scenarios are within a reasonable spectrum of possibility.

    Risks & What to Watch

    Investing in AERO is not without risk. The biggest risk is its dependency on a single ecosystem. If Base fails, Aerodrome will likely fail with it. Other risks include smart contract vulnerabilities, intense competition from other DEXs that may launch on Base, and the ever-present threat of unfavorable crypto regulations.

    To stay ahead, keep a close eye on these key indicators:

    • Base Network Growth: Track metrics like daily active users, transactions, and overall TVL on Base.
    • Aerodrome’s Dominance: Monitor its TVL and volume relative to any competitors on Base.
    • veAERO Metrics: Watch the percentage of AERO being locked and the number of protocols participating in the “bribe” marketplace. This is a direct measure of the protocol’s health.
    • Broader Market Sentiment: AERO will not be immune to macro trends. The overall health of the crypto market, particularly Ethereum, will be a major factor.

    Conclusion

    Aerodrome Finance represents a high-conviction bet on the success of the Base ecosystem. Its innovative ve(3,3) tokenomics are designed to create a flywheel effect, attracting deep liquidity and rewarding long-term holders. While the journey to 2028 will undoubtedly be volatile, AERO’s position as the leading DEX on a Coinbase-backed L2 gives it a unique and powerful narrative.

    Whether it hits the bear, base, or bull target will depend on execution, market conditions, and the ultimate success of Base. For investors bullish on Coinbase’s on-chain strategy, AERO is arguably one of the best ways to gain exposure to that potential growth. The next step is to dig deeper into the metrics mentioned above and decide if the risk-reward profile aligns with your investment strategy.

    Frequently Asked Questions (FAQ)

    Is AERO a good long-term investment?
    It depends on your belief in the Base ecosystem and your personal risk tolerance. If you believe Base will become a major layer-2, AERO could be a strong long-term investment as it is positioned to grow alongside the network. However, its fate is tied to Base, making it a concentrated bet.

    What is the main price driver for Aerodrome (AERO)?
    The single most important driver for AERO’s price is the adoption and growth of the Base blockchain. As more users, capital, and projects come to Base, the demand for Aerodrome’s liquidity and trading services will increase, driving value to the AERO token.

    How does AERO compare to Uniswap?
    Aerodrome and Uniswap are both decentralized exchanges, but they operate on different models. Uniswap is a classic Automated Market Maker (AMM) available on many chains. Aerodrome uses a ve(3,3) model focused on incentivizing long-term liquidity providers on the Base network specifically. AERO’s model aims to solve the problem of “mercenary liquidity” that can challenge traditional AMMs.

    Could Aerodrome’s price reach $10?
    Yes, reaching $10 is plausible within our base case scenario for 2028, especially during the peak of a bull market. This would require continued growth in the Base ecosystem and positive sentiment across the broader crypto market.

    Not financial advice. Do your own research.