More
    Home Blog Page 65

    4 Ways You Can Use AI for Crypto Trading and Increase Profits by 40%

    0

    I stopped trusting my own instincts in trading.

    I know it sounds insane. Everyone in crypto says to “trust your gut” and “trade with conviction.” But my instincts were costing me money. I’d exit too early, hold too long, or ignore signals because I thought I knew better.

    And while I was busy second-guessing myself, AI-driven traders were quietly taking the wins I was missing.

    So I did something that felt counterintuitive. I started relying on AI instead of my gut. Not by handing full control over to some shady black-box bot, but by plugging AI into the parts of trading where humans consistently fall short: speed, execution, data collection and analysis, pattern recognition, security checks, and narrative tracking.

    That one shift changed everything. My profits jumped by around 40% over six months of live trading. I traded in the same markets, I used the same strategy. Everything was exactly the same except for this one difference: using AI to fill the gaps I couldn’t cover alone.

    In this article, I’ll show you how I actually use AI day-to-day, what worked, what didn’t, and how it directly boosted my results. More specifically, I’ll share the four ways I integrated AI into my crypto trading strategy.

    1. Auto-trading with AI Agents: Real Strategies, Real-Time Execution

    The first time I let an AI agent execute a trade for me, I was nervous. 

    I kept hovering over the screen, waiting for the slightest, most insignificant reason to cancel it, convinced it would make some dumb mistake. 

    What actually happened was the opposite: it caught a setup I would have missed completely. And even if I didn’t I wouldn’t have gone for it.

    Here’s the problem with manual trading: you can only stare at and analyze so many charts at once.

    On busy days, I’d track maybe five or six pairs seriously, with another ten on the side. But when you’ve got hundreds of coins moving across Solana alone, that’s like trying to find one firework in the middle of a New Year’s Eve show. 

    By the time you notice the spark, it’s already exploded.

    I instructed my first auto-trading agent to handle exactly that. Instead of trying to watch everything myself, the AI scanned the entire market at once, looking for technical triggers I had defined: volume spikes, RSI breakouts, and sudden liquidity inflows. 

    I gave it varied, carefully crafted prompts based on multiple signals to try different trading strategies. When two or three of those signals lined up, it placed the trade automatically.

    The results were eye-opening. In one 30-day stretch, the agent executed 52 trades. Thirty-nine of them closed green, with an average gain of 11.8%. The most successful trade closed 65.31% in profit.
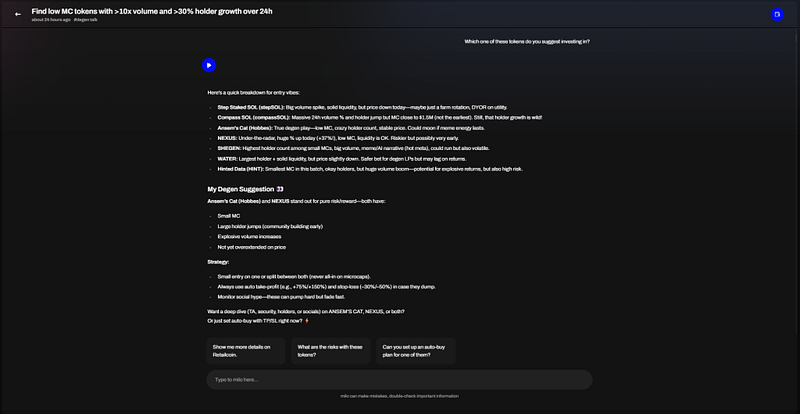
    That might sound modest, but here’s the thing: it was more active than what I ever could’ve been. In the same time it took me to research, analyze, and finally execute one trade, this agent had already closed dozens, with an unrealized gain of around 7%.

    My job shifted from “frantically scanning charts” to “checking what the AI surfaced, adjusting strategy and managing risk.”

    The real power here isn’t handing over your entire account and hoping for the best. It’s designing clear, rules-based strategies and letting the AI do what it does best: react instantly and execute without hesitation. 

    The AI agent I used is called Milo. It’s built on Solana, connects directly to your wallet, and is completely free to use. You can try it here.

    It doesn’t get tired, it doesn’t second-guess, and it doesn’t panic-sell because of one red candle (like I did).

    For me, auto-trading wasn’t about replacing myself as a trader. It was about removing the parts of trading I was bad at (speed, discipline, and consistency) and keeping the parts I’m good at, like judgment and risk management. 

    That balance is what turned AI from a scary experiment into a 24/7 assistant that actually makes me money.

    Important: AI agents can be a double-edge sword. If you use them right, they can make you incredible amounts of money. But if you don’t, they can make you lose everything in an instant. At the end of the day, success is all about finding the right prompt. After many experiments, I found 7 that always worked. You can steal them here: We Tried 50+ Crypto Trading Prompts on a Solana AI Agent — These 7 Delivered the Best Profits.

    2. Price Predictions Based on Real-Time Analysis

    Price prediction tools get a bad rap in crypto. Most people hear it and think of crystal-ball YouTube gurus claiming that Bitcoin will go to $1M next year or random bots posting lines on a chart. 

    That’s not what I’m talking about.

    What worked for me was using AI to navigate through massive amounts of historical and real-time data (stuff no human could realistically process) and then turning that into probabilities I could actually trade on.

    In other words: it’s data-driven predictions, based in unquantifiable amounts of on-chain and market data, processed, interpreted and analyzed in real-time by an AI system developed exclusively for this purpose. 

    That’s right. You shouldn’t use a general-purpose LLM like ChatGPT for this. That’s a terrible idea, because those systems generate responses based on language, not market analysis. This is different.

    Here’s an example: Pump Parade built an AI prediction model with access to an exhaustive set of data, including:

    • Market data (price action, liquidity, trading volume, market cap). 
    • On-chain data (amount of holders, tokenomics and supply, token distribution and concentration among wallets, etc.).
    • Social engagement metrics (social media presence and mentions, interaction spikes).

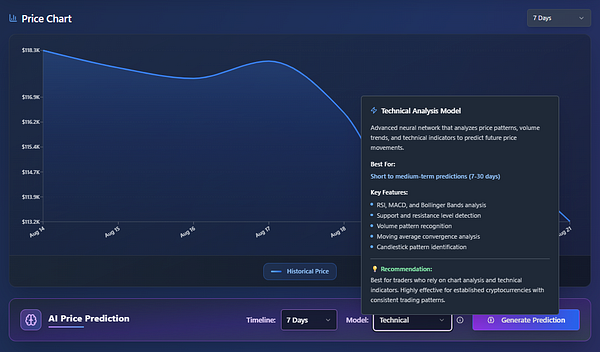
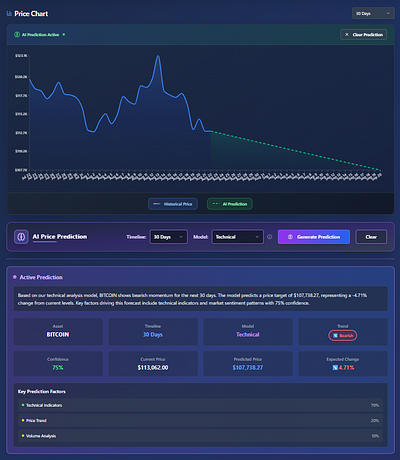
    It supports over 200 cryptocurrencies, and all you have to do is choose which one you want to create the prediction for, the model you want to use, and the time frame for the prediction. Within seconds, I generated hundreds of short-term forecasts that were right about 65–70% of the time. 
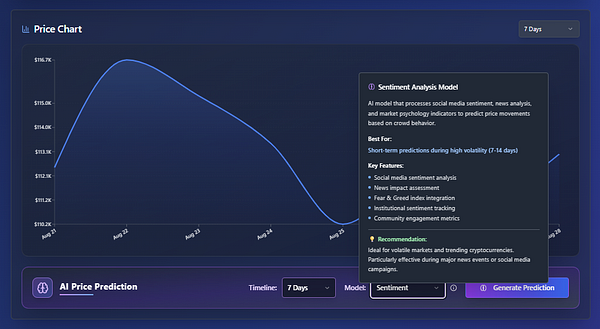
    I know that might not sound like a huge leap, but here’s the math: let’s say my own intuition could give me about 50% accuracy, basically coin-flip odds. That 15–20% difference from AI was enough to shift my results dramatically.

    However, the bigger advantage is that my 50% accuracy only works reliably on big cryptocurrencies: Bitcoin, Ethereum, maybe Solana. 

    The AI doesn’t have that limitation. It can apply the same predictive edge to smaller, low-cap tokens, where the potential gains are much higher. So, the real value comes not from making more accurate predictions, but from using them to spot opportunities no human brain could find.

    The key lesson: prediction models don’t have to be perfect. They just need to tilt the odds in your favor. 

    If you normally make money half the time, and suddenly you’re winning six or seven trades out of ten instead of five, the compounding effect is massive.

    Now, you shouldn’t treat these models as gospel, and you shouldn’t blindly follow every signal. What you should do is use them as a filter. 

    In other words, don’t see them as a magical crystal ball that can help you see the future, but as a data visualization and processing tool. If the AI’s outlook and my own analysis line up, that’s when I size in with confidence. It’s like having a second opinion from someone who can scan millions of data points instantly. Something our human brains could never do on their own.

    3. Wallet Tracking for Safety Checks and Opportunity Spotting

    Crypto can make you rich fast, but it can also wipe you out in seconds. I’ve learned this the hard way.

    Early on, I lost a painful chunk of capital because I didn’t notice a suspicious token contract before buying in. 

    It was a wake-up call: no matter how good your entries or predictions are, one bad rug pull or phishing scam can undo months of gains.

    Here’s the real problem: I’m not a developer or a programming expert. Back then, I didn’t know how to identify a faulty contract. I still don’t. 

    That’s where AI became a game-changer. I found a free AI agent that can monitor large wallets, unusual token movements or volume spikes, and contract changes in real time. 
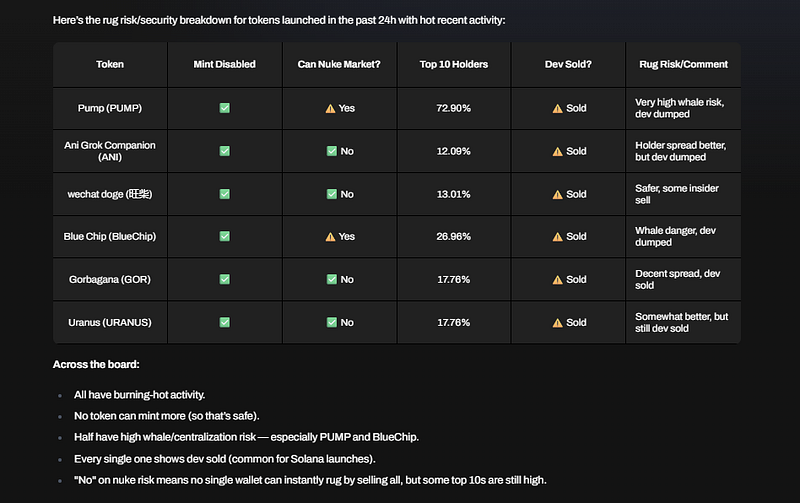
    Instead of manually tracking dozens of wallets and scanning new tokens (a process that was exhausting and often too slow), the AI watches continuously and flags anything that looks off.

    One memorable example was Yeezy Coin ($YZY): Backed by Kanye West, it saw massive amounts of capital as soon as it launched. When I dug in, it turned out to be a coordinated pump by insiders with a high likelihood of a rug pull. 
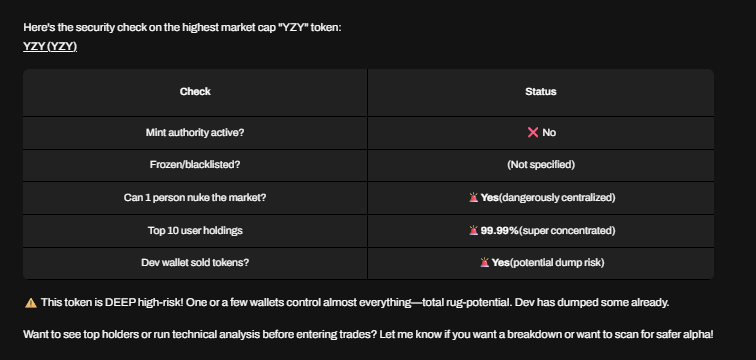
    While everyone was buying into the hype, I avoided it entirely. If you want to know how it turned out, all you have to do is look at the chart.
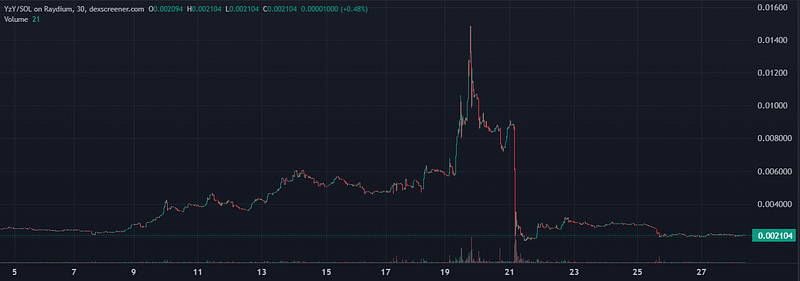
    Now, the real benefit is much greater than just avoiding losses (which is already a massive advantage on itself). It’s the confidence that comes with knowing the AI has your back 24/7. I can focus on analyzing tokens, spotting opportunities, and defining the strategy instead of constantly worrying if I’m about to get rugged. 

    Over time, this layer of protection alone saved me a number of trades that would have cost me 20–30% of my portfolio each time.

    But wallet tracking isn’t only about avoiding scams. it’s also one of the best ways to spot real trends.

    We call them experienced or “smart money” wallets. With AI, you can easily track them, see what they are doing, and follow their steps. 

    These are the insiders, traders, and investors that get into tokens before they are even mentioned in social media or Telegram groups.

    Since it’s purely based on pattern recognition, AI agents are absolutely amazing at this. They immediately detect trends and automatically set the trades for early entries, so when retail pushes the price, you’re already positioned for profit. 

    Without AI, you never would have even seen that activity happening in the first place.
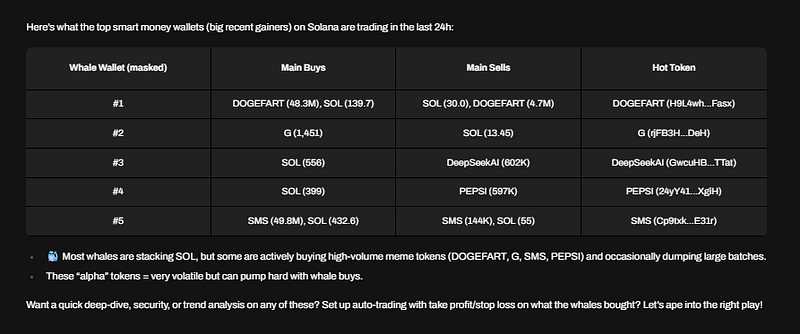
    This is what I love most about wallet tracking: it turns the noise of thousands of random trades into something legible. Instead of chasing hype after it explodes, I can see conviction moves happening in the background, before they go mainstream. 

    And the truth is, following the right wallets is often a far better signal than listening to influencers or scanning charts alone.

    Security checks and wallet tracking are not flashy, but they’re essential. If your strategy is sharp but your safety net is weak, AI can plug that gap and protect your gains, letting you trade with more confidence and less stress.

    4. Turning Narratives and Social Chatter Into Trading Signals

    If price is what you see on the chart, narrative is the invisible force pushing it there. And in crypto, narratives move faster than anything else. 

    One meme, one viral post, one new community trend can spark a frenzy that dwarfs even the cleanest technical setups.

    For the longest time, I tried to keep up with narratives manually, scrolling through social media, jumping between Telegram and Discord, lurking in Reddit threads. 

    It was exhausting, and worse, I was always late. By the time I pieced together what people were excited about, the early gains were already gone.
    AI makes an immense difference in this area. I found and use trained models to track social chatter across multiple platforms, not just for volume or trends, but for sentiment shifts too. 

    It looks for patterns humans overlook: sudden spikes in positive mentions, repeated phrases across different communities, or unusual activity around a specific coin name. Most importantly, it can also detect bots to distinguish between real engagement and fake interactions or paid shills.

    For example, Pump Parade’s social sentiment tracking tool keeps track of all mentions of any cryptocurrency or token of your choice, along with the Fear & Greed index, and assigns a Market Mood score based on the sentiment and volume of interactions.

    Then, it compares it to the past day and week so you can see in which direction the trend is going. All in a digestible, readable way to jump right into the action.
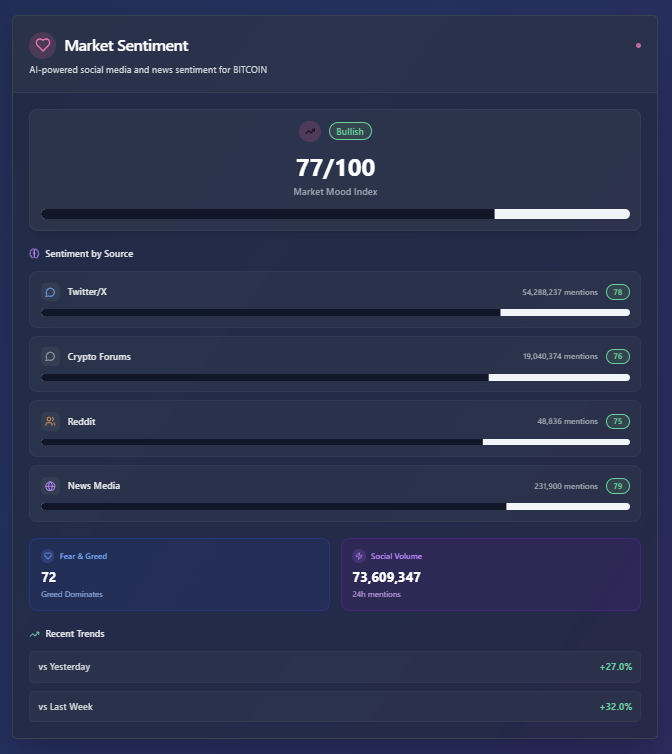
    This is where narrative tracking shines: it separates real momentum from manufactured hype. Everyone’s seen projects try to buy engagement or spin up fake communities, but AI is much better than me at spotting the difference. Bots post the same phrases, real users don’t. Organic conversations grow steadily, fake ones spike and die. 

    The AI helps me focus on coins with actual grassroots energy, not just noise.

    Over time, I’ve realized that narrative tracking is less about predicting the future and more about reducing lag. Instead of reacting days later, I can respond within hours, sometimes minutes, when the first sparks of a new trend appear. 

    And in a market where being early is everything, that speed has made a massive difference in my results.

    AI and Crypto Trading: It’s About Expanding Your Capabilities 

    The biggest shift for me wasn’t just adding AI to my trading for the sake of it: it was realizing I’d been competing at a disadvantage all along. 

    While I was relying on instincts, gut calls, and late reactions, others were running with real-time execution, prediction models, wallet intelligence, and narrative tracking. All based in real-time data. No wonder I was always one step behind.

    AI didn’t replace me as a trader. It amplified me.

    It covered the blind spots I couldn’t fix on my own: discipline, speed, endless monitoring, and data analysis at a scale no human brain can match. 

    And once I combined that with my own judgment and risk management, the results spoke for themselves: a significant increase in profit consistency, less stress, and the confidence that I wasn’t flying blind anymore.

    To me, that’s one of the most important benefits of using AI in your crypto trading strategy: the peace of mind.

    Crypto is brutal to those who hesitate. Trends vanish in hours, scams take minutes to drain wallets, and opportunities slip past in seconds. You can keep trusting your gut and hoping for the best , or you can give yourself the tools to actually compete.

    The truth is, AI didn’t just improve my trading. It forced me to rethink how I even approach the game.

    For years, I treated crypto like a test of willpower, instinct, and screen time. But the market doesn’t care how disciplined or “experienced” you think you are. It only cares about who adapts the fastest. 

    Once I accepted that, AI stopped feeling like a crutch and started feeling like a weapon. And now I can’t imagine stepping into a trade without it.


    Solana (SOL) Price Prediction: What Will SOL Price Be in 2044?

    0

    Ever tried to picture your life twenty years from now? It’s a mix of exciting possibilities and complete unknowns. Applying that same thought experiment to your crypto portfolio can feel even more daunting, but it’s this long-term vision that can turn a speculative bet into a life-changing investment. Today, we’re embarking on that very journey with a long-range Solana (SOL) price prediction, peering deep into the future to understand what could be in store for this high-speed blockchain.

    This isn’t about hype or impossible promises. It’s a sober, analytical look at the potential pathways for Solana, grounded in current data and future possibilities. Let’s explore what the world might look like for SOL holders in 2044.

    TL;DR: Solana in 2044

    • Current State: Solana is showing strong positive momentum, with a price of $204.13 and significant gains across the last hour, day, week, and month, indicating high investor confidence right now.
    • Base Case Prediction for 2044: Our base scenario projects a price range of $800 to $1,500. This assumes Solana solidifies its position as a major “blue-chip” Layer 1 blockchain, capturing a steady share of a maturing global crypto market.
    • Bull Case Prediction for 2044: In a highly optimistic scenario, SOL could trade between $5,000 and $10,000. This future relies on Solana becoming a foundational pillar of Web3, dominating sectors like decentralized finance (DeFi), gaming, and social applications.
    • Bear Case Prediction for 2044: The risk of failure is real. A bearish outcome could see SOL fall below $100, potentially becoming a “ghost chain” if it fails to innovate, overcome network stability issues, or is outpaced by competitors.
    • Key Drivers: Long-term success hinges on sustained developer adoption, network uptime and decentralization, and its ability to capture a significant share of the global digital economy.

    What is Solana (SOL)? A Quick Refresher

    Before we look forward, let’s quickly glance back. Solana is a high-performance Layer 1 blockchain designed for speed and scalability. Often called an “Ethereum killer,” its main value proposition is its ability to process tens of thousands of transactions per second at a very low cost.

    This is made possible by its unique Proof of History (PoH) consensus mechanism, which works in tandem with Proof of Stake (PoS). This technological edge has made it a favorite for developers building decentralized applications (dApps), especially in high-frequency domains like decentralized exchanges (DEXs), NFT marketplaces, and on-chain gaming. After weathering the storm of the FTX collapse, Solana has shown remarkable resilience, with its ecosystem of developers and users growing stronger than ever.

    Current Market Conditions: Interpreting the Momentum

    As of today, the market is painting a very bullish picture for Solana in the short term. With a price of $204.13 and a massive market capitalization of over $110 billion, SOL is firmly established as a top-tier crypto asset. The trading volume in the last 24 hours is a robust $6.5 billion, showing deep liquidity and intense market interest.

    The price action tells a story of consistent upward pressure. Investors have seen gains of 0.47% in the last hour, 1.44% in the last 24 hours, an impressive 8.09% over the last week, and a powerful 26.52% over the last 30 days. This isn’t a random spike; it’s a sustained trend of accumulation and positive sentiment, suggesting that market participants are confident in Solana’s immediate future and its underlying narrative.

    On-Chain and Narrative Drivers

    Looking beyond today’s price, the long-term health of any blockchain depends on its fundamental drivers. For Solana, the narrative is built on its performance. Its ability to offer a fast and cheap user experience is attracting a wave of new projects and users who feel priced out of other networks.

    While we don’t have a live feed of on-chain data here, the key metrics to watch are always developer activity, new and active wallet addresses, and Total Value Locked (TVL) in its DeFi ecosystem. A sustained increase in these areas indicates a healthy, growing network. Narratives around Solana’s potential in decentralized physical infrastructure networks (DePIN), its successful “Saga” phone experiments, and its growing NFT and meme coin culture are powerful forces that could drive adoption for years to come.

    A Solana (SOL) Price Prediction for 2044: Three Scenarios

    Forecasting a price twenty years into the future is an exercise in strategic foresight, not a guarantee. Traditional technical analysis, which relies on chart patterns, is not useful over such a long time horizon. Instead, we must use a fundamental approach based on macro trends, market growth, and potential market share.

    Bear Case: The Ghost Chain ($0 – $100)

    In a bearish scenario, Solana fails to maintain its relevance. This could happen for several reasons. Persistent network outages could permanently damage its reputation for reliability. A new, superior technology could emerge that makes Solana’s architecture obsolete. Or, fierce competition from Ethereum’s Layer 2 solutions and other rival Layer 1s could slowly siphon away its developers and users. In this future, Solana becomes a “ghost chain” with minimal activity, and its token value falls dramatically.

    Base Case: The Blue-Chip Contender ($800 – $1,500)

    Our base case assumes the global cryptocurrency market cap grows from its current ~$2.5 trillion to a more mature level of $25 trillion by 2044, similar to the current value of the U.S. stock market. In this scenario, Solana doesn’t “win” but secures its place as one of the top 3-5 essential Layer 1 blockchains, holding a stable market dominance of around 4%.

    • Market Cap: 4% of $25 trillion = $1 trillion
    • Estimated 2044 Supply: Solana’s supply inflates over time. A reasonable estimate places its circulating supply around 900 million SOL by 2044.
    • Calculation: $1,000,000,000,000 / 900,000,000 SOL = ~$1,111 per SOL.
      This price reflects a future where Solana is a vital, but not monopolistic, part of the digital economy.

    Bull Case: The Web3 Operating System ($5,000 – $10,000)

    The bull case is a vision where Solana becomes a foundational protocol for the internet itself. In this future, the total crypto market cap has expanded to $75 trillion, absorbing significant portions of global finance, gaming, and social media. Solana, with its unmatched speed and low cost, becomes the dominant platform for consumer-facing applications, capturing 10% of the total market.

    • Market Cap: 10% of $75 trillion = $7.5 trillion
    • Estimated 2044 Supply: ~900 million SOL
    • Calculation: $7,500,000,000,000 / 900,000,000 SOL = ~$8,333 per SOL.
      This outcome depends on near-flawless execution, continuous innovation, and the network effect reaching a global scale.

    Simple Valuation Back-of-the-Envelope

    How do we arrive at these numbers? It’s a simple thought experiment based on a few key assumptions. You can adjust them to form your own Solana (SOL) price prediction.

    1. Estimate the Future Total Crypto Market Cap: Where do you think the entire industry will be in 20 years? Will it be a niche market or a multi-trillion dollar asset class integrated into the global economy?
    2. Estimate Solana’s Future Market Dominance: What percentage of that total market will Solana capture? Will it be a dominant player (10%+), a solid contender (3-5%), or an afterthought (under 1%)?
    3. Estimate Solana’s Future Circulating Supply: The number of SOL tokens increases over time due to inflation from staking rewards. We used a rough estimate of 900 million.

    The formula is: (Future Total Market Cap * Solana’s % Dominance) / Future SOL Supply = Predicted SOL Price.

    Risks and What to Watch

    Investing in Solana for the long haul requires a clear understanding of the risks.

    • Network Stability: Solana’s biggest historical weakness has been network outages. Continued stability is non-negotiable for long-term trust.
    • Competition: The Layer 1 and Layer 2 space is incredibly competitive. Ethereum’s upgrades and new blockchains could challenge Solana’s position.
    • Decentralization: While fast, some critics argue that the hardware requirements to run a Solana validator risk centralizing the network over time. Watching the validator count and distribution is key.
    • Regulation: The global regulatory landscape for crypto is still uncertain and could pose a significant threat to all protocols.

    Conclusion: The Path Forward for Solana

    Predicting the state of the world in 2044 is a speculative venture, but the fundamental thesis for Solana is clear. It is a bet on a future where blockchain technology is seamlessly integrated into our daily lives, and where the demand for high-speed, low-cost transactions is nearly infinite.

    Whether Solana achieves its bull case potential or fades against competitors will depend on its ability to execute, innovate, and maintain a secure and reliable network. For investors, the next steps are not to blindly follow a price target, but to monitor the fundamental drivers: watch the growth in its developer community, track the user activity on its dApps, and stay informed about the technological race it is running. The journey to 2044 will be volatile, but for those who believe in its vision, it promises to be a compelling one.

    FAQ

    Is Solana a good long-term investment?

    Solana has strong technological fundamentals and a growing ecosystem, making it a compelling candidate for a long-term crypto portfolio. However, it faces significant competition and technological risks, and like all crypto assets, it is highly volatile.

    Could Solana (SOL) really reach $10,000?

    Reaching a price of $10,000 per SOL is possible in a highly optimistic bull scenario, but it is not guaranteed. It would require the entire cryptocurrency market to grow to a massive scale (e.g., $75T+) and for Solana to become one of the most dominant blockchain platforms in the world, capturing a significant share of global economic activity.

    What are the biggest threats to Solana’s success?

    The primary threats are competition from other high-performance blockchains like Ethereum Layer 2s, potential future network stability issues that could erode user trust, and unfavorable global regulations that could stifle innovation and adoption.

    How does Solana’s inflation affect its price?

    Solana has a pre-determined inflation schedule that issues new SOL as rewards for stakers who secure the network. This increases the total supply over time. For the price to increase, demand for SOL must grow faster than the rate of supply inflation.

    Not financial advice. Do your own research.

    World Liberty Financial (WLFI) Price Prediction: What Will WLFI Price Be in 2043?

    0

    Have you ever stared at a chart, watching the price of your favorite crypto asset tumble, and wondered if you’ve made a terrible mistake? Or have you felt the thrill of a small bounce and thought, “This is it, this is the bottom”? That mix of fear and hope is what every crypto investor feels, especially when looking at an asset with as much recent volatility as World Liberty Financial (WLFI). Today, we’re not just looking at the next 24 hours. We’re zooming out two decades to ask a bold question: what could be the World Liberty Financial (WLFI) price prediction for 2043?

    This article will break down the current state of WLFI, explore potential long-term drivers, and map out what the future could hold. Let’s dive in.

    TL;DR: Quick Forecast

    • Current Situation: WLFI is experiencing extreme short-term volatility, with a 22% drop in the last 24 hours despite massive trading volume. This suggests a major market event or sentiment shift is currently in play.
    • Bearish Scenario (2043): If WLFI fails to achieve its goals and gets outpaced by competitors, the price could fall and stagnate, potentially trading between $0.01 and $0.15.
    • Base Scenario (2043): With steady adoption and growth in line with the broader crypto market, WLFI could carve out a solid niche. A reasonable price target would be in the $3.50 to $7.00 range.
    • Bullish Scenario (2043): If WLFI becomes a dominant force in decentralized finance and achieves mass adoption, its market cap could rival today’s largest financial institutions. This could push the price towards $50 to $90.

    What Is World Liberty Financial (WLFI)?

    Before we look forward, let’s have a quick refresher. World Liberty Financial is a decentralized protocol aiming to build a global, open-source financial system. Its core mission is to provide accessible financial services—like payments, lending, and borrowing—to anyone with an internet connection, effectively targeting the vast unbanked and underbanked populations worldwide.

    Unlike traditional banks, WLFI operates on a blockchain, meaning it’s not controlled by any single company or government. Transactions are peer-to-peer, and the rules are encoded in smart contracts. The WLFI token is the native asset of this ecosystem, used for paying transaction fees, participating in governance (voting on the future of the protocol), and as collateral within its decentralized applications.

    Current Market Conditions: A Volatile Picture

    As of this writing, the metrics for WLFI paint a picture of intense market activity and bearish short-term sentiment.

    • Current Price: $0.219059
    • Market Cap: $6.25 Billion
    • 24h Volume: $2.04 Billion

    Let’s interpret this. A market cap of over $6 billion places WLFI firmly in the large-cap category of digital assets, suggesting it’s already a well-established project. However, the price action is what’s most telling. A 22% drop in 24 hours is significant and points to heavy selling pressure, possibly triggered by broader market fears, liquidations, or project-specific news.

    The most fascinating metric is the 24-hour volume. At over $2 billion, it represents roughly 33% of the entire market cap. This is an incredibly high volume-to-market-cap ratio. It tells us that a massive number of tokens are changing hands. This could mean one of two things: either panicked sellers are rushing for the exits, or opportunistic buyers are stepping in, believing this is a discount. The small 1.3% bounce in the last hour suggests some buyers are indeed showing interest at these levels.

    On-Chain and Narrative Drivers

    Since we can’t see the specific on-chain data like active wallet counts or smart contract interactions right now, we must think from a first-principles approach. For a project like WLFI to succeed over a 20-year timeline, its fundamental narrative must become a reality. The story of “banking the unbanked” is powerful, but it needs the metrics to back it up.

    Long-term price appreciation will depend almost entirely on adoption. We would need to watch for a sustained increase in core key performance indicators (KPIs). This includes a growing number of daily active users, an increasing total value locked (TVL) in its DeFi protocols, and rising transaction counts on its network. If these numbers trend up year over year, it proves the project is creating real-world utility. Without that, the price is just speculation.

    A 20-Year World Liberty Financial (WLFI) Price Prediction

    Forecasting anything two decades into the future is difficult, especially in a fast-moving industry like crypto. The following scenarios are based on logical frameworks of adoption, competition, and overall market growth. They are not certainties but structured possibilities.

    Bear Case: Failure to Launch

    In the bearish scenario, World Liberty Financial fails to capture significant market share. The technology might become outdated, fierce competition from other layer-1 blockchains or even centralized fintech companies could render it obsolete, or a major security flaw could destroy trust.

    In this future, WLFI becomes a “ghost chain” with low activity and dwindling developer support. Its token would primarily be held by speculators hoping for a revival that never comes. By 2043, the WLFI price would likely have bled out significantly, trading somewhere between $0.01 and $0.15.

    Base Case: Steady and Stable Growth

    In our base case, WLFI successfully delivers on part of its vision. It doesn’t become the “one financial system for the world” but builds a strong, dedicated user base in specific regions or for particular use cases, like global remittances or decentralized micro-loans. It coexists with other successful crypto projects and grows in value as the entire digital asset market matures.

    Assuming the total crypto market cap grows to $25 trillion by 2043, and WLFI captures a modest but respectable 0.5% of that market, its market cap would be $125 billion. Based on a current estimated supply of 28.5 billion tokens, this would lead to a price of approximately $4.38. We can project a range of $3.50 to $7.00 for this scenario.

    Bull Case: A New Financial Standard

    The bull case is where WLFI achieves everything it set out to do. Its platform becomes the go-to infrastructure for decentralized finance globally. It onboards hundreds of millions of users, processes trillions of dollars in transaction volume annually, and becomes a foundational layer of a new, open financial internet.

    In this scenario, WLFI wouldn’t just be a cryptocurrency; it would be a core global utility. Its market cap could rival that of major financial players today. If we project a total crypto market cap of $50 trillion and assume WLFI becomes a top-tier project capturing 5% of that value, its market cap would reach $2.5 trillion. This would result in a staggering WLFI price of approximately $87.70. A reasonable range for this optimistic outcome is $50 to $90.

    Simple Valuation: A Look at the Numbers

    Let’s do a simple, back-of-the-envelope calculation to ground our thinking.

    1. Find the Circulating Supply:

      • Market Cap / Price = Supply
      • $6,248,183,961 / $0.219059 ≈ 28.5 billion WLFI
    2. Project a Future Market Cap (Base Case):

      • Let’s assume WLFI becomes as valuable as a medium-sized modern bank, like U.S. Bancorp, which has a market cap of around $60 billion.
      • Future Price = $60,000,000,000 / 28,500,000,000 WLFI = $2.10
    3. Project a Future Market Cap (Bull Case):

      • Let’s assume WLFI reaches the scale of a payment giant like Visa, with a market cap of roughly $500 billion.
      • Future Price = $500,000,000,000 / 28,500,000,000 WLFI = $17.54

    These simple comparisons show the vast range of outcomes. The $17.54 valuation is still far below our hyper-optimistic $87.70 bull case, highlighting just how much growth would be required for WLFI to reach those heights. These calculations assume the supply remains static, which may not be the case.

    Risks and What to Watch

    Investing in anything over a 20-year horizon comes with serious risks. For WLFI, the primary ones are:

    • Regulatory Risk: Governments worldwide could impose harsh regulations on decentralized finance, stifling growth.
    • Technological Risk: A better, faster, and cheaper technology could emerge and replace WLFI. The crypto space evolves at a breakneck pace.
    • Competition: There are hundreds of projects vying for the same market. WLFI needs a strong competitive advantage to survive and thrive.
    • Execution Risk: The development team may fail to deliver on its roadmap and build a product that people actually want to use.

    Conclusion and Next Steps

    The road to 2043 is long and filled with uncertainty. The current market action for WLFI shows it is a high-stakes, high-volatility asset that captures significant trader attention. Its future price will not be determined by today’s charts, but by its ability to turn a powerful narrative into a real-world, widely-adopted product.

    For investors, the key is to look beyond the daily noise. The 22% drop is alarming, but for a 20-year time horizon, it’s a blip. The real questions to ask are: Do you believe in the long-term vision of open finance? Do you think the WLFI team can execute? And can it withstand the inevitable storms of competition and regulation? Answering those questions will give you a much clearer picture than any price chart can.

    Frequently Asked Questions (FAQ)

    1. Is WLFI a good investment right now?
    That depends entirely on your risk tolerance and investment timeline. The current price is down significantly, which could be a buying opportunity for long-term believers or a warning sign for short-term traders. The high volatility makes it a risky asset.

    2. How is the circulating supply of WLFI determined?
    We can estimate the current circulating supply by dividing the market capitalization by the current price. Based on today’s metrics, there are approximately 28.5 billion WLFI tokens in circulation.

    3. What is the most realistic price prediction for WLFI?
    The “base case” scenario of $3.50 to $7.00 by 2043 is arguably the most balanced. It assumes WLFI achieves meaningful adoption without becoming a complete world-dominating monopoly, while also factoring in the overall growth of the cryptocurrency market.

    4. What could make WLFI go to zero?
    A catastrophic event like a critical, unfixable smart contract exploit that results in the loss of billions in user funds, a complete failure to gain any user adoption, or a coordinated global regulatory ban could theoretically send the price toward zero.

    Not financial advice. Do your own research.

    Top 10 Best Performing Cryptocurrencies Last Week (September 1, 2025)

    0

    The first week of September 2025 has been a wild ride in the crypto markets. While major assets like Bitcoin and Ethereum showed modest movement, the real action was in the altcoin space. We saw several lesser-known tokens post triple-digit gains, reminding everyone that incredible volatility and opportunity are always just around the corner in this industry. This pattern suggests that traders are actively seeking high-risk, high-reward plays, rotating capital into specific narratives and ecosystems that are catching fire.

    Last week’s price action highlights a market that is far from uniform. It’s a landscape of individual stories, where a project’s specific developments or a sudden surge in community interest can easily decouple it from the broader market trend. For investors, this environment demands sharp analysis and an eye for spotting momentum before it becomes mainstream. Pump Parade offers an AI-powered dashboard with valuable crypto market insights in real time.

    Top 10 Crypto Performers of the Week

    Here’s a breakdown of the digital assets that significantly outperformed the rest of the market over the last seven days.

    Disclaimer: This list is for informational purposes only and does not constitute financial advice. The cryptocurrency market is extremely volatile. Always do your own research before investing.

    1. Austin Capitals (AUX): 183.35% Increase

    • Name: Austin Capitals
    • Symbol: AUX
    • Current Price: $4.25
    • 7-Day Change: +183.35%

    Austin Capitals (AUX) was the undisputed champion this week, exploding with a massive 183% gain. The token’s price action was swift and decisive, pushing it toward its all-time high of $4.38 set just a couple of months ago. With a market cap of around $41 million, AUX is a smaller-cap altcoin, which explains its capacity for such explosive moves. However, its 24-hour trading volume is relatively low at just under $70,000, suggesting that liquidity could be a concern. Traders should be cautious, as low liquidity can lead to significant price swings in either direction.

    2. Unstable Coin (USDUC): 132.55% Increase

    • Name: Unstable Coin
    • Symbol: USDUC
    • Current Price: $0.067
    • 7-Day Change: +132.55%

    Living up to its “unstable” name, USDUC delivered a highly volatile but incredibly profitable week for its holders, rallying over 132%. The token hit a new all-time high today, driven by a significant spike in trading volume, which exceeded $15 million in the last 24 hours. This level of volume lends more credibility to the price move compared to other low-cap pumps. The 24-hour price range between $0.055 and $0.074 shows just how much intraday volatility traders are dealing with.

    3. BNB Attestation Service (BAS): 124.64% Increase

    • Name: BNB Attestation Service
    • Symbol: BAS
    • Current Price: $0.023
    • 7-Day Change: +124.64%

    BNB Attestation Service (BAS) captured significant attention with a 124% surge. The project saw impressive trading volume of over $45 million, indicating strong interest from the market. Its price is currently hovering just below its all-time high of $0.026, set late last month. An interesting point for investors to note is the difference between its market cap ($58 million) and its fully diluted valuation ($232 million). This suggests a large portion of the token supply is not yet in circulation, which could create selling pressure in the future.

    4. WOLF (WOLF): 87.46% Increase

    • Name: WOLF
    • Symbol: WOLF
    • Current Price: $0.035
    • 7-Day Change: +87.46%

    WOLF climbed an impressive 87% this week, placing it firmly on our list of top performers. Like AUX, WOLF is a smaller project with a market cap of around $36 million. Its 24-hour volume is also on the lower side at about $61,000. This rally represents a significant recovery for the token, which is up over 1,150% from its all-time low recorded in June. While the momentum is strong, the thin trading volume means investors should be prepared for potential volatility.

    5. Cronos (CRO): 80.43% Increase

    • Name: Cronos
    • Symbol: CRO
    • Current Price: $0.28
    • 7-Day Change: +80.43%

    As the largest and most well-known coin on this list, the 80% rally from Cronos (CRO) is particularly noteworthy. With a market cap of over $9.4 billion and a 24-hour volume of $274 million, this move was backed by serious capital. CRO’s performance suggests a potential resurgence for the Cronos ecosystem, which also saw other related tokens perform well. Despite this powerful surge, CRO is still down about 70% from its 2021 all-time high, indicating that long-term holders may see this as just the beginning of a larger recovery.

    6. DIMO (DIMO): 78.09% Increase

    • Name: DIMO
    • Symbol: DIMO
    • Current Price: $0.084
    • 7-Day Change: +78.09%

    DIMO put up a strong performance with a 78% gain over the last week. The project currently sits just inside the top 1000 by market cap, with healthy 24-hour trading volume exceeding $3.2 million. This suggests a decent level of liquidity behind its recent price move. The token is still significantly down from its all-time high of $0.78 set in late 2023, so this could be the start of a recovery trend if the momentum can be sustained.

    7. Cronos zkEVM CRO (ZKCRO): 77.85% Increase

    • Name: Cronos zkEVM CRO
    • Symbol: ZKCRO
    • Current Price: $0.30
    • 7-Day Change: +77.85%

    Another token from the Cronos ecosystem, ZKCRO, rallied nearly 78%, mirroring the strength seen in the main CRO token. However, traders must exercise extreme caution here. The 24-hour trading volume for ZKCRO was a minuscule $33. This indicates almost no liquidity, meaning the price is susceptible to extreme and artificial swings. A single small trade could dramatically move the price, making it a very high-risk asset to engage with despite its impressive weekly gain.

    8. ECOMI (OMI): 75.25% Increase

    • Name: ECOMI
    • Symbol: OMI
    • Current Price: $0.00035
    • 7-Day Change: +75.25%

    ECOMI (OMI) showed renewed signs of life with a 75% weekly pump, backed by a respectable $3.7 million in 24-hour volume. OMI is a project with a very large token supply, resulting in its low unit price. It reached its peak back in the 2021 bull run and is still down over 97% from that high. This week’s rally could be driven by speculation that the project is poised for a comeback, but it has a long way to go to reclaim its former glory.

    9. Numeraire (NMR): 74.12% Increase

    • Name: Numeraire
    • Symbol: NMR
    • Current Price: $14.23
    • 7-Day Change: +74.12%

    Numeraire, a more established project in the crypto space, had a fantastic week with a 74% gain. The token’s price action was supported by a robust $63 million in 24-hour trading volume, showing genuine market interest. NMR combines machine learning with finance, a narrative that seems to be resonating with traders. Like many altcoins from previous cycles, it is still down significantly (over 84%) from its 2021 all-time high, making this a potential recovery play for those bullish on its fundamentals.

    10. VVS Finance (VVS): 70.07% Increase

    • Name: VVS Finance
    • Symbol: VVS
    • Current Price: $0.0000058
    • 7-Day Change: +70.07%

    Rounding out our top 10 is VVS Finance, the third token on this list from the Cronos ecosystem. Its 70% gain further solidifies the narrative that capital was flowing into Cronos-based projects last week. VVS is a decentralized exchange and has a market cap of around $270 million, making it a significant player in its ecosystem. The token hit its all-time low earlier this year in February, and this rally represents a strong bounce from those levels.

    Risks & What to Watch This Week

    The massive gains seen this week are exciting, but they come with equally massive risks. Many of the top performers are low-cap altcoins with thin liquidity. This means prices can fall just as quickly as they rose. Chasing pumps, a behavior driven by the “fear of missing out” (FOMO), often results in buying at the top. Always assess the trading volume; a price surge with very low volume, like with ZKCRO, is a major red flag.

    This week, keep a close eye on Bitcoin’s price action. As the market leader, its stability or volatility often dictates the direction for altcoins. If Bitcoin remains stable or trends upward, it may create a favorable environment for more altcoin rallies. Also, watch to see if the capital flowing into the Cronos ecosystem continues or if traders begin rotating their profits into the next hot narrative.

    Conclusion

    The past week has proven that even in a consolidating market, there are incredible opportunities for savvy traders who can identify emerging trends. The dominance of the Cronos ecosystem and the explosive moves from several low-cap gems show that research and timing are critical.

    However, it is crucial to approach these volatile assets with a clear strategy and robust risk management. The tokens that lead the charts one week can easily see sharp corrections the next. Stay informed, be cautious, and never invest more than you are willing to lose.

    Frequently Asked Questions (FAQ)

    What causes a cryptocurrency to perform so well in a short period?

    Several factors can cause a crypto asset to rally sharply. These include positive project-specific news like a partnership or product launch, a broader narrative shift (e.g., renewed interest in an ecosystem like Cronos), or purely speculative trading in low-liquidity coins where a small number of buyers can significantly impact the price.

    Is it too late to invest in these top-performing coins?

    Investing in an asset after it has already increased by over 70% in a week is extremely risky. This is often referred to as “chasing pumps” and can lead to significant losses if the momentum reverses. It’s generally wiser to wait for a price consolidation or pullback and to conduct thorough research on the project’s long-term potential before investing.

    How important is trading volume when analyzing a price pump?

    Trading volume is a critical indicator of a price move’s strength. High volume, like that seen with Cronos (CRO), suggests that a broad base of market participants is behind the rally, making it more sustainable. Very low volume, as seen with Cronos zkEVM CRO (ZKCRO), indicates that the price move is illiquid and could be easily manipulated or reversed. It’s a major red flag for traders.

    What is the difference between market cap and fully diluted valuation (FDV)?

    Market cap is calculated by multiplying the current price of a coin by its circulating supply (the number of coins available on the market). Fully Diluted Valuation (FDV) is calculated by multiplying the current price by the total (or max) supply of the coin. A large gap between the two, as seen with BNB Attestation Service (BAS), means many tokens are not yet in circulation and could be released in the future, potentially creating selling pressure and diluting the value for existing holders.

    Pump.fun (PUMP) Price Prediction: What Will PUMP Price Be in 2028?

    0

    If you’re in the crypto space, you’ve likely heard the buzz around Pump.fun, the platform that has turned memecoin creation into a near-instantaneous event. With its explosive growth, many investors are now asking a critical question: what does a long-term Pump.fun (PUMP) Price Prediction look like? In this article, we’ll break down the potential future of the PUMP token, analyzing its current standing and exploring what its price could be in 2028 based on different market scenarios.

    TL;DR: Quick PUMP Price Prediction

    • Current Status: PUMP is showing strong short-to-medium term momentum, with significant gains over the last week and month. Its high trading volume relative to its market cap suggests strong current interest.
    • Base Case Prediction (2028): Our analysis suggests a potential base case price of $0.0084. This scenario assumes Pump.fun maintains its market share and grows steadily with the broader crypto market.
    • Bullish Case Prediction (2028): In a highly optimistic scenario where Pump.fun becomes a dominant launchpad and the crypto market enters a major bull run, PUMP could potentially reach $0.028.
    • Bearish Case Prediction (2028): If the memecoin narrative fades or a prolonged bear market takes hold, PUMP could fall to around $0.0007, erasing a significant portion of its current value.
    • Key Drivers: The PUMP token’s future value is deeply tied to the platform’s adoption, the overall health of the memecoin market (especially on Solana), and broader crypto market cycles.

    What is Pump.fun (PUMP)?

    Before we dive into predictions, let’s have a quick refresher. Pump.fun is a platform built on the Solana blockchain that allows anyone to create and launch a new cryptocurrency token in under a minute for just a few dollars. It simplified the process by integrating a “bonding curve” mechanism, where the token’s price automatically increases as more people buy it. Once a token reaches a certain market capitalization on Pump.fun, it gets listed on the Raydium decentralized exchange, a major liquidity hub on Solana.

    The PUMP token is the native asset associated with the platform. While its exact utility can evolve, it’s generally expected to play a role in the platform’s governance, revenue sharing, or fee structures. Think of it as a bet on the success and continued relevance of the Pump.fun platform itself. The more tokens launched and traded on Pump.fun, the more valuable the PUMP token could theoretically become.

    Current Market Conditions

    To understand where PUMP might be going, we first need to know where it stands. Let’s interpret the current metrics:

    • Current Price: $0.00354225
    • Market Cap: $1,254,844,330
    • 24h Volume: $201,884,531
    • Price Change: 1h: -2.32% | 24h: +6.21% | 7d: +27.42% | 30d: +35.68%

    The data tells a compelling story. With a market capitalization of over $1.25 billion, PUMP is no small-cap project; it’s a major player. The short-term 1-hour dip suggests some consolidation or profit-taking, which is normal. However, the 24-hour, 7-day, and 30-day performance numbers are all strongly positive, indicating a powerful uptrend and sustained buying interest.

    Perhaps the most telling metric is the 24-hour volume of over $201 million. This represents about 16% of its total market cap, a very healthy ratio that signals high liquidity and active trading. In simple terms, a lot of people are buying and selling PUMP right now, which is a sign of a highly relevant and debated asset.

    On-Chain & Narrative Drivers

    Beyond the raw numbers, the “story” behind an asset is what often drives its price in the long run. For PUMP, the primary narrative is that it is the “Shopify for memecoins.” It has democratized token creation, making it accessible to everyone. This is a powerful narrative in a market that loves simplicity and viral trends.

    While we don’t have deep on-chain data at our fingertips, the key metrics to watch would be the daily number of new tokens launched on the platform and the total volume flowing through its bonding curves. If these numbers continue to grow, it shows increasing adoption and utility, which is a fundamental driver of value. The success of PUMP is directly linked to the health of the memecoin ecosystem. As long as traders have an appetite for high-risk, high-reward plays, platforms like Pump.fun will likely remain in demand.

    Scenarios for 2028: A Pump.fun (PUMP) Price Prediction

    Forecasting four years into the future is challenging, but we can build logical scenarios based on potential market developments. We’ll use the current approximate circulating supply of 354 billion tokens (derived from the current market cap and price) for these calculations.

    Bear Case: The Hype Fades

    In a bearish scenario, the memecoin mania of 2024 proves to be a cyclical peak. A prolonged crypto bear market sets in, draining liquidity and speculative interest. Competitors could emerge with better technology or lower fees, eating into Pump.fun’s market share. In this world, platform usage plummets, and the PUMP token’s narrative loses its power.

    • Projected Market Cap: $250 Million
    • PUMP Price Prediction (2028): $0.0007

    Base Case: Steady Growth and Relevance

    Our base case assumes that Pump.fun weathers the market cycles and maintains its position as a key launchpad on Solana. The memecoin market may cool off from its current frenzy but remains a permanent, albeit volatile, sector of crypto. The platform continues to generate consistent fees, and the PUMP token finds stable utility within its ecosystem. This scenario anticipates another crypto bull run by 2028, helping lift PUMP’s valuation.

    • Projected Market Cap: $3 Billion
    • PUMP Price Prediction (2028): $0.0084

    Bull Case: Market Dominance

    In the most optimistic scenario, Pump.fun doesn’t just survive; it thrives. It becomes the undisputed standard for launching tokens on Solana and potentially expands to other blockchains. It might even evolve to support more than just memecoins, becoming a go-to platform for community tokens and other small-scale projects. In a full-blown crypto bull market in 2028, a category-leading platform like this could see its valuation soar.

    • Projected Market Cap: $10 Billion
    • PUMP Price Prediction (2028): $0.028

    Simple Valuation Back-of-the-Envelope

    Let’s try a simple valuation to see if these numbers make sense. Pump.fun’s primary revenue comes from a 1% fee on all swaps conducted on the platform.

    • Assumption: Let’s conservatively estimate that the actual daily trading volume on the Pump.fun platform is 10% of the PUMP token’s 24-hour trading volume. With the token’s volume at ~$201M, we’ll assume platform volume is ~$20M per day.
    • Daily Revenue: $20,000,000 * 1% = $200,000
    • Annualized Revenue: $200,000 * 365 = $73 Million

    With a current market cap of $1.25 billion, this gives us a Price-to-Sales (P/S) ratio of about 17 ($1.25B / $73M). For a high-growth crypto protocol, a P/S ratio between 15 and 30 is quite reasonable. This suggests that the current valuation is grounded in reality, assuming our revenue estimates are in the right ballpark. This fundamental check helps validate that the market isn’t completely detached from the platform’s performance.

    Risks & What to Watch

    Investing in PUMP is not without significant risks. Here’s what you need to keep an eye on:

    • Narrative Fatigue: The memecoin trend could lose steam. If traders move on to the next big thing (like AI or DePIN), demand for Pump.fun’s services could decline.
    • Competition: The platform’s success will inevitably attract competitors. A rival with a better user experience, lower fees, or superior technology could steal market share.
    • Regulatory Risk: Regulators are increasingly scrutinizing the crypto space. Platforms that facilitate the easy launch of what could be deemed unregistered securities might face legal challenges.
    • Security: As a major hub of value, Pump.fun is a target for hackers. A significant security breach could destroy user trust and cripple the platform.

    Conclusion and Next Steps

    The future of Pump.fun is intrinsically linked to the wild, unpredictable, and exciting world of memecoins. Its innovative model has already made a massive impact, but its long-term success is far from guaranteed. Our 2028 price prediction for PUMP ranges from a bearish $0.0007 to a bullish $0.028, with a base case around $0.0084.

    Your next step as an investor is to weigh the potential upside against the very real risks. Keep a close watch on the platform’s usage metrics, the competitive landscape, and the overall sentiment in the crypto market. The journey for PUMP will likely be volatile, but for a platform at the epicenter of the memecoin universe, that’s all part of the game.

    FAQ

    What exactly is Pump.fun?
    Pump.fun is a platform on the Solana blockchain that allows users to create and launch a new cryptocurrency (typically a memecoin) instantly and with very low fees. It uses a bonding curve model for initial trading before listing tokens on a decentralized exchange like Raydium.

    Is PUMP a good investment today?
    That depends entirely on your risk tolerance. PUMP has shown strong performance, but it is a high-risk asset tied to the volatile memecoin sector. It has the potential for high rewards but also for significant losses. It’s crucial to assess if it fits your personal investment strategy.

    How is the PUMP token price determined?
    Like any other cryptocurrency, its price is determined by supply and demand on exchanges. Key factors influencing this include the success and adoption of the Pump.fun platform, overall crypto market sentiment, news related to the project, and broader speculative trends.

    What are the biggest risks for Pump.fun?
    The primary risks include a decline in the popularity of memecoins (narrative risk), the emergence of strong competitors, potential regulatory action against token launchpads, and the constant threat of security exploits or hacks.

    Could PUMP reach $0.01?
    Based on our analysis, reaching a price of $0.01 is possible within our 2028 timeframe. It would fall between our base case ($0.0084) and bull case ($0.028) scenarios. This would require the Pump.fun platform to continue its strong growth trajectory and for the overall crypto market to be in a healthy, bullish state.

    Not financial advice. Do your own research.

    Ethereum (ETH) Price Prediction: What Will ETH Price Be in 2038?

    0

    Thinking about a long-term Ethereum (ETH) Price Prediction can feel like staring into a crystal ball. With so much happening in crypto, forecasting next week is hard enough, let alone looking over a decade into the future to 2038. But by analyzing fundamental drivers, potential growth trajectories, and current market data, we can build a framework for what might be possible.

    This article is for informational purposes only and explores potential scenarios for Ethereum’s future. It is not a guarantee of future performance.

    TL;DR: Ethereum in 2038

    • Base Case Prediction: Our base scenario sees ETH reaching a price range of $60,000 to $85,000 by 2038, driven by its establishment as the foundational settlement layer for a significant portion of the decentralized web and tokenized assets.
    • Bull Case Scenario: In a highly optimistic scenario, where Ethereum becomes a core pillar of the global financial system, ETH could potentially trade between $150,000 and $250,000.
    • Bear Case Scenario: Significant challenges from competitors, harsh regulations, or a failure to scale effectively could limit growth, potentially keeping ETH in the $15,000 to $30,000 range.
    • Key Drivers: Long-term value will depend on mainstream adoption of decentralized applications (dApps), the growth of the tokenized real-world asset (RWA) market, and Ethereum’s ability to maintain its network security and decentralization at scale.

    What is Ethereum (ETH)? A Quick Refresher

    Before we look forward, let’s quickly recap what Ethereum is. Unlike Bitcoin, which is primarily a store of value like digital gold, Ethereum is a decentralized, global software platform. Its currency, Ether (ETH), is used to power the network.

    Think of it like a global computer that anyone can use but no single person or company owns. Developers can build applications on it, from financial tools (DeFi) to digital art (NFTs) and gaming platforms. ETH acts as the fuel for these applications, used to pay transaction fees (known as “gas”) and secure the network through staking. This utility is central to any long-term valuation.

    Current Market Conditions

    To understand where we might go, we have to know where we are. As of today, the market is sending a few key signals:

    • Current Price: $4,469.61
    • Market Capitalization: Approximately $540 billion
    • 24-Hour Trading Volume: Over $21 billion

    Interpreting this data, we see an asset that is clearly established. A half-trillion-dollar market cap places Ethereum in the league of major global companies. It’s not a small, speculative startup anymore. The significant daily volume also shows deep liquidity, meaning there is a robust and active market for buying and selling ETH.

    The recent price action tells a mixed story. A strong 27% gain over the last 30 days indicates powerful bullish momentum, likely driven by positive market sentiment and specific catalysts. However, the 6.4% dip over the last week suggests some profit-taking and short-term consolidation. This kind of volatility is normal in crypto, but the larger monthly trend points toward strong investor confidence.

    On-Chain and Narrative Drivers for Long-Term Growth

    Predicting price over 14 years is less about short-term charts and more about the big-picture story and fundamental network growth. The core drivers for Ethereum’s value come from its utility and the economic activity it supports.

    One of the biggest narratives is Ethereum’s transition to a deflationary asset following “The Merge.” Because a portion of transaction fees are “burned” (permanently removed from supply), high network usage can lead to the total supply of ETH decreasing over time. If demand for ETH stays constant or increases while supply shrinks, basic economics dictates that its price should rise. This “ultrasound money” narrative is a powerful long-term tailwind.

    Furthermore, the growth of Layer 2 scaling solutions like Arbitrum, Optimism, and Polygon is crucial. These networks help Ethereum handle more transactions at a lower cost, offloading activity from the main blockchain. Instead of being competitors, they are best seen as extensions of Ethereum’s ecosystem. As they grow, they settle their transactions back to the secure Ethereum mainnet, increasing demand for ETH as the ultimate settlement and data availability layer.

    An Ethereum (ETH) Price Prediction for 2038: Three Scenarios

    Forecasting over such a long horizon requires thinking in scenarios, not certainties. We’ll use the current price of ~$4,500 as our starting point.

    Bear Case: The Stagnation Scenario ($15,000 – $30,000)

    In this scenario, Ethereum faces significant headwinds. A competing Layer 1 blockchain might finally deliver on the promise of being an “Ethereum killer,” siphoning away developers and users with superior technology. Or, a severe global regulatory crackdown could stifle innovation in the DeFi and Web3 sectors, limiting Ethereum’s total addressable market.

    A price of $20,000 would represent a market cap of roughly $2.4 trillion, assuming a similar token supply. This reflects growth but suggests Ethereum failed to capture a dominant share of the future digital economy, instead becoming one of many successful smart contract platforms in a fragmented market. This scenario represents an approximate 4.4x return from today, or a compounded annual growth rate (CAGR) of about 11%.

    Base Case: The Digital Infrastructure Scenario ($60,000 – $85,000)

    This is our most probable scenario. Here, Ethereum solidifies its position as the primary settlement layer for the decentralized internet. It doesn’t “win” everything, but it becomes the equivalent of a foundational protocol like TCP/IP, upon which vast economic value is built, especially in DeFi, NFTs, and the tokenization of real-world assets.

    A price of $75,000 would give ETH a market cap of around $9 trillion. For context, gold’s market cap is currently around $15 trillion. In this future, Ethereum is seen as a core productive asset for the digital economy, generating value through fees and staking yields. This price target represents a CAGR of around 22% over 14 years, a plausible growth rate for a dominant, disruptive technology platform.

    Bull Case: The Global Settlement Layer Scenario ($150,000 – $250,000)

    In the most optimistic outcome, Ethereum becomes deeply integrated into the global financial system. Major banks use it for settlement, governments issue bonds on it, and a significant portion of global assets are tokenized on its network. Its security and decentralization become the gold standard, and ETH is treated as a “digital bond” or “internet bond” by institutional investors.

    A price of $200,000 would imply a market cap of approximately $24 trillion, surpassing the current value of gold. This assumes Ethereum has become a systemically important piece of global financial plumbing. This would require near-flawless execution, widespread mainstream adoption, and a favorable regulatory environment. This scenario reflects a CAGR of roughly 31%.

    Simple Valuation: A Back-of-the-Envelope Model

    How can we sanity-check these numbers? Let’s try a simple valuation based on network revenue (transaction fees and MEV).

    1. Assumptions:

      • Let’s assume the global financial services industry, a multi-trillion dollar market, sees just 5% of its value transacted or settled on Ethereum by 2038.
      • Let’s assume the network can generate revenue (fees + MEV) equal to 0.5% of the total economic value it secures and settles.
      • Investors might value the network at a 20x multiple of its annual revenue, treating it like a high-growth tech or financial infrastructure company.
    2. Calculation:

      • Global Financial Services TAM: ~$25 trillion (and growing). 5% of this is $1.25 trillion in annual economic throughput on Ethereum.
      • Network Revenue: 0.5% of $1.25 trillion = $62.5 billion in annual revenue.
      • Network Valuation (Market Cap): $62.5 billion x 20 = $1.25 trillion.
      • Implied ETH Price: With a supply of ~120 million ETH, this gives a price of roughly $10,400 per ETH.

    This simple model lands us below our bear case, highlighting the difficulty of long-term predictions and the importance of assumptions. If Ethereum captures a larger share of the market or commands a higher valuation multiple (like many high-growth tech stocks do), the numbers align more closely with our base or even bull cases. For example, a 10% market capture and a 30x multiple would yield a price of ~$31,000, aligning with our bear case to lower-end base case.

    Risks and What to Watch

    The road to 2038 is filled with obstacles. Keep an eye on these key areas:

    • Competition: While Ethereum has a massive head start, projects like Solana, Avalanche, and future newcomers will continue to compete for market share.
    • Regulation: The biggest unknown. A clear and supportive regulatory framework could unlock institutional adoption, while a hostile one could severely hinder growth.
    • Scalability and User Experience: Ethereum and its Layer 2s must continue to improve to handle billions of users. If the user experience remains complex and expensive, mainstream adoption will stall.
    • Security: A catastrophic bug or hack on a major protocol or the core Ethereum chain itself could destroy trust and value.

    Conclusion and Next Steps

    Making an Ethereum (ETH) Price Prediction for 2038 is a speculative exercise, but one grounded in the project’s immense potential to reshape finance and the internet. The path forward depends on sustained innovation, user adoption, and a clear regulatory landscape.

    For investors, the key isn’t to fixate on a single price target. Instead, focus on the underlying thesis. Do you believe in the growth of a decentralized internet? Do you think tokenization of assets is the future? If so, Ethereum is arguably the best-positioned asset to capture a significant portion of that value. The next step is to continue learning about the ecosystem, understanding the risks, and deciding if it aligns with your long-term investment goals.

    Frequently Asked Questions (FAQ)

    1. Can Ethereum really reach $100,000?
    Theoretically, yes. A price of $100,000 would imply a market cap of around $12 trillion, which is less than the current market cap of gold. If Ethereum becomes a foundational layer for a new digital economy, such a valuation is within the realm of possibility, though it remains a highly optimistic bull case.

    2. What is the biggest risk to Ethereum’s future price?
    Regulatory risk is arguably the biggest external threat. Unfavorable laws or a ban on decentralized finance in major economies could severely limit its growth potential. Internally, the biggest risk is a failure to scale effectively to meet mainstream demand, which could cause users to migrate to competing blockchains.

    3. Does Bitcoin’s price affect Ethereum’s price?
    Yes, historically, the crypto markets have been highly correlated. Bitcoin, as the largest and most established cryptocurrency, often leads the market. A major bull or bear market for Bitcoin will almost certainly have a strong impact on Ethereum’s price, though this correlation may weaken over time as Ethereum’s own utility and ecosystem mature.

    4. How does staking and deflation affect the ETH price prediction?
    Staking (locking up ETH to secure the network) reduces the circulating supply available for sale. Combined with the fee-burning mechanism that can make ETH deflationary, these factors create supply-side constraints. If demand for ETH increases due to network activity, this reduced available supply can act as a powerful catalyst for price appreciation.

    Not financial advice. Do your own research.

    Polygon (POL) Price Prediction: What Will POL Price Be in 2044?

    0

    Thinking about a Polygon (POL) price prediction for 2044 feels like trying to predict the weather two decades from now. It’s a fascinating thought exercise, but one packed with uncertainty. Still, by looking at the fundamentals of Polygon’s evolution into the POL ecosystem, current market signals, and long-term crypto trends, we can build a few educated scenarios. Let’s break down what the future might hold for POL.

    TL;DR: Quick Forecast

    • What is POL? POL is the upgraded token for the Polygon 2.0 ecosystem, designed to secure a network of interconnected chains. It replaces MATIC, enabling holders to validate multiple chains and earn rewards.
    • Current Momentum: The market is showing strong short-to-medium term bullishness. With double-digit gains over the last week and month, it’s clear that investor interest is high, backed by significant trading volume.
    • Long-Term Outlook: The success of POL is entirely dependent on Polygon 2.0’s vision of becoming the “value layer” of the internet. Adoption by developers and users is the single most important factor.
    • 2044 Price Scenarios: Our analysis points to a wide range, from a bearish outcome under $2 to a highly optimistic bull case potentially exceeding $40, heavily contingent on the total crypto market’s growth and Polygon’s market share.

    What is POL? A Quick Refresher

    You might know Polygon by its original token, MATIC. The transition to POL is more than just a name change; it’s a fundamental technological upgrade. Polygon 2.0 aims to create a network of interconnected blockchains, all powered and secured by the POL token.

    Think of it this way: MATIC was designed to secure a single chain (the Polygon PoS chain). POL is designed to be a “hyper-productive” token, allowing stakers to secure multiple chains within the Polygon ecosystem simultaneously. This re-staking mechanism means validators can earn more rewards, making the entire network more secure and decentralized. POL is the key to unlocking Polygon’s ambitious future as a scalable, unified web of blockchains.

    Current Market Conditions

    Let’s look at the live data to get a feel for the market’s current temperature. As of today, POL is trading at approximately $0.2757. Its market capitalization stands at a robust $2.89 billion, with a 24-hour trading volume of over $385 million.

    What does this tell us? The recent price action is incredibly strong. A 13.3% jump in 24 hours and a 37% gain over the last 30 days signal powerful buying pressure. The volume-to-market-cap ratio is also healthy, suggesting that these price moves are backed by genuine trading activity and not just thin air. While the 1-hour chart shows a tiny pullback, this is normal consolidation after a strong upward move. The overall sentiment, based on these numbers, is decidedly bullish in the short term.

    On-Chain & Narrative Drivers

    Looking beyond the numbers, the core narrative driving POL is the Polygon 2.0 upgrade. The entire crypto space is focused on scalability and interoperability—the ability for different blockchains to communicate and work together. Polygon is positioning POL as the central pillar of its solution to this challenge.

    If Polygon successfully becomes the go-to platform for building and connecting ZK-powered layer-2 chains, the demand for POL will skyrocket. Validators will need POL to secure these chains, and projects may need it for governance or transaction fees. This isn’t just about one successful application; it’s about becoming the foundational infrastructure for thousands of future applications. The story is compelling, but execution is everything.

    Polygon (POL) Price Prediction: 2044 Scenarios

    Forecasting 20 years into the future is highly speculative. We are making broad assumptions about the growth of the entire digital asset space. The following scenarios are based on fundamental logic, not short-term technical analysis, which is not applicable over such a long time horizon. Our analysis uses the POL token’s projected future supply, which, with a 2% annual inflation rate, could be around 14 to 15 billion tokens by 2044.

    Bear Case: Stagnation and Competition ($0.80 – $2.50)

    In a bearish scenario, Polygon 2.0 fails to capture significant market share. Fierce competition from other L2s like Arbitrum and Optimism, as well as new Layer 1s, erodes its developer base. The crypto market as a whole grows, but not exponentially, perhaps reaching a total market cap of $10 trillion. If Polygon’s ecosystem captures just 0.2% of this market, POL’s market cap would be $20 billion. Divided by a future supply of 15 billion tokens, this gives us a price of around $1.33.

    Base Case: Steady Growth and Adoption ($8.00 – $15.00)

    Our base case assumes the crypto market matures significantly, becoming a core part of the global financial system with a total market cap of $25 trillion. In this future, Polygon 2.0 is a major player but not the sole dominant force. It successfully carves out a niche as a reliable, interconnected network for DeFi, gaming, and enterprise applications, capturing 1% of the total crypto market. This would put POL’s market cap at $250 billion. With a 15 billion token supply, the price per POL would be approximately $16.67.

    Bull Case: The Value Layer of the Internet ($25.00 – $45.00+)

    In the most optimistic scenario, Polygon’s vision is fully realized. It becomes the essential “value layer” for a decentralized internet, and the total crypto market cap explodes to $50 trillion or more. Polygon’s superior technology and network effects allow it to capture a dominant 3% market share. This would result in a staggering $1.5 trillion market cap for POL. Dividing this by 15 billion tokens yields a price of $100. This is a highly ambitious target, but it illustrates the potential if everything goes right. A more grounded bull case might see it capture 1.5% of a $50T market, leading to a $50 price per POL.

    Simple Valuation Back-of-the-Envelope

    Let’s simplify the math. The core idea is to estimate the future value of the entire crypto market and then guess what percentage of that value Polygon’s ecosystem will represent.

    1. Future Total Crypto Market Cap: Let’s use our base case of $25 trillion by 2044 (roughly the current market cap of the S&P 500).
    2. Polygon’s Market Share: Assume Polygon 2.0 becomes a key infrastructure player, similar to a major cloud provider today, and secures 1.0% of the market.
    3. POL’s Future Market Cap: $25 trillion * 1.0% = $250 billion.
    4. POL’s Future Supply: Starting with 10 billion and adding 2% annually for 20 years gives us roughly 14.86 billion tokens. Let’s round to 15 billion for simplicity.
    5. Implied POL Price: $250 billion / 15 billion tokens = $16.67 per POL.

    This simple model shows how sensitive the price is to these two big assumptions: total market growth and Polygon’s ability to compete and win.

    Risks & What to Watch

    The path to 2044 is filled with obstacles. The biggest risk is competition. The L2 space is brutal, and a new technology could emerge that makes Polygon’s approach obsolete. Execution risk is another major factor; the Polygon team must deliver on its complex and ambitious 2.0 roadmap.

    Finally, regulation remains a massive unknown. A hostile global regulatory environment could stifle the growth of the entire crypto industry, impacting all assets, including POL. Keep an eye on developer activity on Polygon, the number of chains joining the ecosystem, and the overall growth of its user base. These are the real-time indicators of its long-term health.

    Conclusion

    The journey from MATIC to POL marks a pivotal moment for the Polygon ecosystem. Its future price isn’t just about market hype; it’s about whether it can become the foundational plumbing for a new, decentralized internet. While the recent price action is encouraging, the 20-year view requires a belief in the team’s vision and their ability to out-innovate the competition.

    For investors, this means focusing on the fundamentals. Is the ecosystem growing? Are developers building on it? Does the technology work as promised? Answering these questions will provide a much clearer picture than any price chart alone. The potential is immense, but the road ahead is long and uncertain.

    FAQ

    What is the difference between MATIC and POL?
    MATIC was the original token for securing the Polygon Proof-of-Stake chain. POL is the upgraded token for the Polygon 2.0 ecosystem, designed for “re-staking,” which allows it to secure multiple interconnected chains, enhancing both security and utility.

    Is POL a good long-term investment?
    POL has a strong technological vision and a proven team. Its long-term value depends entirely on the successful adoption of the Polygon 2.0 network. Like any crypto asset, it carries significant risk but also offers high potential rewards if its goals are achieved.

    What is a realistic Polygon (POL) price prediction for the next bull run?
    While this article focuses on 2044, a shorter-term prediction for the next bull run (e.g., 2025-2026) would depend on market-wide sentiment. If Bitcoin reaches new all-time highs, many analysts believe POL could challenge its previous MATIC all-time high of around $2.92 and potentially push into the $3-$5 range, assuming the 2.0 rollout continues successfully.

    How high can POL’s price go?
    In a hyper-bullish, long-term scenario where the crypto market cap reaches tens of trillions and Polygon becomes a dominant infrastructure layer, prices of $25-$50 are theoretically possible. However, this is highly speculative and assumes near-perfect execution and massive market growth.

    Not financial advice. Do your own research.

    Dolomite (DOLO) Price Prediction: What Will DOLO Price Be in 2038?

    0

    Thinking about a Dolomite (DOLO) price prediction for 2038 is an exercise in long-term strategic thinking. With the crypto market moving at lightning speed, forecasting over a decade into the future is challenging, but it helps us understand a project’s potential trajectory. This analysis will break down the current market sentiment for DOLO, explore potential drivers, and map out a few possible scenarios for its price by 2038, grounded in realistic assumptions.

    Before we dive in, please remember this article is for informational purposes only. It is not financial advice. The cryptocurrency market is highly volatile, and you should always conduct your own research before making any investment decisions.

    TL;DR: Quick Forecast

    • Current State: DOLO is experiencing intense short-term interest, with a 35% price surge in the last 24 hours and an 85% gain over the past month. Its trading volume is currently higher than its market cap, signaling high speculation.
    • Bearish Scenario (2038): If Dolomite fails to innovate or the broader crypto market stagnates, DOLO could fall to the $0.05 – $0.20 range as liquidity dries up and relevance fades.
    • Base Scenario (2038): Assuming Dolomite grows with the overall crypto market and maintains its relevance, a price target of $2.50 – $5.00 is conceivable, reflecting steady adoption and network effects.
    • Bullish Scenario (2038): If Dolomite becomes a leader in its niche and captures significant market share within a multi-trillion dollar crypto ecosystem, DOLO could potentially reach the $12 – $20 range.

    What is Dolomite (DOLO)?

    Dolomite is a decentralized finance (DeFi) protocol that functions as a money market and margin trading exchange. It allows users to lend, borrow, and trade assets with leverage directly from their wallets, without relying on a central intermediary. The protocol aims to combine the core functions of several DeFi applications into a single, capital-efficient platform.

    The native token, DOLO, is central to its ecosystem. It is likely used for governance, allowing holders to vote on proposals that shape the protocol’s future. It may also be used for staking to secure the network or to receive a share of the protocol’s revenue, creating a direct incentive for long-term holding and participation.

    Current Market Conditions

    To understand where DOLO might go, we first need to look at where it is today. As of this writing, Dolomite is priced at $0.293229. Its market capitalization stands at a modest $112.8 million, placing it firmly in the small-cap altcoin category.

    What’s most striking are the volume and price action metrics. The 24-hour trading volume is a massive $167.2 million, which is over 140% of its entire market cap. This volume-to-market-cap ratio is exceptionally high and points to intense speculative interest. Traders are rapidly moving in and out of positions. The price action confirms this volatility: while DOLO has seen a slight 0.74% dip in the last hour, it has rocketed up by 35% in the past 24 hours and a staggering 85% over the past month. This suggests the asset is in a price discovery phase, driven by strong short-term momentum.

    On-Chain & Narrative Drivers

    While we don’t have deep on-chain data at hand, the market metrics suggest a few key drivers. The high volume indicates that DOLO has captured the attention of short-term traders, likely fueled by a compelling narrative around its technology, a recent development announcement, or a broader trend in the DeFi sector that Dolomite fits into.

    For long-term success extending to 2038, the narrative must evolve from speculation to utility. Key drivers to watch will be the growth in Total Value Locked (TVL) on the platform, the number of active daily users, and the protocol revenue generated. A strong and active governance community, demonstrated by frequent and well-participated proposals, would also be a powerful long-term bullish signal. If the DOLO token accrues value from platform fees, its price will become more fundamentally anchored over time.

    Dolomite (DOLO) Price Prediction for 2038: Scenarios

    Predicting over a 14-year horizon requires us to think about macro trends. The success of DOLO will depend less on short-term charts and more on the overall growth of the digital asset economy and Dolomite’s ability to maintain a competitive edge.

    Bear Case: Fading into Obscurity

    In a bearish scenario, Dolomite fails to keep up with innovation. The DeFi space is fiercely competitive, and new, more efficient protocols could emerge, rendering Dolomite’s technology obsolete. Regulatory pressure on decentralized margin trading could also stifle growth.

    In this future, user activity would decline, TVL would bleed out, and the DOLO token’s utility would diminish. By 2038, it could become a “ghost token” with low liquidity and a forgotten community.

    Price Target (2038): $0.05 – $0.20

    Base Case: Keeping Pace with the Market

    In our base case, the crypto market as a whole continues its adoption curve, reaching a total market capitalization of $15-20 trillion by 2038. Dolomite successfully carves out a sustainable niche in the DeFi ecosystem. It may not be the top protocol, but it maintains a loyal user base by consistently upgrading its platform and offering reliable service.

    The DOLO token would derive its value from a steady stream of protocol revenue and active governance. Its market cap would grow in line with the broader DeFi sector, reflecting solid but not spectacular performance.

    Price Target (2038): $2.50 – $5.00

    Bull Case: A DeFi Blue Chip

    In the most optimistic scenario, Dolomite’s architecture proves to be a game-changer. It becomes a go-to platform for decentralized leverage and money markets, attracting deep liquidity and a massive user base. Its brand becomes synonymous with capital efficiency and security in DeFi.

    In this future, the total crypto market cap could exceed $30 trillion, and DeFi would represent a significant portion of the global financial system. As an established leader, Dolomite’s market cap could grow to rival those of today’s mid-cap financial technology companies. The DOLO token would be highly sought after for its cash flow and governance power.

    Price Target (2038): $12 – $20

    A Simple Valuation Model for a Dolomite (DOLO) Price Prediction

    Let’s build a simple back-of-the-envelope model to frame our base case. This is a thought experiment, not a guarantee.

    Assumptions for 2038:

    1. Total Crypto Market Cap: $18 Trillion (a conservative 8-9x from today’s levels).
    2. DeFi’s Share of Market: 20% (as the sector matures, its share of the total market solidifies).
    3. Dolomite’s Share of DeFi: 0.15% (achieving a small but meaningful slice of the pie).
    4. DOLO Circulating Supply: 500 million tokens (assuming some inflation from today’s supply).

    Calculation:

    • DeFi Market Cap in 2038: $18 Trillion * 20% = $3.6 Trillion
    • Dolomite’s Market Cap in 2038: $3.6 Trillion * 0.15% = $5.4 Billion
    • Projected DOLO Price: $5.4 Billion / 500 Million tokens = $10.80

    This simple model lands between our base and bull scenarios, showing that a price well above current levels is mathematically plausible if the project and the market mature successfully.

    Risks & What to Watch

    Investing in DOLO is not without risks. Here’s what to keep an eye on:

    • Competition: The DeFi space is relentless. Competitors could offer better rates, lower fees, or superior technology, eroding Dolomite’s market share.
    • Smart Contract Risk: As with any DeFi protocol, there is always a risk of bugs or exploits in the code that could lead to a catastrophic loss of funds.
    • Regulatory Headwinds: Regulators worldwide are still deciding how to approach DeFi, particularly protocols offering leverage. Unfavorable regulations could severely impact Dolomite’s operations.
    • Tokenomics: The long-term value of DOLO depends heavily on its tokenomics. Watch for any changes to supply inflation, utility, and value accrual mechanisms.

    Conclusion and Next Steps

    The long-term Dolomite (DOLO) price prediction hinges on its ability to transition from a speculative, high-volume asset to a fundamentally sound DeFi protocol with real utility. The current market action is exciting, but the journey to 2038 will be a marathon, not a sprint.

    For potential investors, the next steps are clear. Look beyond the daily price charts and dig into the project’s fundamentals. Join their community on Discord or Telegram, read their documentation, and track key metrics like TVL and user growth. A successful investment over the next decade will depend on the team’s ability to execute and adapt in the ever-changing crypto landscape.

    FAQ

    Is Dolomite (DOLO) a good long-term investment?
    That depends on your risk tolerance and belief in the future of DeFi. DOLO is a small-cap altcoin with high potential upside but also significant risk. Its success depends on sustained innovation and adoption in a very competitive sector.

    What could make the price of DOLO go up?
    Key catalysts would include major protocol upgrades, partnerships with other large projects, a significant increase in the platform’s Total Value Locked (TVL), and the implementation of mechanisms that drive revenue back to DOLO token holders.

    How high could DOLO realistically go by 2038?
    In a very bullish scenario where the crypto market grows substantially and Dolomite becomes a key DeFi player, a price target of $12 to $20 is possible. This would require its market cap to grow to the multi-billion dollar range, which is a significant but not impossible feat over 14 years.

    What is the biggest risk for Dolomite?
    The biggest risk is likely competition. The DeFi landscape is saturated with well-funded and innovative projects. Dolomite must continuously prove its value and technological edge to stay relevant and attract users and liquidity.

    Not financial advice. Do your own research.

    Mitosis (MITO) Price Prediction: What Will MITO Price Be in 2028?

    0

    With the crypto space constantly evolving, investors are always on the lookout for the next project that could redefine a sector. Mitosis (MITO), a novel modular liquidity protocol, has recently entered the market, sparking conversations and speculation. This article provides a detailed Mitosis (MITO) Price Prediction, exploring potential scenarios for its value by 2028 based on current data, market narratives, and fundamental analysis.

    TL;DR: Quick Forecast

    • High Volatility Start: MITO has launched with significant volatility, evidenced by a 24-hour volume exceeding its market cap and a sharp price correction. This is common for new tokens and signals a period of price discovery.
    • Narrative is Key: Mitosis sits at the intersection of powerful crypto trends: modularity, interoperability, and liquid restaking. Its success will heavily depend on how well it executes within these narratives.
    • 2028 Bear Case: If Mitosis fails to attract users and TVL, facing stiff competition and a fading narrative, the price could fall to the $0.07 – $0.15 range.
    • 2028 Base Case: With steady development, key partnerships, and solid adoption, MITO could establish itself as a notable player, potentially reaching a price of $0.50 – $0.85.
    • 2028 Bull Case: In a strong bull market where Mitosis becomes an essential piece of cross-chain infrastructure, the price could potentially target $2.50 – $4.00.

    What is Mitosis (MITO)?

    Before diving into price predictions, let’s quickly recap what Mitosis is. In simple terms, Mitosis is a modular liquidity protocol. Its main goal is to solve the problem of fragmented liquidity across the growing number of blockchains, Layer 2s, and rollups.

    Instead of having assets siloed on different chains (like Ethereum, Solana, or Arbitrum), Mitosis aims to create a more efficient, unified liquidity layer. It leverages the concepts of liquid restaking and modular architecture to allow assets to be used across multiple ecosystems without complex bridging. The MITO token is central to its ecosystem, likely used for governance, security, and incentivizing liquidity providers.

    Current Market Conditions: A Picture of Volatility

    To understand where MITO might go, we first need to look at where it is now. Here are the current metrics:

    • Current Price: $0.200197
    • Market Cap: $39,261,513
    • 24h Volume: $41,246,017
    • Price change (24h): -35.05%

    The most striking detail here is that the 24-hour trading volume is higher than the entire market cap. This is a clear sign of intense, speculative trading activity, which is typical for a newly launched token. The significant -35% price drop in the same period suggests that early investors or airdrop recipients may be taking profits after the initial listing pump. This “price discovery” phase is often chaotic and doesn’t necessarily reflect the project’s long-term potential, but it highlights the high risk involved right now.

    On-Chain & Narrative Drivers for a Mitosis (MITO) Price Prediction

    While a detailed technical analysis is impossible without historical price data, we can analyze the fundamental drivers that will influence MITO’s price journey to 2028.

    The primary driver for Mitosis is its narrative. The crypto industry is betting big on a multi-chain future, but that future only works if value can move seamlessly between chains. Protocols that solve this interoperability problem are poised for massive growth. Mitosis’s focus on “modular liquidity” is a fresh take on this, appealing to the developer-focused trend of building flexible, specialized blockchain components. If they can successfully embed themselves as the go-to liquidity solution for new and existing chains, the demand for MITO could skyrocket.

    However, a strong narrative is not enough. The key metrics to watch will be on-chain. The most critical one is Total Value Locked (TVL), which represents the amount of assets users have deposited into the protocol. Consistent TVL growth is the clearest sign of product-market fit and user trust. Other important factors include the number of chains it integrates with, the volume of cross-chain transactions it facilitates, and strategic partnerships with major blockchain ecosystems. Without this adoption, the narrative is just talk.

    MITO Price Scenarios for 2028

    Predicting prices four years out is speculative, but we can build logical scenarios based on potential market cap growth and token supply. A crucial factor is MITO’s token supply. With a total supply of 1 billion tokens and a current circulating supply of roughly 196 million, we must account for significant token emissions over the next few years. For these scenarios, we will assume a circulating supply of 700 million MITO by 2028.

    Bear Case: Fails to Launch ($0.07 – $0.15)

    In a bearish scenario, Mitosis struggles to gain a foothold. The competition from established players like Wormhole and upcoming giants like LayerZero proves too intense. The protocol may face technical hurdles, fail to attract significant TVL, or the modular liquidity narrative might not resonate as strongly as expected. In this future, the market cap stagnates or declines, hovering in the $50M – $100M range. This would place the MITO price between $0.07 and $0.15.

    Base Case: Finds a Niche ($0.50 – $0.85)

    Our base case assumes Mitosis successfully executes its roadmap. It carves out a niche in the cross-chain world, perhaps becoming the preferred liquidity solution for a specific ecosystem like Cosmos or a cluster of new Layer 2s. The protocol demonstrates security and reliability, attracting a respectable TVL. In a healthy crypto market, this could lead to a market cap in the $350M – $600M range, similar to today’s solid mid-cap infrastructure projects. This translates to a potential MITO price of $0.50 to $0.85.

    Bull Case: Becomes Essential Infrastructure ($2.50 – $4.00)

    The bull case is where things get exciting. Here, Mitosis not only delivers on its promises but becomes a critical, underlying piece of cross-chain infrastructure. Its modular approach is validated, and it captures a significant share of the multi-chain value transfer market. This would be driven by a major bull run in the broader crypto market. If Mitosis achieves a market cap of $1.75B – $2.8B, which is comparable to top-tier interoperability projects in a bull market, the MITO price could reach a range of $2.50 to $4.00.

    A Simple Valuation Model

    Let’s do a quick, back-of-the-envelope valuation to ground our predictions. We can use a comparative analysis.

    Let’s look at the market cap of an established interoperability project like Wormhole (W), which has a fully diluted valuation often sitting in the multi-billion dollar range.

    • Assumption: By 2028, the total market for cross-chain value transfer has grown significantly.
    • Logic: If Mitosis can capture just 10-15% of the market share held by a leader like Wormhole during a bull cycle, its market cap could realistically reach the $1.5B to $2.5B range.
    • Calculation (Base Case): $400,000,000 Market Cap / 700,000,000 Circulating Supply = ~$0.57 per MITO.
    • Calculation (Bull Case): $2,000,000,000 Market Cap / 700,000,000 Circulating Supply = ~$2.85 per MITO.

    This simple model shows how our scenarios are tied to capturing a tangible piece of a valuable and growing market.

    Risks & What to Watch

    Investing in a new project like Mitosis carries significant risks. Here’s what you need to keep an eye on:

    • Competition: This space is incredibly crowded. Mitosis is up against well-funded and established competitors.
    • Execution Risk: The team needs to deliver a secure, efficient, and user-friendly product. Any technical failures or delays could be detrimental.
    • Token Inflation: With over 80% of the total supply yet to enter circulation, sell pressure from team, investor, and ecosystem unlocks could suppress the price. Carefully watch the token release schedule.
    • Smart Contract Risk: Like any DeFi protocol, Mitosis is vulnerable to hacks and exploits, which could lead to a total loss of funds.

    The key indicators to monitor are TVL growth, the announcement of major ecosystem integrations, and the general health and activity of its community.

    Conclusion and Next Steps

    The journey for Mitosis is just beginning. Its positioning within the powerful modularity and interoperability narratives gives it a strong foundation and a high ceiling for potential growth. However, its success is far from guaranteed. The current volatility is a stark reminder of the risks involved in early-stage crypto projects.

    For investors considering MITO, the path forward is clear: watch, learn, and verify. Keep a close eye on the team’s progress, track on-chain metrics like TVL, and understand the competitive landscape. While a price of over $2.00 is possible by 2028 in a bullish outcome, a fall below its current price is equally plausible if the project fails to deliver.

    FAQ

    Is MITO a good investment in 2024?
    MITO is a high-risk, high-reward investment. It is a very new project in a competitive sector. Its potential is high, but so is the risk of failure. Whether it’s a “good” investment depends entirely on your personal risk tolerance and investment strategy.

    What problem does Mitosis aim to solve?
    Mitosis aims to solve liquidity fragmentation in the multi-chain crypto ecosystem. It provides a modular framework for assets to move and be utilized across different blockchains more efficiently, creating a more unified financial environment.

    How does Mitosis compare to competitors like LayerZero or Wormhole?
    While all operate in the interoperability space, Mitosis differentiates itself with a focus on modularity and its integration of liquid restaking concepts. This “modular liquidity” approach is designed to be more flexible and adaptable for developers building new chains and applications, which could be a key advantage.

    What is the impact of MITO’s tokenomics on its price?
    The tokenomics will have a huge impact. A large portion of the total supply is not yet circulating. This future supply will be released over time, creating potential sell pressure. It is crucial for the protocol to generate enough demand and utility for the MITO token to absorb this new supply.

    Not financial advice. Do your own research.

    Solana (SOL) Price Prediction: What Will SOL Price Be in 2034?

    0

    Wondering where the high-speed blockchain could be headed in the next decade? You’re not alone. Our Solana (SOL) Price Prediction for 2034 aims to cut through the noise, providing a level-headed analysis based on current data, technological trends, and potential market scenarios. We’ll explore what could drive Solana’s growth and the risks that could stand in its way, giving you a comprehensive look at its long-term potential.

    TL;DR: Solana Price in 2034

    • Current State: Solana is a top-performing blockchain with a current price of $203.49 and a market cap exceeding $110 billion. It’s showing strong monthly gains despite some short-term volatility.
    • Key Drivers: Growth is fueled by its booming DeFi ecosystem, its status as the go-to chain for memecoins, growing adoption in DePIN (Decentralized Physical Infrastructure), and the anticipated performance boost from the Firedancer upgrade.
    • Long-Term Potential: A decade is a lifetime in crypto. Solana’s success depends on maintaining its technological edge, attracting developers and users, and navigating regulatory landscapes.
    • 2034 Price Scenarios: Our analysis projects a wide range of possibilities over the next ten years. A conservative base case places SOL in the $750 to $1,500 range, while a bull case could see it surpass $3,000, contingent on mass adoption and market expansion.

    What is Solana (SOL)? A Quick Refresher

    Before we look forward, let’s quickly glance back. Solana is a high-performance blockchain designed for speed and scalability. Think of it as a super-fast highway for decentralized applications (dApps) and crypto transactions. Its key selling point is its ability to process tens of thousands of transactions per second for a fraction of a penny.

    This efficiency has made it a favorite for developers building everything from decentralized exchanges and lending platforms to NFT marketplaces and blockchain-based games. The native token, SOL, is used to pay for transaction fees, secure the network through staking, and participate in governance. In a world of slow and expensive blockchains, Solana offers a compelling, high-throughput alternative.

    Interpreting the Current Market Conditions

    As of today, Solana is trading at $203.49. Its market capitalization is a hefty $110 billion, cementing its place as a top-tier crypto asset. The 24-hour trading volume is an impressive $13.5 billion, which tells us there is a massive amount of interest and activity surrounding SOL right now. High volume is a sign of a healthy, liquid market.

    Let’s break down the recent price action:

    • 1-Hour: A modest 1.18% gain shows some positive short-term momentum.
    • 24-Hours: A -4.72% dip suggests a minor pullback or profit-taking after a recent run-up. This kind of volatility is normal.
    • 7-Day: A 2.16% increase indicates a relatively stable to slightly bullish week.
    • 30-Day: A strong 15.99% gain highlights a powerful bullish trend over the past month.

    Overall, the data paints a picture of an asset in high demand. While there’s daily volatility, the monthly trend is clearly positive. Investors are actively trading and accumulating SOL, confident in its recent performance and future narrative.

    On-Chain Activity and Narrative Drivers

    Beyond the price, the real story lies in what’s happening on the Solana network itself. While we don’t have a live feed of every on-chain metric here, we can analyze the powerful narratives that are attracting users and capital to the ecosystem. These are the engines that could propel its growth toward 2034.

    One of the biggest drivers has been the explosion of activity in decentralized finance (DeFi) and memecoins. Solana’s low fees and high speed make it the perfect playground for traders, leading to the rise of decentralized exchanges like Jupiter and a frenzy around tokens like WIF and BONK. This activity, while speculative, has onboarded millions of new users to the Solana ecosystem. More importantly, it has stress-tested the network, proving its ability to handle immense transaction volume.

    Beyond the hype, serious development is underway. The upcoming “Firedancer” validator client, developed by Jump Crypto, is expected to dramatically increase Solana’s transaction capacity and network reliability, addressing past concerns about network outages. Furthermore, Solana is becoming a leader in DePIN, with projects like Helium (decentralized wireless) and Render (decentralized GPU rendering) migrating to its network for its superior performance. This signals a vote of confidence from established projects and expands Solana’s use case beyond just finance and speculation.

    A Solana (SOL) Price Prediction for 2034

    Forecasting a price ten years out is an exercise in structured speculation, not a guarantee. The crypto market is influenced by four-year cycles, technological breakthroughs, and global macroeconomic trends. Below, we outline three potential scenarios for SOL’s price in 2034, based on different assumptions about its growth and adoption.

    Bear Case: Stagnation and Competition ($50 – $250)

    In a bearish scenario, Solana fails to overcome its key challenges. Persistent network stability issues, even after Firedancer, could erode user trust. Fierce competition from Ethereum’s Layer 2 solutions or a new, more advanced Layer 1 blockchain could steal its market share. In this world, the DeFi and DePIN narratives fizzle, regulatory headwinds suppress the entire crypto market, and Solana loses its momentum. By 2034, it would likely be a legacy chain with a diminished user base, causing its price to fall back toward support levels seen in previous cycles.

    Base Case: Solidified Top-Tier Player ($750 – $1,500)

    This is our most probable scenario. In the base case, Solana successfully implements Firedancer, cementing its reputation as a reliable and incredibly fast network. It continues to capture a significant share of DeFi, gaming, and DePIN activity. The broader crypto market continues its growth, achieving a total market capitalization of around $10-15 trillion. Solana solidifies its position as one of the top 3-5 most important smart contract platforms. It doesn’t “kill” Ethereum, but it thrives alongside it as a key pillar of the decentralized web. This steady, sustained growth and adoption would justify a significant increase in its network value and token price.

    Bull Case: The Consumer Blockchain Leader ($3,000 – $5,000+)

    In the most optimistic scenario, Solana achieves mass adoption. It becomes the go-to blockchain for consumer-facing applications, payments, and social media, onboarding hundreds of millions, if not billions, of users. Its speed and low cost make it feel seamless, like using the traditional internet. A spot Solana ETF is approved, unlocking a flood of institutional capital. In this future, Solana isn’t just a part of the crypto world; it’s a foundational layer of the global financial and digital infrastructure. Capturing even a small percentage of global commerce would send its network valuation, and the SOL price, to unprecedented heights.

    A Simple Valuation for 2034

    Let’s try a quick back-of-the-envelope calculation to ground our base case. This is a simplified model, but it helps frame the potential.

    Assumptions:

    1. Total Crypto Market Cap in 2034: $12 Trillion (a reasonable growth from today’s ~$2.5T).
    2. Solana’s Market Dominance: 6% (assuming it remains a top-tier player).
    3. SOL Circulating Supply in 2034: ~750 million (accounting for token inflation over the decade).

    Calculation:

    • Solana’s Future Market Cap: $12,000,000,000,000 * 0.06 = $720,000,000,000
    • Predicted SOL Price: $720,000,000,000 / 750,000,000 = $960 per SOL

    This simple model shows that a price near $1,000 is plausible under a conservative set of growth assumptions for the overall market and for Solana’s place within it.

    Risks and What to Watch

    Investing in SOL is not without risks. Its biggest historical challenge has been network instability, and the success of Firedancer is critical to putting those fears to rest. There are also debates about its relative decentralization compared to other networks like Ethereum.

    Looking ahead, here are the key things to watch:

    • The Firedancer Launch: A smooth and successful rollout is arguably the most important catalyst for Solana’s future.
    • Developer and User Growth: Are new projects still building on Solana? Is the number of active wallets growing? These are the ultimate signs of a healthy ecosystem.
    • Institutional Adoption: Keep an eye on news about a potential Solana ETF and other institutional-grade products.
    • Competition: Pay attention to the progress of Ethereum’s Layer 2s and other competing blockchains.

    Conclusion: A Bright but Challenging Road Ahead

    Solana has established itself as a technological powerhouse with a vibrant and rapidly growing ecosystem. Its focus on speed and low costs gives it a clear advantage in the race to build scalable, user-friendly decentralized applications. The road to 2034 will be long and filled with both opportunities and challenges.

    For investors, the key is to look beyond the short-term price charts and focus on the fundamental progress of the network. If Solana can deliver on its technological promises and continue to attract the best developers and the most users, its next decade could be even more impressive than its last.

    FAQ

    1. Is it too late to invest in Solana?
    While Solana has seen massive growth, many believe its journey is just beginning. Investing at any point carries risk, but its potential for future adoption in areas like DePIN and consumer apps could still provide significant upside. It’s crucial to assess your own risk tolerance and investment horizon.

    2. Will Solana ever flip Ethereum?
    The “flippening” is a popular topic. While Solana is growing faster in some areas, Ethereum has a much larger, more established network effect and a higher degree of decentralization. A more likely scenario is a multi-chain future where both blockchains coexist and specialize in different areas, rather than one completely overtaking the other.

    3. Is the Solana network still prone to outages?
    Solana has experienced several high-profile outages in the past. However, the developer community has released numerous upgrades to improve stability. The upcoming Firedancer client is a complete redesign aimed at solving these core issues and making the network dramatically more resilient.

    4. How does SOL’s inflation affect its price?
    Solana has an inflation schedule to reward stakers for securing the network. This inflation rate is designed to decrease over time until it reaches a fixed long-term rate. While inflation increases the total supply, it can be offset by network growth, transaction fee burns, and increased demand for SOL from users and stakers.

    Not financial advice. Do your own research.