More
    Home Blog Page 64

    Pump.fun (PUMP) Price Prediction: What Will PUMP Price Be in 2040?

    0

    Ever stared at a brand-new, explosive token and wondered, “What if?” What if this isn’t just a flash in the pan? What if this becomes a foundational piece of the crypto world in the next decade or two? It’s a tantalizing thought, especially with a project as disruptive as Pump.fun. This deep dive into a speculative Pump.fun (PUMP) Price Prediction for 2040 is for anyone trying to look beyond the next 24 hours and imagine what the future could hold.

    This analysis is a thought experiment, not a crystal ball. The crypto space is notoriously unpredictable, and a 16-year forecast is purely for exploration. We will ground our speculation in logic, current data, and potential market evolution, but always remember the high-risk nature of such long-term predictions in this industry.

    TL;DR: Quick Look at PUMP in 2040

    • Bear Case: The memecoin narrative fades or Pump.fun is replaced by a superior competitor. The PUMP token could fall below $0.0001, becoming a relic of a past trend.
    • Base Case: Pump.fun maintains its position as a key memecoin launchpad, growing alongside the broader crypto market. The price could range from $0.05 to $0.15 as it solidifies its niche utility.
    • Bull Case: The platform evolves beyond memecoins to become the dominant launchpad for all sorts of speculative digital assets, capturing significant market share. The price could potentially reach $0.50 to $1.25 or higher.
    • Key Driver: The long-term survival and valuation of PUMP depend almost entirely on the platform’s ability to innovate, maintain relevance, and navigate a shifting regulatory landscape.

    What is Pump.fun (PUMP)?

    Before we can look to 2040, let’s get a quick refresher on what we’re dealing with today. Pump.fun is a platform built on the Solana blockchain that radically simplifies the process of creating and launching a memecoin. It allows anyone to launch a new token in minutes for a minimal fee, with built-in mechanisms to prevent common “rug pull” scams by ensuring liquidity is automatically created and locked once a certain market cap is reached.

    The PUMP token is intrinsically linked to this ecosystem. While its full utility is still evolving, it represents a stake in the success of the platform itself. Think of it less as a traditional utility token and more as a bet on the “memecoin factory” narrative. Its value is a direct reflection of the market’s belief in Pump.fun’s future as the go-to place for launching highly speculative, community-driven tokens.

    Current Market Conditions

    Let’s ground ourselves in the present. As of this writing, PUMP is trading at approximately $0.00455. With a market capitalization of over $1.61 billion, it’s clear the market has already assigned significant value to its potential. A 24-hour trading volume of nearly $294 million indicates that interest is not only high but also highly active. This volume is roughly 18% of its market cap, a healthy sign of liquidity and trader engagement.

    Looking at the price action, we see a story of consolidation after a powerful rally. The token is down slightly in the last hour and 24 hours (-0.017% and -2.30%, respectively), which is normal after a significant run-up. The bigger picture, however, is the explosive growth of over 33% in the past week and month. This suggests the market is in a phase of price discovery, where buyers and sellers are trying to agree on a fair value for this new and disruptive platform.

    On-Chain & Narrative Drivers

    For a token this new, traditional on-chain analysis showing years of holder behavior is impossible. Instead, we must focus on the most powerful force in the memecoin space: narrative. The narrative for Pump.fun is simple and potent: it is the pick-and-shovel play for the memecoin gold rush. Instead of betting on a single memecoin, you can bet on the “house” that facilitates the creation of thousands of them.

    Looking ahead, the key driver will be the platform’s ability to sustain this narrative. Will it remain the easiest, safest, and most popular place to launch memecoins? Success will depend on its ability to expand to other blockchains, innovate its feature set, and perhaps even capture revenue that could be funneled back to token holders. The platform’s future is tied to the broader memecoin trend. If memecoins remain a permanent, albeit volatile, fixture of the crypto landscape, Pump.fun is perfectly positioned to capitalize.

    Pump.fun (PUMP) Price Prediction Scenarios for 2040

    Projecting over 16 years in crypto is an exercise in strategic imagination. We cannot use traditional technical analysis on a token with such a short history. Instead, we will build scenarios based on the evolution of the platform and the broader crypto market, using today’s metrics as our starting point.

    Bear Scenario: A Faded Trend

    In this scenario, the memecoin craze of the 2020s proves to be a cyclical fad that ultimately dies down. A new, more efficient competitor could emerge, making Pump.fun obsolete, or harsh regulations could target memecoin creation platforms, effectively shutting down its business model.

    By 2040, Pump.fun would be a ghost chain, a footnote in crypto history. The PUMP token would lose its narrative and utility, with its value plummeting.

    • Projected PUMP Price in 2040 (Bear): $0.0001 or less

    Base Scenario: Niche Utility Player

    In our base case, Pump.fun survives and solidifies its role as a key piece of crypto infrastructure. It doesn’t take over the world, but it becomes the “Shopify for memecoins,” a reliable and trusted platform within its niche. The memecoin market continues to exist, driven by culture and the human desire for speculation, and Pump.fun remains a primary beneficiary.

    Assuming the total crypto market cap grows to around $25 trillion by 2040 (a reasonable long-term estimate), and PUMP maintains a similar or slightly smaller slice of the market dominance it has today, its market cap could settle in the $20-$60 billion range.

    • Projected PUMP Price in 2040 (Base): $0.05 – $0.15

    Bull Scenario: The Speculation Layer of Web3

    In the most optimistic scenario, Pump.fun’s model proves to be revolutionary. It expands beyond Solana, becoming a multi-chain protocol. More importantly, it evolves beyond just memecoins, becoming the default, decentralized platform for launching any kind of speculative asset: social tokens, fan tokens, community projects, and new forms of digital assets we can’t even imagine yet.

    It becomes a foundational “speculation layer” for Web3, generating significant protocol revenue. In this world, its market cap could rival that of major exchanges or L1 protocols today, potentially reaching into the hundreds of billions. A market cap of $200-$500 billion is not out of the question if it becomes this integral.

    • Projected PUMP Price in 2040 (Bull): $0.50 – $1.25

    Simple Valuation Back-of-the-Envelope

    Let’s try a simple business-based valuation. Pump.fun’s model is based on fees. Let’s make some huge assumptions for 2040.

    • Assumption 1: The daily volume for newly launched speculative tokens across all chains is $50 billion.
    • Assumption 2: In our base case, Pump.fun has evolved and captures a 5% share of this market, meaning it facilitates $2.5 billion in daily volume.
    • Assumption 3: The platform earns an average fee of 0.3% on this volume.

    This would give Pump.fun a daily revenue of $7.5 million, or about $2.74 billion annually. If the market assigns a conservative 20x price-to-sales multiple to a profitable, market-leading protocol, that would imply a market cap of around $54.8 billion. Dividing this by a hypothetical fully diluted supply gives us a price that aligns squarely with our base case scenario. You can adjust these assumptions to see how the valuation changes.

    Risks & What to Watch

    This long-term outlook is filled with risk. Here are the main things to keep an eye on:

    • Regulatory Headwinds: Governments may crack down on platforms that facilitate the creation of unregistered securities, a label that could easily be applied to memecoins.
    • Competition: Success breeds imitation. A competitor with a better user experience, lower fees, or superior technology could easily steal market share.
    • Narrative Collapse: The memecoin trend is powerful but fickle. If cultural interest shifts elsewhere, the demand for Pump.fun’s service could evaporate.
    • Technical Exploits: As with any protocol, a major hack or smart contract vulnerability could destroy user trust and cripple the platform overnight.

    Conclusion: A Bet on the Future of Speculation

    Ultimately, making a Pump.fun (PUMP) Price Prediction for 2040 is less about charting and more about predicting human behavior. A long-term investment in PUMP is not just a bet on a single token; it’s a bet that the creation of memecoins and other speculative digital assets will continue to be a massive, enduring market.

    The platform has a powerful first-mover advantage and a compelling, simple product. The journey from its current $1.6 billion valuation to the potential scenarios in 2040 will be volatile and uncertain. For investors, the next step isn’t to blindly buy, but to watch closely. Monitor the platform’s user growth, its expansion to other chains, and its ability to innovate. The story of Pump.fun is just beginning, and the next 16 years will determine if it becomes a legend or a lesson.

    FAQ

    Is PUMP a good long-term investment for 2040?
    A PUMP investment is extremely high-risk with a very long time horizon. Its success depends on the long-term viability of the memecoin market and the platform’s ability to dominate it. It should be considered a highly speculative part of a diversified portfolio.

    What is the biggest risk for Pump.fun?
    Regulatory risk is arguably the biggest threat. If global regulators decide that platforms like Pump.fun facilitate the creation of unregulated securities and impose strict controls or outright bans, its entire business model could be jeopardized.

    How could the PUMP token accrue value?
    Value could accrue through several mechanisms. The most direct would be a fee-sharing model where a portion of the platform’s revenue is distributed to token holders or used to buy back and burn tokens, reducing the supply.

    What would need to happen for the bull case price prediction to come true?
    For the bull case to materialize, Pump.fun would need to successfully expand to all major blockchains, innovate its product to become the launchpad for a wide range of digital assets beyond just memecoins, and capture a significant portion of the protocol fees generated from this activity.

    Not financial advice. Do your own research.

    Pendle (PENDLE) Price Prediction: What Will PENDLE Price Be in 2030?

    0

    What if you could lock in future crypto yields today, or bet on them like a seasoned trader? That’s not a fantasy; it’s the core of Pendle, a project turning the DeFi world on its head. This unique ability to manage and trade yield is why so many are asking about its long-term potential. This deep dive into a Pendle (PENDLE) Price Prediction for 2030 will explore the fundamentals, market dynamics, and potential scenarios for one of DeFi’s most innovative protocols.

    TL;DR: Quick Pendle Price Outlook

    • Current Standing: Pendle is a key player in the “yield trading” and Liquid Restaking Token (LRT) narratives, showing steady growth and healthy market activity.
    • Base Case Prediction for 2030: Our analysis points to a potential price range of $25 – $45 for PENDLE, assuming continued adoption of DeFi yield markets and a healthy overall crypto market.
    • Bullish Scenario: If yield derivatives in crypto become a cornerstone of DeFi and Pendle solidifies its leadership, a price of $80 – $160 is conceivable, driven by massive Total Value Locked (TVL) growth.
    • Key Drivers: The primary factors influencing PENDLE’s future price are the growth of the liquid staking/restaking sector, overall DeFi adoption, and the protocol’s ability to maintain its competitive edge.

    What is Pendle (PENDLE)?

    At its heart, Pendle is a decentralized finance (DeFi) protocol that lets you tokenize and trade future yield. Think of it like this: when you own a yield-bearing asset, like staked ETH (stETH), you have two things: the principal asset itself (the ETH) and the right to the future yield it will generate.

    Pendle cleverly splits these two components apart. It creates a Principal Token (PT) and a Yield Token (YT). This allows for some powerful strategies:

    • Fix Your Yield: Sell the YT and keep the PT. You get your yield upfront and can lock in a fixed return, protecting you from fluctuating rates.
    • Go Long on Yield: Buy YT. If you believe staking rewards are going to increase, you can buy just the yield component for a fraction of the cost of the underlying asset, giving you leveraged exposure.
    • Provide Liquidity: You can add your assets to Pendle’s pools to earn fees and rewards, powering the entire ecosystem.

    The PENDLE token is central to this. It’s used for governance (voting on protocol changes) and value accrual. By locking PENDLE for vePENDLE (vote-escrowed PENDLE), holders can earn a larger share of the protocol’s revenue and boost their rewards as liquidity providers.

    Current Market Conditions

    Let’s break down the current snapshot of PENDLE. As of today, the token is trading at $4.71, with a market capitalization of roughly $798 million. This places it firmly in the mid-cap category, suggesting it’s established but still has significant room for growth compared to billion-dollar DeFi blue chips.

    The 24-hour trading volume of nearly $100 million is quite strong relative to its market cap (a ratio of about 12.5%). This indicates healthy liquidity and strong investor interest. Looking at the price action, we see a minor dip in the last hour (-1.1%), but a positive trend over the last day (+4.0%), week (+2.5%), and month (+16.4%). This pattern suggests a period of healthy consolidation after sustained upward momentum, a sign of a market that isn’t driven purely by short-term hype but by growing conviction.

    On-Chain & Narrative Drivers

    Beyond the numbers, the story behind Pendle is what’s truly compelling. The protocol is perfectly positioned at the intersection of several powerful crypto narratives.

    First and foremost is the Liquid Staking and Restaking boom. Protocols like Lido (for stETH) and EigenLayer (for restaking) have unlocked billions in capital. These Liquid Staking Tokens (LSTs) and Liquid Restaking Tokens (LRTs) are the raw material for Pendle. As more value flows into staking and restaking, the demand for a place to manage and trade the resulting yield naturally increases. Pendle is the undisputed market leader here.

    Second is the maturation of DeFi into something resembling traditional finance (TradFi). The interest rate derivatives market in TradFi is worth hundreds of trillions of dollars. While DeFi is a long way from that, Pendle is building the foundational rails for this exact market on-chain. If DeFi captures even a tiny fraction of that global market, Pendle stands to benefit immensely. Growth in its Total Value Locked (TVL) is the single most important metric to watch as an indicator of this trend.

    Pendle (PENDLE) Price Prediction Scenarios for 2030

    Predicting any asset’s price almost a decade out is speculative. However, we can create logical scenarios based on market adoption and potential growth. For these predictions, we’ll assume a future circulating supply of around 250 million PENDLE to account for vesting and emissions.

    Bearish Scenario: $2 – $5

    In a bearish future, the DeFi yield market fails to gain significant traction beyond its current niche. Perhaps a major security exploit shakes confidence in Pendle, or the restaking narrative proves to be a temporary fad. In this world, regulatory headwinds could also stifle DeFi innovation. PENDLE would likely struggle to grow its user base and TVL, causing its price to stagnate or decline, potentially trading in the $2 to $5 range as its utility fails to expand.

    Base Case Scenario: $25 – $45

    This is our most probable Pendle (PENDLE) Price Prediction. In this scenario, the crypto market continues its cyclical growth, and DeFi becomes more integrated into the broader digital economy. Liquid staking and restaking become standard practices for crypto holders. Pendle successfully captures a significant share of this market, growing its TVL to tens of billions. Its market cap could reasonably reach the $5 billion to $10 billion range, comparable to a successful, established DeFi protocol today. This would place its price between $25 and $45.

    Bullish Scenario: $80 – $160

    In the most optimistic scenario, Pendle becomes the “CME of crypto yield”—an indispensable piece of DeFi infrastructure. The on-chain interest rate derivative market explodes in popularity, attracting not just crypto natives but institutional players. Pendle solidifies its monopoly, integrates across multiple blockchain ecosystems, and sees its TVL swell to over $50 billion. In this blue-sky outcome, a market cap of $20 billion to $40 billion is not out of the question, leading to a PENDLE price of $80 to $160.

    A Simple Valuation Model

    Let’s try a simple “back-of-the-envelope” calculation to ground our base case. This is not a precise science, but it helps frame the potential.

    • Assumption 1: Total Addressable Market (TAM): Let’s assume the liquid staking and restaking market grows to a conservative $400 billion by 2030.
    • Assumption 2: Pendle’s Market Share: Pendle manages to capture 5% of this market as TVL on its platform. That would give it a TVL of $20 billion.
    • Assumption 3: Market Cap to TVL Ratio: Mature and essential DeFi protocols often trade at a market cap-to-TVL ratio of 0.5 to 1.0. Let’s use a reasonable 0.75.

    Calculation: $20B (TVL) * 0.75 (MC/TVL Ratio) = $15 Billion Market Cap.

    Resulting Price: $15B Market Cap / 250M Circulating Tokens = $60 per PENDLE.

    This simple model shows that a price well above current levels is mathematically plausible under reasonable growth assumptions, landing comfortably within our Base and Bullish scenarios.

    Risks & What to Watch

    Investing in PENDLE is not without risks. Here’s what you need to keep on your radar:

    • Smart Contract Risk: As with any DeFi protocol, there is always a risk of bugs or exploits in the code that could lead to a loss of funds. Pendle’s code is audited, but the risk is never zero.
    • Competition: While Pendle is the current leader, other protocols could emerge to compete in the yield trading space, potentially eroding its market share.
    • Narrative Dependency: Pendle’s success is heavily tied to the growth of LSTs and LRTs. If these sectors cool off, demand for Pendle’s services could wane.
    • Macroeconomic Factors: A prolonged crypto bear market or adverse global economic conditions could suppress all asset prices, including PENDLE.

    Conclusion: A Bet on the Future of Yield

    Pendle represents more than just another DeFi token; it’s a bet on the maturation of the entire crypto financial system. By creating a market for yield, it’s building a tool that is fundamental to sophisticated financial management.

    While the journey to 2030 will undoubtedly be volatile, Pendle’s unique value proposition and its central role in the fastest-growing sectors of DeFi make it a protocol worth watching. If you believe in a future where crypto yields are as tradable as any other financial asset, then Pendle is a project that should be on your research list.

    FAQ

    1. Is PENDLE a good investment for 2030?
    PENDLE has strong potential due to its leadership in the niche but rapidly growing yield-trading market. Its long-term value will depend on the continued growth of DeFi, particularly the liquid staking and restaking sectors. However, like any crypto asset, it carries significant risk.

    2. What is vePENDLE and how does it affect the price?
    vePENDLE is obtained by locking PENDLE tokens. It grants holders governance rights, a share of protocol fees, and boosted rewards on liquidity pools. This locking mechanism reduces the circulating supply and incentivizes long-term holding, which can have a positive effect on price stability and growth.

    3. Who are Pendle’s main competitors?
    The yield derivatives space is still nascent, but potential competitors include other protocols that may attempt to offer similar yield-splitting or interest rate swap functionalities. Some examples in the broader DeFi derivatives space include GMX or dYdX, though they don’t compete directly on tokenized yield in the same way.

    4. What is the biggest risk for Pendle?
    The most significant risk is smart contract vulnerability. An exploit that drains funds from its pools would be catastrophic for user trust and the protocol’s TVL. The second major risk is dependency on the LST/LRT narrative continuing its strong growth trajectory.

    Not financial advice. Do your own research.

    Collector Crypt (CARDS) Price Prediction: What Will CARDS Price Be in 2034?

    0

    Imagine it’s 2034. The crypto landscape has shifted, giants have fallen, and new kings have been crowned. Where does a niche project like Collector Crypt (CARDS) fit in this future? That’s the ten-year, ninety-eight-million-dollar question we’re tackling today. This deep dive isn’t about hype or impossible promises; it’s a sober analysis for investors trying to understand the long-term potential in a volatile market. We are exploring a comprehensive Collector Crypt (CARDS) Price Prediction for the next decade.

    This article will break down the fundamental drivers, market scenarios, and critical risks facing CARDS. We will build a framework to help you think about its potential value in 2034, but remember, the future is never guaranteed.

    TL;DR: Quick Forecast

    • Current Momentum: CARDS is experiencing significant short-term interest, with a 24-hour price surge of over 13% and trading volume at nearly 50% of its market cap, signaling high speculative activity.
    • Base Case 2034 Prediction: Our baseline analysis suggests CARDS could reach a price of $1.00 – $2.50 by 2034. This assumes it successfully carves out a niche in the digital collectibles space and grows in line with the broader crypto market.
    • Bullish Scenario: If CARDS becomes a dominant platform for digital collectibles and integrates with major brands, a price of $5.00 – $12.00 is conceivable, placing its market cap in the multi-billion dollar range.
    • Key Drivers: Long-term success hinges on user adoption, the health of the NFT and digital collectibles market, and the development team’s ability to deliver on its roadmap and secure meaningful partnerships.

    What is Collector Crypt (CARDS)?

    Before we look forward, let’s have a quick refresher. Collector Crypt (CARDS) is a blockchain-based project focused on the world of digital collectibles. Think of it as a decentralized ecosystem for creating, trading, and verifying unique digital assets, from art and memorabilia to in-game items. The CARDS token is the native currency of this ecosystem, used for transactions, governance, and potentially staking rewards.

    The core idea is to give creators and collectors true ownership of their digital items, backed by the security and transparency of the blockchain. In a world increasingly moving online, the concept of provably scarce digital goods has a powerful appeal. The success of CARDS will depend on how well it can build a user-friendly platform that attracts both creators and a dedicated community of collectors.

    Current Market Conditions: A Snapshot of High Activity

    Let’s break down the live metrics. With a current price of $0.25 and a market cap just under $100 million, CARDS sits firmly in the small-cap category of crypto assets. These are typically higher-risk, higher-reward investments. The most telling metric right now is the 24-hour trading volume: a massive $46.9 million.

    This volume represents nearly 50% of the entire market cap changing hands in a single day. This is an incredibly high ratio and points to intense, short-term speculative interest. The price action confirms this, with a sharp 9% jump in the last hour and a nearly 14% gain over the past 24 hours. While this is exciting for current holders, it also signals high volatility. Traders are moving in and out of positions rapidly, and new investors should be prepared for potential price swings in both directions. The lack of 7-day and 30-day data means we’re looking at a very recent surge, making it difficult to identify a sustained trend yet.

    On-Chain and Narrative Drivers

    Looking ten years into the future requires us to think beyond daily charts and focus on the bigger picture. The long-term value of CARDS will not be determined by a single day of trading but by its fundamental strengths and the narrative it builds. Since specific on-chain data like active wallets or transaction counts isn’t available here, we must reason based on what typically drives a project like this.

    The primary narrative for CARDS is the tokenization of everything. If the world continues to embrace digital ownership, platforms that facilitate this transition are poised for growth. Key drivers to watch will be user growth (the number of active collectors and creators on the platform), the volume of high-quality assets being traded, and strategic partnerships. Imagine CARDS securing a deal with a major sports league or a famous artist; that’s the kind of catalyst that creates sustainable, long-term value. The utility of the CARDS token is also crucial. Does it offer governance rights? Can it be staked for a yield? The more reasons people have to hold the token, the healthier its market will be.

    Collector Crypt (CARDS) Price Prediction for 2034

    Predicting anything a decade out is an exercise in structured speculation. Here, we outline three potential scenarios for CARDS, based on its ability to execute its vision and the overall health of the crypto market. Our technical analysis is based on projecting market cap growth, as standard chart patterns are irrelevant over a 10-year timeframe.

    Bear Case: Fading into Obscurity

    In this scenario, the hype around digital collectibles cools, or a competitor with better technology or stronger partnerships dominates the market. Collector Crypt fails to attract a significant user base, development stalls, and the project’s narrative loses momentum. The token’s utility diminishes, and it’s relegated to a minor, illiquid asset.

    • 2034 Market Cap Target: $10 million – $50 million
    • Rationale: The project fails to keep up with innovation and loses community interest, surviving only as a “ghost chain.”
    • 2034 Price Prediction: $0.01 – $0.10

    Base Case: A Solid Niche Player

    Our base case assumes Collector Crypt successfully navigates the next few market cycles. It doesn’t become the “Amazon of NFTs” but establishes itself as a respected and widely used platform within a specific niche, like digital art or indie game assets. It grows its user base steadily and maintains a dedicated community. Its growth roughly tracks the overall expansion of the crypto and digital asset economy.

    • 2034 Market Cap Target: $800 million – $2 billion
    • Rationale: The project delivers on its roadmap and captures a small but meaningful slice of a growing market. This assumes the total crypto market cap grows significantly over the decade.
    • 2034 Price Prediction: $1.00 – $2.50

    Bull Case: Market Leader in Digital Collectibles

    In the most optimistic scenario, CARDS becomes a household name in the digital collectibles space. It onboards millions of users through a seamless interface, secures exclusive partnerships with major global brands, and becomes the go-to platform for verifying and trading high-value digital items. The CARDS token accrues significant value through governance and fee-sharing mechanisms.

    • 2034 Market Cap Target: $4 billion – $10 billion
    • Rationale: CARDS achieves widespread adoption and becomes a blue-chip project within its sector, comparable to major gaming or social media platforms today.
    • 2034 Price Prediction: $5.00 – $12.00

    A Simple Valuation Model

    How do we get these numbers? Let’s do some simple, back-of-the-envelope math.

    First, we need the current circulating supply. We can estimate this by dividing the market cap by the price: $98,005,095 / $0.251056 ≈ 390 million CARDS.

    Next, we must project the supply for 2034. Crypto projects often have inflationary schedules. Let’s assume a conservative inflation rate that brings the total circulating supply to 800 million CARDS by 2034. This is a critical assumption.

    Now, let’s apply this to our Base Case market cap target of $1.5 billion:

    • Projected Price = Projected Market Cap / Projected Circulating Supply
    • Projected Price = $1,500,000,000 / 800,000,000 = $1.875

    This simple model shows how our Base Case prediction of $1.00 – $2.50 is derived. You can plug in your own market cap and supply assumptions to create your own scenarios.

    Risks and What to Watch

    Investing in a small-cap project over a 10-year horizon is fraught with risk. Here’s what you need to keep an eye on:

    • Competition: The NFT and digital collectible space is crowded. CARDS must innovate to stay ahead of well-funded competitors.
    • Regulation: The regulatory landscape for digital assets is still uncertain. Unfavorable government action could stifle growth.
    • Technology Risk: As with any software, the platform is vulnerable to bugs, exploits, or hacks. One major security breach could destroy user trust.
    • Execution Risk: The biggest risk is the team’s ability to deliver on its promises. Watch their roadmap closely. Are they hitting their milestones? Are they communicating transparently with the community?

    Conclusion: A Long Road Ahead

    The current market buzz around Collector Crypt is undeniable, but a ten-year investment thesis must be built on more than a single day’s momentum. The Collector Crypt (CARDS) Price Prediction for 2034 depends almost entirely on the project’s ability to transition from a speculative asset into a platform with real-world utility and a thriving user base.

    The potential for high returns is there, but so is the risk of significant loss. For investors considering a long-term position, the next steps are clear: dig into the project’s whitepaper, evaluate the experience of the development team, and actively follow their progress. The journey to 2034 will be long, and only projects with strong fundamentals will survive and thrive.

    FAQ

    Is CARDS a good investment today?
    CARDS is currently experiencing high volatility, making it a risky short-term trade. For long-term investors, its value depends on your belief in the team’s vision and the future of the digital collectibles market. It should be considered a high-risk, high-reward component of a diversified portfolio.

    How is the 2034 CARDS price prediction calculated?
    The prediction is not based on traditional chart analysis but on projecting the project’s potential market cap in 2034. We created bear, base, and bull scenarios based on different levels of adoption and success, and then divided those market caps by a projected future token supply to arrive at a price range.

    What is the biggest risk for Collector Crypt?
    The biggest risk is a failure to achieve product-market fit. If the platform isn’t easy to use, doesn’t attract top-tier creators, or is out-competed by a rival, it will fail to gain the network effect needed for long-term survival.

    Can CARDS reach $10?
    Reaching $10 per token would require its market cap to grow to around $8 billion, assuming a future supply of 800 million CARDS. This is our bull case scenario, which would require near-flawless execution, massive user adoption, and a very favorable market environment. It is possible, but highly optimistic.

    Not financial advice. Do your own research.

    What Is Solana (SOL) Price Today? SOL Technical Analysis (September, 2025)

    0

    Feeling the market’s pulse quicken every time you check your portfolio? You’re not alone. In the fast-paced world of crypto, every candle tells a story of hope, fear, and opportunity. Right now, one of the most compelling stories is Solana (SOL), a project that has risen from the ashes and continues to command the attention of the entire industry. If you’re wondering where it’s headed next, you’ve come to the right place for a clear-headed look at the data. This is your no-hype guide and Solana (SOL) Technical Analysis for September 2025.

    TL;DR: The State of SOL

    • Current Standing: Solana is trading at $206.58, holding strong above the key $200 psychological level after an impressive 26% rally over the last 30 days.
    • Short-Term Outlook: The price is currently in a consolidation phase, with minor pullbacks over the last day and week. This suggests the market is pausing to digest recent gains.
    • Key Levels: Immediate support can be found around the $185-$195 zone, while overhead resistance is near $225. A break in either direction could signal the next major move.
    • Overall Trend: Despite the short-term cooling, the medium-term trend remains bullish. The key is whether buyers can maintain momentum or if sellers will take control.

    What is Solana (SOL)? A Quick Refresher

    Before diving into the charts, let’s quickly recap what Solana is. Solana is a high-performance blockchain platform designed for decentralized applications (dApps) and crypto-native projects. Its primary claim to fame is its incredible speed and remarkably low transaction fees, achieved through a unique consensus mechanism called Proof-of-History (PoH).

    This combination makes it a powerful contender in the “Layer 1” race, attracting a vibrant ecosystem of developers and users building everything from decentralized finance (DeFi) platforms and NFT marketplaces to on-chain games and physical infrastructure networks (DePIN). Think of it as a superhighway for crypto transactions, built to handle a massive scale of activity without the traffic jams seen on other networks.

    Interpreting the Current Market Conditions

    The numbers tell a fascinating story of a tug-of-war between long-term momentum and short-term caution. At $206.58, SOL is comfortably above the $200 mark, a level that often acts as a psychological battleground for traders. Its market cap of over $111 billion solidifies its position as a top-tier digital asset.

    The most telling metric is the 30-day price change: an impressive +25.92%. This indicates strong buying pressure and positive sentiment over the past month. However, the shorter time frames paint a different picture. A slight dip of -0.29% in the last 24 hours and a -3.48% loss over the week suggest that the rally is facing some headwinds. This is classic market behavior—after a strong move up, a period of consolidation or a minor correction is healthy and expected. The $5.5 billion in 24-hour volume confirms that interest remains high, and the market is actively trying to decide on its next direction.

    On-Chain and Narrative Drivers

    While we can’t see the on-chain data in real-time here, several underlying factors are likely influencing Solana’s price. A sustained increase in daily active wallets, rising transaction counts, and growing Total Value Locked (TVL) in Solana’s DeFi ecosystem would all provide a strong fundamental backbone for a continued price rally. These metrics show that the network isn’t just an object of speculation; it’s a platform with real, growing utility.

    The narrative surrounding Solana also remains potent. Its reputation as a resilient “Ethereum killer” continues to attract both users and developers seeking a faster, cheaper alternative. Furthermore, Solana has carved out a niche as a leader in emerging sectors like DePIN and consumer-facing applications, setting it apart from competitors. As always, the broader market sentiment, heavily influenced by Bitcoin and macroeconomic factors, will also play a critical role in SOL’s performance.

    Solana (SOL) Technical Analysis: Scenarios for September 2025

    Based on the current price of $206.58 and recent performance, here are three potential scenarios for Solana in the coming weeks.

    Bearish Scenario: A Deeper Correction

    If the weekly selling pressure (-3.48%) intensifies, SOL could break below the psychological support at $200. This could be triggered by profit-taking from the monthly rally or a broader market downturn. A sustained move below $200 with increasing volume would be a bearish signal, suggesting that the recent momentum has faded.

    In this scenario, the next logical area of support would be in the $180 – $185 range, a level that has likely seen significant trading activity in the past.

    Base Scenario: Healthy Consolidation

    This appears to be the most likely path in the immediate short-term. The conflicting signals between the strong monthly performance and the slight daily dip suggest the market is in equilibrium. Buyers who rode the 26% wave are taking some profits, while new buyers are stepping in, creating a stalemate.

    We could see SOL trade sideways within a range for the next couple of weeks, likely bounded by support around $195 and resistance at $215. A decrease in trading volume would further support this consolidation thesis.

    Bullish Scenario: The Next Leg Up

    If the recent dip proves to be nothing more than a brief pause, buyers could re-emerge with force. A decisive breakout above the recent highs, particularly pushing past the $225 resistance level, would signal a continuation of the powerful uptrend seen over the last 30 days.

    This move would likely be accompanied by a spike in volume, confirming buyer conviction. A successful breakout would open the door to higher targets, with traders likely eyeing the $240 – $250 zone as the next major psychological and technical hurdle.

    A Simple Valuation Estimate

    Valuing crypto is notoriously difficult, but we can use a simple comparative model for a rough estimate. Let’s compare Solana to its main competitor, Ethereum. One common bull case for Solana is that it could eventually capture a significant portion of Ethereum’s market share, perhaps around 25-30%, due to its different use cases and advantages.

    • Assumption 1: Ethereum achieves a market cap of $750 billion in a full-blown bull market.
    • Assumption 2: Solana captures 25% of that value, giving it a target market cap of approximately $187.5 billion.
    • Assumption 3: Solana’s circulating supply is around 541 million SOL (derived from the current $111.8B market cap / $206.58 price).

    Based on these assumptions, a potential future price for SOL could be: $187.5 Billion / 541 Million SOL = ~$346 per SOL. This is not a prediction but an illustration of how much growth would be needed for Solana to fulfill this particular bull case.

    Risks and What to Watch

    Investing in Solana, like any crypto asset, comes with risks. The network’s history of outages, though less frequent now, remains a concern for some investors. Competition is also fierce, with Ethereum’s Layer 2 solutions and other high-speed blockchains all vying for market share.

    Moving forward, keep a close eye on these key factors:

    • Bitcoin’s Price Action: As the market leader, Bitcoin’s direction will heavily influence SOL and all other altcoins.
    • Network Activity: Watch for trends in daily active users and TVL on platforms like DefiLlama to gauge the health of the ecosystem.
    • Major Announcements: News of partnerships, protocol upgrades, or major dApps launching on Solana can act as powerful price catalysts.

    Conclusion: A Pivotal Moment for SOL

    Solana is currently at a fascinating crossroads. It has demonstrated powerful upward momentum over the last month but is now taking a necessary breather. The data suggests a period of consolidation is likely, but the underlying trend remains strong. Whether it breaks down to retest lower supports or continues its rally will depend on the broader market and its ability to maintain its growth narrative.

    For now, the best approach is to watch the key levels outlined above. See how the price reacts at support and resistance, and pay attention to trading volume for confirmation. The next few weeks will be crucial in determining whether this is just a pause before the next surge or the start of a more significant correction.

    Frequently Asked Questions (FAQ)

    Is Solana a good investment in September 2025?
    Solana has significant long-term potential due to its strong technology and growing ecosystem. However, it is also a volatile asset with notable risks. Whether it’s a “good” investment depends entirely on your personal risk tolerance, investment horizon, and portfolio strategy.

    What is the next key resistance for SOL?
    Based on the current technical setup, the next major resistance level to watch is around the $225 mark. A strong break above this could signal a continuation of the bullish trend.

    Can Solana’s price reach $500?
    Reaching $500 per SOL would imply a market capitalization of over $270 billion, placing it in very elite company. While possible in a highly bullish market cycle with massive mainstream adoption, it would require significant growth in both Solana’s ecosystem and the overall crypto market capitalization.

    What are the main drivers of Solana’s price?
    SOL’s price is driven by a combination of factors, including overall crypto market sentiment (especially Bitcoin’s performance), the growth and adoption of its dApp ecosystem (DeFi, NFTs, DePIN), technological upgrades to the network, and the broader narrative surrounding its competition with Ethereum and other Layer 1s.

    Not financial advice. Do your own research.

    Bonk (BONK) Price Prediction: What Will BONK Price Be in 2027?

    0

    Remember that heart-pounding rush when BONK exploded onto the scene? The thrill of watching a Solana-based dog coin capture the market’s imagination was unforgettable. But after the initial frenzy, the big question on every holder’s mind is: what comes next? Is this just another fleeting meme, or is BONK building something that can last until 2027 and beyond? This Bonk (BONK) Price Prediction aims to cut through the hype and offer a sober analysis of what the future could hold for Solana’s most famous canine coin.

    TL;DR: Key Takeaways

    • BONK is currently in a consolidation phase, with recent price action showing a short-term downtrend, down over 20% in the last 30 days.
    • The token’s future is heavily tied to the overall health and growth of the Solana ecosystem and the continuation of the broader meme coin narrative.
    • Our base case prediction for 2027 places BONK in the $0.000045 to $0.000075 range, assuming Solana maintains its relevance and BONK expands its utility.
    • A major bull market could see prices push towards $0.00015 or higher, while a prolonged bear market could see it lose most of its current value.
    • Key risks include extreme volatility, fierce competition from other meme coins, and a potential downturn in the overall crypto market.

    What is BONK? A Quick Refresher

    BONK isn’t just another dog-themed token; it’s the original community coin of the Solana blockchain. It launched in December 2022 via a massive airdrop to Solana community members, including developers, artists, and active users. This strategy was a masterstroke, instantly creating a widespread user base and fostering a sense of ownership.

    Unlike many meme coins that exist purely for speculation, BONK has been actively integrated into the Solana ecosystem. It’s used across dozens of decentralized applications (dApps) for everything from minting NFTs to playing games and participating in decentralized finance (DeFi). This push for utility is what sets it apart and forms the foundation for its long-term potential.

    Current Market Conditions: Reading the Tea Leaves

    Let’s break down the current numbers. With a price of $0.00001942 and a market cap of over $1.5 billion, BONK is a serious player in the crypto space. A 24-hour trading volume of nearly $200 million shows that there is still significant liquidity and interest from traders.

    However, the recent price action tells a story of cooling momentum. The token is down over 5% in the last 24 hours and over 20% in the last 30 days. This suggests that after a period of excitement, the market is now in a period of price discovery and consolidation. Sellers have had the upper hand recently, and the key question is whether buyers will step in to defend current price levels or if we are headed for a deeper correction before the next move up.

    On-Chain & Narrative Drivers for BONK

    Because BONK is a meme coin, its price is driven by two primary forces: narrative and utility. The narrative is simple and powerful: BONK is the people’s coin of Solana. It represents the fun, slightly rebellious, and community-centric spirit of the ecosystem. As long as Solana thrives and captures new users, BONK is likely to benefit from that attention.

    Beyond the story, actual on-chain activity is what could give it staying power. The more dApps that integrate BONK for payments, staking, or rewards, the more reasons people have to hold it beyond pure speculation. Key drivers to watch are the growth of Solana’s user base, the launch of new viral apps that use BONK, and further listings on major centralized exchanges, which would introduce it to new pools of capital.

    A Bonk (BONK) Price Prediction for 2027

    Predicting any crypto asset’s price three years out is challenging, especially for a meme coin. However, we can outline logical scenarios based on potential market developments.

    Bear Case: The Hype Fades

    In a bear scenario, the meme coin supercycle of 2023-2024 proves to be a cyclical top. A broader crypto winter sets in, and retail interest wanes. Solana might struggle to maintain its momentum against competitors like Ethereum and its Layer 2 solutions. In this world, BONK loses its narrative strength, liquidity dries up, and it’s replaced by the next hot meme coin.

    • Rationale: Meme coins are notoriously dependent on attention. Without a constant flow of good news and market excitement, they can bleed value rapidly.
    • Technical Interpretation: Based on current metrics, a break below key psychological support at $0.000015 could trigger further selling. In a full bear market, a return to pre-2023 levels is possible.
    • 2027 Price Range: $0.000001 – $0.000005

    Base Case: Steady Integration and Growth

    Our base case assumes the crypto market continues its cyclical nature, with another bull run peaking sometime before 2027. Solana solidifies its position as a top-three blockchain for consumer applications. BONK doesn’t necessarily recapture the manic hype of its initial launch but becomes a staple of the Solana ecosystem, similar to what SHIB is for Ethereum. It’s widely used in Solana-based games and DeFi protocols, giving it a stable demand floor.

    • Rationale: This scenario depends on the BONK team and community successfully transitioning from a pure meme to a “utility meme”.
    • Technical Interpretation: The current consolidation is a healthy reset. After finding a bottom, the price would begin a steady climb, respecting key technical levels and building a more sustainable uptrend driven by ecosystem growth rather than pure hype.
    • 2027 Price Range: $0.000045 – $0.000075

    Bull Case: BONK Becomes a Blue-Chip Meme Coin

    In the most optimistic scenario, a massive global bull run brings tens of millions of new users into crypto, and many of them choose Solana for its low fees and high speed. BONK becomes the default entry point for these users, a fun and accessible way to transact and interact with the Solana world. It achieves a market capitalization that rivals or even surpasses Shiba Inu’s 2021 peak.

    • Rationale: This requires a perfect storm: a roaring bull market, explosive growth for Solana, and BONK maintaining its top-dog status within that ecosystem.
    • Technical Interpretation: The current dip is simply a bull market correction. Once the broader market turns, BONK would aggressively break past its all-time highs, entering a new phase of price discovery fueled by immense retail interest.
    • 2027 Price Range: $0.00015+

    A Simple Valuation Model

    Let’s do some back-of-the-envelope math. This is not a guarantee, but a way to frame the possibilities.

    Shiba Inu reached a peak market cap of roughly $40 billion in 2021. Dogecoin’s peak was over $80 billion. The current market cap of BONK is about $1.5 billion.

    • Assumption: In a major bull run, BONK could achieve a market cap of $25 billion, which is ambitious but not unprecedented for a top-tier meme coin.
    • Calculation: With a total supply of nearly 100 trillion BONK (let’s use the circulating supply of ~65 trillion for a more grounded take), the price would be:
      $25,000,000,000 / 65,000,000,000,000 = ~$0.00038

    This simple model shows that under extremely bullish conditions, a price far exceeding our bull case is theoretically possible, but it would require BONK to become a true cultural phenomenon.

    Risks and What to Watch

    Investing in BONK is not for the faint of heart. The primary risk is volatility. Prices can swing dramatically based on social media trends and market sentiment. Competition is also fierce; hundreds of new meme coins launch every week, each vying for attention and capital.

    Finally, BONK’s fate is tied to Solana. If the Solana network experiences major outages or fails to attract developers and users, BONK’s price will suffer regardless of its own merits. Keep an eye on Solana’s transaction volume, active wallets, and the general buzz around its ecosystem.

    Conclusion: A High-Stakes Bet on Solana’s Future

    The Bonk (BONK) price prediction for 2027 hinges on its ability to evolve. It must transition from a viral sensation into an indispensable part of the Solana user experience. The path forward is uncertain but full of potential.

    For investors, the journey will be a rollercoaster. The base case points to respectable gains if the project continues to execute, while the bull case offers a tantalizing glimpse of life-changing returns. However, the bear case is a stark reminder that in the world of meme coins, fortunes can be lost as quickly as they are made. Your next step should be to watch how BONK’s integration into the Solana ecosystem develops and to keep a close eye on the overall health of the crypto market.

    Frequently Asked Questions (FAQ)

    1. Can BONK reach $0.01?
    For BONK to reach one cent, it would need a market capitalization of approximately $650 billion (circulating supply of 65 trillion x $0.01). This is larger than Ethereum’s current market cap and is extremely unlikely to happen.

    2. What is the main use case for BONK?
    Initially a pure meme coin, BONK’s primary use case is now as a social and transactional token within the Solana ecosystem. It is used in over 100 dApps for things like NFT minting, gaming rewards, and as liquidity in DeFi protocols.

    3. Is BONK a better investment than Dogecoin or Shiba Inu?
    This depends on your thesis. If you believe the Solana ecosystem will outgrow Ethereum and other blockchains, then BONK may have more upside potential as its flagship meme coin. However, DOGE and SHIB are more established, have larger communities, and have proven their staying power over a longer period.

    4. How is BONK’s supply distributed?
    BONK is known for its large community airdrop. 50% of the total supply was distributed to the Solana community, including developers, artists, collectors, and early users, to ensure wide and decentralized ownership from the start.

    Not financial advice. Do your own research.

    Sui (SUI) Price Prediction: What Will SUI Price Be in 2043?

    0

    Thinking about where your crypto portfolio will be in twenty years can feel like gazing into a crystal ball. Will you be celebrating a life-changing investment, or will today’s promising projects be distant memories? This is especially true for newer blockchains like Sui. If you’re wondering whether SUI has the legs to go the distance, you’re asking the right questions. This long-term Sui (SUI) price prediction aims to cut through the noise, offering a sober look at what could drive its value by 2043.

    TL;DR

    • The Long View: Predicting prices two decades out is highly speculative. This analysis focuses on fundamental drivers and potential market share, not short-term charts.
    • Core Scenarios: We project a wide range for 2043. A bear case could see SUI struggle below $20, a base case suggests a price between $50 – $150, and a bullish outcome could push it past $400 if it captures significant market share.
    • Key Drivers: Sui’s success hinges on its technology (the Move language and object-centric model) attracting developers, particularly in high-throughput sectors like gaming and DeFi.
    • Major Risks: Intense competition from other Layer 1s, potential technological hurdles, and long-term token inflation are significant risks to consider.

    What is SUI?

    Sui is a high-performance Layer 1 blockchain designed from the ground up to be fast, secure, and scalable. It was developed by Mysten Labs, a team composed of former lead engineers from Meta’s Diem blockchain project. Think of it as a next-generation contender aiming to solve the “blockchain trilemma” of balancing speed, security, and decentralization.

    What makes Sui stand out is its unique architecture. Unlike many blockchains that process transactions sequentially, Sui uses an “object-centric” model. This allows it to process simple transactions in parallel, dramatically increasing throughput and keeping fees low. It also utilizes the Move programming language, which is designed with a strong emphasis on asset security, making it theoretically safer for developers to build complex applications.

    Current Market Conditions

    As of today, SUI is trading at around $3.31, with a market capitalization of over $11.8 billion. This places it firmly in the category of a major blockchain project. The 24-hour trading volume of approximately $783 million indicates healthy liquidity and active interest from traders.

    However, the recent price action tells a story of consolidation. With minor losses over the past hour (-0.03%), day (-0.67%), week (-5.17%), and month (-3.70%), the market appears to be taking a breather. This isn’t necessarily a bearish sign but suggests that the initial excitement may be settling into a more stable valuation period as investors weigh the project’s long-term fundamentals against the broader market sentiment.

    On-Chain & Narrative Drivers

    Looking ahead two decades, today’s price charts become almost irrelevant. What truly matters are the underlying fundamentals and the narrative that Sui builds. The key driver will be adoption. Will developers flock to Sui’s Move language to build the next generation of decentralized applications? Will users follow?

    We need to watch for sustained growth in on-chain metrics like Total Value Locked (TVL), which represents the amount of capital deployed in its DeFi ecosystem. An even more crucial indicator for Sui will be its success in the blockchain gaming and social media space, areas its high-throughput design is built for. If we see major gaming studios or consumer apps choosing Sui, it would be a powerful long-term bullish signal. The narrative will follow the data: is Sui becoming an essential piece of Web3 infrastructure, or just another “fast” blockchain in a crowded field?

    Sui (SUI) Price Prediction for 2043: Three Scenarios

    Projecting two decades into the future is an exercise in strategic forecasting, not precise charting. The following scenarios for a Sui (SUI) price prediction are based on potential market evolution and Sui’s ability to capture a share of it. Our analysis assumes a total circulating supply of around 9 billion SUI by 2043, out of its 10 billion maximum supply.

    Bear Case: A Niche Player ($5 – $20)

    In a bearish scenario, Sui struggles to differentiate itself from a sea of powerful Layer 1 and Layer 2 competitors. Perhaps its technology doesn’t deliver on its promises, or another platform offers an even better developer experience. In this future, Sui doesn’t fail entirely but remains a minor, niche chain with a small but dedicated community.

    Assuming the total crypto market grows to a conservative $15 trillion by 2043, Sui might only capture a 0.1% market share. This would give it a market cap of $15 billion. Divided by a 9 billion circulating supply, this yields a price of approximately $1.67. Factoring in 20 years of steady inflation, the nominal price could land in the $5 – $20 range, but its real purchasing power would have stagnated significantly compared to the market leaders.

    Base Case: A Respected Contender ($50 – $150)

    Our base case sees Sui successfully executing its vision. It becomes a go-to platform for specific use cases like on-chain gaming, decentralized social media, and complex DeFi products that require its high-speed, parallel processing capabilities. It doesn’t “kill” Ethereum but coexists as a vital part of a multi-chain world.

    Let’s project the total crypto market cap reaches $40 trillion by 2043. If Sui secures a respectable 1.5% market share, its market cap would be $600 billion. With 9 billion SUI in circulation, this leads to a price of around $66.67. This reflects solid but not world-dominating growth, placing our base case range at $50 to $150.

    Bull Case: A Market Leader ($400+)

    In the most optimistic scenario, Sui’s object-centric model proves to be a revolutionary leap forward. Its ability to scale horizontally becomes the industry standard, attracting the lion’s share of new developers and capital. It becomes a foundational layer of the new internet, hosting everything from financial systems to metaverse economies.

    In this future, let’s imagine the crypto market cap hits $70 trillion. If Sui becomes a dominant player, capturing a 5% market share similar to what giants like Ethereum hold today, its market cap would reach a staggering $3.5 trillion. Dividing this by 9 billion SUI gives us a price of $388.88. It’s entirely possible in this scenario that it could overshoot this, pushing into the $400 – $600 range as it becomes a core global asset.

    A Simple Valuation Back-of-the-Envelope

    Let’s simplify this with a clear formula you can adjust with your own assumptions.

    Price = (Total Crypto Market Cap in 2043 * Sui’s Market Share) / Sui’s Circulating Supply

    Let’s plug in our base case numbers:

    • Total Crypto Market Cap: $40 Trillion (a reasonable long-term growth assumption)
    • Sui’s Market Share: 1.25% (Sui becomes a top 10-15 project)
    • Sui’s Circulating Supply: 9 Billion

    Calculation: ($40,000,000,000,000 * 0.0125) / 9,000,000,000 = $55.55 per SUI

    This simple model shows how powerful the levers of overall market growth and market share capture are. Feel free to adjust these numbers. What if the total market reaches $100 trillion? What if Sui captures 3% of it? The potential outcomes change dramatically.

    Risks and What to Watch

    Investing for the long term requires patience and vigilance. Sui’s journey to 2043 will be filled with challenges. The primary risk is competition. It’s not just competing with Ethereum, but also with Solana, Aptos (its closest cousin, which also uses Move), and a host of Layer 2 solutions that are constantly improving.

    Investors should keep a close eye on three key areas. First, developer activity: Are talented teams building useful applications on Sui? Check developer documentation, GitHub activity, and project announcements. Second, user adoption: Are people actually using these dApps? Track metrics like daily active addresses and transaction counts. Finally, tokenomics: Monitor the SUI token release schedule. A steady, predictable inflation rate is healthy, but large unlocks for early investors could create selling pressure.

    Conclusion: A High-Risk, High-Reward Bet on Technology

    Predicting any asset’s price two decades from now is fraught with uncertainty, but a framework for a Sui (SUI) price prediction helps clarify the possibilities. Sui is not a guaranteed winner, but it represents a serious bet on a new wave of blockchain architecture designed for mass adoption. Its success is not a matter of if, but how well it executes its technological vision and builds a thriving ecosystem.

    For investors with a long time horizon and a high tolerance for risk, Sui presents a compelling asymmetric opportunity. The downside is a 100% loss, a risk shared by all crypto assets. The upside, should it become a foundational piece of Web3, is substantial. The next steps are to dig deeper into its ecosystem, follow its development progress, and decide if its technological proposition aligns with your long-term investment thesis.

    FAQ

    Is SUI a good long-term investment?
    Sui has strong technical foundations and a well-funded team, making it a credible long-term contender. However, it is a high-risk investment due to intense competition in the Layer 1 space. Its success will depend on its ability to attract and retain developers and users over many years.

    How high can the SUI price realistically go?
    In a highly optimistic, bull-case scenario where the entire crypto market grows significantly and Sui captures a market share comparable to today’s top blockchains, a price of over $400 is conceivable by 2043. This is a speculative projection and depends on near-perfect execution and favorable market conditions.

    What makes Sui different from other blockchains like Solana or Ethereum?
    Sui’s main differentiator is its object-centric data model. This allows it to process many transactions in parallel, rather than one by one, leading to potentially much higher throughput and lower fees, especially for simple transfers. It also uses the Move programming language, which is designed for enhanced security around digital assets.

    How will SUI’s total supply and inflation affect its price?
    Sui has a maximum supply of 10 billion tokens. Over time, more of these tokens will enter circulation through staking rewards and vesting schedules, creating inflationary pressure. For the price to increase, demand for the SUI token (for gas fees, staking, and governance) must grow faster than the rate at which new supply is released.

    Not financial advice. Do your own research.

    Most Crypto Traders Still Don’t Get It: This Is How to Use AI for Crypto Trading

    0

    Picture this: you refresh your social media feed and see Bitcoin trending. It’s already up 15% in a few hours. The entries are gone. You scroll through your watchlist and it’s the same story.

    The coins you glanced at yesterday are now out of reach, and you’re stuck debating whether to chase green candles or sit on your hands.

    That’s the nightmare every trader knows: being right about the narrative, but late on the move.

    This is why traders cling to predictions. AI can crunch order books, sentiment feeds, and on-chain flows to spit out where the next spike might land. It feels like the holy grail: a machine that sees the future before you do.

    But here’s the situation most miss: AI isn’t just about telling you what’s coming. It’s about positioning you so you’re already there when it happens.

    AI-powered price prediction is amazing. We know it, we built an agent for it. But if you don’t act on it, it makes no difference at all.

    Because in crypto, timing beats foresight. The traders who win aren’t the ones who guess best. They’re the ones who are positioned first and execute at the right time.

    TL;DR:

    • Being right about a narrative but late on the move turns you into exit liquidity.
    • AI’s real value for crypto traders isn’t about predicting prices, it’s about positioning you before the pump.
    • Positioning means being early: spotting narratives, entering liquidity first, sizing risk, and building conviction.
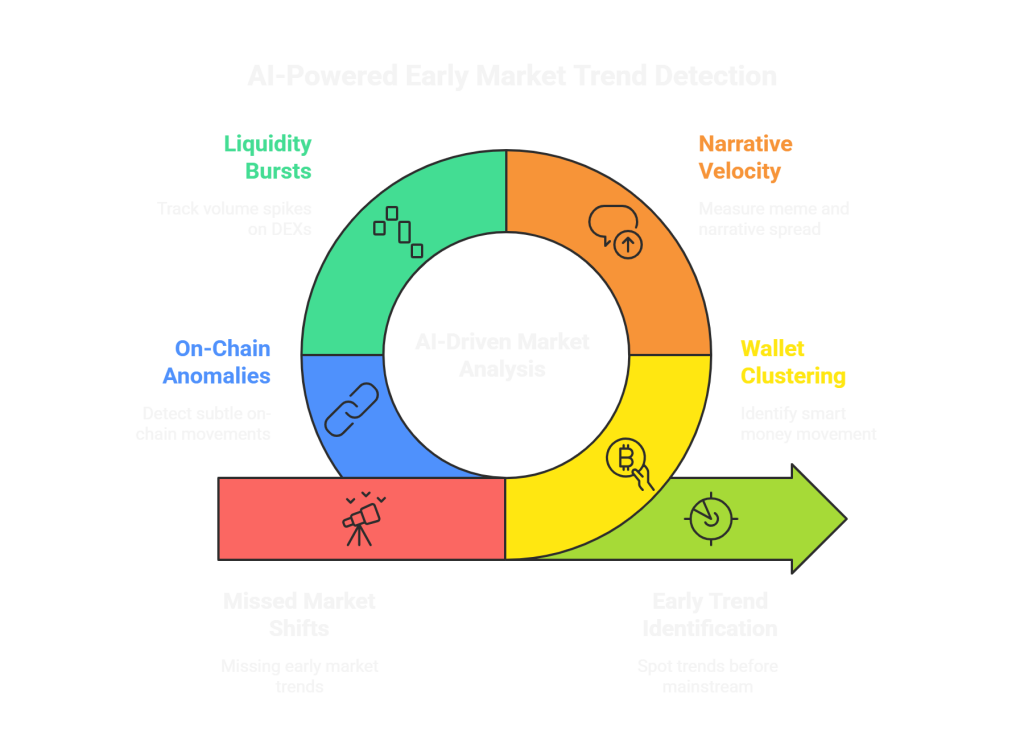
    • AI helps by tracking wallet clusters, narrative velocity, liquidity bursts, and on-chain anomalies in real time.
    • Pump Parade gives you free AI-powered tools to predict and position yourself to execute with confidence.
    • Milo, our AI agent, integrates into your trading flow by permanently monitoring markets, spotting trends based on market and social data, and automating your portfolio based on real-time analysis.

    Why Positioning Is Just as Important as Predicting

    Markets aren’t machine, they’re moods. They swing on liquidity, hype, and herd psychology. One minute they look orderly, the next they’re chaos.

    A prediction can give you direction, that’s true. But direction without timing is useless. If you’re entering after the crowd has already flooded in, you’re not early: you’re exit liquidity.

    That’s where positioning comes in. In trading, positioning means setting yourself up before the move happens.

    It’s about preparing your entries, risk, and exposure so that when the market shifts, you’re already in the spot to benefit.

    In crypto, positioning shows up in a few ways:

    • Narrative positioning: spotting the early signs of a trend or meme before the crowd notices.
    • Liquidity positioning: entering before the surge of volume hits, so you ride the wave rather than chase it.
    • Risk positioning: adjusting size and stops so you can move fast without overextending.
    • Psychological positioning: building conviction from sentiment, on-chain flows, and data so you don’t panic-sell right before a breakout.

    Positioning is about sliding in while the wave is still forming, not showing up after it crashes onshore. It’s the difference between watching a pump happen and actually profiting from it.

    How to Use AI for Crypto Trading to Its Maximum Potential

    Most traders still think AI’s superpower is predicting prices.

    To be fair, they’re not wrong. AI shines at processing massive amounts of data and spotting patterns, which are exactly the skills that technical analysis has always depended on.

    But the real magic runs deeper: AI lets you see structural shifts in the market before they hit the mainstream. It’s like having a radar tuned to where energy, capital, and attention are quietly stacking up.

    💡 For a complete guide on how to use AI for crypto trading in the best way possible, visit our dedicated article: How to Use AI for Crypto Trading (The Right Way)

    Here’s what that looks like in practice:

    • Wallet clustering: AI can spot when “smart money” wallets start leaning into a new sector or token. It’s not only about who’s buying but who’s buying early, and whether they’re moving systematically or testing the waters. Catching these clusters can clue you into the next trend before retail notices.
    • Narrative velocity: Memes and narratives are the heartbeat of crypto. AI can measure how fast a token or meme is spreading across social media, Telegram, Reddit, and Discord. When chatter starts to spike, sentiment shifts, or community engagement jumps, AI flags it. This tells you where the conversation (and potentially the capital) is flowing before you see it on your feed.
    • Liquidity bursts: Volume spikes on DEXs often signal where the real money is moving. AI doesn’t just see that a token is trending. It tracks who’s trading, how much, and whether the liquidity shift is likely to sustain. This helps you ride waves instead of chasing them.
    • On-chain anomalies: Sometimes the most powerful moves happen quietly. Wallets shifting funds, preparing for listings, or making coordinated swaps can hint at major pivots before they hit the news. AI catches these subtle moves, giving you early warning signals that most traders will completely miss.

    As you can see, this is very different from some random, out-of-the-blue prediction with no substance behind it. What AI can offer is more like a radar, constantly scanning the market for real-time energy.

    Yes, it can analyze the data and point toward where price might head next. But that’s only part of the story. More importantly, it highlights the places where attention is starting to cluster, where liquidity is beginning to flow, and where momentum is quietly building beneath the surface.

    That’s the real advantage: AI doesn’t just project a possible future. It gives you the signals you need to position yourself ahead of time, before the wider crowd even knows what’s happening.

    Prediction + Positioning = Conviction

    Here’s one way to think about the difference between prediction and positioning we’ve been talking about throughout this article:

    • Predictions give you the map.
    • Positioning charts the course over it, telling you when and where to move.

    Put them together, and you get conviction: the ability to act with speed and confidence, without second-guessing.

    This is where most traders misuse AI. They treat it like a signal service: “Tell me what to buy.” But the smart traders ask a different question: “What’s changing , and how can I get there first?”

    That shift in mindset makes all the difference. It’s how they:

    • Track wallet behavior and social chatter in real time, not hours later when the news breaks, but as the signals are happening.
    • Scan for unusual market activity automatically, catching things no human could spot in the noise of hundreds of charts and tokens.
    • Execute instantly and cleanly, without hesitation, FOMO, or emotional baggage.

    Conviction is rare in trading because most people are guessing, chasing, or waiting for confirmation that comes too late.

    With both prediction and positioning, you’re no longer asking if you should buy or not. You already know why you’re entering, when you’re entering, and what you’ll do if it moves against you.

    And that’s the massive advantage AI provides to crypto traders who use it: It doesn’t replace your judgment, it amplifies it.

    It gives you visibility into the hidden layers of the market, and the speed to act on them before everyone else even realizes what’s happening.

    And that’s exactly what we’ve built into Pump Parade. Instead of forcing you to juggle endless dashboards or gamble on half-baked signals, it brings the pieces together in one flow.

    In addition to our AI-powered price prediction tool, you can track social sentiment from the trenches before the trends are consolidated on your social media feed, follow how fast a narrative is spreading across digital communities, analyze a specific token (and even the market in general) to spot anomalies and opportunities.

    What Pump Parade offers goes beyond information: it’s context, momentum, and timing, all surfaced in real time. For traders, that means less hesitation, fewer “too late” entries, and more confidence in knowing why you’re taking a position, not just what you’re buying.

    Pump Parade is available for everyone and free to use. You don’t need to connect your wallet or hold a token. Go to Pump Parade to try our AI-powered tools!

    Conviction isn’t about blind faith. It’s about seeing things clearly (and early) enough so that hesitation disappears.

    The Future: Beyond Reading AI, Into Acting With It

    Here’s the shift that’s coming: the winners won’t just use AI to read predictions. They’ll integrate AI directly into their trading stack: research, positioning, and execution all flowing together.

    Here’s where crypto AI agents take it to the next level.

    Think about them as advanced plugins for your wallet. When you integrate them, they can automate your portfolio management, monitor markets 24/7, flag anomalies the second they happen, and even track wallet clusters or new narrative surges before they trend on social media.

    Instead of juggling ten dashboards and endless charts, you have an agent that works tirelessly in the background, surfacing only what matters most so you’re never late, never blind, and never frozen by indecision.

    We have contributed to the development a state-of-the-art AI agent that can do all this and more. Its name is Milo and it’s free to use. We’ve put together many guides for you to get started. When you try it, you’ll never stop using it. Discover how to integrate AI agents to your crypto trading process here: We Tried 50+ Crypto Trading Prompts on a Solana AI Agent — These 7 Delivered the Best

    At the end of the day, every trader is chasing the same thing: clarity in the chaos. Predictions can point you in the right direction, but positioning is what actually gets you paid.

    The traders who learn to work with AI (not just read it) will move faster, act smarter, and ride the waves others only watch from the shore.

    The choice is simple: you can either wait for the market to tell you what happened, or start using AI to position yourself for what’s coming.

    Bitcoin (BTC) Price Prediction: What Will BTC Price Be in 2043?

    0

    Ever find yourself staring at a price chart, wondering not about tomorrow, but about the next generation? What if the small investment you make today could redefine your family’s future in 20 years? Looking two decades into the future is an exercise in imagination, but for an asset like Bitcoin, it’s a necessary one. This Bitcoin (BTC) Price Prediction isn’t about giving you a crystal ball for 2043; it’s about building a framework to think about the incredible possibilities and risks that lie ahead.

    Let’s be clear from the start: predicting anything two decades from now is speculative. The world will change in ways we can’t yet imagine. However, by looking at fundamental principles, adoption curves, and potential market sizes, we can map out a few logical pathways for Bitcoin’s journey.

    TL;DR: Bitcoin in 2043

    • Base Case Prediction: Our base model points to a Bitcoin price between $500,000 and $1,000,000 per coin. This assumes BTC solidifies its role as “digital gold” and becomes a standard component of institutional and retail investment portfolios.
    • Bull Case Scenario: In a more optimistic future where Bitcoin achieves partial status as a global reserve asset, a price of $2,000,000 or more is conceivable. This would mean it has captured a significant portion of the global store of value market.
    • Bear Case Scenario: A future with severe regulatory crackdowns, a critical technical failure, or a failure to achieve mainstream adoption could see Bitcoin’s price stagnate or fall, potentially trading below $100,000.
    • Key Drivers: The primary factors influencing Bitcoin’s long-term price are its adoption rate, the global macroeconomic environment, and the evolving regulatory landscape.

    What is Bitcoin (BTC)? A Quick Refresher

    Before we look forward, let’s quickly glance back. Bitcoin is the world’s first decentralized digital currency, created in 2009 by the anonymous entity Satoshi Nakamoto. It operates on a technology called a blockchain, a distributed public ledger secured by a massive, global network of computers.

    Its two most important features for a long-term valuation are its decentralization and its scarcity. No single person, company, or government controls it. And its supply is capped forever at 21 million coins, making it a provably finite asset in a world of infinite money printing. This scarcity is the foundation of its narrative as a long-term store of value, or “digital gold.”

    Current Market Conditions: A Picture of Maturity

    As of today, Bitcoin is trading at $112,004. With a market capitalization of over $2.23 trillion, it has firmly established itself as a major global asset, comparable to the largest tech companies in the world. The 24-hour trading volume of nearly $37 billion shows a deep and liquid market.

    Looking at the recent price action, we see a market in consolidation. The changes over the last hour (-0.17%), 24 hours (+0.70%), and 7 days (-0.03%) are remarkably stable for an asset known for its volatility. The modest 30-day dip of -2.41% suggests the market is taking a healthy breather, digesting recent gains before its next major move. This stability at such a high price level is a sign of a maturing market, far from the wild speculation of its early years.

    On-Chain & Narrative Drivers

    While the daily price is interesting, the long-term story is written by deeper trends. Looking toward 2043, several key drivers will shape Bitcoin’s destiny.

    The halving cycles are Bitcoin’s built-in economic policy. Approximately every four years, the reward for mining new blocks is cut in half, reducing the rate of new supply. By 2043, we will have gone through several more halvings (around 2028, 2032, 2036, and 2040). By then, the new supply entering the system will be infinitesimally small. The network’s security will be almost entirely funded by transaction fees, marking a new era of maturity. The narrative power of this increasing scarcity will likely continue to drive long-term price cycles.

    Adoption follows an S-curve, just like the internet and smartphones did. Right now, Bitcoin is transitioning from the “early adopter” phase to the “early majority.” By 2043, we could be well into the “late majority” phase, where holding a small amount of Bitcoin is as common as having a retirement account. This depends heavily on the growth of institutional products like ETFs, sovereign adoption by nations, and integration into the financial mainstream.

    Bitcoin (BTC) Price Prediction: Scenarios for 2043

    Forecasting two decades out isn’t about drawing lines on a chart. Instead, we use long-term logarithmic growth models and fundamental rationale to project potential outcomes. We can use the current price of $112,004 as a data point on this massive, multi-decade journey.

    Bear Scenario: Stagnation ($50,000 – $150,000)

    In a bearish future, Bitcoin fails to achieve its potential. This could be due to a coordinated and effective global regulatory crackdown that stifles innovation and access. Alternatively, a superior technology could emerge that renders Bitcoin obsolete, though its powerful network effect makes this difficult. In this world, Bitcoin remains a niche, speculative asset for a small group of enthusiasts. Its value would fail to keep pace with inflation, and its price in 2043 could be similar to or even lower than today’s price in real terms.

    Base Scenario: Digital Gold ($500,000 – $1,000,000)

    This is the most widely anticipated scenario among long-term holders. In this future, Bitcoin continues on its current trajectory. It doesn’t replace the US dollar, but it cements its place as the world’s premier digital store of value. It becomes a common allocation in diversified portfolios, just like gold or bonds. Institutions, pension funds, and corporations regularly use it as an inflation hedge and a treasury reserve asset. This steady, growing demand, pressing against a fixed supply of 21 million coins, naturally pushes the price into the high six figures.

    Bull Scenario: A New Reserve Asset ($2,000,000+)

    The bull case sees Bitcoin transcend the “digital gold” narrative. In this scenario, ongoing global debt crises and currency debasement lead several G20 nations to officially add Bitcoin to their central bank reserves as a neutral asset. It becomes a primary settlement layer for international trade, valued for its political neutrality and predictable monetary policy. Here, Bitcoin isn’t just competing for a piece of gold’s market share; it’s competing with sovereign bonds and other Tier 1 assets. Capturing even a small fraction of this multi-hundred-trillion-dollar market would result in a price of several million dollars per coin.

    A Simple Back-of-the-Envelope Valuation

    How do we get to these numbers? Let’s do a simple valuation based on the “digital gold” narrative.

    1. Estimate the Target Market Size in 2043: The global store of value market (including gold, some sovereign bonds, high-end real estate, art) is worth well over $100 trillion today. With modest inflation and growth, it could easily be a $200 trillion market by 2043.
    2. Assume a Market Capture Rate: In our base case, let’s assume Bitcoin captures 10% of this market as the premier digital store of value. That gives Bitcoin a target market cap of $20 trillion.
    3. Calculate the Price Per Coin: By 2043, the circulating supply of Bitcoin will be approximately 20.9 million.

    Calculation: $20,000,000,000,000 / 20,900,000 coins = ~$957,000 per BTC.

    This simple model shows how a price near $1 million is not based on pure fantasy, but on a logical assumption of Bitcoin capturing a reasonable share of the global store of value market. For the bull case, a 20% capture rate would yield a price of nearly $2 million.

    Risks & What to Watch

    The road to 2043 will be anything but a straight line. Key risks remain:

    • Regulatory Risk: The biggest unknown. A hostile, coordinated global crackdown could severely hamper adoption.
    • Technological Risk: While unlikely, a critical flaw in Bitcoin’s code or the sudden arrival of quantum computers capable of breaking its encryption are tail risks.
    • Competition: Another cryptocurrency could theoretically unseat Bitcoin, though none have come close to matching its decentralization, security, and network effect.

    Investors should watch for trends in nation-state adoption, the approval and growth of institutional financial products (like spot ETFs), and the development of Layer 2 technologies like the Lightning Network, which are crucial for Bitcoin’s scalability.

    Conclusion: A Game of Decades, Not Days

    A Bitcoin (BTC) Price Prediction for 2043 is an exercise in envisioning the future of money. While the specific price targets are speculative, the underlying drivers are not. Bitcoin’s value proposition is rooted in mathematical scarcity and decentralization in a world that is increasingly digital and uncertain.

    The journey will undoubtedly be volatile. There will be bull markets that feel euphoric and bear markets that test your conviction. For long-term investors, the key is to zoom out. Think in terms of halvings and adoption cycles, not hourly price charts. The next step is not to blindly follow a prediction, but to continue your own research and decide if you believe in the long-term thesis for a decentralized, global, and incorruptible store of value.

    Frequently Asked Questions (FAQ)

    1. Is it too late to invest in Bitcoin?
    While the days of turning $100 into millions are likely over, Bitcoin’s current market cap is still a fraction of assets like gold or the global bond market. If you believe it will continue to capture a larger share of those markets, then there is still significant potential for long-term growth.

    2. How will the 2040 halving affect the price?
    By 2040, the block subsidy will be extremely small. The reduction in new supply will be less impactful in percentage terms than earlier halvings. However, the event itself is a powerful narrative reminder of Bitcoin’s scarcity, which could still fuel a cyclical price increase.

    3. Will Bitcoin’s volatility decrease by 2043?
    Yes, it is highly likely. As an asset’s market capitalization and liquidity grow, its volatility tends to decrease. By 2043, with a multi-trillion-dollar market cap, Bitcoin should trade with much more stability than it does today, behaving more like a traditional commodity.

    4. What about other cryptocurrencies? Will they overtake Bitcoin?
    The crypto space is vast and innovative. While other projects may excel in areas like smart contracts or high-speed payments, Bitcoin has an unparalleled lead in decentralization, security, and brand recognition as a store of value. It is more likely that other assets will coexist with Bitcoin, serving different purposes, rather than replacing it.

    Not financial advice. Do your own research.

    Zksync (ZK) Price Prediction: What Will ZK Price Be in 2045?

    0

    Ever wonder if the crypto you’re looking at today could be the one that defines your financial future decades from now? It’s the ultimate question for anyone looking beyond the next market cycle. While most of the crypto world is focused on next week or next month, we’re going to take a journey much further out. This ZKsync (ZK) price prediction looks deep into the future, to the year 2045, to explore what could be for one of Ethereum’s most promising scaling solutions.

    This isn’t about short-term gains. This is a thought experiment about long-term technological adoption and value creation. Let’s break down the potential future of ZKsync, piece by piece.

    TL;DR: ZK Price Outlook for 2045

    • Long-Term Focus: Predicting a price over 20 years from now is highly speculative and depends on mass adoption of both crypto and ZKsync technology.
    • Base Case Scenario ($3 – $8): Our base prediction sees ZKsync becoming a major Ethereum Layer 2, co-existing with competitors. This assumes the overall crypto market cap grows significantly and ZKsync captures a solid piece of it.
    • Bull Case Scenario ($20 – $50+): In a highly optimistic future, ZKsync becomes the dominant scaling solution for Ethereum, processing trillions of dollars in transactions as crypto integrates into the global economy.
    • Bear Case Scenario ($0.01 – $0.10): The project could fail to gain traction, be out-competed, or face technological hurdles, leading to its token price stagnating or declining significantly.
    • Key Driver: ZKsync’s success is fundamentally tied to Ethereum’s success and the wider adoption of zk-rollup technology as the preferred scaling method.

    What is ZKsync (ZK)?

    Before we can look into the future, let’s get a quick refresher on what we’re dealing with today. ZKsync is a Layer 2 (L2) scaling solution for Ethereum. Think of it as an express lane for the often-congested Ethereum highway. It bundles thousands of transactions together off-chain and then submits a single, compact proof back to Ethereum.

    The “ZK” in its name stands for “Zero-Knowledge,” which refers to the powerful cryptographic proofs (specifically, zk-SNARKs) it uses. This technology allows it to prove that all the bundled transactions are valid without revealing any of their underlying data, offering both incredible efficiency and privacy. The goal is to make using Ethereum cheaper, faster, and more scalable for everyday users and applications.

    Current Market Conditions

    To understand where ZK might go, we have to know where it stands right now. Based on current metrics, ZK is in a very early and formative stage.

    At a price of $0.056569 and a market cap of just over $408 million, it’s a relatively small player compared to established L2 giants like Arbitrum or Optimism. Its 24-hour trading volume of around $16.7 million is modest, suggesting that while there’s activity, it’s not yet capturing the market’s full attention. The price action tells a story of uncertainty: a slight gain over the past day (+1.09%) and month (+8.73%) is countered by a loss over the last week (-8.19%). This pattern often indicates a period of price consolidation, where the market is trying to decide on the token’s fair value after its initial launch.

    On-Chain & Narrative Drivers

    Looking beyond the price, the real story for a project like ZKsync is its fundamental momentum. While specific on-chain data can fluctuate, the key drivers to watch are universal for any smart contract platform. The core narrative for ZKsync is that it represents the next generation of L2 technology, potentially offering better security and efficiency than the “optimistic” rollups that lead the market today.

    Future growth will be almost entirely dependent on its ability to attract developers to build applications and users to interact with them. Key metrics to monitor over the coming years include Total Value Locked (TVL), which represents the amount of capital within its ecosystem, and Daily Active Users (DAU), a direct measure of adoption. If ZKsync can foster a vibrant ecosystem of DeFi, gaming, and other dApps that people want to use, its value will naturally follow.

    ZKsync (ZK) Price Prediction for 2045: Three Scenarios

    Projecting a price 20+ years into the future is less about technical chart analysis and more about fundamental, scenario-based reasoning. Here are three plausible paths for ZKsync, ranging from bleak to brilliant.

    Our analysis for this ZKsync (ZK) price prediction assumes that by 2045, the entire 21 billion ZK token supply will be in circulation.

    Bear Case: The Dream Fades ($0.01 – $0.10)

    In this scenario, ZKsync fails to achieve its ambitious goals. The competition from other L2s like Arbitrum, Optimism, and Starknet proves too fierce, and ZKsync is unable to carve out a significant market share. Perhaps zk-rollup technology proves too complex for developers to adopt, or a critical bug is discovered that shakes confidence in the system.

    Furthermore, Ethereum itself might develop native scaling solutions (like danksharding) that are so effective they reduce the need for external L2s. In this future, the ZK token would fail to generate meaningful demand, and its price would likely stagnate near its current levels or even bleed out as investor interest moves elsewhere. A market cap of a few hundred million to a couple billion dollars would place its price in the $0.01 to $0.10 range.

    Base Case: A Key Player in a Bigger World ($3 – $8)

    Our base case assumes a future where crypto has become a mature and integrated part of the global financial system. Ethereum solidifies its position as the primary settlement layer, and a handful of L2 solutions thrive as its main execution layers. ZKsync, in this reality, is one of those key players. It doesn’t “win” the L2 wars outright, but it becomes a go-to chain for specific use cases, perhaps in DeFi or enterprise applications.

    If we project the total crypto market cap to grow by 10-20x by 2045, and ZKsync captures a market cap of around $100 billion (similar to a major, but not dominant, tech company today), its price would be approximately $4.76. This scenario represents solid, sustained growth and successful execution by the ZKsync team over two decades. Our range of $3 to $8 accounts for ZKsync capturing a market cap between roughly $60 billion and $170 billion.

    Bull Case: The Dominant Execution Layer ($20 – $50+)

    The bull case is the dream scenario. In this future, zk-rollups are proven to be the unequivocally superior scaling technology, and ZKsync’s implementation becomes the industry standard. It achieves massive network effects, onboarding billions of users and processing a significant portion of global on-chain activity. Ethereum becomes the trust layer for the world, and ZKsync becomes the primary engine running on top of it.

    In this scenario, ZKsync’s market capitalization could rival that of today’s largest technology companies. A market cap of $500 billion would result in a token price of $23.80. If it reached a staggering $1 trillion market cap, the price would be $47.61. This future is only possible if ZKsync not only wins the L2 race but also becomes a foundational piece of a new digital economy.

    A Simple Back-of-the-Envelope Valuation

    How do we get these numbers? The logic is straightforward:

    Future ZK Price = Future Market Cap / Future Circulating Supply

    The three core assumptions we are making for our 2045 prediction are:

    1. Future Circulating Supply: We assume the full max supply of 21 billion ZK tokens will be in circulation.
    2. Future of Crypto: We assume the total crypto market grows substantially as it becomes a more mature asset class.
    3. ZKsync’s Market Share: The key variable is what percentage of that future market ZKsync can capture. This is the difference between the bear, base, and bull cases.

    This simple model helps frame the immense challenge and opportunity. The token’s price in 2045 will be a direct reflection of its market dominance.

    Risks & What to Watch

    The path to 2045 is filled with obstacles. Keep these key factors on your radar:

    • Intense Competition: The L2 space is one of the most competitive in crypto. ZKsync must innovate constantly to stay ahead.
    • Technological Risk: Zero-knowledge proofs are incredibly complex. An undiscovered bug or vulnerability could be catastrophic for the network’s reputation.
    • Regulatory Headwinds: The global regulatory landscape for crypto is still uncertain. Unfavorable laws could stifle innovation and adoption.
    • Adoption Metrics: Watch the fundamentals. Is TVL growing? Are daily user counts increasing? Is a vibrant developer community forming? These are the true signs of a healthy, growing network.

    Conclusion: A Long and Uncertain Road

    So, what will the ZK price be in 2045? The honest answer is that nobody knows for sure. The projections above are not certainties; they are educated guesses about what different futures could look like. Investing in a new technology like ZKsync is a bet on its long-term potential to solve real problems and attract a massive user base.

    The journey will be volatile, with incredible highs and gut-wrenching lows. For a retail investor, the best approach is to understand the technology, follow its development, and manage risk accordingly. ZKsync has the potential to be a cornerstone of the future of Ethereum, but its success is far from guaranteed.

    FAQ

    1. Is ZKsync a good investment today?
    That depends on your risk tolerance and time horizon. ZK is a new token for a promising but unproven technology in a highly competitive sector. It should be considered a high-risk, high-reward investment suitable for a small portion of a diversified crypto portfolio.

    2. What makes ZKsync different from Arbitrum or Optimism?
    The main difference is the technology. ZKsync uses ZK-rollups (zk-SNARKs), which rely on complex cryptography to prove transactions are valid. Arbitrum and Optimism use Optimistic rollups, which “optimistically” assume transactions are valid unless challenged. ZK-rollups are often considered more secure and efficient in the long run, but they are also more complex to build.

    3. Will the large ZK token supply keep the price low?
    A large token supply means the price per token will naturally be lower than a project with a small supply at the same market cap. For example, a $10 billion market cap would mean a price of ~$0.47 for ZK. Investors should focus on the potential for market cap growth rather than the price per token.

    4. How important is the ZK airdrop to its future?
    The airdrop was a crucial event for decentralizing the network and getting the token into the hands of early users. However, its long-term success will depend less on the initial distribution and more on the protocol’s ability to create sustained value and utility for token holders over many years.

    Not financial advice. Do your own research.

    Chainlink (LINK) Price Prediction: What Will LINK Price Be in 2034?

    0

    Imagine a world where your mortgage, your stock portfolio, and even your concert tickets are all represented on the blockchain, interacting seamlessly with real-world events and data. This isn’t science fiction; it’s the future being built today, and at the heart of it lies Chainlink. As an investor, you’re not just buying a token; you’re betting on the infrastructure that will connect blockchains to everything else. This long-term vision is precisely why so many are asking for a detailed Chainlink (LINK) Price Prediction for the next decade.

    Before we dive deep, a quick but important reminder: this article is for informational and educational purposes only. Cryptocurrency markets are highly volatile. The following analysis is not financial advice. Always conduct your own thorough research before making any investment decisions.

    TL;DR: LINK Price in 2034

    For those in a hurry, here’s a snapshot of our long-term outlook for Chainlink.

    • Current Pulse: LINK is showing strong monthly momentum, shaking off a minor weekly dip. Investor interest is high, reflected in robust trading volume.
    • Key Drivers: Chainlink’s future is tied to two massive narratives: the tokenization of Real-World Assets (RWA) and its Cross-Chain Interoperability Protocol (CCIP), which aims to be the universal messaging standard for blockchains.
    • Base Case Prediction for 2034: If Chainlink maintains its dominance as the top oracle and CCIP sees significant adoption, a price range of $250 – $500 per LINK is plausible, aligning with broader crypto market growth.
    • Bull Case Prediction for 2034: In a scenario where Chainlink becomes the undisputed standard for all on-chain data and cross-chain value transfer, its network could secure trillions of dollars. This could propel LINK into a $800 – $1,500 range.
    • Bear Case Prediction for 2034: Stiff competition, a failure to innovate, or a prolonged crypto winter could see LINK struggle to maintain its network effect, potentially leading to a price range of $15 – $40.

    What is Chainlink (LINK)? A Quick Refresher

    At its core, Chainlink is a decentralized oracle network. Think of it as a secure bridge. Blockchains are incredible at maintaining a ledger, but they’re isolated systems. They can’t, by themselves, access external data like stock prices, weather information, or sports results.

    Chainlink solves this problem. It provides a reliable way for smart contracts to connect to real-world data, events, and payment systems. The LINK token is the lifeblood of this network. It’s used to pay node operators for providing this crucial data-fetching and validation service, creating a circular economy where good behavior and accurate data are rewarded.

    Let’s break down the live metrics to understand where Chainlink stands right now. As of this writing, LINK is trading at $23.47, with a market capitalization of over $15.9 billion. This firmly places it in the top tier of crypto assets, signifying a mature and highly-valued project.

    The 24-hour trading volume is a healthy $1.16 billion, suggesting strong liquidity and active interest from traders. Looking at the price action, we see a story of bullish momentum. While it’s down slightly over the last 7 days (-3.52%), its 30-day performance is a staggering +44.28%. This indicates that after a powerful run-up, the asset experienced a brief cooldown and is now showing signs of renewed strength, with positive gains in the last hour and 24-hour periods. This is classic behavior for an asset in high demand.

    On-Chain and Narrative Drivers

    Beyond the daily price charts, the real story for a decade-long prediction lies in the fundamental drivers. For Chainlink, two narratives are paramount: Real-World Assets (RWA) and Cross-Chain Interoperability.

    The RWA narrative is about bringing trillions of dollars of traditional assets—like real estate, stocks, and bonds—onto the blockchain. For these tokenized assets to have any value, they need reliable, real-time price feeds. Who provides those? Chainlink. As this sector grows, the demand for Chainlink’s services is expected to explode, directly increasing the demand for the LINK token to secure that data.

    Secondly, Chainlink’s Cross-Chain Interoperability Protocol (CCIP) is a game-changer. It’s designed to be a universal standard for blockchains to communicate and transfer value with each other. In a world with hundreds of different chains, CCIP acts like the TCP/IP of the internet, a fundamental protocol that allows everyone to connect. If CCIP becomes the industry standard, Chainlink will be at the center of all cross-chain activity, a position of immense value.

    Chainlink (LINK) Price Prediction for 2034

    A 10-year forecast in crypto is an exercise in strategic foresight, not certainty. We’ll explore three potential scenarios based on the drivers we’ve discussed.

    Bear Case: The Network Stalls ($15 – $40)

    In a bearish scenario, Chainlink’s dominance is challenged. A new, more efficient oracle solution emerges and captures significant market share. The RWA narrative fails to gain the expected traction, or regulators stifle its growth. In this world, CCIP might be adopted, but only as one of several competing standards. LINK would still be a relevant token for a useful network, but its growth would be capped. Its price would likely stagnate, subject to the broader market cycles but failing to set new, explosive all-time highs.

    Base Case: The Standard-Bearer ($250 – $500)

    This is the most probable scenario in our view. Chainlink solidifies its position as the undisputed oracle leader. The RWA market grows into a multi-trillion dollar industry, and Chainlink secures a significant portion of it. CCIP becomes a leading, if not the sole, standard for institutional cross-chain transfers. The overall crypto market capitalization grows 10-20x from today’s levels over the next two market cycles. In this future, the value secured by the Chainlink network would necessitate a much higher LINK price to maintain economic security, pushing it well into the triple digits.

    Bull Case: The Foundational Layer of a New Financial System ($800 – $1,500)

    In the most optimistic scenario, everything goes right. The tokenization of all assets becomes a reality, and Chainlink is the exclusive oracle provider for the largest financial institutions in the world. CCIP is adopted universally, becoming the core plumbing for the “internet of value.” The economic activity flowing through Chainlink’s network would be measured in the tens of trillions of dollars. The LINK token wouldn’t just be a utility token; it would be a foundational economic asset for global finance, justifying a market capitalization that rivals today’s largest tech companies and a price per token approaching or exceeding $1,000.

    A Simple Valuation Model

    Let’s try a simple back-of-the-envelope calculation to ground our base case.

    • Assumption 1: Total Addressable Market. By 2034, let’s conservatively estimate that the value of tokenized assets and on-chain derivatives that require oracle services reaches $30 trillion.
    • Assumption 2: Chainlink’s Market Share. We’ll assume Chainlink maintains its dominance and secures 50% of this market, meaning its Total Value Secured (TVS) is $15 trillion.
    • Assumption 3: Value Capture. A common valuation model suggests a network’s market cap should be a percentage of the value it secures. Let’s assume a modest 2% value capture rate for economic security.
    • Calculation: 2% of $15 trillion is a $300 billion market capitalization.

    With a maximum supply of 1 billion LINK tokens, a $300 billion market cap translates to a $300 price per LINK. This simple model shows how our base case prediction of $250 – $500 is very much within the realm of possibility.

    Risks and What to Watch

    No investment is without risk. For Chainlink, keep an eye on these factors:

    • Competition: Watch for other oracle projects or new interoperability solutions gaining significant partnerships or technological breakthroughs.
    • Centralization Concerns: While decentralized, the network’s development and some key functions are still guided by the core team. Further decentralization will be key to long-term trust.
    • Systemic Risk: A major hack or bug within Chainlink’s core smart contracts could be catastrophic for its reputation and the many DeFi projects that rely on it.
    • Market Adoption: The success of the bull and base cases depends entirely on the RWA and cross-chain narratives playing out as expected. Monitor institutional adoption of these technologies.

    Conclusion and Next Steps

    Chainlink is more than just another cryptocurrency; it’s a fundamental piece of infrastructure aiming to solve one of the biggest challenges for the blockchain industry. Its future price is not a matter of hype, but of execution and adoption. The path to 2034 will be volatile, but the long-term thesis is clear: if blockchains are to integrate with the global economy, they need a bridge. Chainlink is, by far, the strongest contender to be that bridge.

    Your next step as an investor is to look beyond the price and study the fundamentals. Follow Chainlink’s partnership announcements, track the growth of its Total Value Secured, and keep a close watch on the development and adoption of CCIP. The story of the next decade is just beginning to be written.

    Frequently Asked Questions (FAQ)

    Can Chainlink (LINK) really reach $1000?

    Reaching $1000 per LINK would imply a $1 trillion market capitalization. While this is a massive figure, it’s not impossible in our bull case scenario for 2034. It would require Chainlink to become the foundational data and interoperability layer for a multi-trillion dollar tokenized asset economy, a future where its role is as critical to digital finance as core internet protocols are to communication today.

    What is CCIP and why is it so important for this Chainlink (LINK) Price Prediction?

    CCIP stands for Cross-Chain Interoperability Protocol. It’s a technology that allows different blockchains to send messages and transfer tokens to each other securely. It’s crucial for our price prediction because if CCIP becomes the industry standard, Chainlink will earn fees on a massive volume of cross-chain transactions, creating a powerful new revenue stream and increasing the utility and demand for the LINK token.

    Who are Chainlink’s biggest competitors?

    Chainlink’s primary competitors in the oracle space include projects like Band Protocol and API3. In the cross-chain interoperability space, it competes with solutions like LayerZero and Wormhole. However, Chainlink currently has a significant first-mover advantage and the largest network effect in the oracle market.

    Is LINK a good long-term investment?

    Whether LINK is a good long-term investment depends on your risk tolerance and belief in its mission. It has strong fundamentals, a dominant market position, and is aligned with powerful, long-term trends like asset tokenization. However, like all crypto assets, it carries significant risk and volatility.

    Not financial advice. Do your own research.