More
    Home Blog Page 45

    What Is Aster (ASTER) Price Today? ASTER Technical Analysis (November, 2025)

    0

    That sharp 50% drop in your portfolio can feel like a punch to the gut, can’t it? One moment you’re riding high, and the next, you’re staring at a sea of red, questioning every decision. But then, a flicker of green appears. A strong weekly bounce. Now, Aster (ASTER) sits at a critical crossroads, leaving everyone wondering: was that the bottom, or is this just a brief pause before the next leg down? In this article, we’ll break down the numbers and provide a clear-eyed Aster (ASTER) Technical Analysis to help you navigate what comes next.

    TL;DR: The Current State of ASTER

    • At a Crossroads: ASTER is currently trading around the crucial $1.015 mark, recovering over 14% this week but still down a staggering 50% on the month.
    • Massive Volume: Trading volume is exceptionally high, nearing 50% of its market cap in 24 hours. This signals a major battle between buyers and sellers is underway.
    • Key Levels are Clear: The immediate future for ASTER will likely be decided by whether it can break resistance around $1.25 or falls below support at $0.85.
    • High Volatility Ahead: The conflicting short-term and long-term trends, combined with high volume, suggest significant price swings are likely in the near future.

    What is Aster (ASTER)?

    For those new to the project or in need of a quick refresher, Aster is a Layer-1 blockchain designed to power the future of decentralized artificial intelligence (AI). Its core mission is to create a transparent and efficient marketplace for AI data and computational resources.

    Think of it as a foundational layer where developers can build AI-driven applications without relying on centralized tech giants. By tokenizing data sets and processing power, Aster aims to democratize access to AI, allowing anyone to contribute to or utilize its network. This powerful narrative has been a significant driver of its growth and adoption over the past year.

    Interpreting the Current Market Conditions

    Let’s cut through the noise and look directly at the data. At a price of $1.015, ASTER is hovering just above the psychological $1.00 support level. This is a classic battleground where market sentiment is often decided. Its market cap of just over $2 billion places it firmly in the big leagues, but with plenty of room for potential growth compared to top-tier projects.

    The most telling metric right now is the 24-hour volume of over $933 million. For a project with a $2 billion market cap, this is incredibly high. It tells us that ASTER is the center of attention. This isn’t quiet accumulation or distribution; it’s an all-out war. The price action confirms this story: a brutal 50% sell-off in the last 30 days, followed by a fierce 14.5% relief rally over the past week. The last 24 hours have seen a 6% pullback, suggesting the rally is facing its first serious test.

    On-Chain & Narrative Drivers

    Without deep on-chain data, we have to read the tea leaves. The massive trading volume could be interpreted in two ways. On the one hand, it could be “smart money” or large investors (whales) aggressively accumulating ASTER at a 50% discount. They may see this as a prime opportunity to buy into a strong project.

    On the other hand, this volume could represent panic selling from retail investors being met by short-term traders, leading to chaotic price action and liquidations. The prevailing narrative around AI remains strong, which is a tailwind for Aster. However, the recent market-wide downturn has clearly impacted even projects with strong fundamentals. The key question is whether the AI narrative is strong enough to help ASTER decouple and lead a recovery.

    Aster (ASTER) Technical Analysis: Three Scenarios for November

    Based on the current data, the price can realistically move in one of three directions in the coming weeks. Here is a breakdown of the bull, bear, and base cases.

    The Base Case: Sideways Chop ($0.90 – $1.15)

    The most likely short-term scenario is a period of consolidation. The 50% monthly downtrend is a powerful force, but the 14% weekly bounce shows buyers are stepping in with conviction. This could lead to a stalemate where ASTER bounces between support around $0.90 and resistance at $1.15.

    In this scenario, the high volume would gradually decrease as the market finds a temporary equilibrium. Traders would be watching for a decisive break of either side of this range to signal the next major move. This “choppy” period allows the market to absorb the recent volatility before choosing a clearer direction.

    The Bullish Case: The Recovery Continues (Target $1.50)

    For the bulls to take control, ASTER needs to decisively break above the recent highs, likely around the $1.25 resistance level. A sustained move above this point would invalidate the recent downtrend and suggest the weekly bounce is the start of a new uptrend.

    High volume on such a breakout would be a very strong confirmation signal. The first logical target would be the $1.50 area, which represents a significant psychological level and a reclamation of a portion of the recent losses. This outcome relies on the broader market remaining stable and the AI narrative regaining momentum.

    The Bearish Case: Support Fails (Target $0.70)

    If the sellers regain control, the first sign of trouble will be a failure to hold the $1.00 psychological level, followed by a break below the recent swing low of approximately $0.85. This would indicate that the 14% weekly bounce was merely a “dead cat bounce” a temporary relief rally in a continuing downtrend.

    A break below $0.85 on significant volume would open the door for a retest of lower support levels, with $0.70 being a plausible next target. This scenario would likely be triggered by negative news, a broader market downturn, or a simple exhaustion of buyers after the recent rally.

    A Simple Back-of-the-Envelope Valuation

    Valuing crypto is notoriously difficult, but we can use a simple comparative analysis to get a rough idea. This is speculative and based on several assumptions, so treat it as a thought experiment.

    Let’s assume ASTER’s primary competitor in the decentralized AI space is a project called “Neuronet (NRT)” with a market cap of $10 billion. ASTER’s current market cap is about $2 billion.

    If we assume that over the next year or two, ASTER’s technology and adoption allow it to capture a significant portion of the market and reach just half of Neuronet’s current valuation, its market cap would become $5 billion. Based on its current circulating supply of roughly 2.01 billion tokens, a $5 billion market cap would translate to a price of approximately $2.48 per ASTER. This illustrates the potential upside if the project successfully executes its vision.

    Risks and Key Levels for Your Aster (ASTER) Technical Analysis

    Before making any decisions, you must be aware of the risks. The extreme volatility is the most immediate threat; prices can swing wildly, and using stop-losses is critical for risk management. Furthermore, ASTER’s price is still highly correlated with the broader crypto market, particularly Bitcoin. A major downturn in Bitcoin would almost certainly drag ASTER down with it.

    Keep your chart simple and watch these key areas:

    • Major Support: $0.85. A break below this is a strong bearish signal.
    • Psychological Level: $1.00. Holding above this is important for short-term sentiment.
    • Major Resistance: $1.25. A break above this is a strong bullish signal.

    Conclusion: A Project at an Inflection Point

    Aster is at a fascinating and critical juncture. The clash between a brutal monthly sell-off and a powerful weekly rebound, all happening on massive trading volume, has created an environment ripe with both opportunity and risk. The next few weeks will be telling.

    Your next step should not be to rush into a trade. Instead, watch the key levels of $0.85 and $1.25 closely. Observe how the price and volume react at these points. Let the market show its hand before you commit your capital. The story of ASTER’s next chapter is about to be written, and patience will be your greatest asset.

    Frequently Asked Questions (FAQ)

    1. What is a realistic price target for ASTER in 2025?
    Price targets are speculative, but based on our technical analysis, a bullish continuation could target the $1.50 – $2.00 range in the coming months. A longer-term, fundamental-driven target could be higher if it achieves widespread adoption, as explored in our valuation exercise.

    2. Is ASTER a good investment right now?
    ASTER is a high-risk, high-reward asset. Its value is tied to a powerful narrative (AI), but it is experiencing extreme volatility. Whether it’s a “good” investment depends entirely on your personal risk tolerance, research, and investment timeline. It is currently in a very speculative phase.

    3. Why did ASTER drop so much in the last 30 days?
    The 50% drop was likely caused by a combination of factors, including a market-wide correction that affected most cryptocurrencies, significant profit-taking after a previous run-up, and potential liquidations of leveraged positions that accelerated the sell-off.

    4. What does the high trading volume for ASTER mean?
    The exceptionally high volume indicates a massive amount of interest and disagreement in the market. It means a large number of tokens are changing hands. This can be bullish if it represents accumulation by long-term holders, or bearish if it represents distribution (selling) by early investors. It guarantees that a significant move is likely coming soon.

    Not financial advice. Do your own research.

    Sudeng (HIPPO) Price Prediction: What Will HIPPO Price Be in 2042?

    0

    Imagine it’s 2042. You’re checking your portfolio after nearly two decades. Did that small, speculative bet you made on a token called HIPPO change your life, or did it fade into the digital dust of crypto history? That’s the multi-million dollar question we’re exploring. While nobody has a crystal ball, especially one that sees 20 years into the future, we can analyze the data, understand the potential pathways, and create a framework for thinking about this Sudeng (HIPPO) price prediction.

    This isn’t about hype or wild guesses. It’s about taking a sober look at the metrics, the market, and the long road ahead to understand what might be in store for a token that’s currently capturing the market’s attention.

    TL;DR: Quick Look at the HIPPO Forecast

    • Explosive Short-Term Growth: HIPPO is currently in a parabolic phase, with its 24-hour trading volume exceeding its market cap. This indicates intense speculation and high volatility, a classic sign of a high-risk, high-reward asset.
    • Long-Term Uncertainty: A forecast for 2042 is highly speculative. HIPPO’s survival and growth depend entirely on its ability to maintain relevance, build a strong community, and deliver on a long-term vision.
    • Bear Scenario (Near $0): Most new crypto projects fail. If development stalls or community interest wanes, HIPPO could easily trend towards zero over the next two decades.
    • Base Scenario ($0.15 – $0.45): If HIPPO survives and carves out a niche, it could see significant growth, potentially reaching a market capitalization of a few billion dollars by 2042, aligning with the overall growth of the crypto market.
    • Bull Scenario ($1.25+): In a highly optimistic scenario where HIPPO achieves widespread adoption or becomes a cultural cornerstone (like early meme coins), its price could exceed a dollar, pushing its market cap into the tens of billions.

    What is Sudeng (HIPPO)?

    Sudeng (HIPPO) is a digital asset that has recently surged onto the scene, capturing the attention of traders with its explosive price action. Like many emerging tokens, its primary narrative is still being built. Is it a meme coin driven by community and culture? Is it a utility token for a yet-to-be-released platform or ecosystem? Answering this question is the first step in any long-term analysis.

    For now, its identity is defined by its market activity. It represents a class of assets that offer high-risk exposure to the crypto market’s speculative nature. Investors are often drawn to tokens like HIPPO for their potential for rapid, outsized gains, while being fully aware that this comes with an equal potential for rapid, significant losses. Understanding the project’s whitepaper, its development team, and its community goals is crucial to looking past the current price chart.

    Current Market Conditions: A Coiled Spring

    Let’s break down the live metrics, because they tell a fascinating story. With a price of $0.007172 and a market cap of around $71.5 million, HIPPO is firmly in the “low-cap gem” or “micro-cap” category. Assets in this range are known for their potential to multiply in value rapidly, but they also carry substantial risk.

    The most telling metric is the relationship between the 24-hour volume ($86.3 million) and the market cap. When volume exceeds market cap, it means the entire value of the project is “turning over” more than once a day. This is a clear indicator of extreme short-term interest and speculation. The price changes confirm this narrative: a staggering 198% gain in 24 hours and a 366% gain over the week. This is not sustainable, organic growth; it’s a speculative frenzy. While exciting, traders should be prepared for sharp volatility and potential corrections.

    A Deep Dive into the Sudeng (HIPPO) Price Prediction for 2042

    Projecting nearly two decades into the future is an exercise in strategic foresight, not precision. The entire crypto landscape will be unrecognizable by 2042. Our Sudeng (HIPPO) price prediction for 2042 is based on broad scenarios tied to market cap growth, adoption, and overall crypto market maturation.

    For our analysis, we first need to establish the circulating supply. Based on the current data:
    Circulating Supply = Market Cap / Price = $71,547,205 / $0.007172 ≈ 9.98 billion HIPPO. We will use this as our supply basis, assuming no major token burns or inflation.

    Bear Case: The Long Fade to Zero

    The unfortunate reality for most altcoins is that they don’t survive multiple market cycles. In this scenario, HIPPO’s current hype fades. The development team fails to deliver on its roadmap, the community moves on to the next hot project, and trading volume dries up.

    By 2042, HIPPO could become a “ghost token,” technically still existing on the blockchain but with virtually no liquidity or value.

    • Rationale: Competition, failure to innovate, regulatory hurdles, or a loss of narrative relevance.
    • 2042 Price Prediction Range: $0.00001 to $0.00

    Base Case: Survival and Niche Adoption

    In our base scenario, HIPPO proves it has staying power. It survives the initial hype cycle, weathers several bear markets, and successfully builds a dedicated community around a specific use case or cultural identity. It doesn’t become a top 10 coin, but it becomes a respected, established project in a specific niche.

    We can model this by assuming the total crypto market cap grows to $20 trillion by 2042 (a reasonable long-term estimate). If HIPPO can capture just 0.01% of that market, its market cap would be $2 billion.

    • Rationale: Consistent development, strong community management, and a clear, defensible use case.
    • 2042 Price Prediction Range: $0.15 to $0.45 (based on a $1.5B to $4.5B market cap)

    Bull Case: A Breakout Success Story

    The bull case is what every investor dreams of. In this scenario, HIPPO not only survives but thrives. It either becomes a dominant meme coin with unshakeable cultural relevance or its underlying technology becomes essential to a major Web3 sector. It achieves a market capitalization comparable to what today’s most successful projects have at their peaks.

    Let’s use a conservative-bull target of a $15 billion market cap, which is significantly less than the peaks of giants like Dogecoin or Cardano today.

    • Rationale: Viral adoption, a “killer app” or use case, major partnerships, and a flawless execution of its long-term vision.
    • 2042 Price Prediction Range: $1.25+ (based on a $12.5B+ market cap)

    Simple Valuation Back-of-the-Envelope

    Let’s simplify the valuation with a comparative approach. Forget 2042 for a moment and ask: what would the price be if HIPPO reached the size of other known projects today?

    • Assumption: Circulating supply remains around 10 billion HIPPO.
    • Target 1: A $500 Million Market Cap. This would make it a solid mid-cap project today.
      • Price = $500,000,000 / 10,000,000,000 = $0.05
    • Target 2: A $5 Billion Market Cap. This would place it in the top 25-30 projects today.
      • Price = $5,000,000,000 / 10,000,000,000 = $0.50
    • Target 3: A $20 Billion Market Cap. This would make it a top 10 contender.
      • Price = $20,000,000,000 / 10,000,000,000 = $2.00

    This exercise shows the direct relationship between market capitalization and price. The question for 2042 isn’t just about price, but whether HIPPO can grow its value and significance by 10x, 100x, or more from its current $71.5 million level.

    Key Risks and What to Watch for in HIPPO

    Investing in a project like HIPPO is not for the faint of heart. The current metrics scream volatility. The price could fall 50% just as quickly as it rose 200%.

    Key risks include:

    • Extreme Volatility: The high volume-to-market-cap ratio suggests the price is driven by short-term traders. A sharp downturn is highly possible.
    • Narrative Risk: Is this a flash in the pan? If the hype dies down and there’s no substance to back it up, early investors could be left holding the bag.
    • Long-Term Relevance: The biggest challenge is staying relevant for almost two decades in a fast-moving industry. HIPPO needs a clear vision and an ability to adapt.
    • Regulatory Risk: The regulatory landscape for crypto in 2042 is completely unknown. New laws could impact HIPPO’s viability.

    Watch for developer activity on platforms like GitHub, the tone and growth of community engagement on social media, and the project’s ability to deliver on its roadmap milestones. These are the fundamental health indicators that will matter long after the current speculative wave has passed.

    Conclusion: A Long-Term Bet on an Unknown Future

    Making a Sudeng (HIPPO) price prediction for 2042 is a fascinating thought experiment. The current data shows a token in the grips of a speculative frenzy, offering a tantalizing glimpse of what’s possible in crypto. However, the path from a $71 million market cap to a multi-billion dollar valuation is long and filled with peril.

    For investors, the key is to look beyond the daily charts. Investigate the project’s fundamentals, understand its goals, and assess whether it has the team and community to survive for the long haul. A small, calculated position in a project like HIPPO could be life-changing, but it could just as easily become a lesson in risk management. The next steps are to dig deeper into the project’s own materials and decide if its vision is one you believe in for the next 20 years.

    Frequently Asked Questions (FAQ)

    Is Sudeng (HIPPO) a good investment?
    HIPPO is a high-risk, high-reward investment. Its recent performance is impressive but also indicates extreme volatility. Whether it’s a “good” investment depends entirely on your risk tolerance and belief in the project’s long-term potential. It should only represent a small portion of a diversified portfolio.

    How high can the price of HIPPO realistically go?
    Realistically, if HIPPO establishes a strong niche and survives multiple market cycles, a price between $0.15 and $0.45 by 2042 is a plausible base-case scenario. A bull case could see it go over $1.00, but this would require flawless execution and massive adoption.

    What factors will drive the Sudeng (HIPPO) price prediction?
    In the short term, the price is driven by market sentiment, hype, and speculative trading volume. For the long-term 2042 prediction, the key drivers will be technology development, community growth, real-world adoption, token utility, and the overall health of the global cryptocurrency market.

    Where can I buy Sudeng (HIPPO)?
    To purchase HIPPO, you would need to find a centralized or decentralized exchange that has listed it for trading. Always use reputable platforms and ensure you are interacting with the correct token contract address to avoid scams.

    Not financial advice. Do your own research.
    I Cracked the Code to Making Smarter Crypto Decisions: Here Are 3 Secrets to Succeed

    0

    I’ve lost thousands in crypto trades and DeFi, and for years I blamed either bad luck or bad timing. 

    It wasn’t until I finally understood how the market actually works that I recognized the real reason for my failure: poor decision-making.

    If you’ve spent any time in crypto, you know how overwhelming it can be. The space moves fast, narratives flip overnight, and what looks like conviction today can turn into confusion tomorrow.

    Early on, I made a lot of decisions based on hype, instinct, and social media chatter. Some worked. Most didn’t. 

    I’d chase momentum, get trapped in liquidity cliffs, and exit too early when volatility hit. What finally changed was taking a structured, data-backed approach to everything, especially when the market felt chaotic.

    Now I know: crypto investing is really about is building a repeatable system that helps you see through noise, spot genuine opportunities early, and make consistent, intelligent decisions. 

    After years of refining my process (and watching what separates consistent winners from the rest), here are the three biggest lessons that changed everything for me.

    1. Use Better Tools to Track Market Shifts & Social Sentiment

    Crypto is flooded with data. 

    The challenge isn’t access, it’s interpretation. Most people drown in dashboards and alerts without knowing what actually matters. The real advantage comes from combining multiple lenses: social, technical, and on-chain to see where the market is really heading before the crowd does.

    Everyone loves to talk about “altcoin season.” But very few can define it in measurable terms. That changed for me when I started quantifying what used to be “vibes.” 

    🤔 For example, the Altcoin Season Index helped me track when a broad rotation was statistically underway: when 75% of the top 50 coins were outperforming Bitcoin. That simple shift from opinion to data was a game-changer.

    Then, I layered on better tools:

    • Pump Parade: My go-to for scanning high-potential, small-cap projects based on market sentiment, on-chain metrics, and technical analysis. It helped me distinguish organic momentum from manufactured hype. Instead of guessing what was trending, I could see it forming in real time.
    • Glassnode and Santiment: For macro-level on-chain signals. Watching stablecoin inflows, exchange reserves, and whale wallet activity became my north star for timing shifts in risk appetite.
    • TradingView: Customized alerts on structure breaks, funding rate flips, and RSI divergences meant I didn’t need to stare at charts all day.

    The real magic came when I started correlating these layers. 

    If Pump Parade showed growing social traction, and on-chain data confirmed rising unique wallet activity (while technicals hinted at accumulation) that was enough to act decisively.

    💪🏼 When I combined social sentiment with capital flow data, I stopped getting blindsided. I could see rotations before they were obvious. I could tell when altcoin strategies made sense, and when it was time to step back into BTC or stables.

    Most traders make emotional decisions because they don’t trust or don’t know how to read their data. Once you build a system where each layer confirms the others, your confidence compounds naturally.

    💡 Lesson: When the data is available, guessing is a choice. Use advanced crypto research and market analysis tools to make sure you’re always well informed.

    2. Treat Small Caps as High-Conviction Plays, Not Lotto Tickets

    Most people approach small caps like scratch-offs. 

    They scatter a few bets, pray one 100x’s, and call it “strategy.” But real small-cap success doesn’t come from luck, but from conviction built on evidence. 

    You have to treat these plays like early-stage startups, not gambling tickets.

    That means research. Yes, even for memecoins. Understanding what you own and why is crucial. Every great small-cap win I’ve had shared the same DNA: an early but functional product or viral trend, clear demand signals, and a motivated community that wasn’t just farming airdrops.

    What I Look For

    Here’s how I evaluate small-cap crypto opportunities today:

    • Product over promise: Is there a working MVP or real usage metrics? I avoid anything that’s been “coming soon” for six months.
    • Incentive design: How are users rewarded? Is it sustainable, or is it just yield dilution in disguise?
    • Team quality: I’ll dig into founders’ previous projects, even non-crypto ones. Execution history matters more than fancy whitepapers.
    • Tokenomics clarity: I want transparent unlock schedules, a defined treasury strategy, and a clear link between token usage and network growth.

    But data is just the start. What’s most important is interpreting context. I’ll often pair metrics with qualitative cues, like Discord/Telegram growth, GitHub commits, or wallet diversity. 

    You can tell a lot about a project’s health by who’s showing up, not just how many are there.

    My Approach to Position Sizing

    Even when I love a project, I size small caps conservatively. 

    Usually between 0.5–2% of my total portfolio, unless conviction is extremely high. 

    For example, one of my biggest wins was a DeFi protocol called GMX. I accumulated quietly during a 3-month flat period. The liquidity was low, holders weren’t showing up, but the team kept building. When volume returned and CEX listings hit, the token did a 7x. 

    But I wasn’t surprised. I’d been watching the fundamentals tighten for weeks. The key wasn’t catching hype; it was catching inflection.

    It’s also important to stay update. Every quarter, I reassess:

    • Is growth accelerating or stalling?
    • Has the roadmap changed?
    • Are new competitors eating their niche?

    If the data weakens, I scale down. If traction builds, I add on strength.

    The Small Cap Mindset

    The difference between a gambler and an investor in crypto is process. If you treat a small-cap token like a startup, you start asking sharper questions. You stop chasing pumps and start accumulating conviction.

    Because at the end of the day, your edge isn’t in finding the next “moonshot.” It’s in identifying something fundamentally strong before the rest of the market recognizes it.

    💡 Lesson: Treat every investment like a business. If you wouldn’t invest in the team or model in another industry, don’t justify it just because it’s on-chain.

    Visit Pump Parade and get free access to the most advanced crypto AI tools.

    3. De-risk Through Strategy, Not Emotion

    The hardest part of crypto isn’t finding opportunities, it’s managing yourself once you’re in one. 

    The volatility, the hype, the “should I sell?” questions: it all eats at your discipline. The truth is, most people don’t lose money because they pick the wrong coins. They lose because they don’t have a playbook when things get chaotic.

    Emotion is inevitable. What matters is that it doesn’t decide for you.

    Build Systems, Not Feelings

    Every successful trader or investor I know operates with structure. That means predefined entry and exit rules, allocation sizing, and fallback plans. You don’t need to be perfect, you just need to be consistent.

    For me, that structure looks something like this:

    • Define what kind of trade it is before entering (scalp, swing, long-term hold).
    • Decide whe I’ll take profits and where I’ll cut losses before hitting “buy.”
    • Use staggered scaling in/out, not all-or-nothing moves.

    That alone cut my emotional stress in half. It also prevented me from turning small wins into big losses, something almost everyone in crypto learns the hard way.

    Yield Farming: Risk by Design

    Take yield farming, for example. The rewards look irresistible until you realize most “APY” numbers are unsustainable emissions meant to attract liquidity. The trick is identifying when yield is earned (from actual protocol fees or volume) versus subsidized.

    My rule is simple:

    • If I can’t explain where the yield comes from in one sentence, I don’t farm it.
    • I only touch platforms with audited contracts, transparent emissions, and real economic activity behind them.

    Yield farming isn’t passive income as much as it’s active risk management. If you don’t know who’s on the other side of the trade, you’re probably their exit liquidity.

    Trading Signals & AI Agents

    When it comes to crypto trading signals, I never rely on any single source.

    Most signal groups are chasing engagement, not accuracy. I use signals as prompts for deeper research, not instructions to buy.

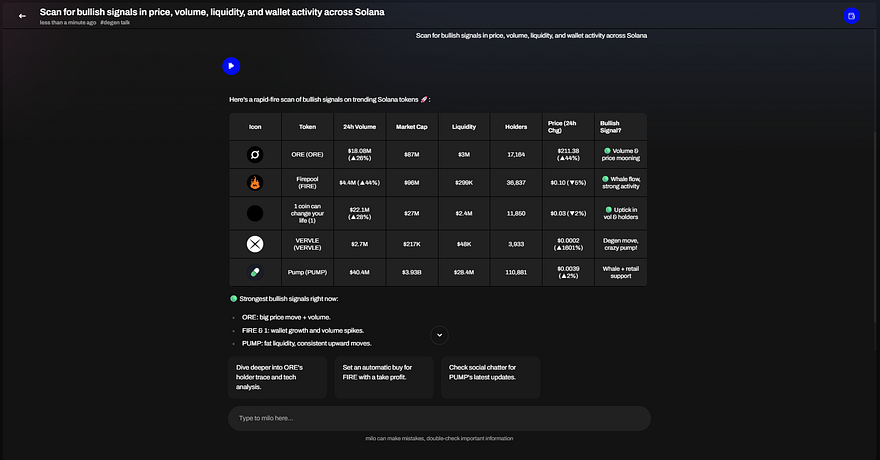
    That’s why I use advanced crypto AI tools and agents: systems that scan for anomalies in price, volume, liquidity, and wallet activity across multiple ecosystems.

    These agents watch for subtle shifts, like an increase in unique wallet activity right before volume spikes, or LP migrations that signal stealth rotations.

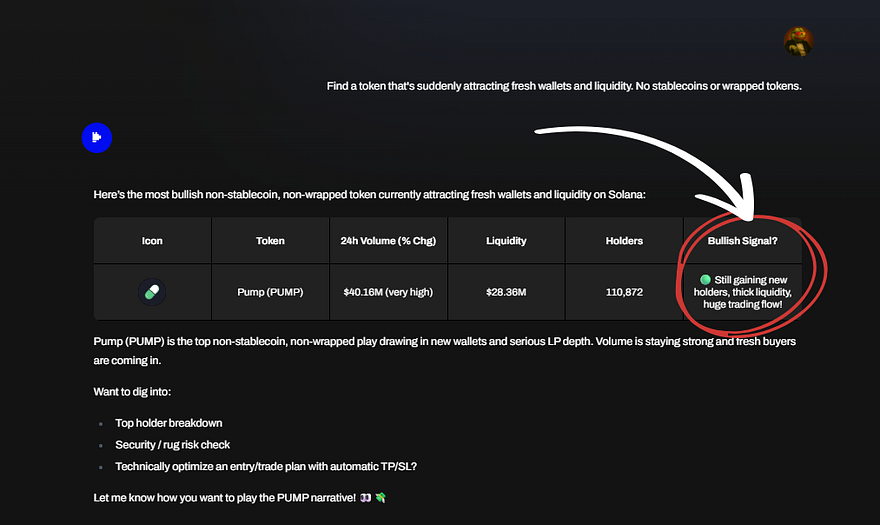
    They’ve become my early-warning system. If my AI flags a token that’s suddenly attracting fresh wallets and liquidity, I know something’s happening beneath the surface. 

    It doesn’t mean “ape in.” It means start paying attention.

    Codify Your Edge

    Discipline is about codifying your process so emotion doesn’t drive decisions.

    That means writing things down: your rules, your triggers, your red lines. It means checking your portfolio weekly, not hourly. And it means accepting that missing a trade is better than forcing one.

    Because crypto rewards those who stay alive long enough to catch the next cycle.

    💡 Lesson: It’s impossible for us as humans to eliminate emotion. But we can set automations and mechanisms to make sure emotion never overrides our system.

    Final Thought: Success in Crypto Is a Process, Not a Fluke

    The longer I’ve been in crypto, the more I’ve realized that consistency beats brilliance. The traders who last are the ones who’ve built a process that holds up when the noise gets loud.

    This space moves at an impossible pace. New tokens launch every day. Narratives explode and die within weeks. Liquidity rotates across chains overnight. You can’t control that. What you can control is how you respond to it.

    For me, that meant slowing down when everyone else was speeding up. It meant asking better questions, tracking real data, and building habits that removed luck from the equation as much as possible.

    Most people think crypto success comes from predicting what’s next. But the truth is, it comes from recognizing pattern: in price, in sentiment, and in behavior. And having the discipline to act (or not act) accordingly.

    If you want to succeed here long-term, you don’t need perfect timing. You need a framework that helps you:

    • See early: Track how sentiment, liquidity, and narratives evolve in real time.
    • Act rationally: Size risk, define rules, and let data (not dopamine)drive execution.
    • Adapt quickly: The moment your edge stops working, refine it. The best traders aren’t attached to being right. They’re obsessed with staying effective.

    I still get trades wrong sometimes. I still misread narratives. But now, my losses are smaller, my wins compound faster, and my decisions are deliberate. 

    That’s the real payoff of structure: it builds resilience.

    So whether you’re trying to find the next breakout altcoin, navigate yield farming platforms, or use AI tools to sharpen your trading, remember: your biggest advantage isn’t access. It’s clarity.

    Clarity in data. Clarity in process. Clarity in mindset.

    Because in a market built on chaos, the ones who win are the ones who stay calm enough to see through it.

    You don’t need more hype. You just need better habits.

    What Is Internet Computer (ICP) Price Today? ICP Technical Analysis (November, 2025)

    0

    Is the sleeping giant finally waking up? Internet Computer (ICP) has just posted a nearly 90% gain in a single week, leaving many investors wondering if this is the start of a major rally or just another flash in the pan. If you’ve been watching this project, you know its journey has been a rollercoaster. Today, we’re diving deep into the data to provide a clear, no-hype Internet Computer (ICP) Technical Analysis for November 2025.

    We’ll break down what’s driving this incredible momentum, explore potential price scenarios for the coming weeks, and look at the risks you need to keep on your radar. Let’s get into it.

    TL;DR: The State of ICP in November 2025

    • Explosive Momentum: ICP is on an absolute tear, up nearly 90% in the last 7 days. Current price is $5.98, showing extreme bullish short-term sentiment.
    • High Volume Confirms Interest: The 24-hour trading volume is over $625 million. This high volume suggests strong conviction behind the recent price surge, not just a low-liquidity pump.
    • Key Level to Watch: The price has likely broken through significant resistance. The key question now is whether it can hold these gains and establish a new support level, likely around the $5.00 mark.
    • Overbought but Strong: While indicators are surely flashing “overbought,” strong trends can remain overbought for extended periods. Profit-taking could cause a pullback, creating the next major test for bulls.

    What is Internet Computer (ICP)? A Quick Refresher

    Before we analyze the charts, let’s quickly recap what ICP is. Developed by the DFINITY Foundation, Internet Computer is a blockchain project aiming to decentralize the traditional internet. Instead of relying on centralized cloud services like Amazon Web Services (AWS) or Google Cloud, developers can build websites, apps, and software directly on the blockchain.

    Its core technology, “Chain Key Cryptography,” allows it to run at web speed and scale its capacity with demand. The goal is ambitious: to create a truly decentralized “World Computer” that is unstoppable and tamperproof. The ICP token is used for network governance, to power computation (acting as “gas”), and to reward network participants.

    Current Market Conditions

    The numbers don’t lie, and right now, they’re screaming bullish. With a current price of $5.98, ICP’s market capitalization stands at a respectable $3.21 billion. However, the most telling metric is the recent price action. A gain of over 15% in the last 24 hours and a staggering 89% in the last week points to a dramatic shift in market sentiment.

    The 24-hour volume of $625 million is also critical. This represents nearly 20% of its entire market cap, a ratio that signals intense interest and high liquidity. This isn’t a quiet move; it’s a loud statement backed by significant capital flow. This kind of volume validates the price increase and suggests that large players are getting involved, either by closing short positions or opening new long ones.

    On-Chain and Narrative Drivers

    While we can’t pinpoint a single catalyst without specific news, a move this sharp is rarely random. Several factors could be fueling this rally. There may be a growing narrative around decentralized computing and AI, an area where ICP’s technology is well-suited. A major dApp launch or a significant increase in on-chain developer activity could be drawing fresh eyes to the ecosystem.

    Another possibility is a classic short squeeze. Given ICP’s volatile history, it has often been a target for short-sellers. A sudden spike in buying pressure can force these traders to buy back their positions to cover their losses, which in turn pushes the price even higher. Whatever the specific cause, it’s clear the market’s perception of ICP is changing rapidly.

    Internet Computer (ICP) Technical Analysis: Key Scenarios

    Let’s get to the core of our Internet Computer (ICP) Technical Analysis. Based on the explosive move to $5.98, here are three potential scenarios for the next few weeks.

    Bullish Scenario: The Momentum Continues

    In this scenario, the buying pressure remains intense. After a brief consolidation, ICP could use the current price level as a launchpad for its next leg up.

    • Rationale: The sheer force of the 89% weekly candle suggests a major trend change. Buyers are in full control. High volume confirms this is a well-supported move.
    • Price Targets: A successful defense of the $5.50-$5.80 zone could propel the price toward the next psychological resistance levels at $7.50 and then potentially $10.00.

    Base Case Scenario: Healthy Consolidation

    The most sustainable outcome after such a parabolic move is a period of consolidation. The price needs to cool off, allow moving averages to catch up, and build a solid foundation of support.

    • Rationale: Markets don’t move in straight lines. Early buyers will take profits, and new buyers will look for a better entry. A pullback and retest of the previous resistance-turned-support is classic, healthy price action.
    • Price Range: Look for ICP to trade sideways or pull back into the $4.80 – $5.20 range. If it can hold this level for several days, it would be a very bullish sign for long-term strength.

    Bearish Scenario: Sharp Rejection

    This rally could be a “bull trap,” a powerful but ultimately unsustainable move designed to lure in retail buyers before a sharp reversal.

    • Rationale: An 89% weekly gain makes the asset extremely overbought. A broader market downturn or a sudden loss of narrative momentum could trigger aggressive profit-taking, leading to a cascade of selling.
    • Price Targets: A failure to hold the $4.80 support level would be the first red flag. This could open the door for a deeper correction back toward the $4.00 or even the $3.50 area, erasing a significant portion of the recent gains.

    A Simple Back-of-the-Envelope Valuation

    Valuing crypto is notoriously difficult, but we can use simple comparisons. With a market cap of $3.2 billion, ICP is firmly in the top 50 cryptocurrencies but still significantly smaller than other major infrastructure players like Avalanche ($13B) or Chainlink ($10B).

    Let’s frame it with an assumption. The cloud computing market is worth trillions. If decentralized infrastructure captures even a tiny fraction of that, say 1%, you’re looking at a tens of billions of dollars market. If you believe ICP can become a dominant player in that niche, its current $3.2 billion valuation could seem modest. For it to reach a market cap comparable to Avalanche today, the ICP token price would need to be around $24, a 4x from its current level. This is purely illustrative, but it helps frame the potential upside if the project delivers on its grand vision.

    Risks and What to Watch

    Before getting carried away, it’s crucial to understand the risks. The biggest immediate risk is a sharp pullback due to the overextended rally. Watch the trading volume closely. If the price starts to fall on high volume, it’s a sign that sellers are taking control.

    Longer-term, ICP faces immense competition not only from other blockchains but also from established Web2 giants like AWS and Google. Adoption is everything. Keep an eye on DFINITY’s developer reports, the number of active dApps being built, and the growth of on-chain transactions. These are the fundamental metrics that will determine its ultimate success.

    Conclusion and Next Steps

    Internet Computer is currently one of the most exciting assets in the market, showing incredible strength and renewed interest. The technical picture is bullish, but the recent rally is overextended, warranting caution.

    For now, the best approach is to watch how the price reacts in the coming days. Does it consolidate healthily above its breakout point, or does it show signs of weakness? The answer will set the stage for ICP’s direction for the remainder of 2025.

    Frequently Asked Questions (FAQ)

    1. Is ICP a good investment right now?
    ICP has shown massive recent gains, indicating strong momentum. However, its price is highly volatile and could experience a significant pullback. Whether it’s a “good” investment depends entirely on your personal risk tolerance and belief in the project’s long-term vision.

    2. What could make the ICP price go up?
    Key drivers for ICP’s price include increased adoption of its network by developers, successful launches of popular dApps, a positive shift in the narrative around decentralized cloud infrastructure, and overall bullish sentiment in the cryptocurrency market.

    3. What is the main risk of investing in ICP?
    The primary risks are intense competition from both centralized tech giants and other Layer 1 blockchains, regulatory uncertainty, and the inherent volatility of the crypto market. The project’s success is not guaranteed and depends on widespread adoption.

    4. Where can I buy Internet Computer (ICP)?
    ICP is a major cryptocurrency and is available on most large, reputable exchanges, including Coinbase, Binance, KuCoin, and Kraken.

    Not financial advice. Do your own research.
    Internet Computer (ICP) Price Prediction: What Will ICP Price Be in 2033?

    0

    Have you ever looked at a crypto chart and felt a sense of whiplash? That’s the story of Internet Computer (ICP) for many. After a spectacular launch and a brutal, prolonged crash, it faded from the headlines. Now, with a staggering 90% gain in a single week, it’s roaring back to life, forcing investors to ask a critical question: Is this a fleeting echo of past hype, or the quiet beginning of one of the greatest comebacks in crypto history? This Internet Computer (ICP) Price Prediction will look a decade ahead to 2033 to explore what might be in store.

    TL;DR: A 10-Year Outlook for ICP

    • Current Momentum: ICP is experiencing a massive short-term surge, with weekly gains nearing 90%. This reflects renewed market interest and a potential narrative shift, but volatility remains high.
    • Core Bet: An investment in ICP is a long-term bet on its “World Computer” vision—the idea of hosting websites, apps, and enterprise systems entirely on a decentralized blockchain network, disrupting traditional cloud services.
    • 2033 Price Scenarios: Our analysis projects a wide range of outcomes. A bear case could see ICP trading between $3 and $10, a base case suggests a range of $50 to $150, while a successful bull case could push the price toward $350 to $700.
    • Key Drivers: Long-term success hinges on developer adoption, real user growth on its dapps, and the success of its chain-fusion integrations with Bitcoin and Ethereum.

    What is Internet Computer (ICP)? A Quick Refresher

    Before we dive into price charts, let’s quickly recap what makes ICP unique. Unlike many blockchains that primarily focus on facilitating financial transactions, the Internet Computer was built with a much grander vision: to decentralize the entire internet stack.

    Think of it this way: Ethereum is great for running the logic of a DeFi protocol, but the front-end website you interact with is likely hosted on a centralized server like Amazon Web Services (AWS). ICP, developed by the DFINITY Foundation, is designed to host everything—the front-end, the back-end logic, and the data—directly on the blockchain in smart contracts called “canisters.” This creates a truly decentralized, unstoppable, and censorship-resistant web.

    Current Market Conditions: Interpreting the Surge

    The numbers right now are telling a powerful story. With a current price of $5.98, ICP has seen explosive growth: over 10% in the last hour, nearly 16% in the last 24 hours, and a phenomenal 89% over the past seven days. This isn’t quiet accumulation; it’s a loud statement.

    The 24-hour trading volume of over $625 million is also very significant relative to its $3.2 billion market cap. A high volume-to-market-cap ratio indicates intense interest and liquidity. This kind of price action often suggests a combination of factors: a shift in market narrative, traders closing out short positions (a short squeeze), and new capital rotating into a project that has been dormant for a long time. While exciting, this level of volatility is a double-edged sword, and investors should be prepared for potential pullbacks.

    On-Chain & Narrative Drivers

    Beyond the price chart, the real story of ICP’s long-term potential is being written in its technology and ecosystem. The primary narrative driving interest is its role as a leader in Decentralized Physical Infrastructure Networks (DePIN) and as a viable alternative to centralized cloud computing.

    While we can’t see all on-chain data in real-time, the metrics to watch are the growth of active canisters (its version of smart contracts), the number of daily active users on its flagship dapps like the social media platform DSCVR or messaging app OpenChat, and the amount of ICP being staked in its governance system, the Network Nervous System (NNS). These are the true indicators of adoption. Furthermore, its direct integration with Bitcoin (enabling ckBTC) and the upcoming Ethereum integration are major catalysts, positioning ICP as a potential computational layer for the entire crypto space.

    Scenarios for 2033: An Internet Computer (ICP) Price Prediction

    Forecasting ten years out is an exercise in strategic thinking, not certainty. Here are three potential scenarios for ICP’s price in 2033, based on different levels of adoption and market conditions.

    Bear Case: The Vision Fails to Launch ($3 – $10)

    In this scenario, ICP struggles to overcome its core challenges. The technology, while powerful, proves too complex for mainstream developer adoption. Competitors, both from other blockchains and from nimble Web2 companies, capture the decentralized cloud market. The project’s tokenomics, which include inflation to reward node providers and stakers, suppress the price as network usage fails to generate enough demand to offset new supply. In this future, ICP remains a niche project with a small, dedicated community, and its price languishes, falling back to or below its current levels.

    Base Case: A Powerful Niche Player ($50 – $150)

    Our base case assumes ICP executes on its roadmap and achieves moderate but meaningful success. It doesn’t replace AWS, but it becomes the go-to platform for specific use cases like decentralized social media, fully on-chain gaming, and specific enterprise applications where censorship resistance is paramount. Its Bitcoin and Ethereum integrations drive consistent utility, making it a crucial piece of Web3 infrastructure. The ecosystem grows steadily, and the rate of “cycles” being burned (the fee mechanism for using the network) begins to balance out token inflation. In this scenario, ICP’s market cap grows in line with the broader crypto market, placing its price firmly in the double or low-triple digits.

    Bull Case: The World Computer is Realized ($350 – $700)

    The bull case is the full realization of DFINITY’s vision. A “killer app” emerges on the Internet Computer, bringing millions of users into its ecosystem. Developers flock to the platform, drawn by its speed, scalability, and ability to build truly decentralized applications. Enterprises begin migrating critical systems to ICP to escape the control of big tech. The DePIN and on-chain AI narratives become massive global trends, with ICP at their core. In this future, network usage is so high that the cycle burn mechanism makes the ICP token consistently deflationary, creating a supply shock. Its market cap would rival that of today’s largest tech and crypto giants, pushing its price into the high hundreds.

    A Simple Valuation Model

    Let’s try a simple back-of-the-envelope calculation to ground these scenarios. This is highly speculative and relies on major assumptions.

    • Assumption 1: The global cloud computing market (TAM) reaches $2.5 trillion by 2033.
    • Assumption 2: ICP’s circulating supply grows to approximately 650 million tokens due to staking rewards.

    Now, let’s apply our scenarios:

    • Base Case: If ICP captures just 2% of the cloud market’s value in its market cap, it would be valued at $50 billion. A $50 billion market cap divided by 650 million tokens gives a price of ~$77 per ICP.
    • Bull Case: If ICP achieves widespread adoption and captures 15% of the cloud market’s value, it would be valued at $375 billion. A $375 billion market cap divided by 650 million tokens gives a price of ~$577 per ICP.

    This simple model shows that if ICP can capture even a small slice of the massive cloud industry, the potential for price appreciation is immense.

    Risks & What to Watch

    The road ahead is not without significant obstacles.

    • Key Risks: The primary risk is developer adoption; if developers don’t build on it, users won’t come. Competition from other L1s and cloud providers is fierce. There are also ongoing debates about the centralization of its governance (the NNS) and node provider network, which could hinder its decentralization narrative.
    • What to Watch: Keep a close eye on the cycle burn rate published on the ICP dashboard—this is the most direct measure of network usage. Track the growth of dapps in the ecosystem and monitor progress on the official DFINITY roadmap, especially the full rollout of the Ethereum integration.

    Conclusion: A High-Risk, High-Reward Bet on the Future of the Internet

    The Internet Computer (ICP) is not a simple project. It is one of the most ambitious and technologically complex endeavors in the crypto industry. The recent price surge has brought it back into the spotlight, but its ten-year future will not be decided by short-term trading. It will be determined by its ability to convince developers and users that a fully decentralized internet is not just a dream, but a necessity.

    For investors, this makes ICP a high-risk, high-reward proposition. The bear case could see your investment dwindle, while the bull case could deliver life-changing returns. The next steps are not to blindly buy into the hype, but to dig deeper. Explore the ecosystem, try out a dapp, and decide for yourself if you believe in the vision of a true World Computer.

    Frequently Asked Questions (FAQ)

    1. Is Internet Computer (ICP) a good investment?
    ICP is a highly speculative, long-term investment. Its potential is enormous, but so are the risks. It is best suited for investors with a high risk tolerance who believe in its mission to decentralize the internet and are prepared for extreme volatility.

    2. Can ICP reach $1000?
    Reaching $1000 per token would require a market capitalization of over $650 billion (assuming a 650M supply), placing it among the most valuable assets in the world. While theoretically possible in a hyper-bullish scenario where it captures a significant share of the cloud computing market, it remains an extremely optimistic and unlikely target.

    3. What is the main difference between ICP and Ethereum?
    The key difference is in their scope. Ethereum is primarily a decentralized computer for running smart contract logic, mainly for finance (DeFi). ICP is designed to be an entire, infinitely scalable web stack, capable of hosting complex websites, social media platforms, and enterprise systems with web speed performance directly on the blockchain.

    4. Is ICP inflationary?
    Yes, new ICP tokens are minted to reward node providers and those who stake their tokens in the NNS governance system. However, the network also has a deflationary mechanism: to power computation, ICP is converted into “cycles,” which are then burned. If network usage becomes high enough, the burn rate could exceed the inflation rate, making ICP a deflationary asset.

    Not financial advice. Do your own research.
    Ethereum (ETH) Price Prediction: What Will ETH Price Be in 2044?

    0

    Ever look at your portfolio and wonder what the world will even look like when you’re ready to retire? It’s a dizzying thought. We’re not just picking assets; we’re betting on a vision of the future. For many of us, Ethereum is a massive part of that bet. This isn’t just about a one-year or five-year hold. We’re talking about a generational shift. So let’s cut through the short-term noise and ask the big question: what could be a realistic Ethereum (ETH) Price Prediction for two decades from now, in 2044?

    Before we dive deep, remember that forecasting 20 years into the future is an exercise in strategic thinking, not a crystal ball reading. The technology landscape can and will change dramatically. This analysis is for educational purposes and is not a recommendation to buy or sell any asset.

    TL;DR: Ethereum in 2044

    • Current State: The market is currently in a sharp downturn. ETH is down over 18% in the last week and 28% in the last month, signaling significant short-term bearish pressure and investor fear.
    • Long-Term Drivers: Ethereum’s future value depends on its success as the “world computer.” Key factors include the scaling of Layer 2 solutions, the tokenization of real-world assets (RWAs), and its deflationary “ultrasound money” tokenomics.
    • Base Case Prediction for 2044: Our base case scenario places ETH in the $75,000 to $125,000 range. This assumes Ethereum becomes a foundational layer of the global financial system, similar to how TCP/IP is for the internet today.
    • Wide Range of Outcomes: The potential is huge, but so are the risks. A bearish scenario could see ETH struggling to overcome competition and regulatory hurdles, landing in the $15,000 to $30,000 range. A highly bullish outcome, where Ethereum becomes the trust layer for the entire internet, could push prices to $250,000 or more.

    What Is Ethereum, Again?

    Let’s quickly reset. Bitcoin is digital gold—a simple, secure store of value. Ethereum is different. It’s a decentralized global computer. Anyone can build and run applications (dApps) on it for things like finance (DeFi), gaming, social media, and digital identity.

    The fuel for this computer is ETH. You need it to pay transaction fees (known as “gas”) to use the network. Since its major upgrade, “The Merge,” Ethereum has operated on a Proof-of-Stake system. This means it’s more energy-efficient, and holders can “stake” their ETH to help secure the network and earn a yield, much like a dividend or interest payment. This shift also made ETH a potentially deflationary asset, as more ETH can be “burned” (removed from circulation) through transaction fees than is created through staking rewards.

    Current Market Conditions: A Sea of Red

    Let’s not sugarcoat it. The current market is rough. With ETH sitting at $3,278.08, the recent price action tells a clear story of a market under stress.

    A 24-hour loss of 5.75% and a 7-day drop of over 18% is significant. When you zoom out to the 30-day view, a 28.15% decline points to a sustained sell-off. This isn’t just a minor blip; it’s a major correction. The high 24-hour volume of over $68 billion during a period of negative price action suggests that many traders are capitulating, or selling their positions to cut losses. This kind of volatility is often driven by macroeconomic fears, deleveraging in the derivatives market, or a simple “risk-off” sentiment across all asset classes. For the long-term investor, these are the moments that test conviction.

    On-Chain and Narrative Drivers for the Long Haul

    While today’s price is important, the 20-year outlook for our Ethereum (ETH) Price Prediction depends entirely on bigger-picture narratives and fundamental network growth.

    The most powerful long-term driver is the concept of Ethereum as a global settlement layer. The future of finance might not run on Ethereum, but it could settle to Ethereum. Layer 2 scaling solutions like Arbitrum, Optimism, and zkSync are crucial here. They act like express lanes, processing thousands of transactions cheaply and quickly while bundling them up to settle on the ultra-secure Ethereum mainnet. If these L2s succeed in onboarding billions of users, the demand for Ethereum’s blockspace (and therefore ETH) will be immense.

    Another massive narrative is the tokenization of Real-World Assets (RWAs). Imagine stocks, bonds, real estate titles, and carbon credits all issued and traded as tokens on Ethereum. This could bring trillions of dollars of value on-chain, all of which would require ETH for gas and security. This transforms ETH from a speculative digital asset into the base collateral for the world’s traditional financial assets.

    Ethereum (ETH) Price Prediction: Scenarios for 2044

    Projecting two decades out requires a blend of technical modeling and narrative-based reasoning. We’ll use a logarithmic growth curve model, which respects the economic law of diminishing returns; as an asset’s market cap grows, the percentage gains naturally slow down.

    The Bear Case: A Niche Asset ($15,000 – $30,000)

    In this scenario, Ethereum fails to solve its core challenges. Layer 2s prove too fragmented, a competitor blockchain (or several) siphons away developers and users, or regulators impose crippling restrictions. Ethereum doesn’t die; it simply becomes a niche network for a handful of high-value financial applications. It survives as a settlement layer for DeFi purists but fails to capture the imagination of the mainstream. Its growth flattens considerably, and its price appreciation is driven more by inflation than by network adoption.

    The Base Case: The Internet’s Value Layer ($75,000 – $125,000)

    This is our most probable long-term outlook. In this future, Ethereum has cemented its position as the undisputed leader of smart contract platforms. Layer 2s have successfully scaled the network to handle global demand, and RWA tokenization is a multi-trillion dollar industry built on top of Ethereum. ETH is seen by institutions as a “productive commodity,” a digital bond that also serves as the fuel for a new financial system. Its deflationary tokenomics are in full effect, with network demand consistently outstripping new issuance, creating a supply shock that drives the price upward in a steady, mature fashion along its logarithmic growth channel.

    The Bull Case: The World Computer ($250,000+)

    In the most optimistic scenario, Ethereum achieves its grandest vision. It becomes the base trust and settlement layer for much of the digital world. It’s not just for finance but also for digital identity (decentralized IDs), social media, supply chains, and secure data. In this world, Ethereum’s market cap doesn’t just rival gold; it rivals the value of entire global industries. It becomes so deeply integrated into the world’s economic and digital fabric that its value is almost incalculable by today’s standards. This outcome depends on near-perfect execution, favorable global regulation, and continued innovation that outpaces all competitors.

    A Simple Valuation on the Back of an Envelope

    Let’s ground these numbers. How can we justify a price like $90,000?

    1. Pick a Target Market Cap: Gold’s market cap is currently around $15 trillion. It’s a non-sovereign, “hard” store of value. ETH is a productive store of value—you can use it and earn yield from it. Let’s assume that by 2044, the global economy has grown, and a mature Ethereum network has achieved a market cap of $10 trillion. This is conservative compared to the size of global equity or debt markets.
    2. Estimate ETH Supply: Right now, there are about 120 million ETH. Because of its burn mechanism, this number is expected to decrease over time if network usage is high. Let’s conservatively estimate the supply in 2044 is around 110 million ETH.
    3. Do the Math: Price = Market Cap / Supply.
      $10,000,000,000,000 / 110,000,000 ETH = $90,909 per ETH.

    This simple model shows that a price in our base case range is entirely plausible, assuming Ethereum captures a value comparable to just a fraction of the global financial system.

    Risks and What to Watch

    The path to 2044 will not be a straight line up. Here are the primary risks:

    • Technological Risk: A critical bug in Ethereum’s code or one of its core dApps could be catastrophic for trust.
    • Competition: A new Layer 1 blockchain could emerge with superior technology that makes Ethereum obsolete. While Ethereum has a massive head start, nothing is guaranteed.
    • Regulatory Risk: Governments could crack down on decentralized finance or staking, stifling innovation and adoption.
    • Centralization Risk: The rise of large staking pools like Lido presents a risk. If a few entities control a majority of the staked ETH, it undermines the network’s core value proposition of decentralization.

    Conclusion: A Bet on the Future of the Internet

    Investing in Ethereum today is not a bet on next week’s price. It’s a bet that the internet will evolve to have a native, trusted, and open value layer—and that Ethereum will be that layer. The current market downturn is a stark reminder of the volatility inherent in this space. But for those with a decades-long time horizon, it’s the fundamental drivers—developer activity, user adoption, and powerful narratives like RWA tokenization—that truly matter.

    Your next step isn’t to blindly buy based on a price prediction. It’s to deepen your understanding. Read about Layer 2 solutions. Learn how staking and the ETH burn work. Form your own conviction about the future we’re building. The journey to 2044 will be a wild one, and being prepared is your greatest asset.

    Frequently Asked Questions (FAQ)

    1. Will Ethereum ever “flip” Bitcoin’s market cap?
    It’s possible. They serve different purposes. If the world decides that a programmable, yield-bearing asset that fuels a new financial system is more valuable than a pure digital store of value, then a “flippening” could occur.

    2. How does Ethereum’s deflationary supply affect its price?
    Post-Merge, a portion of every transaction fee is “burned” or permanently removed from circulation. If this burn rate is higher than the rate of new ETH being issued to stakers, the total supply of ETH decreases. Basic economics suggests that if supply falls while demand stays constant or increases, the price should rise. This is the “ultrasound money” thesis.

    3. What is the biggest threat to Ethereum’s future?
    Beyond direct competition and regulation, the biggest threat is a failure to scale effectively. If using Ethereum remains too expensive or complex for the average person, its growth will stall, and it will be relegated to a niche technology for the wealthy. The success of Layer 2s is absolutely critical to mitigating this threat.

    4. Is it too late to invest in Ethereum?
    From a 2044 perspective, absolutely not. While the days of 10,000x returns are likely over, if Ethereum achieves even our base case scenario, the potential for significant appreciation from today’s price of around $3,300 is substantial. However, the risks remain high, and the journey will be volatile.

    Not financial advice. Do your own research.
    What Is Ethereum (ETH) Price Today? ETH Technical Analysis (November, 2025)

    0

    That sharp drop in Ethereum’s price probably has your attention. Seeing a double-digit loss in a single day can be unsettling, whether you’re a seasoned trader or just getting started. It’s in these volatile moments, however, that clear-headed analysis becomes most valuable. Panic selling is easy, but understanding the context behind the numbers is what can help you navigate the storm. Let’s cut through the noise and perform a straightforward Ethereum (ETH) Technical Analysis to understand what just happened and what might be on the horizon.

    TL;DR: The Current State of Ethereum

    • Significant Correction: Ethereum is in a sharp downtrend, currently trading at $3,233.05 after falling nearly 10% in the last 24 hours and over 28% in the past month.
    • High Selling Volume: The 24-hour trading volume is extremely high at over $68 billion, suggesting the recent price drop was driven by significant selling pressure and potential liquidations.
    • Critical Support Zone: ETH is testing a key technical and psychological support area. The market’s reaction here over the next few days could set the tone for the coming weeks.
    • Short-Term Bounce: A small 2.2% bounce in the last hour offers a moment of relief, but it’s too early to confirm if this is a reversal or a temporary pause in the downtrend.

    What is Ethereum (ETH)? A Quick Refresher

    Before diving into the charts, let’s quickly recap what we’re looking at. Ethereum is a decentralized, open-source blockchain with smart contract functionality. Think of it as a global computer that anyone can build applications on, from financial tools (DeFi) to digital art (NFTs) and more.

    The cryptocurrency, Ether (ETH), is the lifeblood of this network. It’s used to pay for transaction fees (known as “gas”), serves as collateral in the crypto economy, and is the base money of the entire Ethereum ecosystem. Its value is tied not just to speculation but to the actual utility and demand for the network itself.

    Current Market Conditions: Reading the Data

    The numbers tell a dramatic story. With a current price of $3,233.05, Ethereum’s market capitalization stands at a hefty $390 billion, cementing its position as the second-largest crypto asset. However, the price action paints a bearish picture. A drop of nearly 10% in a day, 19% in a week, and 28% in a month signals a clear and powerful downtrend.

    What’s particularly noteworthy is the $68 billion in 24-hour trading volume. High volume on a downward move is a sign of conviction from sellers. It suggests that this isn’t a slow drift lower; it’s an aggressive move fueled by either widespread panic selling, forced liquidations of leveraged positions, or large holders deciding to take profits or de-risk. The small 1-hour bounce is common after such a steep fall as short-term traders try to “buy the dip,” but the broader trend remains firmly negative for now.

    On-Chain & Narrative Drivers

    While we don’t have a direct view into specific on-chain metrics here, we can infer some possibilities based on the market action. A sharp drop on high volume often corresponds with a spike in ETH flowing onto exchanges, as holders move their assets to sell. It also very likely triggered a cascade of liquidations in the derivatives markets, where over-leveraged long positions were automatically closed, adding to the selling pressure.

    The market narrative appears to have shifted from optimism to caution. This kind of price action is rarely caused by a single factor. It’s more likely a combination of broader macroeconomic concerns, profit-taking after a previous run-up, and a general “risk-off” sentiment spreading across financial markets. Without a strong positive catalyst, sellers have taken control of the market’s direction.

    Ethereum (ETH) Technical Analysis: Three Scenarios for the Coming Weeks

    Based on the current price action, let’s explore three potential scenarios for Ethereum. The price is currently hovering above a critical support level, making this a pivotal moment.

    H3: The Bearish Scenario (Breakdown)

    If the selling pressure continues, the most immediate support level to watch is the psychological $3,000 mark. A firm break and close below this level on the daily chart would be a significant bearish signal. This could open the door for a further decline toward the $2,700 – $2,800 range, an area that has previously served as both support and resistance. This scenario would be likely if negative macroeconomic news persists or if the market fails to find enough buyers to absorb the selling.

    • Price Range: $2,700 – $3,000

    H3: The Base Scenario (Consolidation)

    In this scenario, buyers step in to defend the $3,000 – $3,200 zone. The intense selling volume subsides, and the price begins to move sideways, building a new base. We would see choppy price action for several weeks as the market digests the recent move. This “wait and see” approach would signal that the panic has subsided, but bulls don’t yet have the conviction to push prices significantly higher. The market would be looking for its next major catalyst.

    • Price Range: $3,100 – $3,500

    H3: The Bullish Scenario (Reversal)

    The bullish case hinges on the idea that this sharp drop was a final “shakeout” to liquidate leveraged traders. In this scenario, the current price level holds firmly. We would need to see the price decisively reclaim the $3,500 level with strong buying volume. A successful move above this point would trap short sellers and could trigger a quick rally back towards the $3,800 resistance area. This would require a significant shift in market sentiment, perhaps driven by an unexpected positive news event.

    • Price Range: $3,800+

    A Simple Valuation Back-of-the-Envelope

    Valuing a crypto asset is notoriously difficult, but we can use a simple framework. One common method is to treat the network like a business and apply a Price-to-Sales (P/S) ratio, where “sales” are the total fees paid to use the network.

    Let’s make some simple assumptions for this exercise. Assume Ethereum generates about $15 billion in annualized fee revenue during a period of healthy activity. A high-growth, market-leading software company might trade at a P/S multiple of 20x to 30x. Applying this to Ethereum:

    • Low-End Valuation: $15 Billion (Revenue) x 20 (Multiple) = $300 Billion Market Cap
    • High-End Valuation: $15 Billion (Revenue) x 30 (Multiple) = $450 Billion Market Cap

    With its current market cap of around $390 billion, this rough calculation suggests Ethereum is valued within a reasonable range based on its network utility, though not necessarily cheap. This model is highly simplified and depends entirely on our assumptions for revenue and the appropriate multiple.

    Risks & What to Watch

    Moving forward, keep a close eye on these key factors:

    • The $3,000 Level: This is the most important short-term level to watch. A breakdown below it would be very bearish.
    • Macroeconomic Data: Pay attention to inflation reports and central bank interest rate decisions. A hawkish stance can be a major headwind for risk assets like crypto.
    • Trading Volume: Watch to see if volume picks up on upward moves (a bullish sign) or continues to be high on down days (a bearish sign).
    • Regulatory News: Any major regulatory announcements from key governments can introduce sudden and extreme volatility.

    Conclusion: A Market at a Crossroads

    Ethereum is currently in the grip of a fierce correction, with sellers firmly in control. The recent price drop, backed by massive volume, has brought ETH to a critical decision point around the $3,200 level. The next few weeks will be crucial in determining whether this is a dip before the next leg up or the start of a more prolonged downturn.

    For long-term investors, periods of high fear can present opportunities. For short-term traders, the heightened volatility demands careful risk management. The best next step is to evaluate your own strategy, set your price alerts, and avoid making emotional decisions based on a single day’s price action.

    Frequently Asked Questions (FAQ)

    Is now a good time to buy Ethereum?
    That depends entirely on your investment timeline and risk tolerance. The price is significantly lower than it was a month ago, which some view as a discount. However, the short-term trend is clearly down, which carries a high risk of further price declines.

    What is a “dead cat bounce”?
    A “dead cat bounce” is a slang term for a temporary, small recovery in the price of an asset that is in a steep decline. It’s called this because even a dead cat will bounce if it falls from a great height. It’s important to distinguish these brief rallies from a true trend reversal.

    What does high trading volume on a price drop mean?
    High volume during a price drop indicates a strong consensus and conviction among sellers. It means a large amount of the asset was sold at declining prices, which is generally a bearish signal that suggests the downtrend could continue.

    Where can I find reliable on-chain data for Ethereum?
    Several platforms provide in-depth on-chain analytics for Ethereum. Some of the most well-known include Glassnode, Dune Analytics, and Nansen. These tools can help you track metrics like exchange flows, active addresses, and transaction fees.

    Not financial advice. Do your own research.
    Solana (SOL) Price Prediction: What Will SOL Price Be in 2039?

    0

    Ever looked at your portfolio and wondered what holding a top crypto asset for 15 years could really look like? It’s easy to get lost in the daily price charts, but the real wealth-building stories often unfold over decades, not days. This deep dive is for those with a long-term vision, exploring a potential future for a blockchain that has captured the market’s attention with its incredible speed. We’re here to break down a long-term Solana (SOL) Price Prediction, looking all the way out to 2039.

    This analysis combines current market data with forward-looking scenarios to give you a framework for thinking about SOL’s potential. Remember, this is a speculative exploration into the distant future of a volatile asset class, not a crystal ball.

    TL;DR: Solana in 2039

    • Current Situation: Solana is facing a significant short-term correction, with prices down nearly 20% over the last week and 32% over the last month, despite a small hourly bounce.
    • Key Drivers: Solana’s future hinges on its ability to maintain network stability, grow its developer and user base, and lead in high-growth sectors like DePIN, decentralized finance (DeFi), and consumer-facing applications.
    • Bear Case (2039): In a future where Solana fails to overcome technical hurdles or loses ground to competitors, the SOL price could stagnate or decline, potentially landing in the $100 to $300 range.
    • Base Case (2039): If Solana solidifies its position as a top-three smart contract platform, capturing a significant share of a growing crypto market, a price point between $1,500 and $2,500 is plausible.
    • Bull Case (2039): Should Solana become the dominant layer-1 for consumer apps and high-frequency transactions, achieving a multi-trillion dollar market cap, its price could soar to $8,000 or higher.

    What is Solana (SOL)?

    Let’s do a quick refresher. Solana is a high-performance blockchain designed for speed and scalability. Think of it as the super-fast highway of the crypto world. While other chains like Ethereum can get congested, leading to slow and expensive transactions, Solana aims to process tens of thousands of transactions per second for a fraction of a penny.

    This efficiency makes it an attractive platform for developers building everything from decentralized trading exchanges and NFT marketplaces to on-chain games and social media apps. SOL is the native token of the network. It’s used to pay for transaction fees (gas), secure the network through staking, and grant holders the right to vote on future upgrades. Its core value proposition is simple: to provide the infrastructure for a decentralized future that is fast, cheap, and scalable for billions of users.

    Interpreting the Current Market Conditions

    As of today, the market is sending some very mixed signals. Solana’s current price is $154.74, with a hefty market capitalization of over $85 billion. This firmly places it among the crypto elite. However, the short-term price action tells a story of turbulence.

    With the price down 6.6% in the last 24 hours and nearly 20% over the past week, it’s clear that sellers are in control. This downtrend extends over the 30-day period, where SOL has lost over 32% of its value. This kind of volatility often follows periods of major market runs and can be driven by profit-taking, shifting macroeconomic sentiment, or liquidations in the derivatives market. The massive 24-hour trading volume of over $11 billion confirms that there is a battle raging between buyers and sellers. The small 2.8% bounce in the last hour shows that buyers are stepping in at these lower levels, but whether it’s the start of a reversal or just a temporary relief rally remains to be seen.

    On-Chain & Narrative Drivers for Long-Term Growth

    Looking past the daily noise, several fundamental factors will drive Solana’s value over the next 15 years. The first is user and developer adoption. Solana has fostered a vibrant ecosystem, particularly attracting projects that require high throughput, like memecoins and DePIN (Decentralized Physical Infrastructure Networks). The “Solana Saga” phone, for instance, was a bold experiment in integrating crypto into our daily mobile experience.

    Narratives are incredibly powerful in crypto. Solana’s narrative is one of a “monolithic” blockchain, meaning it does everything on one super-fast layer without needing complex scaling solutions. This simplicity is appealing. If Solana can continue to attract top-tier developers and become the go-to chain for consumer applications—the decentralized versions of Uber, X, or Instagram—its network value could grow exponentially. The key will be proving its network stability, an issue that has challenged the project in the past.

    A 15-Year Solana (SOL) Price Prediction

    Forecasting anything 15 years out is an exercise in structured speculation. Here, we outline three potential scenarios for 2039. This is not a technical analysis of charts, which is useless over such a long timeframe. Instead, it’s a quantitative projection based on potential market cap growth and estimated token supply.

    Bear Case: The L1 Wars Have a Casualty

    In this scenario, Solana’s journey is hampered by persistent challenges. Competitors, perhaps new layer-1s or scaled Ethereum layer-2s, could offer superior technology or security, siphoning away developers and users. Recurring network outages could permanently damage its reputation for reliability, or a major security exploit could shatter user trust.

    • Rationale: In this world, the broader crypto market might only grow modestly, and Solana’s market share could shrink.
    • Projected Price Range (2039): $100 – $300

    Base Case: A Key Pillar of the Decentralized Internet

    The most likely path forward involves Solana coexisting as one of the few dominant smart contract platforms, alongside Ethereum and others. It successfully carves out a niche as the premier chain for high-frequency finance, gaming, and consumer apps, while its technical issues become a thing of the past.

    • Rationale: The crypto market grows significantly, and Solana maintains or slightly grows its share, becoming a blue-chip asset in the new digital economy. Its speed and low cost make it indispensable for certain use cases.
    • Projected Price Range (2039): $1,500 – $2,500

    Bull Case: The Consumer Chain King

    In the most optimistic scenario, Solana’s architectural bets pay off spectacularly. It becomes the foundational layer for a new generation of decentralized applications used by billions of people. Its performance scales to meet global demand, effectively becoming the “Visa of crypto” for everyday transactions and the base layer for the decentralized social graph.

    • Rationale: Solana achieves a market capitalization comparable to today’s largest technology companies like Apple or Microsoft by becoming an essential piece of global financial and digital infrastructure.
    • Projected Price Range (2039): $8,000+

    A Simple Valuation Model (Back-of-the-Envelope)

    How do we get to those numbers? Let’s use a simple model based on three huge assumptions.

    1. Future Total Crypto Market Cap: We’ll assume the entire crypto market grows from ~$2.5 trillion today to $20 trillion by 2039 in our base case.
    2. Solana’s Future Market Share: We’ll assume Solana captures 8% of that total market in our base case. This would give it a future market cap of $1.6 trillion.
    3. Future SOL Circulating Supply: The current supply is about 550 million. With a decaying inflation schedule that settles at 1.5% annually, a reasonable estimate for the supply in 15 years is around 860 million SOL.

    Calculation:

    • Projected Price = Projected Market Cap / Projected Circulating Supply
    • Base Case Price = $1,600,000,000,000 / 860,000,000 = ~$1,860

    You can adjust the market share and total market cap assumptions to model the bear and bull cases. For example, a bull case with a $7.5 trillion market cap for Solana ($50T total market * 15% share) would yield a price of ~$8,720.

    Risks & What to Watch

    Investing in Solana for the long haul isn’t without risks. Here’s what to keep an eye on:

    • Competition: The layer-1 and layer-2 space is fiercely competitive. Watch for challengers in both performance and developer mindshare.
    • Network Stability: Solana’s biggest weakness has been its history of network outages. Future stability is non-negotiable for long-term success.
    • Regulation: Global regulatory frameworks for crypto are still being written. Unfavorable laws could stifle innovation and adoption.
    • Centralization: Critics point to Solana’s validator requirements as a potential centralization vector. Monitoring the network’s decentralization will be crucial.

    Conclusion: A High-Risk, High-Reward Future

    Solana stands at a crossroads. The current market downturn is a stress test, but the long-term thesis remains intact for believers. Its potential to become a core part of the internet’s future infrastructure is immense, but so are the challenges it must overcome.

    For the long-term investor, the question isn’t about today’s price, but about whether you believe in the team, the technology, and the ecosystem’s ability to execute over the next 15 years. The journey to 2039 will be anything but a straight line. If you’re considering an investment, start with a small position, and be prepared for extreme volatility along the way.

    FAQ on the Future of Solana

    1. Can Solana (SOL) realistically reach $5,000?
    Yes, it’s possible within a bullish long-term scenario. It would require Solana to capture a multi-trillion-dollar market cap, which depends on mass adoption of its ecosystem and significant growth in the overall crypto market.

    2. Will Solana ever flip Ethereum?
    “Flipping” can mean many things (market cap, users, transaction volume). Solana already processes more transactions than Ethereum. Flipping Ethereum’s market cap is a much taller order, but not impossible in a future where Solana becomes the preferred platform for high-growth consumer sectors.

    3. What is the biggest risk to this Solana (SOL) price prediction?
    The single biggest risk is technological failure or obsolescence. If Solana cannot maintain perfect network uptime or if a competitor emerges with a fundamentally better and more secure solution, all price predictions become irrelevant.

    4. How does SOL’s inflation affect its price?
    Solana has an inflation schedule that adds new tokens to the supply. While this can put downward pressure on the price, it’s designed to decrease over time. For the price to rise, demand growth from new users and applications must outpace the rate of new supply creation.

    Not financial advice. Do your own research.
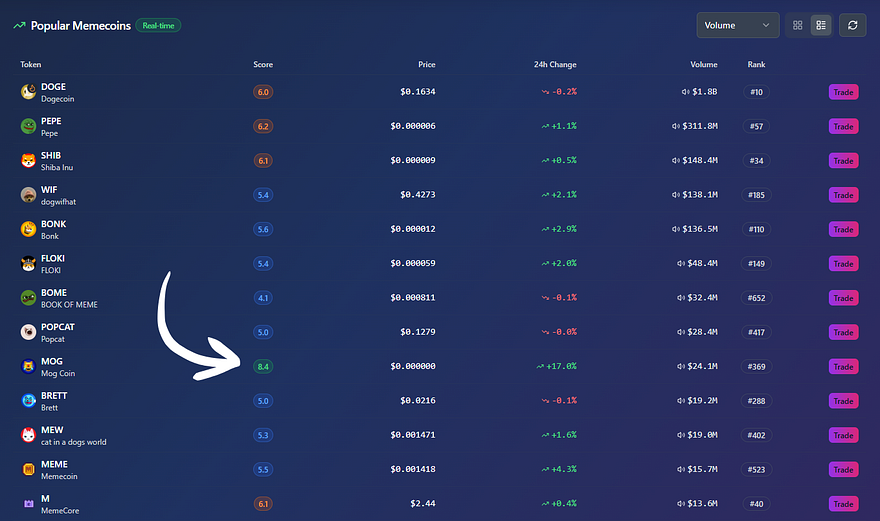
    Predictions (PRDT) Price Prediction: What Will PRDT Price Be in 2041?

    0

    Ever wonder what your crypto portfolio could look like in nearly two decades? It’s a question that blends wild ambition with a healthy dose of reality. Forecasting anything that far out, especially in a market as fast-moving as crypto, is a monumental task. Yet, by looking at fundamentals, potential market growth, and core narratives, we can build a framework for a long-term Predictions (PRDT) Price Prediction and explore what might be possible for this intriguing project.

    This analysis dives deep into the potential future of Predictions (PRDT), aiming to provide a grounded, insightful perspective. We’ll explore various scenarios for its price in 2041, based on its current standing and the trajectory of the crypto space as a whole.

    TL;DR: Predictions (PRDT) Price in 2041

    • Current State: PRDT shows signs of stability with a price of $1.035 and a market cap of over $62 million. However, its low trading volume suggests it’s currently flying under the radar of most traders.
    • Base Case Prediction for 2041: $8 – $15. This scenario assumes PRDT grows steadily along with the broader crypto market, capturing a niche but respectable share of the prediction market sector.
    • Bullish Case Prediction for 2041: $250 – $500. For this to happen, PRDT would need to become the dominant, go-to platform for decentralized prediction markets, a sector that would itself have to see explosive, mainstream adoption.
    • Bearish Case Prediction for 2041: $0.05 – $0.50. The project could fail to gain traction, face regulatory hurdles, or be outcompeted, causing its value to diminish significantly over time.

    What is Predictions (PRDT)?

    Before we look forward, let’s have a quick refresher. Predictions (PRDT) is a decentralized platform built to host prediction markets. Think of it as a global, open-access information market where users can bet on the outcome of future events. This can range from election results and sporting events to economic indicators and even crypto price movements.

    The native token, PRDT, is central to the ecosystem. It’s typically used for participating in markets, creating new prediction pools, and governing the protocol’s future development. The success of the PRDT token is therefore directly tied to the adoption and utility of the platform itself. The more people use the platform, the more demand there should be for the token.

    Current Market Conditions: A Quiet Giant?

    Let’s break down the live metrics to understand where PRDT stands today. With a price of $1.035 and a market cap of $62.39 million, PRDT is firmly in the small-cap category. Assets in this range are often characterized by high growth potential but also carry significant risk. The small price changes over the last hour (0.047%) and 24 hours (0.544%) suggest the token is in a period of consolidation, with neither buyers nor sellers in firm control.

    The most telling metric here is the 24-hour volume, sitting at just under $600,000. The ratio of trading volume to market cap is less than 1%, which is quite low. This indicates that PRDT is not currently a focus for short-term traders. This can be interpreted in two ways: it could be a sign of low interest, or it could be an accumulation phase where long-term believers are quietly building positions without causing major price spikes.

    On-Chain and Narrative Drivers

    Since we don’t have access to a live feed of on-chain data, we must reason cautiously about the fundamental drivers. The core narrative for PRDT revolves around the “wisdom of the crowd” and the power of decentralized information. If prediction markets gain mainstream traction as a tool for forecasting and hedging, platforms like PRDT could be at the forefront of that movement.

    To gauge its long-term health, you should watch for key on-chain trends. An increase in daily active addresses interacting with the platform’s smart contracts would be a primary sign of user growth. Another critical metric would be the Total Value Locked (TVL) in active prediction markets. A rising TVL indicates that more capital is being deployed on the platform, signaling user trust and engagement. The narrative will be driven by real-world events and the platform’s ability to host relevant, high-liquidity markets.

    A Cautious Predictions (PRDT) Price Prediction for 2041

    Forecasting a price 17 years into the future is highly speculative. Traditional technical analysis, which uses chart patterns to predict future movements, is not applicable over such long timeframes. Instead, we will use a model based on fundamental growth, market adoption, and potential market capitalization. Here are three possible scenarios for 2041.

    Bear Scenario: Fading into Obscurity ($0.05 – $0.50)

    In a bearish scenario, the prediction market narrative fails to capture mainstream interest. PRDT might struggle with intense competition, face insurmountable regulatory challenges (as some authorities may view it as gambling), or fail to innovate its technology. In this case, user activity would dwindle, liquidity would dry up, and the token would lose its utility. The project would likely survive but as a “ghost chain” with minimal activity, causing the price to fall over 90% from its current levels.

    Base Scenario: Niche Player in a Growing Market ($8 – $15)

    Our base scenario assumes that the cryptocurrency market as a whole continues to mature and grow, and PRDT evolves with it. It doesn’t become the “Amazon of prediction markets,” but it carves out a sustainable niche. It’s used by crypto-native communities, researchers, and some financial institutions for specialized forecasting.

    Assuming the total crypto market cap grows by 20x by 2041 and PRDT maintains its relative position, its market cap could reach around $1.25 billion. Factoring in token inflation that could double or triple the circulating supply over nearly two decades, this would place the PRDT price in the $8 to $15 range. This represents solid but not spectacular growth.

    Bull Scenario: Market Leader in a Mainstream Sector ($250 – $500)

    The bullish case is where things get exciting. In this future, decentralized prediction markets are a core part of the global financial and information landscape. Corporations use them for supply chain forecasting, media outlets use them to gauge public opinion, and individuals use them to hedge against real-world risks.

    If PRDT becomes the dominant platform, like Google for search, its market cap could rival that of major tech companies today. A market cap of $75 billion is conceivable in such a scenario. Even with a significantly larger token supply, this would translate to a price per PRDT in the $250 to $500 range. This outcome depends on near-flawless execution, widespread adoption, and a favorable regulatory environment.

    Simple Valuation Back-of-the-Envelope

    How do we get these numbers? It’s about working backward from a potential future market cap.

    Let’s use the Base Scenario as our example:

    1. Current Market Cap: ~$62.4 million.
    2. Assumption 1: Future Market Cap. We project that PRDT, as a niche player, could grow its market cap by about 20x over 17 years, tracking the overall crypto market’s maturation. This gives us a future market cap of $62.4M * 20 = ~$1.25 Billion.
    3. Assumption 2: Future Circulating Supply. The current supply is roughly 60 million tokens ($62.4M / $1.035). It’s reasonable to assume the supply will increase due to token emissions for network security or incentives. Let’s conservatively estimate the supply triples to 180 million by 2041.
    4. Calculation: Future Price = Future Market Cap / Future Circulating Supply.
      • $1,250,000,000 / 180,000,000 tokens = $6.94 per PRDT.
      • Our range of $8-$15 allows for slightly better-than-average growth or lower-than-expected inflation.

    This simple model helps ground our predictions in plausible market dynamics rather than pure speculation.

    Risks and What to Watch

    Investing in a small-cap project over such a long horizon is inherently risky. Here’s what to keep an eye on:

    • Regulation: This is the biggest external threat. A global crackdown on platforms that could be construed as unregistered gambling or derivatives markets could stifle growth.
    • Competition: PRDT is not alone. Other prediction market platforms are competing for the same user base. Watch how PRDT’s technology and market share stack up over time.
    • Technology Risk: A critical bug or smart contract exploit could be catastrophic for user funds and the project’s reputation.
    • Adoption Metrics: Pay close attention to the platform’s actual usage. Are people creating markets? Is there significant volume? Utility is the ultimate long-term value driver.

    Conclusion: A Long and Uncertain Road

    The Predictions (PRDT) Price Prediction for 2041 paints a picture of massive potential tempered by significant risk. Its future price could range from near-zero to hundreds of dollars, depending entirely on its ability to execute its vision and the maturation of the prediction market sector.

    The current metrics show a project in a quiet state of consolidation. For long-term investors, the journey from its current $62 million market cap to the multi-billion-dollar valuations in our base or bull scenarios would be a long and volatile one. Your next step should be to move beyond price prediction and dig into the project’s documentation, community, and development team to determine if you believe in its fundamental, long-term vision.

    Frequently Asked Questions (FAQ)

    1. Is Predictions (PRDT) a good investment today?
    That depends on your risk tolerance and investment horizon. As a small-cap asset, it carries high risk but also offers high potential returns. Its current low volume suggests it’s a long-term play rather than a short-term trade.

    2. How could PRDT reach a price of $100?
    For PRDT to hit $100, its market cap would need to reach approximately $18 billion, assuming a future circulating supply of 180 million tokens. This would require the platform to become a significant player in a well-established decentralized prediction market industry.

    3. What is the biggest risk for Predictions (PRDT)?
    Regulatory uncertainty is arguably the single biggest risk. If governments in major economies classify decentralized prediction markets as illegal gambling or financial derivatives, it could severely limit the platform’s addressable market and cripple its growth prospects.

    4. Could the price of PRDT go to zero?
    Yes. Like any early-stage technology or startup, there is a real possibility of failure. If the project fails to attract users, is hit by a catastrophic exploit, or is outcompeted, its token could lose all of its value.

    Not financial advice. Do your own research.
    What Is Ethereum (ETH) Price Today? ETH Technical Analysis (November, 2025)

    0

    Watching your portfolio turn red is never fun, especially when a market leader like Ethereum takes a sharp dive. After weeks of choppy price action, seeing double-digit losses on the monthly chart can make even the most seasoned investor’s stomach drop. Is this the beginning of a deeper correction, or is it the exact moment of opportunity that long-term believers have been waiting for? Let’s cut through the noise, look at the data, and break down what’s really happening with Ethereum.

    This deep dive is for educational purposes. Let’s explore the charts, fundamentals, and potential scenarios together to help you form your own informed opinion.

    TL;DR: Ethereum’s November Outlook

    • Current Price Action: Ethereum is trading at approximately $3,590, experiencing significant bearish pressure with a nearly 20% drop over the last 30 days.
    • Key Technical Level: The price is hovering just above a critical support zone around $3,400. A break below this level could trigger further downside.
    • Market Sentiment: Fear is palpable. The high 24-hour trading volume of over $48 billion on a down day suggests panic selling and forced liquidations of leveraged positions.
    • Long-Term Fundamentals: Despite the price drop, Ethereum’s core value proposition—its role as the leading smart contract platform, the growth of Layer 2s, and its deflationary “ultrasound money” tokenomics—remains intact.
    • Core Scenarios: We could see a breakdown towards $3,000 (Bear Case), a period of consolidation between $3,400 and $3,800 (Base Case), or a powerful reclaim of $3,800 to signal a reversal (Bull Case).

    What is Ethereum (ETH)? A Quick Refresher

    Before we dive into the charts, let’s quickly recap what makes Ethereum so important. Unlike Bitcoin, which is primarily a store of value, Ethereum is a global, decentralized computing platform. Think of it as a world computer that anyone can build on.

    This programmability is its superpower. It’s the foundation for decentralized finance (DeFi), non-fungible tokens (NFTs), and thousands of decentralized applications (dApps). The network’s native token, Ether (ETH), is used to pay for transaction fees (known as “gas”) and to secure the network through staking. Following “The Merge,” ETH also became a deflationary asset under certain conditions, as a portion of transaction fees are burned, permanently removing them from circulation.

    Current Market Conditions: Reading the Tea Leaves

    The numbers don’t lie, and right now, they’re painting a cautious picture. As of this writing, Ethereum sits at $3,589.50. While its market cap of over $432 billion keeps it firmly as the second-largest crypto asset, recent performance has been weak.

    The most telling metric is the $48 billion in 24-hour volume. High volume during a sharp price drop is a classic sign of capitulation. This suggests that traders who were using leverage are being forced to sell their positions, adding fuel to the fire. The price changes confirm this story: a 6.9% loss in 24 hours, a 13% loss over the week, and a painful 20% loss over the past 30 days. This isn’t a minor dip; it’s a sustained downtrend that is testing investor conviction.

    On-Chain & Narrative Drivers

    While price action tells one story, the underlying health of the network and the prevailing narratives tell another. Since we don’t have a crystal ball, we have to look for clues on-chain and in the broader market.

    Currently, the dominant narrative is one of macroeconomic uncertainty. Concerns about inflation, central bank policies, and geopolitical tensions often lead investors to shed riskier assets like cryptocurrencies. This “risk-off” sentiment can temporarily overshadow even the strongest project-specific fundamentals. On-chain, we would be looking for signs of long-term holders accumulating, which would be represented by ETH flowing out of exchanges and into private wallets or staking contracts. Conversely, a surge of ETH flowing into exchanges would signal intent to sell, reinforcing the bearish outlook.

    However, the long-term bullish narratives for Ethereum haven’t gone away. The Layer 2 ecosystem (solutions like Arbitrum, Optimism, and zkSync) continues to grow, processing millions of transactions and making Ethereum more scalable. The “ultrasound money” thesis, driven by fee burns, remains a powerful long-term value driver. For now, these positive fundamentals are taking a backseat to short-term market fear.

    Ethereum (ETH) Technical Analysis: Key Scenarios

    Let’s get to the heart of it: the charts. Based on the current price of ~$3,590, we can map out a few potential scenarios for the coming weeks. This Ethereum (ETH) Technical Analysis will focus on key support and resistance levels.

    The Bear Case: A Breakdown to $3,000

    If sellers maintain control, the first major test is the support zone around $3,400. This level likely represents a previous swing low and a psychological floor. A decisive break below this, especially with high volume, would be a very bearish signal.

    • Target: A break of $3,400 opens the door for a drop to the next major demand zone, which sits between $3,000 and $3,200.
    • Rationale: The sustained selling pressure seen in the 30-day performance indicates strong bearish momentum. A failure to bounce at immediate support would confirm that bears are in full control, likely targeting the next major area of liquidity.

    The Base Case: Choppy Consolidation

    The most likely scenario in the short term is often the messiest one. In this case, Ethereum could find temporary footing in the $3,400 to $3,600 range.

    • Range: The price would likely bounce between support at $3,400 and resistance at $3,800 (the level it recently broke down from).
    • Rationale: After a major sell-off, both buyers and sellers can become exhausted. This leads to a period of lower-volume, sideways price action as the market decides on its next major move. This consolidation phase could last for days or even weeks.

    The Bull Case: A Powerful Reversal

    For the bulls to regain control, they need to do more than just stop the bleeding. They need to show strength by reclaiming lost territory.

    • Target: The first step is a decisive move back above the $3,800 resistance level. If ETH can flip that level back into support, the next target becomes the psychologically important $4,000 mark.
    • Rationale: A strong reclaim of a key breakdown level like $3,800 would trap short-sellers and signal that the recent dip was a liquidity hunt rather than the start of a prolonged bear market. This would require a significant shift in market sentiment, perhaps triggered by positive news or a strong bounce in Bitcoin.

    A Simple Valuation for Ethereum

    It’s easy to get lost in short-term price charts. Let’s take a step back with a simple, back-of-the-envelope valuation to see if the current price makes sense from a fundamental perspective.

    One way to value Ethereum is by looking at the revenue it generates from transaction fees. Let’s make a conservative assumption that the network generates around $10 billion in annualized fee revenue. We can then apply a Price-to-Sales (P/S) multiple. For a high-growth, market-leading technology network, a multiple of 30-50x isn’t unreasonable.

    • Calculation: $10 billion (annual revenue) x 40 (P/S multiple) = $400 billion market capitalization.

    At its current price, Ethereum’s market cap is $432 billion. This simple model suggests that even after the recent drop, the price is within a reasonable valuation range based on its network activity. This doesn’t mean it can’t go lower, but it does suggest that the current price isn’t wildly detached from its underlying fundamentals.

    Risks & What to Watch

    Navigating this market requires vigilance. Here are the key things to keep on your radar:

    • Macro Environment: Pay close attention to inflation data and statements from the Federal Reserve. A hawkish stance on interest rates is typically bearish for crypto.
    • Bitcoin’s Price Action: As the market leader, Bitcoin often dictates the direction of the entire crypto space. A breakdown in BTC will almost certainly drag ETH down with it.
    • Key Levels: The $3,400 support and $3,800 resistance are the most important levels to watch in the immediate future. The market’s reaction at these points will provide major clues about the next trend.
    • Regulatory News: Any surprise announcements from regulatory bodies like the SEC can inject massive volatility into the market.

    Conclusion: Patience is Key

    Ethereum is currently at a critical juncture. The short-term trend is undeniably bearish, driven by fear and technical breakdowns. However, the long-term fundamental picture remains robust, and its current valuation appears reasonable based on network revenue.

    For investors, this is a time for patience, not panic. Rushing to sell into a high-volume capitulation is often a losing strategy, as is blindly buying a falling knife. The best course of action is to re-evaluate your own investment thesis, check if it still holds true, and watch for confirmation before making any major moves. Observe how the price reacts at the key levels discussed in this Ethereum (ETH) Technical Analysis to gauge market strength.

    FAQ

    Is Ethereum a good investment in November 2025?
    Ethereum’s long-term potential as the leading smart contract platform remains strong. However, its price is currently experiencing high volatility. Whether it’s a good investment depends entirely on your personal financial goals, time horizon, and risk tolerance.

    What is the next major support level for ETH?
    Based on current technicals, the most immediate critical support is the zone around $3,400. If that level fails to hold, the next major area of historical support is between $3,000 and $3,200.

    How does Bitcoin’s price affect Ethereum?
    Bitcoin is the largest cryptocurrency by market cap and acts as the benchmark for the entire asset class. Major price movements in Bitcoin tend to have a strong correlated effect on Ethereum and other altcoins.

    What is the best way to analyze Ethereum’s price?
    A comprehensive approach is best. This includes technical analysis to understand price trends and key levels, fundamental analysis to assess the network’s health and growth, and sentiment analysis to gauge the overall mood of the market.

    Not financial advice. Do your own research.