More
    Home Blog Page 41

    What Is Edel (EDEL) Price Today? EDEL Technical Analysis (November, 2025)

    0

    That dizzying feeling when you check your portfolio and see a small-cap coin up over 40% in a single day is a unique thrill in crypto. It’s a moment of pure adrenaline mixed with a healthy dose of suspicion. Is this the breakout you’ve been waiting for, or is it a trap? The truth is, moves like this are where fortunes are made and lost. Understanding the context behind the pump is crucial before making your next move. This deep dive provides an Edel (EDEL) Technical Analysis to help you navigate the volatility and see what might be coming next.

    This analysis breaks down the recent price action, explores potential scenarios for the coming weeks, and gives you the key levels to watch. Remember, in a market that moves this fast, having a plan is your best asset.

    TL;DR: Key Takeaways

    • Massive Short-Term Momentum: EDEL has surged over 40% in the past 24 hours, signaling a huge influx of buying pressure and trader interest.
    • Key Level to Watch: The price is currently challenging the critical psychological resistance level of $0.10. A sustained break above this could open the door for further upside.
    • High-Risk, High-Reward: With a market cap under $50 million, EDEL is a low-cap asset. This means it is prone to extreme volatility, and this recent pump could be followed by a sharp correction.
    • Healthy Volume: The 24-hour trading volume is over 10% of the market cap, which suggests this move is supported by significant market activity and not just a low-liquidity spike.

    What is EDEL?

    Before we dive into the charts, let’s have a quick refresher. Edel (EDEL) is a blockchain project focused on creating a decentralized framework for digital identity and data verification. The goal is to give users control over their personal information while allowing them to interact securely with Web3 applications.

    Think of it as a universal passport for the digital world, aiming to solve issues of data privacy and fragmentation. By enabling users to own and manage their identity credentials, EDEL hopes to become a foundational layer for a more secure and user-centric internet. Its performance often reflects broader trends in the Web3 infrastructure and digital identity sectors.

    Current Market Conditions

    The numbers are telling a very clear story of explosive short-term interest. As of November 2025, EDEL is trading at $0.093777, up a staggering 40.15% in the last 24 hours. This kind of move doesn’t happen in a vacuum and demands our full attention.

    With a market cap of $44.3 million, EDEL firmly sits in the micro-cap category. Assets this size are known for their volatility; it takes far less capital to move their price compared to giants like Bitcoin or Ethereum. The 24-hour volume of nearly $5 million is particularly noteworthy. This gives us a volume-to-market-cap ratio of over 11%, a healthy figure that indicates strong liquidity and a high degree of trader participation in the current rally. It suggests this isn’t an isolated, low-volume fluke but a move with real money behind it.

    On-Chain & Narrative Drivers

    While we don’t have access to deep on-chain metrics like wallet inflows or developer activity at this moment, a 40% rally is almost always driven by a powerful narrative. In crypto, sentiment is a powerful force, and a sudden price surge can create its own self-fulfilling prophecy as FOMO (Fear Of Missing Out) kicks in.

    The catalyst could be anything from a recently announced partnership, a successful mainnet upgrade, or simply getting swept up in a sector-wide trend. For a project like EDEL, positive developments in the decentralized identity or Web3 infrastructure space could be acting as a tailwind. Traders should be on the lookout for any recent project announcements or significant social media chatter that could explain this sudden burst of enthusiasm.

    Edel (EDEL) Technical Analysis: Potential Scenarios

    This is where we get to the heart of the matter. After a 40% pump, the price is at a crossroads. Here’s a breakdown of the bull, base, and bear scenarios for the coming weeks, providing a detailed Edel (EDEL) Technical Analysis.

    The Bull Case: Breakout Above $0.10

    In this scenario, buying momentum continues, pushing EDEL decisively through the $0.10 psychological resistance. This level is critical. If the price can close a daily candle above it on high volume, it would signal that buyers are in full control.

    • Rationale: A break of a key psychological level often triggers a new wave of buying from both breakout traders and those who were waiting for confirmation.
    • Potential Target: The next major resistance levels could be projected around $0.125 and $0.150. This would represent another 30-60% gain from current levels.
    • What to Watch: Sustained high trading volume and a clean hold of the $0.10 level as new support.

    The Base Case: Healthy Consolidation

    It’s rare for an asset to go straight up without pausing. The most sustainable outcome might be a period of consolidation where the price ranges between the recent highs and a new support level.

    • Rationale: Early buyers take profits, but new investors who believe in the project’s potential step in, creating equilibrium. This allows the market to “digest” the recent gains.
    • Potential Range: Expect EDEL to trade sideways between $0.075 (new support) and $0.10 (resistance). The price may retest the lower end of this range before making its next move.
    • What to Watch: Declining volume during the consolidation phase, which is a sign of a healthy pause rather than a reversal.

    The Bear Case: Rejection and Retracement

    The reality of micro-caps is that what goes up fast can come down just as quickly. A failure to break the $0.10 resistance could signal buyer exhaustion.

    • Rationale: The 40% pump was a short-term speculative event, and profit-takers overwhelm the new buyers. This could be a classic “pump and dump” dynamic or simply a natural, albeit sharp, correction.
    • Potential Target: If the price is firmly rejected at $0.10, the first support level around $0.075 would be tested. A break below that could send the price back to its pre-pump levels, somewhere in the $0.065 area.
    • What to Watch: A sharp increase in selling volume near the $0.10 mark and a failure for buyers to step in at lower support levels.

    Simple Valuation Back-of-the-Envelope

    Valuing crypto projects is notoriously difficult, but we can use simple market cap comparisons for a rough estimate. Let’s assume EDEL competes in the decentralized identity sector.

    Established leaders in this niche might have market caps between $150M and $300M, while other promising, smaller projects often fall in the $75M to $125M range. EDEL currently sits at about $44M.

    • Assumption 1 (Peer Competitor): If EDEL can deliver on its roadmap and reach the valuation of its mid-tier peers (e.g., a $100M market cap), its price would be approximately $0.21. This would require a little more than a 2x from its current price.
    • Assumption 2 (Sector Leader): If EDEL achieves significant adoption and becomes a leader in its space (e.g., a $250M market cap), its price could potentially reach $0.53.

    This is a highly speculative exercise and depends entirely on the project’s ability to execute. It should not be seen as a price prediction but rather as a way to frame the potential long-term upside if things go exceptionally well.

    Risks & What to Watch

    Investing in an asset after a 40% daily gain carries significant risk. Here’s what you need to keep in mind:

    • Extreme Volatility: The biggest risk is a sharp reversal. Micro-caps are not for the faint of heart, and a 20-30% pullback could happen just as quickly as the pump.
    • Overall Market Sentiment: If Bitcoin and the broader crypto market take a downturn, it’s highly likely that EDEL will follow, regardless of its own momentum.
    • Lack of Data: The missing 7-day and 30-day price change data suggests we are looking at a very recent event. This lack of a longer-term trend makes analysis more challenging and inherently riskier.

    Watch for the $0.10 resistance level, daily trading volume, and any fundamental news from the EDEL team that could sustain this rally.

    Conclusion and Next Steps

    Edel (EDEL) is currently at a pivotal moment. The explosive 40% rally has put it on the map for many traders, but it also places it at a critical decision point. The battle for the $0.10 level will likely determine its direction for the rest of the month.

    For traders, the path forward is about managing risk. A confirmed breakout above $0.10 on strong volume could present a compelling long opportunity. Conversely, a rejection could signal a time to be cautious or even look for a short-term pullback. For long-term investors, this volatility is mostly noise. The more important question is whether the project’s fundamentals justify a higher valuation over time.

    FAQ

    What is causing EDEL’s price to rise so quickly?
    A price surge of this magnitude is typically caused by a combination of factors, including a specific news catalyst (like a partnership or tech update), a surge in retail investor interest (FOMO), and the inherent volatility of a low-market-cap cryptocurrency.

    Is EDEL a good investment right now?
    After a 40% single-day gain, the risk of a sharp correction is very high. It may be prudent to wait for the price to stabilize, confirm a breakout above resistance, or pull back to a clear support level before considering an entry. The asset’s future depends on its fundamental progress.

    What is the most important chart level to watch for EDEL?
    The most critical level is the psychological resistance at $0.10. A sustained move above this price would be a strong bullish signal, while a rejection from it would suggest the rally may be losing steam.

    How does EDEL’s market cap affect its price?
    With a market cap of only $44 million, EDEL is a micro-cap asset. This means that relatively small amounts of buying or selling pressure can cause dramatic price swings. This creates opportunities for high returns but also comes with significantly higher risk.

    Not financial advice. Do your own research.

    Sui (SUI) Price Prediction: What Will SUI Price Be in 2038?

    0

    Imagine it’s 2038. The world of digital assets looks vastly different. Your crypto portfolio has weathered bull runs that defied imagination, bear markets that tested your resolve, and technological shifts that rewrote the rules. In this future, where does a powerful Layer-1 blockchain like Sui (SUI) stand? Is it a forgotten relic or a cornerstone of the new digital economy? Answering that question starts today, and it’s a journey every long-term investor needs to consider.

    This deep dive offers a comprehensive Sui (SUI) Price Prediction for 2038, exploring the technology, market dynamics, and potential scenarios. While nobody has a crystal ball, we can use a framework of logic and analysis to map out what the future might hold for this promising project.

    TL;DR: Sui Price in 2038

    • Current State: Sui is currently in a short-term downtrend, with its price at $1.58 after seeing significant drops over the last 30 days. This reflects broader market weakness and investor caution.
    • What is Sui?: Sui is a high-performance Layer-1 blockchain created by ex-Meta engineers. It uses the Move programming language and an innovative object-centric model to enable fast, cheap, and secure transactions, targeting gaming, DeFi, and other high-throughput applications.
    • Long-Term Outlook: The path to 2038 is long and uncertain. Our analysis presents a wide range of outcomes, from a bearish case below $5 to a highly optimistic bull scenario where SUI could trade above $150.
    • Key Factors: Sui’s ultimate success will depend on three things: winning the fierce competition against other Layer-1s like Solana and Aptos, attracting a massive and loyal base of developers, and mainstream adoption of its ecosystem dApps.

    Disclaimer: This article is for informational purposes only and does not constitute financial advice. The crypto market is extremely volatile. Always do your own research before making any investment decisions.

    What is SUI? A Quick Refresher

    Before we look forward, let’s quickly recap what Sui is. Think of it as one of the new contenders in the “blockchain wars,” aiming to be faster, cheaper, and more scalable than older networks like Ethereum. It was built by Mysten Labs, a company founded by former senior engineers from Meta’s abandoned Diem blockchain project.

    Sui’s secret sauce is its unique architecture. Instead of processing transactions sequentially in blocks like most blockchains, Sui can process many transactions in parallel. It does this through an “object-centric” model, where data is stored as distinct objects. This design is especially good for applications that require massive scale, like gaming, social media, and high-frequency DeFi. It uses the Move programming language, which is designed with a heavy emphasis on security to prevent common smart contract bugs and exploits.

    Current Market Conditions: Reading the Tea Leaves

    To understand where SUI might go, we first need to understand where it is right now. The live metrics paint a clear picture of short-term pain but also underlying interest.

    At a current price of $1.58, SUI has experienced a tough month, down nearly 39%. The weekly and daily charts show similar bearish pressure, with losses of over 20% and 5.9% respectively. This kind of price action suggests sellers are in control, likely driven by a mix of profit-taking from earlier highs and broader market uncertainty that has affected most altcoins. However, the 24-hour trading volume of over $861 million is very strong. A high volume-to-market-cap ratio (around 15%) tells us that SUI is far from forgotten. There’s a lot of activity, with traders actively buying and selling, which means there’s still high interest and liquidity in the asset.

    On-Chain & Narrative Drivers for Long-Term Growth

    Price charts only tell part of the story. For a project to thrive until 2038, it needs powerful underlying drivers. For Sui, these fall into two camps: its on-chain health and the narrative it builds in the crypto community.

    The core on-chain metrics to watch are Total Value Locked (TVL), daily active users, and transaction volume. While these can fluctuate, a sustained, long-term upward trend is the clearest sign of a healthy, growing ecosystem. If more capital is being locked into Sui’s DeFi protocols and more users are interacting with its dApps every day, it proves the technology has found a real-world product-market fit. This is the ultimate fuel for long-term price appreciation.

    The narrative is just as important. Sui is firmly in the “Solana Killer” or “Next-Gen L1” camp. Its story is about superior technology leading to better user experiences. Key narrative drivers include the adoption of the Move language by developers, major gaming studios choosing to build on Sui, and its ability to power DeFi applications that are simply too slow or expensive on other chains. The credibility of its founding team from Meta also provides a strong foundation for this narrative.

    Scenarios for 2038: A Sui (SUI) Price Prediction

    Forecasting over a decade out is an exercise in structured speculation. Here are three potential scenarios for Sui’s price in 2038, based on different assumptions about its adoption and the growth of the overall crypto market.

    Bearish Scenario: A Niche Player ($2 – $4)

    In this scenario, Sui fails to capture significant market share. The competition from established players like Solana and a new wave of innovative L1s proves too intense. While the technology is sound, it doesn’t attract enough developers or high-value applications to create a vibrant, self-sustaining ecosystem. It survives but remains a minor, niche chain.

    From a technical perspective, this would mean SUI’s price fails to establish a convincing long-term uptrend over multiple market cycles. It would likely remain range-bound, unable to break and hold above key psychological and historical resistance levels. In this future, its market cap might stagnate between $20 billion and $40 billion. Assuming a fully diluted supply of 10 billion tokens, this translates to a price of $2 to $4 per SUI.

    Base Scenario: A Major Contender ($25 – $40)

    This is the most realistic and probable successful outcome. In this future, Sui doesn’t “kill” its competitors, but it carves out a significant and defensible position in the market. It becomes a go-to chain for specific use cases, like complex on-chain games or high-throughput financial applications. It coexists with other major L1s in a multi-chain world.

    Technically, this would look like a healthy, long-term uptrend. SUI would set higher highs and higher lows across bull and bear cycles, consistently outperforming the broader market. It would find strong support at previous cycle peaks, a classic sign of a fundamentally strong asset. If Sui captures just 1% of a future $3 trillion crypto market, its market cap would be $300 billion. With 10 billion tokens, this base case puts our Sui (SUI) Price Prediction at $30 per SUI, with a range of $25 to $40.

    Bullish Scenario: A Market Leader ($100 – $150+)

    In the most optimistic scenario, Sui’s technological bets pay off spectacularly. Its parallel transaction processing and object-centric model prove to be a true paradigm shift, enabling applications we can’t even imagine today. Developers flock to the Move language for its security, and users follow for the seamless experience. Sui becomes one of the dominant Layer-1 blockchains, hosting a multi-trillion-dollar ecosystem of dApps.

    A price chart for this outcome would be one of explosive, parabolic advances during bull markets. SUI would consistently break all-time highs and enter prolonged periods of price discovery. If Sui were to capture 4% of a future $35 trillion crypto market, its market cap would reach $1.4 trillion. This would result in a price of $140 per SUI, with the potential for even higher peaks.

    A Simple Valuation Model

    Let’s ground these scenarios with a simple back-of-the-envelope calculation. This model is built on a few key assumptions:

    1. Total Crypto Market Cap in 2038: Let’s conservatively assume the entire crypto market grows to $25 Trillion.
    2. Sui’s Fully Diluted Supply: We’ll use the maximum supply of 10 billion SUI.
    3. Sui’s Market Share: We’ll assign a percentage based on our scenarios.

    Here’s how the math plays out:

    • Bear Case (0.1% Market Share): ($25,000,000,000,000 * 0.001) / 10,000,000,000 = $2.50 per SUI
    • Base Case (1% Market Share): ($25,000,000,000,000 * 0.01) / 10,000,000,000 = $25 per SUI
    • Bull Case (4% Market Share): ($25,000,000,000,000 * 0.04) / 10,000,000,000 = $100 per SUI

    This simple model shows how powerful market share is. Even small changes in dominance can lead to massive differences in long-term price.

    Risks & What to Watch

    The road to 2038 is filled with obstacles. The biggest risk for Sui is the brutal competition. It’s not just fighting Solana and Aptos; it’s competing with every other smart contract platform for developers, users, and capital. Other risks include potential technological hurdles, unforeseen regulatory changes, and the simple fact that it might fail to build a compelling ecosystem that people want to use.

    If you are a long-term investor, here’s what you should be watching:

    • Developer Activity: Is the number of active developers building on Sui consistently growing?
    • Ecosystem Growth: Are high-quality dApps in gaming, DeFi, and other sectors launching and gaining traction?
    • On-Chain Metrics: Keep an eye on the long-term trends for TVL, daily active wallets, and transaction counts on explorers like SuiVision.
    • Partnerships: Are major brands, gaming studios, or financial institutions choosing to build with or integrate Sui?

    Conclusion: A High-Risk, High-Reward Bet on the Future

    Sui is undeniably one of the most technologically impressive blockchains to launch in recent years. Its architecture is built for a future that demands incredible speed and scale. However, great technology alone does not guarantee success. The journey to 2038 will be a marathon, not a sprint, defined by fierce competition and relentless innovation.

    For investors, Sui represents a high-risk, high-reward opportunity. The potential for a 20x, 50x, or even 100x return from its current price is on the table, but so is the risk of it failing to live up to its monumental potential. The next steps for any potential investor are to look past the daily price charts. Dive into their whitepaper, explore the projects building on their ecosystem, and decide for yourself if you believe in their long-term vision for a more scalable and accessible Web3.

    FAQ

    Is SUI a good long-term investment?
    Sui has strong technological foundations and a world-class team, making it a compelling long-term candidate. However, it is a high-risk asset in a very competitive sector of the crypto market. Its success depends heavily on future adoption, which is not guaranteed.

    Who are Sui’s main competitors?
    Sui’s primary competitors are other high-performance Layer-1 blockchains, most notably Solana (SOL) and Aptos (APT). It also competes with the broader smart contract platform market, including Ethereum and its Layer-2 solutions.

    What is the maximum supply of SUI?
    The maximum and total supply of SUI is capped at 10 billion tokens. This fixed supply means the token is not inflationary in the long run.

    What makes Sui’s technology different?
    Sui’s key differentiators are its object-centric data model, which allows for parallel transaction processing for massive scalability, and its use of the Move programming language, which is designed for enhanced security and formal verification of smart contracts.

    Not financial advice. Do your own research.

    How to Teach Crypto AI Agents to Trade for You — It’s Easier Than You Think

    0

    Unfortunately, there’s no secret formula that guarantees results in crypto trading. 

    Most of us learn through stress testing our assumptions in real time. Some traders hide behind indicators. Some agonize over execution. Others jump on whatever explodes on the timeline. I always assumed your strategy was something you refine through repetition and pain.

    And it is, but there’s another common factor: any strategy can work, as long as it’s based in real market data.

    In other words, there are many ways to find and execute winning trades, but it takes long, tedious hours of searching, collecting, and analyzing immense amounts of data. So many that it feels impossible to achieve.

    But then, I found crypto AI agents, and it forced me to rethink what “strategy” even means.

    Most people expect AI to come packaged with some perfect system or proprietary strategy. This “secret formula” that will guarantee profits. 

    That’s not how it works. Again, there’s no such thing. 

    The crypto AI agent that I found doesn’t have a built-in strategy. Instead, it learns yours. You can set up how you usually trade, what tokens you normally buy, and how much risk you are willing to assume. Then, it takes over, managing your wallet and placing orders on your behalf as if it was yourself doing the trading.

    That’s what pushed me to try it. Because trading is exhausting. And when you give an AI agent a clear instructions, it never drifts. 

    The crypto AI agent that I used is called Milo, and in this article, I will tell you everything you need to know about how it works and how you can use it to make crypto trading easier.

    How Crypto AI Agents Work

    Milo scans the Solana ecosystem around the clock. 

    It can pull data directly from the blockchain, which allows it to reads liquidity, on chain movements, velocity, holder growth, and momentum shifts before most people even notice a chart is waking up. 

    However, my favorite aspect is accessibility. You talk to it in plain language. Tell it what you want to trade. Ask questions about the tokens, request strategies, and finally, give it instructions. He figures out the rest.

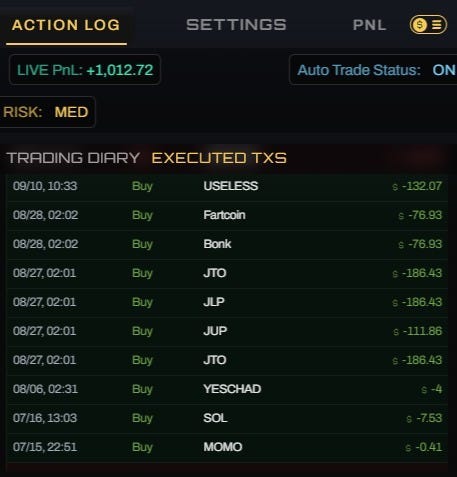
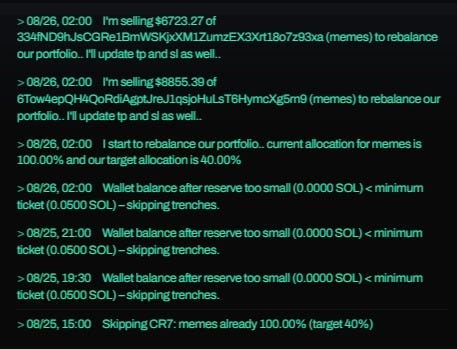
    If you use the auto-trading feature to set it loose, it pretty much does all the heavy lifting. It hunts for setups that match your style and executes without hesitation. 

    And the more you work with it, the more familiar it becomes with your preferences. Not because he copies them, but because he internalizes the boundaries you set.

    That is where the magic is. You are not giving orders to a machine. You are shaping an assistant that understands how you want to interact with the market.

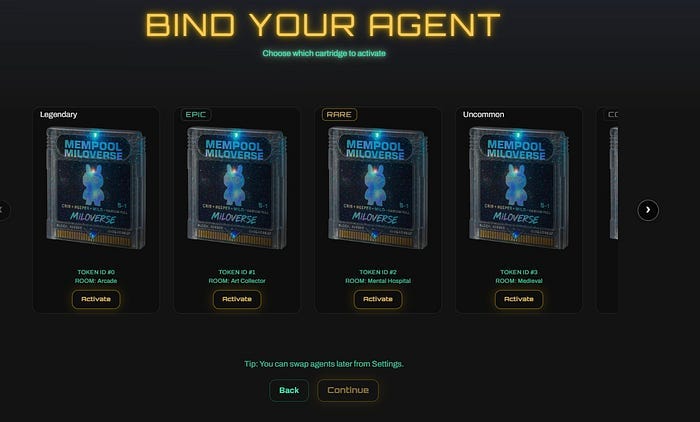
    Milo is live and you can start using it right away. If you’ve read enough, connect your wallet here and level up your crypto trading with AI.

    Setting Up Your Trading Style

    Now that we’ve covered how it works, let’s jump into how to set it up.

    The moment you start defining your strategy, Milo begins to learn. Every trader has a style. Some protect capital with their lives. Some lean into volatility. Others chase the rush of momentum where anything can 5x before breakfast.

    The great thing about Milo is that it lets you blend your instincts with its process, intuition with code. Your risk appetite sets the tone. Your token selection defines the battlefield. Your prompts give him the playbook.

    You tell it what you are after and it scans, analyzes, and executes according to that intent.

    Here is how you teach Milo your trading style so it can trade for you.

    Step 1: Select the Tokens You Want Him to Trade

    Inside Milo, you configure token categories and tell it which sets matter to you. These categories define your universe. They also reveal the type of trader you are.

    Trenches

    If you like asymmetric bets and you do not mind living near the edge, these are the early stage tokens that most people will never notice. Low liquidity. High variance. Huge upside if you don’t mind the occasional high risk bet.

    Memes

    Every Solana memecoin from pump.fun. Real time updates. Pure narrative flow. Perfect for traders who thrive on speed and instinct.

    Promising Memes

    Similar to the previous one, but this meme list is manually curated. Stronger signals. Less rug noise. If you hunt cultural momentum, start here.

    Staking

    If you focus on accumulation, APY comparison, or long term yield, Milo can anchor you to staking opportunities across Solana.

    Native

    Core Solana ecosystem tokens. Liquidity you can trust. Movement you can analyze without noise. For traders who want solid ground under them.

    Majors

    The blue chips of Solana. Low drama. High reliability. Perfect for conservative or steady growth profiles.

    Stables

    For people who see opportunity in stability. Arbitrage, low risk yield, short term parking during volatility.

    xStocks

    On chain mirrors of real world equities. If you want exposure to traditional markets without leaving Solana, this set exists for you.

    When you pick from these categories, you are not just choosing assets. You are teaching Milo what environment you feel comfortable trading in.

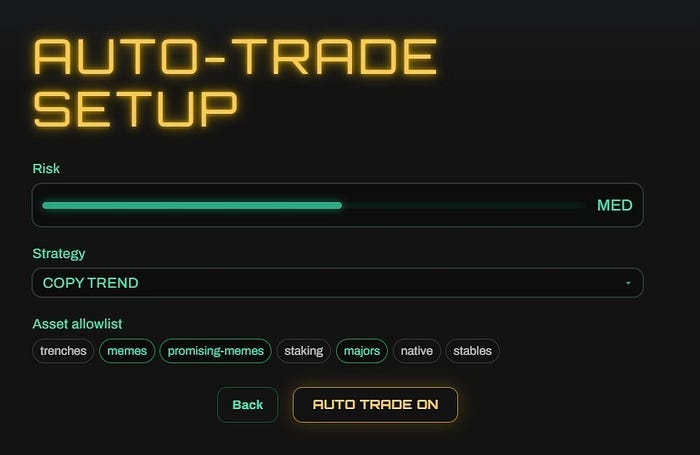
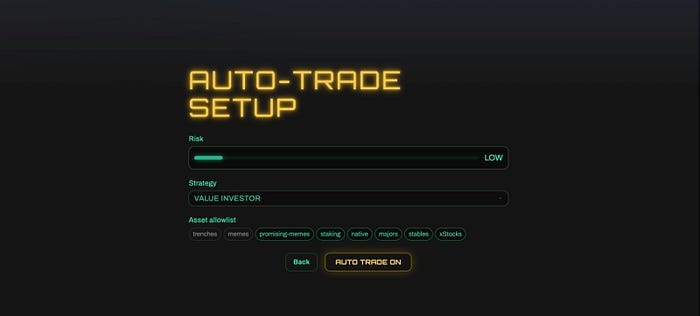
    Step 2: Choose Your Risk Tolerance

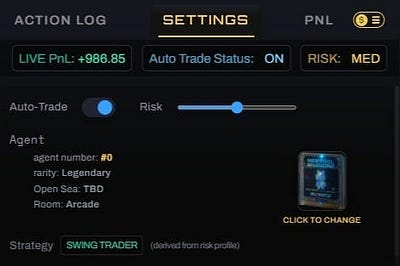
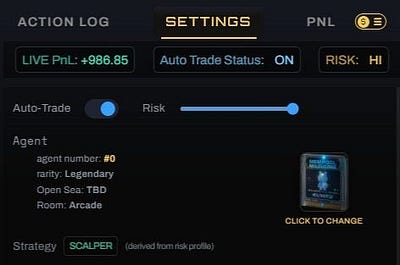
    This is where your personality shows. Milo uses three risk settings. They dictate its confidence, activity and aggression.

    Conservative

    Capital preservation. Stability. Milo will wait for strong setups and avoid chaos or high volatility plays.

    Moderate

    Balanced trading. Controlled risk. Reasonable exposure to upside without reckless entries.

    Aggressive

    Pure alpha hunting. Volatility allowed. High tempo. It will chase momentum when it is alive.

    This is the moment Milo starts to understand who it is trading for. Not every trader wants the same level of action. Once it knows your comfort zone, it will shape his decisions around it.

    Tips and Tricks for Getting the Best Out of Milo

    The longer I work with Milo, the more I treat it as someone who sits across the desk from me, absorbing the way I think. Because it’s not just reacting to instructions, but actually learning the intention behind them. 

    And when you understand how to shape that intention, Milo becomes far more powerful.

    Below are the configurations and approaches that have consistently delivered the best experience. 

    Take what fits you. Ignore what doesn’t. The point is not to trade like me. The point is to help Milo trade like you.

    If Your Goal Is Steady, Low Stress Growth

    There is a certain calm that comes from watching your portfolio move without drama. When I aim for this version of myself, I pair Milo with a simple configuration.

    • Token sets: Majors, Native, Staking, Stables
    • Risk profile: Conservative
    • Budget split: Wider distribution, smaller positions

    Under this setup, Milo becomes a patient observer. It waits for clean setups, avoids thin liquidity, and focuses on tokens with predictable movement. 

    If you are the type who prefers sleeping well over chasing 50 percent swings, this setup almost feels like handing your money to the quietest, most disciplined version of yourself. 

    Milo thrives when the environment is stable and the rules are clear.

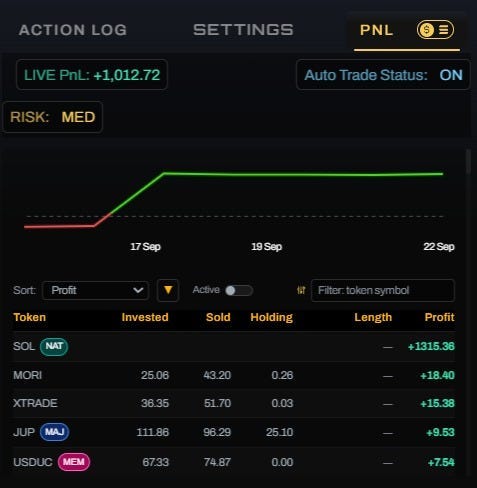
    👉🏼Set up this strategy on Milo’s Autotrader.

    If Your Goal Is Controlled Growth With Occasional Big Wins

    This is the middle path. You want opportunity, but you do not want chaos. You want some upside, but not at the cost of waking up to sudden wipeouts.

    • Token sets: Promising Memes, Native, Memes
    • Risk profile: Moderate
    • Budget split: A mix of base-layer stability with a few momentum slots

    Moderate risk lets Milo stretch its legs without sprinting off a cliff. It still respects liquidity and checks velocity, holder growth, and trends before pulling the trigger. 

    But it is also willing to take positions where momentum is building. This is where Milo feels most alive, operating at a pace where intuition meets stability.

    👉🏼Set up this strategy on Milo’s Autotrader.

    If Your Goal Is High Tempo, High Reward Trading

    Some days you want to feel the market breathe. You want to capture the fast movers, the early charts, the things most people notice five minutes too late. 

    When I switch into this mode, I give Milo a sandbox where it is allowed to run.

    • Token sets: Trenches, Memes, Promising Memes
    • Risk profile: Aggressive
    • Budget split: Tight concentration, smaller time-in-position

    Aggressive Milo is not wild but decisive. It sees momentum forming before most traders blink. It jumps into early stages where volatility is part of the terrain. It will take more trades, exit faster, and pivot more often.

    This setup is not for people who panic easily. But if you understand the nature of volatile markets, this is where Milo becomes the version of itself that surprises you.

    👉🏼Set up this strategy on Milo’s Autotrader.

    If Your Goal Is To Preserve Capital During Turbulent Markets

    There are stretches where the best trade is defense. When the market turns into a minefield, I retrain Milo into something closer to a shield.

    • Token sets: Stables, Majors
    • Risk profile: Conservative
    • Budget split: Mostly capital parked, with occasional safe opportunities

    Milo shifts into protective mode, ignoring noise and temptation. Instead, it looks for safe yield, low volatility, and pockets of stability. This setup is ideal when conditions feel unpredictable and you want your capital intact when the next clear trend emerges.

    👉🏼Set up this strategy on Milo’s Autotrader.

    If Your Goal Is To Experiment, Learn, And Watch Milo Evolve

    This is my favorite mode. The explorer mindset. When you are not just trading to win, but trading to understand how your personal logic translates into Milo’s behavior.

    • Token sets: A mix of three to four categories
    • Risk profile: Any
    • Budget split: Small test amounts allocated to experimental prompts

    You get to watch Milo’s decision-making unfold as if it were a student observing your style. You try new filters. You adjust risk. You tell it to hunt early momentum or avoid low liquidity or prioritize trending tokens. You refine. It adapts. 

    The more you iterate, the more it starts acting like a version of you that never gets tired, never hesitates, and never forgets the rules you set.

    This is the mode where you discover what kind of trader Milo becomes under your guidance.

    👉🏼Set up this strategy on Milo’s Autotrader.

    The Real Value: Milo Learns Who You Are as a Trader

    Most people expect AI to replace them, but the tech isn’t there yet. 

    Instead, you should look for something that could extend you and your capabilities. Something that could act when you are away and process the noise that you don’t have time to monitor. 

    Something that could help you stay consistent when your own emotions try to drag you off course. That is what Milo has turned into.

    It’s an apprentice who studies your approach and adapts as you evolve. Over time, it forms a signature that feels surprisingly aligned with your own.

    Teaching Milo your style is not about turning it into a perfect trader. It is about creating a partner you can trust to operate beside you, not for you. A partner who can scan what you cannot, act when you are unavailable, and reflect the logic you believe in.

    When it all comes together, you stop thinking of Milo as a tool. You start thinking of it as the steady second set of hands you always wished you had.

    Ready to try Milo? Connect your wallet now and automate your crypto trading with AI.

    Xrp (XRP) Price Prediction: What Will XRP Price Be in 2030?

    0

    Staring at your portfolio, you see the sea of red and green, but one asset always seems to stir the pot: XRP. You’ve heard the promises of it revolutionizing global finance and the whispers of a future where its price shatters all expectations. But what’s the reality? If you’re holding a bag of XRP and dreaming of 2030, you’re likely asking yourself the one question that matters most: what could it actually be worth? Let’s break down the possibilities, cut through the hype, and create a realistic framework for the long-term XRP (XRP) Price Prediction.

    TL;DR: XRP Price Outlook for 2030

    • Bearish Scenario ($0.50 – $1.50): A negative outcome in the SEC lawsuit, combined with fierce competition and a prolonged crypto bear market, could see XRP lose significant value and struggle to regain its footing.
    • Base Scenario ($8 – $15): A settlement or favorable resolution with the SEC, continued adoption of Ripple’s On-Demand Liquidity (ODL) service, and moderate growth in the overall crypto market could lead to substantial gains.
    • Bullish Scenario ($30 – $60): A decisive win against the SEC, rapid, widespread adoption by major financial institutions, and a key role in Central Bank Digital Currencies (CBDCs) could trigger an exponential price increase as XRP becomes integral to global finance.

    What is XRP? A Quick Refresher

    Before we look forward, let’s glance back. XRP is the native digital asset of the XRP Ledger (XRPL), a decentralized, open-source blockchain technology created by Ripple Labs. Its primary goal is simple yet ambitious: to enable fast, low-cost, and reliable international payments.

    Unlike Bitcoin, which uses a proof-of-work system, the XRPL uses a unique consensus protocol to validate transactions in 3-5 seconds for a fraction of a cent. This efficiency is what makes XRP attractive to financial institutions looking to upgrade the slow and expensive traditional systems like SWIFT. Ripple’s ODL service uses XRP as a “bridge currency” to facilitate these cross-border transactions without needing pre-funded accounts.

    Current Market Conditions: A Cooldown Period

    Let’s look at the hard data. As of today, XRP is trading at $2.13. Its market capitalization stands at a hefty $128.4 billion, cementing its place as a top-tier crypto asset. Over the last 24 hours, it has seen over $4.5 billion in trading volume, which shows there is still significant interest and liquidity in the market.

    However, the short-term trend has been bearish. The price is down over 2.6% in the last 24 hours and has shed nearly 12% over the past week. Zooming out further, the 30-day change is a negative 13.5%. This suggests that after a period of excitement, the market is currently in a consolidation or cooldown phase. This isn’t necessarily a bad sign; it often reflects broader market sentiment or profit-taking after a run-up. The key takeaway is that while the long-term vision is intact, the short-term is volatile and currently trending downwards.

    On-Chain & Narrative Drivers

    Looking toward 2030, the price won’t be moved by daily chart patterns. It will be driven by fundamental developments and the stories the market chooses to believe. For XRP, the narratives are powerful and clear.

    The most significant driver is, without a doubt, the ongoing lawsuit with the U.S. Securities and Exchange Commission (SEC). The SEC alleges that XRP is an unregistered security. The outcome of this case will have a monumental impact. A win or favorable settlement for Ripple would provide much-needed regulatory clarity in the U.S. and could open the floodgates for institutional adoption. A loss would be a major setback. Beyond the lawsuit, watch for growth in Ripple’s ODL volume, new partnerships with banks and payment providers, and any involvement Ripple has in the development of CBDCs. These are the real metrics of adoption that could fuel a long-term price appreciation.

    Detailed XRP (XRP) Price Prediction for 2030

    Projecting a price nearly a decade away is speculative, but we can build logical scenarios based on potential outcomes. We’ll use the current market cap of ~$128 billion as our analytical baseline.

    H3: The Bear Case: Stagnation and Decline ($0.50 – $1.50)

    In a bearish scenario, the decade does not go well for XRP. The primary catalyst would be a decisive loss in the SEC case, classifying XRP as a security in the United States. This would lead to delistings from U.S. exchanges, stifle institutional investment, and create a chilling effect on its utility as a bridge currency.

    Furthermore, competition from other projects like Stellar (XLM), stablecoins, and even an upgraded SWIFT system could eat away at Ripple’s market share. If ODL adoption stalls and the broader crypto market enters a multi-year bear cycle, XRP’s value could erode significantly. In this world, the market cap could shrink dramatically, falling back to its pre-bull run valuations, which would place the price well below its current standing.

    H3: The Base Case: Steady Growth and Adoption ($8 – $15)

    This is the middle-of-the-road, and perhaps most realistic, scenario. It assumes a mixed or favorable outcome in the SEC lawsuit, such as a settlement that provides clear rules for XRP moving forward. This regulatory clarity would remove the single largest cloud hanging over the project.

    In this future, Ripple’s ODL continues its steady growth, onboarding dozens of new banking and payment partners globally. XRP’s utility as a bridge asset is proven, but it doesn’t completely take over the existing financial system. The overall cryptocurrency market cap is assumed to grow by 5-10x by 2030, and XRP grows along with it, maintaining its position as a top digital asset. A 5-7x increase from its current ~$128B market cap, putting it in the $640B – $900B range, would support a price between $8 and $15, assuming a higher circulating supply.

    H3: The Bull Case: The Global Bridge Asset ($30 – $60)

    The bull case is the future that long-term XRP holders dream of. This scenario begins with a decisive victory for Ripple over the SEC, establishing XRP as definitively not a security. This green light from the world’s largest economy would trigger a race among U.S. financial institutions to integrate Ripple’s technology.

    In this world, ODL becomes the standard for a significant portion of the multi-trillion-dollar cross-border payments market. Ripple also secures a key role in the infrastructure for multiple CBDCs, using the XRP Ledger as an interoperability backbone. If XRP captures even a small percentage of the global payments flow, its required market capitalization would need to be in the trillions to support that level of liquidity. A market cap of $3 trillion to $6 trillion by 2030 is plausible in this scenario, which would place XRP’s price between $30 and $60.

    A Simple Back-of-the-Envelope Valuation

    How can we ground these numbers? Let’s try a simple valuation based on utility.

    • Assumption 1: The global cross-border payments market is enormous, with SWIFT alone handling transactions worth over $150 trillion annually.
    • Assumption 2: By 2030, Ripple’s ODL network, powered by XRP, successfully captures just 1% of this market. That’s $1.5 trillion in annual value settled using XRP.
    • Assumption 3: To provide sufficient liquidity for such a network, the market capitalization of the asset used (XRP) would need to be roughly equivalent to the value it secures. Let’s be conservative and say its market cap reflects its annual settled value.
    • Calculation: A $1.5 trillion market cap divided by the maximum supply of 100 billion XRP coins equals a price of $15 per XRP.

    This simple model lands squarely in our base case scenario and shows that even a tiny dent in the legacy financial system could result in a significant price increase for XRP.

    Risks & What to Watch

    Investing in XRP is not without its risks. Keep a close eye on these factors:

    • The SEC Lawsuit: This is the most critical factor. Any news, ruling, or settlement announcement will cause extreme volatility.
    • Competition: Watch for advances from competitors, including stablecoins and other cross-border payment solutions.
    • Centralization Concerns: Critics argue that Ripple’s large holdings of XRP create a centralization risk. Monitor the company’s scheduled monthly escrow releases and how the market absorbs them.
    • Overall Market Sentiment: XRP is not immune to the broader crypto market. A prolonged bear market in Bitcoin and Ethereum will inevitably drag XRP down with it.

    Conclusion: The Verdict on the XRP (XRP) Price Prediction

    The path for XRP to 2030 is a story of immense potential shadowed by significant risk. Its future price hinges almost entirely on its ability to transition from a speculative asset to an integral piece of the global financial plumbing. The legal battle with the SEC is the first and most important hurdle.

    If you are considering XRP as a long-term investment, your conviction must be based on the success of its underlying utility. The next steps are clear: follow the lawsuit developments closely, track Ripple’s partnerships and ODL volume, and always weigh the immense potential against the very real risks involved.

    FAQ

    What is the max supply of XRP?
    The maximum supply of XRP is capped at 100 billion coins, all of which were created at its inception. A large portion is held in escrow by Ripple and released on a monthly schedule to be sold to institutions or on the open market.

    Can XRP realistically reach $100?
    For XRP to reach $100, its market capitalization would need to be $10 trillion (assuming 100 billion coins in circulation). While not impossible in a hyper-bullish future where it dominates global finance, it would require a near-perfect execution of its vision and a massive expansion of the entire digital asset market. It remains a highly optimistic target.

    How does the SEC lawsuit affect XRP’s price?
    The lawsuit creates massive uncertainty. Positive news for Ripple in the case tends to cause the price to rally, as it increases the probability of a favorable outcome. Negative news causes the price to fall. A final resolution will likely cause a definitive and powerful move in one direction or the other.

    Is XRP a better investment than Bitcoin?
    XRP and Bitcoin serve fundamentally different purposes. Bitcoin is primarily viewed as a decentralized store of value, often called “digital gold.” XRP is designed as a utility token for fast and efficient payments. Deciding which is “better” depends entirely on your investment thesis: are you betting on a store of value or on a financial utility?

    Not financial advice. Do your own research.
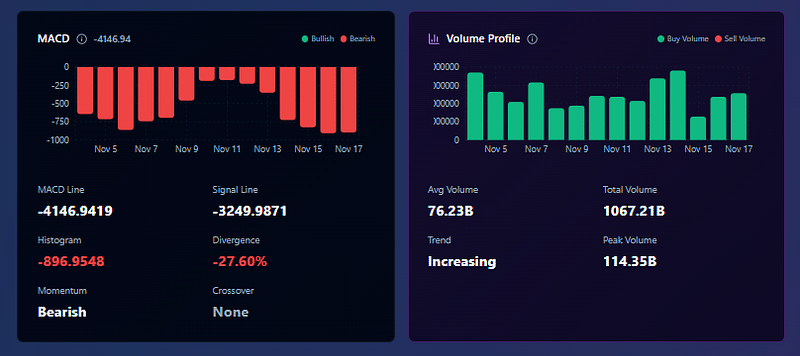
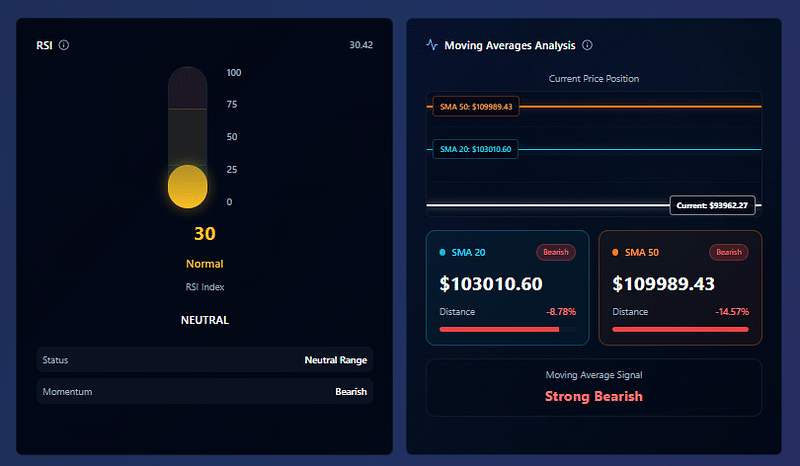
    What Is Bitcoin (BTC) Price Today? BTC Technical Analysis (November, 2025)

    0

    Feeling the chill of this recent Bitcoin dip? After a blistering run, the market has pulled back, leaving many investors wondering if they should be buying, selling, or just holding on for dear life. The double-digit drop over the past month is unsettling, but moments like these are where clear-headed analysis matters most. Let’s break down the current state of play with a straightforward Bitcoin (BTC) Technical Analysis to map out what could be next.

    TL;DR: The State of Bitcoin in November 2025

    • At a Crossroads: Bitcoin is currently trading at $93,118, showing a minor 24-hour bounce but nursing significant losses of over 9% for the week and 14% for the month.
    • Correction or Downtrend? The market is in a clear corrective phase. High trading volume at this price level suggests a major battle is underway between buyers trying to defend this zone and sellers taking profits or de-risking.
    • Key Levels to Watch: Bulls must defend the $90,000 support level to prevent a deeper slide towards the low $80,000s. A successful bounce could see BTC challenge the psychological $100,000 resistance.
    • Macro Matters: Broader economic sentiment and upcoming inflation data are likely to be major catalysts. This is not just a crypto story; it’s a global market story.

    What is Bitcoin (BTC)? A Quick Refresher

    Before we dive deep, let’s quickly recap. Bitcoin (BTC) is the world’s first and most well-known cryptocurrency. It operates on a decentralized network, meaning no single entity like a bank or government controls it. Think of it as a public ledger, the blockchain, that is secured by a massive, global network of computers.

    For investors, Bitcoin’s appeal lies in its scarcity—only 21 million BTC will ever exist—and its potential to act as “digital gold,” a store of value that is resistant to censorship and inflation. It remains the undisputed king of crypto, with its price action heavily influencing the entire digital asset market.

    Current Market Conditions: A High-Stakes Stalemate

    Let’s look at the raw numbers. With a price of $93,118, Bitcoin’s market cap stands at a colossal $1.86 trillion. The numbers tell a story of recent pain but short-term stabilization. The 1% gain over the last 24 hours is a small green shoot in a field of red, given the 9.3% drop over the week and the 14.3% decline over the past 30 days. This indicates the intense selling pressure may be pausing.

    What’s particularly interesting is the $105.8 billion in 24-hour trading volume. High volume during a price drop can be bearish, signaling widespread selling. However, high volume after a significant drop, right at a potential support level, can also signal capitulation—where the last of the panicked sellers exit, allowing strong-handed buyers to step in. The market is currently in a state of high-stakes equilibrium, waiting for a definitive move in either direction.

    On-Chain Data & Market Narratives

    While price charts tell one part of the story, on-chain data gives us a look under the hood at what investors are actually doing. While we can’t pinpoint exact data today, analysts in these situations are looking for key trends. For example, are large amounts of BTC moving off exchanges? This is often interpreted as a bullish sign, as it suggests investors are moving their coins to cold storage for long-term holding, not to sell.

    Conversely, a surge in exchange inflows could signal more selling pressure is on the way. The prevailing narrative right now is one of caution. After a period of extreme greed, the recent price drop has injected a healthy dose of fear into the market. Traders are also closely watching macroeconomic news. Any surprises in inflation reports or shifts in central bank policy could easily become the next major catalyst for volatility, pushing Bitcoin out of its current range.

    Detailed Bitcoin (BTC) Technical Analysis: Three Scenarios for November

    Here is where we map out the potential paths for Bitcoin over the coming weeks based on key technical levels. The current price of ~$93,000 is our pivot point.

    Bearish Scenario: Breakdown to the Low $80,000s

    If sellers regain control and push the price decisively below the psychological and technical support level at $90,000, the path of least resistance could be lower. This would confirm that the recent bounce was merely a temporary pause in a larger downtrend.

    A break below this level would likely trigger a wave of stop-loss orders and liquidations, accelerating the downward momentum. The next major support zone to watch would be in the $82,000 to $85,000 range. This area may correspond with a previous consolidation zone or a key moving average, making it a logical target for bears.

    Base Case Scenario: Choppy Sideways Action

    The most likely scenario in the short term could be continued consolidation. In this case, Bitcoin would trade within a range, perhaps between $90,000 and $98,000. The high volume suggests that both buyers and sellers are active at this level, leading to a stalemate.

    During this period, the price could chop back and forth, frustrating both bulls and bears. This “wait-and-see” mode would likely continue until a major catalyst emerges, be it a significant piece of market news or a large player making a decisive move. Look for declining volume as a sign that the consolidation is maturing before the next big move.

    Bullish Scenario: Reclaiming $100,000

    For the bulls to take back control, they must first mount a strong defense of the $90,000-$93,000 support zone. A successful defense, followed by a bounce with strong buying volume, would be the first bullish sign.

    The first major target on the upside would be the psychologically important $100,000 level. A clean break and hold above this price could restore confidence and signal that the correction is over. From there, the next key resistance would likely be around the $108,000 mark, which was the approximate starting point of this recent 30-day sell-off.

    A Simple Back-of-the-Envelope Valuation

    It’s easy to get lost in short-term price movements. To zoom out, let’s do a simple, long-term valuation exercise. This is not a price prediction, but a way to frame Bitcoin’s potential.

    One common method is to compare Bitcoin to gold. Gold’s total market cap is currently around $15 trillion. As a “digital gold,” Bitcoin’s value proposition is to capture a piece of that market. Bitcoin’s current market cap of ~$1.86 trillion represents about 12.4% of gold’s.

    Assumption: Let’s speculatively assume that over the next several years, Bitcoin matures and captures 25% of gold’s current market cap.
    Calculation: 25% of $15 trillion is $3.75 trillion. With a circulating supply of roughly 19.85 million BTC by late 2025, that would imply a price of approximately $189,000 per BTC. This simple model, while based on a big “if,” helps illustrate the long-term upside investors are betting on.

    Risks & What to Watch

    Volatility is the name of the game, and several factors could rock the boat:

    • Macroeconomic Headwinds: Keep an eye on inflation data (CPI reports) and central bank interest rate decisions. A “risk-off” environment in traditional markets often spills over into crypto.
    • Regulatory Uncertainty: Unexpected announcements from regulators in the US or other major economies remain a persistent risk.
    • Technical Breakdown: As outlined in the bearish scenario, a failure to hold critical support at $90,000 could lead to a rapid price decline.

    Focus on how the price reacts at key levels. Is a bounce met with strong volume, or does it look weak and unconvincing? These are the clues that will tell you who is in control.

    Conclusion: A Market at a Tipping Point

    Bitcoin is currently at a critical juncture. The froth from the recent rally has been washed away, and the market is resetting. While the recent downturn is painful, it’s a typical part of Bitcoin’s volatile price cycles. The coming weeks will be crucial in determining whether this was a healthy correction before a move to new all-time highs or the beginning of a more prolonged downtrend.

    For investors, the best course of action is to remain patient and strategic. Avoid making emotional decisions based on fear or greed. Instead, have a plan for all three scenarios discussed above and manage your risk accordingly.

    Frequently Asked Questions (FAQ)

    1. What is the most important support level for Bitcoin right now?
    The most critical short-term support level is the $90,000 zone. A firm break below this level on high volume would be a significant bearish signal for many traders.

    2. Why did Bitcoin’s price drop over the last month?
    The 14% drop is likely due to a combination of factors, including profit-taking after a strong rally, concerns about macroeconomic conditions, and liquidations of over-leveraged trading positions that accelerated the downward move.

    3. What could make Bitcoin’s price go up from here?
    Positive catalysts could include a dovish shift from central banks (like an interest rate cut), favorable regulatory news, strong institutional adoption announcements, or simply a technical bounce off key support that restores market confidence.

    4. Is it too late to invest in Bitcoin in 2025?
    Many investors believe Bitcoin is still in the early stages of its adoption curve. Based on valuation models like the “digital gold” comparison, there could still be significant long-term upside. However, it is a high-risk asset, and its price will remain extremely volatile.

    Not financial advice. Do your own research.

    Bittensor (TAO) Price Prediction: What Will TAO Price Be in 2032?

    0

    We all see the AI revolution unfolding at a dizzying pace, but what if you could invest in the very network that powers it? That’s the electrifying promise of Bittensor’s TAO token. It represents a decentralized marketplace for artificial intelligence, a concept so ambitious it has investors and technologists alike buzzing. This has led many to look far into the future, asking about a long-term Bittensor (TAO) Price Prediction and what the landscape might look like nearly a decade from now.

    This article dives deep into the potential future of TAO, breaking down the factors that could shape its value by 2032. We will analyze its current market standing, explore potential growth scenarios, and discuss the inherent risks. While nobody has a crystal ball, a structured analysis can help us frame the possibilities for this pioneering project.

    TL;DR: Quick TAO Price Forecast

    • Current State: TAO is experiencing short-term positive momentum but remains in a medium-term downtrend, reflecting broader market consolidation and profit-taking after a massive run-up.
    • Core Driver: Bittensor’s success is fundamentally tied to the growth of the AI industry and its ability to prove that a decentralized network of machine learning models is superior to centralized alternatives.
    • Bear Case (2032): If the project stalls or the AI narrative cools, TAO could trade between $100 and $400, struggling to maintain its current valuation.
    • Base Case (2032): With steady adoption and a solid position in the decentralized AI niche, a price range of $1,500 to $3,000 is a reasonable expectation.
    • Bull Case (2032): If Bittensor becomes a foundational protocol for AI development, its price could soar to $8,000 to $15,000 or higher, reflecting a market cap in the hundreds of billions.

    What is Bittensor (TAO)?

    Think of Bittensor as a global, permissionless network that incentivizes anyone to contribute machine learning models and computational power. Instead of a single company like OpenAI building a closed-off model, Bittensor creates a competitive marketplace where AI models are ranked and rewarded in TAO tokens based on the value they provide to the network.

    Miners aren’t solving cryptographic puzzles; they are providing intelligence. Validators query the network and rank the quality of the responses from these miners. The best-performing models earn the most TAO, creating a powerful incentive loop that, in theory, drives the network’s collective intelligence upward. This creates a “decentralized brain” that is constantly learning and improving, owned and operated by its users.

    Current Market Conditions

    Let’s look at the numbers right now. TAO is trading at $334.64 with a substantial market cap of over $3.2 billion. The 24-hour trading volume is strong at over $231 million, which is a healthy sign of liquidity and active interest from traders.

    The short-term price action tells an interesting story. A 6.8% gain in the last 24 hours suggests buyers are stepping in at these levels. However, when we zoom out, the picture changes. The price is down 7.9% over the week and a more significant 24.5% over the last 30 days. This indicates that while there’s immediate buying pressure, the token is still in a corrective phase after a period of intense growth. This is a classic pattern in crypto: a parabolic run-up followed by consolidation as early investors take profits and the market decides on a fair long-term value.

    On-Chain and Narrative Drivers

    The single most powerful narrative driver for Bittensor is its direct connection to the artificial intelligence boom. As long as AI remains a dominant theme in technology and markets, projects like Bittensor will attract attention and capital. It offers a unique “picks and shovels” play on the AI revolution, allowing investors to bet on the entire ecosystem rather than a single application.

    Since we cannot see granular on-chain data like active wallet addresses or staking ratios here, we must reason from the protocol’s design. The Bittensor network is built to reward genuine intelligence. Its value is directly tied to the utility and quality of the AI models within its ecosystem. As more specialized subnets (specialized AI marketplaces) for things like text generation, image creation, or data analysis launch and gain traction, the demand for TAO to participate in the network should theoretically increase. The key thing to watch is whether real-world applications start building on top of Bittensor, consuming its intelligence.

    A Long-Term Bittensor (TAO) Price Prediction for 2032

    Projecting nearly a decade into the future is highly speculative, especially in a fast-moving field like crypto and AI. The following scenarios are not guarantees but frameworks for thinking about the future based on different potential outcomes. Our analysis considers market cycles, adoption curves, and the project’s fundamental promise.

    Bear Scenario: $100 – $400

    In a bearish scenario, Bittensor’s ambitious model fails to achieve widespread adoption. The technical complexity could prove too high a barrier for developers, or a centralized competitor could offer a simpler, more effective solution that captures the market. The AI narrative might cool down, or regulatory pressures on decentralized AI could mount.

    In this world, the utility of the TAO token would stagnate. The network would exist but would not become the essential AI infrastructure it aims to be. The price would likely bleed over time, driven down by token emissions without a corresponding increase in demand. By 2032, TAO could be trading in a range of $100 to $400, struggling to hold the value it has today.

    Base Scenario: $1,500 – $3,000

    Our base case assumes that Bittensor successfully carves out a significant niche in the AI landscape. It becomes the go-to platform for specific decentralized AI tasks and attracts a dedicated community of developers and miners. While it may not unseat giants like Google or OpenAI, it thrives as a transparent and permissionless alternative.

    This scenario sees the crypto market through two more bull and bear cycles. With steady growth and proven utility, TAO’s market cap could grow to rival that of major Layer 1 blockchains today, placing it in the $50 billion to $100 billion range. Considering the token’s emission schedule, this would support a price of $1,500 to $3,000 per TAO by 2032.

    Bull Scenario: $8,000 – $15,000

    The bull case is where things get truly exciting. In this future, Bittensor’s core thesis is proven correct: a decentralized, incentivized network of intelligence can out-compete and out-innovate centralized, siloed models. Bittensor becomes a foundational layer of the internet, a “Google for intelligence,” where any application can query the network for complex tasks.

    If Bittensor captures even a small percentage of the global AI market, which is projected to be worth trillions of dollars, its network value would be immense. A market cap in the $200 billion to $500 billion range would not be out of the question for a protocol of this significance. This would translate to a TAO price of $8,000 to $15,000, and potentially much higher depending on the true scale of its success.

    A Simple Valuation Model

    Let’s try a simple back-of-the-envelope calculation to ground these numbers.

    • Assumptions:

      • The total addressable market (TAM) for the AI industry reaches $2 trillion by 2032.
      • Bittensor’s circulating supply will be approximately 15 million TAO by 2032 due to its halving schedule.
    • Calculation:

      • Low Capture (0.5% of TAM): $2 trillion * 0.005 = $10 billion market cap.
        • $10,000,000,000 / 15,000,000 TAO = ~$667 per TAO
      • Medium Capture (2.5% of TAM): $2 trillion * 0.025 = $50 billion market cap.
        • $50,000,000,000 / 15,000,000 TAO = ~$3,333 per TAO
      • High Capture (10% of TAM): $2 trillion * 0.10 = $200 billion market cap.
        • $200,000,000,000 / 15,000,000 TAO = ~$13,333 per TAO

    This simple model shows how sensitive TAO’s price is to its ability to capture real-world market share. The price targets in our scenarios align closely with these valuation estimates.

    Risks and What to Watch

    Investing in TAO is a high-risk, high-reward proposition. Here’s what you need to keep an eye on:

    • Competition: Bittensor isn’t alone. Other decentralized AI projects are emerging, and the biggest competition comes from well-funded centralized players.
    • Technical Execution: The project is incredibly complex. Any failures in the incentive mechanism or network architecture could be catastrophic.
    • Real-World Adoption: The key metric for long-term success is adoption. Are developers building on Bittensor? Are companies using its intelligence? Without real use, the price is pure speculation.
    • Tokenomics: TAO has a halving schedule similar to Bitcoin, which is designed to be deflationary over the long term. Understanding how supply and demand dynamics will play out is crucial.

    Conclusion: A Bet on the Future of AI

    The Bittensor (TAO) Price Prediction for 2032 is a tale of immense potential tempered by significant risk. The project is not just another crypto asset; it is a bold bet on a new paradigm for developing artificial intelligence. Its success hinges on its ability to execute its vision and attract a vibrant ecosystem of builders and users.

    For investors, the path forward is to watch the project’s fundamental progress. Monitor the growth of its subnets, track developer activity, and look for signs of real-world applications tapping into the network’s collective brain. While the price will be volatile, the long-term value will ultimately be determined by its utility.

    Frequently Asked Questions (FAQ)

    1. Is TAO a good investment for the long term?
    TAO is a high-risk asset with the potential for very high returns. Its long-term value depends entirely on the Bittensor network achieving its goal of becoming a core piece of AI infrastructure. It is suitable for investors with a high risk tolerance who believe in the future of decentralized AI.

    2. How does Bittensor (TAO) make money?
    The Bittensor network doesn’t “make money” in a traditional sense. It has a native token, TAO, which is used to reward participants (miners and validators) for contributing to the network’s intelligence. The value of TAO is driven by demand from those who want to use the network’s AI services or participate in its governance.

    3. Who are Bittensor’s main competitors?
    Bittensor competes on two fronts. In the centralized world, its competitors are tech giants like Google, Microsoft, and OpenAI. In the decentralized world, it competes with other crypto AI projects like Fetch.ai (FET) and SingularityNET (AGIX), although each has a different approach to solving the decentralized AI problem.

    4. What is the maximum supply of TAO?
    The maximum supply of TAO is capped at 21,000,000 tokens, the same as Bitcoin. It also follows a halving schedule, where the rate of new token issuance is cut in half approximately every four years, making it a potentially deflationary asset over time.

    Not financial advice. Do your own research.

    Pi Network (PI) Price Prediction: What Will PI Price Be in 2035?

    0

    For years, you’ve tapped a button on your phone, watching your Pi balance grow. But the biggest question remains: will that digital dust ever turn into gold? You’re not alone in wondering about the future value of a token with one of the largest communities in crypto, yet one that remains tantalizingly out of reach. This Pi Network (PI) price prediction will cut through the noise, analyzing the data we have today to project what the PI token could be worth over a decade from now, in 2035.

    TL;DR: Pi Price in 2035

    • What’s Trading Now? The current PI price reflects IOU tokens on a few exchanges, not the official, mineable Pi coin. The real value is unknown until the Open Mainnet launches.
    • Bearish Scenario ($0 – $1): If the Open Mainnet fails to launch or gain traction, or if regulatory issues arise, the PI token could struggle to gain any meaningful value, with IOUs potentially becoming worthless.
    • Base Scenario ($5 – $25): A successful mainnet launch with a functional ecosystem and moderate user adoption could see PI establish a stable value, becoming a useful token for transactions within its dedicated community.
    • Bullish Scenario ($50 – $150+): If Pi leverages its massive user base to create a thriving Web3 ecosystem with high utility and seamless integration, it could capture significant market share, driving its price to much higher levels.
    • Key Factor: The entire future valuation hinges on one event: the successful launch of the Open Mainnet and the subsequent utility and adoption of the Pi coin.

    What is Pi Network?

    Before we dive deep, let’s have a quick refresher. Pi Network is a novel cryptocurrency project aiming to make crypto mining accessible to everyday people through a mobile app. Users can “mine” PI coins on their phones with minimal battery drain. The project was launched in 2019 by a team of Stanford graduates.

    The network currently operates in an “Enclosed Mainnet” phase. This means that while the blockchain exists, it’s firewalled from the broader internet. Users who have passed KYC (Know Your Customer) can transfer PI within the ecosystem, but they cannot connect to other blockchains or trade it on mainstream exchanges. The tokens you see trading on some exchanges are “IOUs” (I Owe You), which are speculative instruments representing a claim to the real PI coin once the Open Mainnet goes live. The Pi Core Team has not authorized these listings.

    Current Market Conditions for Our Pi Network (PI) Price Prediction

    To understand where we might be going, we first need to know where we are. Let’s break down the current metrics for the PI IOU token.

    • Current Price: $0.225466
    • Market Cap: $1,874,946,219
    • 24h Volume: $31,041,343

    At a glance, a market cap over $1.8 billion seems impressive. However, context is key. The 24-hour trading volume is approximately $31 million. This gives us a volume-to-market-cap ratio of about 1.6%. In the crypto world, this is relatively low and can suggest that the asset is not being actively traded in high volumes compared to its supposed valuation. This might indicate more holding and speculation rather than active, utility-driven trading.

    The price action tells a mixed story. A slight dip over the last hour, day, and week (-0.2% to -1.7%) shows some short-term bearish sentiment or consolidation. However, the 30-day change is a healthy 11.07% gain, suggesting that over a slightly longer timeframe, interest and buying pressure have been building. This push-and-pull is common for assets driven heavily by news and future expectations rather than current utility.

    On-Chain & Narrative Drivers

    Since the official Pi coin is not on an open network, traditional on-chain analysis (like tracking whale wallets or transaction counts) is impossible for the public. Instead, we must focus on the narrative and community drivers, which are arguably Pi’s greatest strengths.

    The core narrative is powerful: “crypto for everyone.” With an estimated user base of over 55 million, Pi Network has one of the largest communities in the entire crypto space. This user base is a massive potential asset. If even a fraction of these users become active participants in a future Pi ecosystem (using dApps, spending PI on goods and services), the economic activity could be enormous. The primary driver for any future price appreciation will be the team’s ability to convert this massive community into an active, value-generating economy.

    2035 Pi Network (PI) Price Prediction Scenarios

    Predicting over a decade into the future is an exercise in structured speculation. The crypto landscape will be unrecognizable by 2035. However, we can create logical scenarios based on the project’s potential development paths.

    Bear Case: $0 – $1

    In a bearish scenario, the development stalls indefinitely, or the Open Mainnet launch is a technical failure. The project could fail to deliver a compelling use case, leaving millions of users with a token that has no utility. Regulatory crackdowns on mobile-based mining projects or internal team conflicts could also derail progress. In this future, the hype completely fades, the IOU tokens on exchanges become delisted or worthless, and the value of mined Pi never materializes.

    Base Case: $5 – $25

    Our base case assumes a successful Open Mainnet launch within the next 1-3 years. In this scenario, the Pi ecosystem develops steadily. A marketplace for goods and services emerges, and a handful of dApps find product-market fit. The token achieves its goal of becoming a peer-to-peer currency for its large but somewhat contained community. The price finds a stable ground reflecting its utility within this ecosystem. A price of $5 to $25 would give it a market capitalization comparable to established mid-cap crypto projects today, a reasonable target for a utility-focused coin with a large user base.

    Bull Case: $50 – $150+

    The bull case is where things get exciting. Here, the Open Mainnet launch is not just successful; it’s a phenomenon. The Pi platform’s ease of use attracts a wave of developers, and its massive user base becomes a magnet for Web3 social, gaming, and e-commerce applications. Pi could become the de facto micro-transaction layer for a significant portion of the mobile-first world. In this scenario, the network’s value grows exponentially with its activity. A valuation reaching into the hundreds of billions isn’t out of the question if it achieves this level of mainstream adoption, which would place the token’s price well above $50 and potentially much higher.

    Simple Valuation Back-of-the-Envelope

    Let’s try a simple, non-technical valuation to ground our 2035 predictions. This is a thought experiment, not a guarantee.

    Assumptions:

    1. Total Circulating Supply by 2035: Let’s estimate a circulating supply of 50 billion PI coins after years of mining rewards and vesting schedules.
    2. Active User Base: Assume by 2035, Pi has converted its user base into 100 million monthly active users (MAU).
    3. Value per User: This is the key variable. What is the economic value each user brings to the network?

    Calculation:

    • Bear Case: The network generates minimal value. Let’s say $10 per user annually.
      • *Total Network Value = 100M users * $10/user = $1 Billion*
      • Price per PI = $1 Billion / 50 Billion PI = $0.02
    • Base Case: The network becomes a solid niche ecosystem. Let’s assign a value of $250 per user (comparable to some social media platforms).
      • *Total Network Value = 100M users * $250/user = $25 Billion*
      • Price per PI = $25 Billion / 50 Billion PI = $0.50
      • (Note: This calculation is conservative and doesn’t account for market speculation, which could easily push the price into our $5-$25 range).
    • Bull Case: Pi becomes a major Web3 platform. Let’s assign a value of $2,500 per user (closer to a high-value e-commerce or financial platform user).
      • *Total Network Value = 100M users * $2,500/user = $250 Billion*
      • Price per PI = $250 Billion / 50 Billion PI = $5.00
      • (Again, this is a fundamental value. Speculative frenzy in a bull market could multiply this price significantly, bringing it into our $50-$150+ range).

    This simple model shows how heavily the final price depends on the actual economic activity the network can generate per user.

    Risks & What to Watch

    Investing in or even just mining Pi is not without risk. The primary risk is simple: execution risk. The project has been in development for over five years with no Open Mainnet. Further delays could erode community trust. Other risks include potential centralization concerns with the core team’s control and the ever-present threat of global regulatory changes.

    The most important event to watch is the announcement and successful launch of the Open Mainnet. This is the catalyst for everything. Pay attention to the Pi Core Team’s official announcements, the growth of apps on the Testnet, and the rate of user KYC completion.

    Conclusion

    The journey of Pi Network is a marathon, not a sprint. Its future is a blank canvas, holding both immense potential and significant risk. The IOU token currently trading offers a small glimpse into market sentiment, but the real story has yet to begin.

    For those who have been patiently mining, the next steps are to stay informed through official channels, complete your KYC when possible, and watch for the Open Mainnet launch. For investors, the current IOU market is highly speculative. The true test—and the real opportunity—will only come when the network opens its doors to the world.

    FAQ

    1. Is Pi a real cryptocurrency?
    Yes, Pi has its own blockchain. However, it is currently in an “Enclosed Mainnet” phase, which means it is not yet connected to the public internet or other blockchains. The value is theoretical until the Open Mainnet launches.

    2. When will the Pi Open Mainnet launch?
    The Pi Core Team has not given a definitive date. They have stated that the launch depends on the progress of mass KYC, ecosystem development, and favorable global conditions.

    3. Can I sell the Pi I mined on my phone?
    No. You cannot withdraw or sell the Pi you have mined in the app. Any platform or person offering to buy your mined Pi is likely a scam. The only “PI” being traded is an IOU token on a few unauthorized exchanges.

    4. Is the PI IOU token the same as the real Pi coin?
    No. The IOU is a speculative derivative, a placeholder. Its price does not guarantee the price of the real Pi coin after the Open Mainnet launch. The value could be higher, lower, or completely different.

    Not financial advice. Do your own research.
    What Is Internet Computer (ICP) Price Today? ICP Technical Analysis (November, 2025)

    0

    Feeling the whiplash from ICP‘s recent rollercoaster ride? You’re not alone. One minute it’s soaring, the next it’s taking a sharp dive, leaving many traders wondering if this is a golden opportunity or a dangerous bull trap. It’s easy to get caught up in the emotion of these massive price swings. Let’s cut through the noise, look at what the charts and data are actually telling us, and craft a clear-headed strategy. This is the deep-dive Internet Computer (ICP) Technical Analysis you need to navigate the weeks ahead.

    TL;DR: Key Takeaways

    • High Volatility: ICP is experiencing extreme volatility, with a massive 77.6% gain over the last 30 days but a sharp 22.1% correction in the past week.
    • Battleground Price: The current price of $5.44 is a critical level. Bulls are trying to defend it after a recent pullback, while bears see it as a potential breakdown point. The 11.2% gain in the last 24 hours shows buyers are stepping in.
    • Key Levels to Watch: A bullish breakout could target the $7.00 – $8.50 range. A bearish scenario could see ICP retesting support near $4.50 or even lower.
    • Narrative is Strong: The underlying story of a “World Computer” and its role in decentralized AI (DeAI) and on-chain services remains a powerful driver for long-term interest.
    • Risk Management is Crucial: This is not a set-and-forget asset right now. The high volume and wild price swings demand a clear plan for entry, exit, and stop-loss levels.

    What is Internet Computer (ICP)? A Quick Refresher

    Before we dive into the numbers, let’s quickly recap what Internet Computer is. Developed by the DFINITY Foundation, ICP aims to be a true “World Computer.” Instead of just processing transactions like many blockchains, its goal is to host websites, enterprise systems, and internet services directly on the blockchain. This allows for decentralized applications that run at web speed with significantly reduced infrastructure costs.

    Think of it as a decentralized alternative to the traditional cloud services provided by giants like Amazon Web Services (AWS) or Google Cloud. By allowing developers to build directly on-chain, it opens up possibilities for fully decentralized social media, AI models, and web experiences that aren’t controlled by a single corporation. This ambitious vision is a key part of its long-term investment thesis.

    Current Market Conditions

    Let’s break down the live metrics to understand the current sentiment. At a price of $5.44, ICP has a market capitalization of nearly $3 billion. This places it firmly among the top-tier crypto projects, but what’s more telling is the flow of money. The 24-hour trading volume is a staggering $585 million, which is roughly 20% of its entire market cap. This indicates an incredibly high level of interest and activity; traders are actively buying and selling, not just holding.

    The price action tells a story of conflict. A 77.6% surge in 30 days is phenomenal, suggesting a powerful new wave of buying pressure and positive sentiment. However, the 22.1% drop over the last 7 days signals that early investors took significant profits off the table as the price climbed. The most recent data, an 11.2% pump in the last 24 hours, shows that buyers saw this dip as a discount and are stepping back in. This push-and-pull creates the volatile environment we’re seeing today.

    On-Chain and Narrative Drivers

    While we don’t have a live feed of on-chain data here, we can reason about the forces likely driving this activity. The powerful 30-day rally wasn’t random; it was likely fueled by a combination of a market-wide liquidity shift into altcoins and a growing narrative around ICP’s technology. Topics like DeAI and the “blockchain singularity” have gained traction, and ICP is often at the center of these conversations.

    The recent price action is also characteristic of a “short squeeze,” where traders who were betting against ICP are forced to buy back their positions as the price rises, accelerating the upward momentum. The subsequent 7-day drop is a natural cooling-off period and profit-taking cycle. For long-term health, it’s crucial to watch if the underlying fundamentals, like developer activity and the number of dapps (or “canisters”) being deployed on the network, continue to grow steadily through these price fluctuations.

    Scenarios for the Coming Weeks: An Internet Computer (ICP) Technical Analysis

    Here’s a breakdown of potential scenarios for November 2025 based on the current technical picture. Remember, these are not certainties, but guideposts to help you form a strategy.

    The Bearish Scenario: Correction Continues

    If the recent 24-hour bounce fails to hold, the bears could regain control. The 22% weekly drop is a significant rejection from a higher price point (likely around the $7 mark). A failure to reclaim the $6.00 level could signal weakness, leading to a retest of lower support zones.

    • First Support: The first major support level to watch would be around $4.50. This area likely represents a key psychological level and a potential retracement zone from the recent run-up.
    • Second Support: A break below that could send ICP tumbling toward the $3.80 – $4.00 range, which would erase a larger portion of the monthly gains and signal a more prolonged consolidation period.

    The Base Scenario: Sideways Consolidation

    The most likely scenario in the short term is continued volatility within a defined range. The bulls and bears are currently in a stalemate. The 24-hour buying pressure is meeting the 7-day selling pressure, which often leads to sideways price action as the market decides its next major move.

    • The Range: Look for ICP to trade between $5.00 and $6.50 for the next couple of weeks.
    • What to Watch: During this period, declining volume would suggest consolidation, while a spike in volume near the top or bottom of the range could signal an imminent breakout or breakdown.

    The Bullish Scenario: The Uptrend Resumes

    If the 11.2% bounce is the start of a new leg up, the bulls will need to decisively break through recent resistance. This scenario is fueled by the strong 30-day momentum and the idea that the 7-day dip was just a healthy cooldown.

    • First Target: The immediate target for bulls is to reclaim the recent high, likely in the $7.00 – $7.20 area. A strong break and hold above this level would invalidate the bearish pressure.
    • Second Target: If momentum continues, the next logical resistance zone would be around $8.50, and a move driven by major market hype could even push ICP toward the psychological $10.00 mark.

    A Simple Valuation: Back-of-the-Envelope Math

    Valuation in crypto is notoriously difficult, but we can use market capitalization for a rough estimate. With a current market cap of ~$2.95 billion, ICP is a significant player. But how high could it go?

    Let’s make an assumption: if ICP’s “World Computer” narrative truly takes hold and it begins to be valued similarly to other top-15 Layer 1 blockchain projects, its market cap could realistically grow. For example, a project in the top 15 might have a market cap of $10 billion during a healthy market.

    • Assumption: ICP reaches a $10 billion market cap.
    • Calculation: ($10,000,000,000 / $2,947,915,775) * $5.44 = $18.45 per ICP.

    This is not a price prediction, but an exercise to frame the potential upside if the project successfully executes its vision and captures more market share. This calculation assumes a relatively stable circulating supply.

    Risks and What to Watch

    Investing in ICP is not without its risks. The project’s tokenomics have been a subject of debate in the past, and it faces stiff competition from both established Layer 1s and centralized cloud providers. The extreme volatility is also a major risk for unprepared traders.

    Here’s what to keep an eye on:

    1. Bitcoin’s Price Action: As with most altcoins, ICP’s price is heavily correlated with Bitcoin. A major downturn in BTC would almost certainly pull ICP down with it, regardless of its own fundamentals.
    2. Trading Volume: Watch to see if volume stays high. Sustained high volume on green days is bullish, while high volume on red days is bearish. Dwindling volume suggests interest is waning.
    3. Developer Activity: Track announcements from the DFINITY Foundation and look for metrics on developer adoption. Real-world usage is the ultimate long-term driver of value.

    Conclusion: A Pivotal Moment for ICP

    Internet Computer is at a fascinating crossroads. The technology is ambitious, the narrative is powerful, and the market is clearly paying attention. The recent price action, with its massive gains and sharp corrections, signals that ICP is a high-stakes asset that commands respect. For traders, this volatility is an opportunity, but it requires discipline. For investors, the focus remains on whether the project can deliver on its promise of a decentralized internet.

    Your next step should be to identify the key price levels outlined in the scenarios above. Set alerts for those levels so you can react to the market instead of being caught by surprise. Decide whether you are trading the volatility or investing in the long-term vision, and adjust your strategy accordingly.

    FAQ

    Is ICP a good investment in November 2025?
    ICP is a high-risk, high-reward asset. Its value depends on its ability to achieve its ambitious goal of becoming a “World Computer.” It could be a good investment for those with a long-term horizon who believe in the technology, but it’s also highly volatile and not suitable for everyone.

    What is a realistic price prediction for ICP?
    Price predictions are speculative. Based on our technical analysis, a bullish continuation could target the $8.50-$10.00 range in the coming weeks or months. However, a bearish breakdown could see it fall back to the $4.50 support level.

    Why is ICP so volatile?
    ICP’s volatility comes from several factors: a contentious launch history, an ambitious and polarizing vision, and a dedicated community of both strong believers and skeptics. This creates intense battles between buyers and sellers, resulting in large price swings.

    Where can I buy Internet Computer (ICP)?
    ICP is available on most major cryptocurrency exchanges, including Coinbase, Binance, KuCoin, and Kraken.

    Not financial advice. Do your own research.

    Saylor Moon (SAYLOR) Price Prediction: What Will SAYLOR Price Be in 2036?

    0

    Ever felt that gut-wrenching mix of FOMO and terror as you watch a new token rocket up by 350% in a single day? You see the green candles, you hear the buzz on social media, and you ask yourself: “Am I too late, or is this just the beginning?” That’s the exact feeling swirling around Saylor Moon (SAYLOR) right now. This article provides a no-hype, clear-eyed Saylor Moon (SAYLOR) Price Prediction, looking deep into the future to see what 2036 could hold for this explosive new memecoin.

    TL;DR: Saylor Moon (SAYLOR) in 2036

    • Extreme Volatility: SAYLOR is a new memecoin exhibiting classic signs of a parabolic launch, with a 350% gain in 24 hours and a 27% correction in the last hour. This is a high-risk asset.
    • Narrative is Key: Its future price depends almost entirely on its ability to maintain cultural relevance. The “Michael Saylor x Sailor Moon” meme is its primary asset.
    • Bear Case (<$0.0001): The most likely scenario for most memecoins is a fade into obscurity as hype dies down and the community moves on.
    • Base Case ($0.05 – $0.25): If SAYLOR survives and maintains a niche community, it could see modest growth in line with future crypto market cycles.
    • Bull Case ($1.00 – $5.00+): In a best-case scenario where it achieves widespread adoption and becomes a top-tier memecoin, it could reach a multi-billion dollar market cap, resulting in a price over $1.

    What is Saylor Moon (SAYLOR)?

    Saylor Moon (SAYLOR) is a memecoin that cleverly merges two distinct but powerful cultural icons: Michael Saylor, the well-known Bitcoin maximalist and former CEO of MicroStrategy, and Sailor Moon, the legendary Japanese anime character. Like most memecoins, SAYLOR doesn’t claim to solve complex blockchain problems or offer groundbreaking utility. Its value is derived from its humor, its relatability within the crypto community, and its potential to go viral.

    The project’s primary goal is to capture the attention of the market through a strong, shareable narrative. Investors are essentially betting on the power of the meme. Can the combined imagery of a Bitcoin titan and a beloved anime hero create a community strong enough to sustain interest and drive value over the long term? That’s the multi-million dollar question.

    Current Market Conditions: A Picture of Extreme Volatility

    Let’s break down the live metrics to understand what’s happening right now. The numbers tell a story of a classic memecoin launch: explosive, chaotic, and incredibly risky.

    With a current price of $0.0456 and a market cap of over $47 million, SAYLOR has already achieved a significant valuation for a new project. The 24-hour trading volume of nearly $7.5 million is robust, suggesting high interest and liquidity at the moment. However, the price action is the real headline. A staggering 350% pump in the last 24 hours has likely created immense wealth for early adopters, but the sharp 27% drop in the past hour is a stark reminder of the “what goes up, must come down” principle. This kind of volatility suggests that price discovery is in full swing, with traders taking profits and new buyers jumping in, leading to massive price swings. The lack of 7-day or 30-day data confirms this is a brand-new token, making any analysis inherently speculative.

    On-Chain & Narrative Drivers

    For a coin like SAYLOR, the narrative is more important than any on-chain metric, at least in the early days. The name is a masterstroke of memetic engineering, appealing to both crypto natives who follow Michael Saylor and a wider audience familiar with the global anime phenomenon. This dual appeal gives it a broader potential reach than many niche memecoins.

    Since detailed on-chain data for such a new token is often unreliable, we must reason from first principles. The key drivers to watch are:

    • Community Engagement: Is the community on platforms like X (formerly Twitter) and Telegram growing and active? A strong, vibrant community is the lifeblood of any memecoin.
    • Narrative Strength: Does the “Saylor Moon” meme have staying power? Its ability to generate fresh content and remain relevant in the fast-paced world of social media is crucial.
    • Holder Distribution: As data becomes available, it will be vital to see if ownership is concentrated in a few wallets (a major red flag) or is becoming more widely distributed among the community.

    Saylor Moon (SAYLOR) Price Prediction for 2036

    Looking over a decade into the future for any asset is difficult; for a memecoin, it’s almost a philosophical exercise. The price of SAYLOR in 2036 won’t be determined by charts, but by its ability to survive. Our professional-level technical analysis, therefore, focuses on market cap potential and survival probability.

    Bear Case: The Dust Settles ($0.0001)

    The most probable scenario for any new memecoin is that it fails to maintain momentum. The crypto space is littered with the ghosts of thousands of tokens that had a moment in the sun before fading away. In this scenario, the initial hype surrounding SAYLOR dissipates, the trading volume dries up, and the community moves on to the next shiny object. By 2036, it would be an irrelevant, illiquid token with a price approaching zero.

    Base Case: Niche Survivor ($0.05 – $0.25)

    In our base case, SAYLOR proves it has more staying power than the average memecoin. It survives the initial hype cycle and manages to cultivate a dedicated, core community. It weathers multiple bear markets and becomes a recognized, albeit small, part of the memecoin landscape. Its market cap in future bull cycles could stabilize in the $100 million to $500 million range. Assuming a similar circulating supply to today, this would place its long-term price in the $0.05 to $0.25 range, orbiting its launch price but with the potential for significant swings during bull runs.

    Bull Case: To the Moon ($1.00 – $5.00+)

    This is the lottery ticket scenario that every memecoin investor dreams of. In the bull case, the Saylor Moon narrative captures the zeitgeist. It becomes a cultural icon within crypto, mentioned alongside giants like Dogecoin and Shiba Inu. Perhaps it gains an unexpected endorsement or develops a unique community-driven utility. To reach a price of $1.00, SAYLOR would need a market cap of over $1 billion. To hit $5.00, it would need to exceed a $5 billion market cap. This is an immense challenge, but one that a select few memecoins have achieved in the past.

    Simple Valuation Back-of-the-Envelope

    Let’s ground these scenarios with some simple math. First, we need to estimate the circulating supply.

    • Calculation: Market Cap ($47,253,932) / Price ($0.04560294) ≈ 1.036 billion SAYLOR tokens.

    Now, let’s apply our scenario-based market caps to this supply:

    • Bear: A $1M market cap would result in a price of $0.00096.
    • Base: A $250M market cap would result in a price of ~$0.24.
    • Bull: A $2B market cap would result in a price of ~$1.93. A $5B market cap would result in a price of ~$4.82.

    These calculations show the direct relationship between market capitalization (driven by hype and adoption) and the potential future price.

    Risks & What to Watch

    Investing in SAYLOR is an endeavor fraught with risk. The primary danger is narrative collapse, where the meme simply becomes old news. Another major risk is smart contract vulnerability or the potential for a “rug pull” where developers abandon the project and drain its liquidity, which is always a concern with new, unaudited tokens.

    To mitigate these risks, here is what you should be watching closely:

    • Social Media Velocity: Track mentions, follower counts, and engagement on X and Telegram. Is the buzz growing or fading?
    • Exchange Listings: Listings on larger, more reputable centralized exchanges can bring a flood of new liquidity and legitimacy.
    • Project Communication: Are the developers (if they are known) communicating transparently with the community? Are there any updates or a roadmap?

    Conclusion

    The Saylor Moon (SAYLOR) Price Prediction for 2036 is a study in possibilities, ranging from near-zero to life-changing returns. Currently, SAYLOR is a pure gamble on a clever and timely meme. Its recent 350% surge demonstrates its explosive potential, but its immediate correction highlights the extreme risk involved.

    For investors considering SAYLOR, the path forward is not to look for technical indicators but to analyze the strength and longevity of its cultural narrative. Does this meme have what it takes to survive for more than a decade in the fastest-moving market on Earth? If you believe it does, it could be an interesting, albeit tiny, part of a diversified, high-risk portfolio. If not, it’s best to watch this spectacle from the sidelines.

    FAQ

    Is SAYLOR a good investment?
    SAYLOR is an extremely high-risk, speculative asset. It should not be considered a traditional investment. Its potential for high returns is matched by its potential to go to zero. Only invest what you are completely willing to lose.

    Will SAYLOR reach $1?
    Reaching $1 is possible in a long-term bull scenario, but it is not guaranteed. It would require SAYLOR to achieve a market capitalization of over $1 billion and become one of the most successful memecoins in the market.

    What primarily drives the price of SAYLOR?
    The price is driven almost entirely by social media hype, narrative strength, community engagement, and overall sentiment in the broader crypto market. It is not based on fundamentals or technical utility.

    How can I research a new memecoin like SAYLOR?
    Start by looking for the token’s contract address on a blockchain explorer like Etherscan or Solscan. Check for security audits, look at the holder distribution to spot potential whale dominance, and spend time in the official community channels (like Telegram or Discord) to gauge sentiment and activity.

    Not financial advice. Do your own research.

    I Didn’t Believe in Crypto Technical Analysis, Until I Started Using AI to Do It for Me — Here’s How It Works

    0

    I was always skeptical about technical analysis. To me, predicting human behavior by staring at charts and drawing lines sounded like magical thinking. 

    Every time I tried to learn, I ended up with ten different interpretations for the same chart. And somehow, every “expert” I followed was certain of a different thing.

    Personally, I was convinced technical analysis was useless. Inevitably, I’d make trades based purely on hype, Twitter chatter, or whichever token had a funny meme going around.

    But that didn’t work either.

    However, traders who understand technical analysis seem absolutely convinced it’s the best method to trade crypto. That said, how can it be so hard to learn, understand, and ultimately implement?

    So, I decided to develop an AI tool that makes technical analysis faster, easier, and most importantly, more understandable.

    Here’s how Pump Parade’s AI technical analysis tool works, how you can use it, what it does (and doesn’t do) and a special, incredibly valuable use case you can access with it.

    Let’s dive in.

    How the Technical Analysis Tool Works

    Once I had the initial framework working, I started to see patterns I hadn’t noticed before. Not just in tokens, but in how technical indicators told a story together.

    Individually, each one can be noisy. But when layered correctly, they reveal trends and momentum shifts that are hard to spot by eye.

    Here’s how the AI engine processes each indicator to produce an analysis:

    • RSI (Relative Strength Index): To measure momentum and identify overbought or oversold conditions.
    • MACD (Moving Average Convergence Divergence): To spot trend reversals and confirm momentum shifts.
    • 20-Day Moving Average: To smooth short-term noise and see the underlying trend.
    • Volatility: To understand how wild price swings were and quantify risk.
    • Support and Resistance: To identify realistic price floors and ceilings.
    • Linear Regression Slope: To track trend strength and momentum over time.

    Click here and start analyzing over 1,000 tokens with Pump Parade’s AI Technical Analysis tool!

    Why This Changed Everything

    Before building this engine, my approach to crypto trading was noisy, emotional, and reactive. 

    I would chase pumps, fear dumps, and convince myself that something felt right because of hype. It was purely hope-based trading without any logical foundation whatsoever. 

    After all, I didn’t really understand technical analysis, so it was my only choice.

    With Pump Parade’s AI engine, I could step back and say:

    • Is this token overbought or oversold? (RSI)
    • Is the trend genuinely gaining or losing momentum? (Slope + MACD)
    • Are the recent highs and lows meaningful? (Support & Resistance)
    • How risky is this move based on historical swings? (Volatility)

    Which ultimately led to the question that actually mattered:

    Should I buy this token now?

    The insight wasn’t in predicting the future, it was in understanding the present, seeing the market for what it actually was, not what I wanted it to be. 

    And that clarity alone is invaluable.

    Eager to get started? Try Pump Parade’s AI Technical Analysis tool on Bitcoin, Ethereum, Solana and more than 1,000 tokens!

    Lessons Learned from Building It

    Working on the crypto AI engine taught me a few lessons I hadn’t expected. Lessons that helped me understand the true value of data and leave behind my skepticism for technical analysis:

    1. Indicators are not absolute truths. Each tells part of the story, and you have to see the pattern in context.
    2. Consistency beats prediction. Early on, I tried to optimize for “which token would pump next.” That mindset led to overfitting. The engine works best when it’s about understanding the market state, not guessing the future.
    3. Explainability is key. I had to make every calculation transparent. Users need to see the numbers behind the charts. Otherwise, it feels like magic, and people stop trusting it.
    4. Automation exposes nuances. Running hundreds of tokens through the same system revealed patterns I would never have noticed manually. For example, volatility spikes often preceded reversals even when RSI didn’t flag anything.

    Applying Technical Analysis Daily

    This is the part you’re probably here for: how exactly do you use Pump Parade’s AI technical analysis for crypto trading? 

    Don’t worry, it’s extremely easy, but I felt I had to explain how it works so you understand what you’re seeing when you use it. Now that we’ve covered that, let’s jump in.

    Step 1: Select Your Token 

    Start by choosing the token you want to analyze. Pump Parade supports over 1,000 tokens, each of them packed with data pulled from the blockchain.

    Once selected, the system automatically fetches historical price and volume data. Behind the scenes, it calculates all the core indicators:

    • RSI (Relative Strength Index) for momentum
    • 20-day Moving Average (MA) for trend smoothing
    • MACD (Moving Average Convergence Divergence) for trend confirmation
    • Linear Regression Slope for trend strength
    • Volatility to understand risk
    • Support and Resistance Levels for realistic price boundaries

    Step 2: Understand the Dashboard Layout

    Pump Parade organizes technical indicators in a way that’s easy to digest at a glance:

    • Trend Metrics: Shows the current direction, slope, and momentum.
    • RSI: Highlighted with color coding: oversold in green (-30), overbought (+70) in red.
    • Moving Averages: Plotted over the price chart, showing trend smoothing.
    • MACD and Signal Lines: Histogram indicates momentum strength.
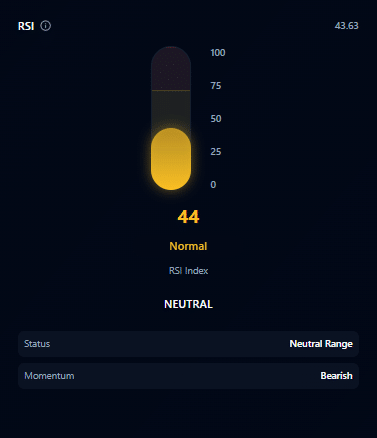
    • Volatility Indicator: Visualized as a shading layer or chart overlay.
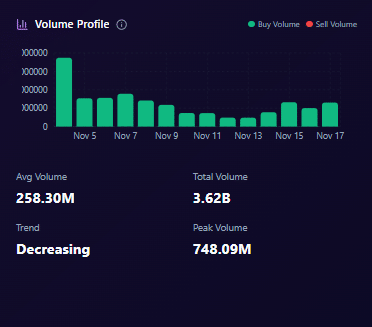
    • Support & Resistance Bands: Highlight likely breakout or bounce zones.

    All these are presented in a visually engaging, clear way, with tool tips that explain each chart in case you don’t fully understand what you’re looking at.

    Spending a minute reviewing the dashboard before any decision allows you to spot patterns quickly, without diving into raw numbers.

    Step 3: Make Data-Driven Decisions

    Once all indicators are visible and aligned, I make decisions based on context, not gut feeling:

    • Bullish trend + low RSI → strong potential buy
    • High volatility near resistance → cautious approach

    Pump Parade’s dashboard makes these assessments intuitive. The visualizations and overlays reduce guesswork, letting you focus on interpreting signals instead of hunting for data.

    Step 4: Iterate and Observe

    Technical analysis isn’t about perfection; it’s about consistent observation. 

    If you use Pump Parade daily, reviewing indicators, noting trends, and observing how price interacts with signals, over time, you’ll notice patterns that aren’t obvious from price alone.

    • RSI extremes rarely cause immediate reversals without trend confirmation
    • Support and resistance levels can act as reliable guides for stop-loss placement

    Use the tool consistently and you will learn to read the market in a structured, repeatable way, rather than guessing or reacting emotionally.

    Start making better crypto decisions. Visit Pump Parade and run free, AI-powered technical analyses on more than 1,000 cryptocurrencies.

    Tips for Maximizing Pump Parade’s Technical Analysis Tool

    Using the technical analysis tool effectively isn’t just about knowing what each indicator does. The real power comes from how you combine and interpret the signals over time. 

    Technical indicators are tools, not guarantees, and their insights are strongest when viewed together in context. A single metric can be misleading, but a combination reveals trends, momentum, and risk in a way that is actionable and understandable.

    Here are some key strategies I’ve learned while building and using the engine:

    1. Focus on combinations: Don’t make decisions from a single indicator. Look for agreement across RSI, slope, MA, and MACD.
    2. Always consider volatility: High-risk moves need stricter entry/exit discipline.
    3. Use support/resistance dynamically: Treat them as zones, not exact numbers.
    4. Watch trends over time: One snapshot is rarely enough; observe how slope and MA evolve.
    5. Stay consistent: Daily review builds intuition and reinforces patterns without emotion. Come back every day to adjust your strategy and make better, informed decisions.

    These practices turn Pump Parade’s technical analysis from a set of numbers into a framework for understanding the market. Integrating these strategies into your daily workflow will help you see patterns more clearly, spotting potential opportunities earlier, and making decisions with confidence rather than guesswork. 

    Over time, this approach transforms technical analysis from a theoretical exercise into a practical, disciplined method for navigating crypto markets.

    Pump Parade’s AI Technical Analysis tool is free to use and open for everyone. Click here to get started.

    What to Look Out for When Using AI Technical Analysis

    Technical analysis is not just about running calculations. Crypto moves fast, trends are messy, and indicators can mislead if taken at face value. 

    Over time, working with the technical analysis engine taught me lessons that no chart or textbook could. These are the insights I wish I had known from day one, and the ones I would pass on to anyone using technical analysis in crypto:

    • Never rely on a single indicator: MACD alone doesn’t guarantee trend reversal. RSI alone doesn’t mean buy. Use the combination.
    • Volatility changes everything: A high-volatility token with bullish indicators might still swing wildly. Risk assessment is as important as trend assessment.
    • Trends can persist longer than expected: Overbought RSI doesn’t always mean immediate correction. Look at slopes and moving averages to gauge trend strength.
    • Support and resistance are contextual: A level that held for a few days might break under sudden volume. Adaptive windows work better than static calculations.

    The good news is that, instead of relying on memory or gut feeling, Pump Parade’s system flags them automatically. 

    Over time, it becomes a teacher as much as a tool.

    Click here and start analyzing over 1,000 tokens with Pump Parade’s AI Technical Analysis tool!

    The Daily Impact

    After a few months of using the engine daily, the change was profound. 

    Decisions became calmer, more deliberate. I stopped chasing hype. I could explain why I entered or avoided a position. The metrics gave me confidence without overconfidence:

    • I knew when a token was genuinely oversold instead of just “cheap.”
    • I could anticipate where the price might hit resistance or support.
    • I had quantitative insight into trend momentum and risk before making moves.

    It also revealed the nuances that casual traders often miss. For example: a token might look bullish on price alone, but MACD divergence or flattening MA slopes suggested momentum was weakening. Those subtle signals made the difference between a small win and a loss.

    Some Final Tips Before You Start With Pump Parade’s Technical Analysis

    If you’re thinking about applying technical analysis in crypto, here’s what I’d suggest based on building and using this engine:

    1. Combine indicators thoughtfully: Look at RSI, MACD, moving averages, slope, and volatility together. Treat each as a piece of a bigger picture.
    2. Use context, not absolutes: Indicators are guides, not guarantees. Overbought doesn’t always mean sell; oversold doesn’t always mean buy.
    3. Track trend strength, not just direction: The slope of moving averages or linear regression is more informative than a simple up/down signal.
    4. Integrate risk metrics: Volatility should always influence your decisions. High-risk tokens need stricter discipline.
    5. Visualize patterns: Numbers are helpful, but charts make signals immediately actionable.
    6. Stay consistent: Build a repeatable process. That’s how you remove emotion from trading.

    Closing Thoughts

    I went from distrusting technical analysis to relying on it as the backbone of my trading workflow. Not because it predicts the future, but because it reveals the present in a structured, interpretable way.

    Pump Parade’s crypto AI engine taught me that the value of technical analysis isn’t in mystical patterns or lucky guesses. It’s in consistency, clarity, and context. 

    Once you can see the indicators working together reliably, the market stops feeling random and starts making sense.

    And that’s the point: technical analysis doesn’t replace judgment. It sharpens it. It doesn’t promise wins. It ensures you’re aware.

    For anyone looking to approach crypto with more clarity, the lesson is simple: measure, visualize, contextualize, and let the data guide your decisions, not your gut.