More
    Home Blog Page 56

    What Is Cosmos Hub (ATOM) Price Today? ATOM Technical Analysis (October, 2025)

    0

    Stuck wondering if ATOM‘s quiet price action is the calm before the storm or just… calm? You’re not alone. The “internet of blockchains” has always been a titan of technology, but its token price has left many investors scratching their heads. Let’s break down the noise, look at the charts, and figure out what’s really happening with a clear-eyed Cosmos Hub (ATOM) Technical Analysis for October 2025.

    TL;DR: The State of ATOM

    • Current Price: ATOM is trading at $4.1, showing signs of stagnation after a month of steady decline.
    • Key Level to Watch: The price is hovering just above a critical support zone around $4.00. A break below this could signal further downside.
    • Short-Term Outlook: The market is in a holding pattern. Expect continued sideways movement between $4.00 and $4.50 unless a major market catalyst appears.
    • Bear vs. Bull: Bears are in control on the longer timeframes (down 6.4% over 30 days), but bulls are defending the $4.00 support level fiercely. A break on either side will likely dictate the next major move.

    What is Cosmos Hub (ATOM)? A Quick Refresher

    Before diving into the charts, let’s quickly recap what we’re looking at. The Cosmos Hub is the central blockchain in the vast Cosmos ecosystem, a network of independent, interoperable blockchains. Think of it as a central port city in a world of sovereign nations, facilitating communication and trade between them via the Inter-Blockchain Communication (IBC) protocol.

    The ATOM token is the native asset of the Cosmos Hub. Its primary roles are staking (to secure the network and earn rewards), governance (to vote on the future of the Hub), and paying for transaction fees. Through a feature called Interchain Security, other blockchains can also “rent” security from the Cosmos Hub, creating another layer of utility for the ATOM token.

    Current Market Conditions: A Picture of Indecision

    As of October 2025, ATOM’s metrics paint a clear picture of a market in limbo. At a price of $4.1 and a market cap of just under $2 billion, it’s a significant player but is feeling the pressure of a broader market cooldown.

    The price action tells the story: while the last 24 hours have been flat (+0.03%), the weekly (-1.94%) and monthly (-6.43%) charts show a consistent, grinding downtrend. This isn’t a panic sell-off; it’s a slow bleed, which often suggests investor apathy or a lack of strong positive news. However, the 24-hour trading volume of approximately $246 million is relatively healthy compared to its market cap. This indicates that while the price is stagnant, there is still significant interest from traders, which could fuel a sharp move once a direction is chosen.

    On-Chain and Narrative Drivers

    While we can’t see the full on-chain picture without deep data tools, we can infer some things. The persistent defense of the $4.00 level suggests that long-term holders and stakers may be accumulating here, viewing it as a value zone. High staking ratios, a hallmark of the Cosmos ecosystem, can reduce the available liquid supply, but it hasn’t been enough to spark a rally.

    The narrative for Cosmos remains powerful but has cooled off. The “app-chain” thesis, where projects launch their own sovereign blockchains, is a core strength of the ecosystem. However, the key question for ATOM holders is how much of that value accrues back to the ATOM token itself. The success of Interchain Security is the most direct answer to this, and investors are watching closely to see how many new, high-value chains choose to lease security from the Hub. Until a major new project drives demand, the narrative remains a slow burn.

    Cosmos Hub (ATOM) Technical Analysis: Scenarios for October 2025

    The price chart for ATOM is at a critical juncture. Let’s break down the potential paths forward based on key technical levels.

    Bearish Scenario: A Breakdown Below Support

    If sellers overwhelm buyers and push the price decisively below the $4.00 support level, the path of least resistance is downward. The lack of significant support between here and the next psychological zone could lead to a swift move.

    • Target: A sustained break of $4.00 could open the door to a test of the $3.50 – $3.60 range, a plausible area of prior consolidation.
    • Rationale: This would confirm that the monthly downtrend is accelerating. It would likely be triggered by broader market weakness (e.g., a drop in Bitcoin) or a continued lack of positive catalysts for the Cosmos ecosystem, leading to capitulation from traders who were hoping for a bounce at $4.00.

    Base Case Scenario: The Chop Continues

    The most likely scenario in the immediate short term is continued consolidation. The market is showing clear signs of indecision, and without a major catalyst, assets often drift sideways.

    • Range: Expect ATOM to remain range-bound between the $4.00 support and resistance around $4.50.
    • Rationale: Buyers are clearly defending the $4.00 mark, but the selling pressure on every small rally (as seen in the 7-day and 30-day performance) is preventing any real momentum. This “chop” will likely continue until either buyers or sellers are exhausted, or an external market force pushes it out of the range.

    Bullish Scenario: Reclaiming Key Resistance

    For bulls to regain control, they need to do more than just defend support. They need to break through established resistance levels with conviction.

    • Target: A strong break and hold above $4.50 would be the first bullish sign, opening the door to a test of the more significant resistance level at $5.20.
    • Rationale: This would signal a shift in market structure. It could be sparked by a positive ecosystem announcement, a broader crypto market rally, or a squeeze on short positions. The healthy trading volume suggests that if sentiment turns positive, there is enough liquidity to fuel a quick and powerful move upward.

    A Simple Valuation Perspective

    Valuing a layer-0 protocol like Cosmos Hub is notoriously difficult. Unlike a company, it has no revenue or earnings. Instead, we can think about it in a couple of ways.

    First is a comparative analysis. With a market cap of ~$1.9 billion, how does it stack up against competitors like Polkadot (DOT) or other interoperability-focused projects? This comparison depends heavily on which ecosystem you believe will capture the most developer and user activity in the long run.

    Second, we can think about the Total Secured Value. The ATOM token’s primary job is to secure the economic bandwidth of the Hub and all the consumer chains that use it for Interchain Security. As more value (in the form of dApps and transactions) flows through the Cosmos ecosystem and is secured by ATOM stakers, the intrinsic value of the ATOM token should theoretically increase. The assumption here is that the Hub successfully positions itself as the security backbone for a thriving internet of blockchains.

    Risks and What to Watch

    Investing in ATOM is not without its risks. The primary challenge has always been value accrual—how does the vast activity in the Cosmos ecosystem translate into a higher price for the ATOM token? While Interchain Security aims to solve this, its widespread adoption is not yet guaranteed.

    Competition is also fierce. Other platforms are tackling interoperability, and the modular blockchain thesis is being pursued by many. Keep an eye on the following:

    • Key Levels: The $4.00 support and $4.50 resistance are the most important levels to watch right now.
    • Ecosystem News: Pay attention to announcements about new, high-profile chains adopting Interchain Security.
    • Broader Market: ATOM’s price is still heavily correlated with Bitcoin and the overall crypto market sentiment.

    Conclusion: At a Crossroads

    Cosmos Hub (ATOM) is currently at a technical and narrative crossroads. The technology is undeniably powerful, but the token’s price reflects a market that is waiting for a clear catalyst. The charts show a tense standoff between determined buyers at the $4.00 support level and persistent overhead selling pressure.

    For traders, the path forward is to watch for a confirmed break of the current range. For long-term investors, the decision hinges on your belief in the “internet of blockchains” vision and the Hub’s ability to become its indispensable security provider. The pieces are there, but now it’s a matter of execution.

    Frequently Asked Questions

    What is the main use case for the ATOM token?
    The ATOM token is used for staking to secure the Cosmos Hub network (and chains using Interchain Security), for voting on governance proposals that shape the Hub’s future, and for paying transaction fees.

    Is ATOM a good investment in October 2025?
    Whether ATOM is a good investment depends entirely on your personal financial goals, risk tolerance, and time horizon. It holds significant long-term potential if its vision is realized, but it also faces strong competition and market risks.

    What could make the ATOM price go up?
    A price increase could be driven by several factors, including a broad crypto market bull run, the successful adoption of Interchain Security by major new blockchains, innovative tokenomic changes that improve value accrual, or a renewed narrative around the app-chain thesis.

    Where can I buy ATOM?
    ATOM is a major cryptocurrency and is available on most leading cryptocurrency exchanges, such as Coinbase, Binance, Kraken, and KuCoin.

    Not financial advice. Do your own research.

    Pump.fun (PUMP) Price Prediction: What Will PUMP Price Be in 2027?

    0

    Ever feel that pit in your stomach when a token you were watching suddenly skyrockets, leaving you wondering what could have been? That’s the exact mix of excitement and anxiety many traders feel looking at Pump.fun’s native token, PUMP. It’s a key player in the wild world of memecoins, acting as the launchpad for thousands of new tokens daily. But with its recent explosive growth, the big question on everyone’s mind is whether the party is just getting started or if the music is about to stop. This article dives deep into a Pump.fun (PUMP) Price Prediction for 2027, cutting through the noise to give you a clear-eyed view of what might be next.

    We’ll break down the current market frenzy, explore potential long-term scenarios, and analyze the fundamental drivers that could send PUMP to new heights or back to earth. This isn’t about hype; it’s about understanding the forces at play so you can navigate the market with more confidence.

    TL;DR: Quick Forecast for PUMP

    • Current Momentum: PUMP is experiencing significant bullish momentum, with over 110% gains in the last 30 days, fueled by high trading volume and a strong memecoin narrative.
    • Base Case Prediction for 2027: If Pump.fun maintains its market leadership and the memecoin sector matures, a price range of $0.015 to $0.030 is plausible.
    • Bullish Scenario: In a full-blown crypto bull market where Pump.fun expands its features and market share, PUMP could potentially reach $0.075 to $0.12.
    • Bearish Scenario: A decline in the memecoin meta, increased competition, or a harsh regulatory environment could see the price fall to $0.0008 to $0.0025.
    • Key Factor: The token’s long-term value is directly tied to the sustained usage and revenue of the Pump.fun platform.

    What is Pump.fun (PUMP)?

    Before we get into predictions, let’s have a quick refresher. Pump.fun is a platform built on the Solana blockchain that makes it incredibly simple and cheap for anyone to create and launch their own cryptocurrency, primarily memecoins. It has streamlined the process, removing technical barriers and creating a fair launch mechanism where tokens become tradable on major exchanges like Raydium once they hit a certain market capitalization.

    The PUMP token is the native asset of this ecosystem. While its specific utilities can evolve, it’s designed to capture value from the platform’s success. This could be through governance rights (letting holders vote on the platform’s future), fee-sharing mechanisms (distributing a portion of platform revenue to token holders), or providing access to premium features for token creators. Essentially, holding PUMP is a bet on the continued growth and dominance of the Pump.fun platform as the go-to place for launching memecoins.

    Interpreting the Current Market Conditions

    To understand where PUMP might go, we first need to look at where it is right now. The current metrics tell a story of intense interest and powerful momentum. With a price of $0.00693976 and a market cap of over $2.45 billion, PUMP is no longer a small, under-the-radar project. It’s a major player with a valuation that reflects significant investor confidence.

    The 24-hour trading volume of over $832 million is particularly telling. This represents about 34% of its total market cap, an incredibly high ratio that signals massive short-term trading activity and liquidity. This is a double-edged sword: it means there are plenty of buyers and sellers, but it also points to high volatility. The recent price action confirms this bullishness, with a 15% gain in the last 24 hours and an eye-watering 110% gain over the past 30 days. The market is clearly hot on PUMP right now.

    On-Chain and Narrative Drivers

    The primary narrative driving PUMP is its position as the “picks and shovels” provider for the memecoin gold rush. As long as traders are eager to speculate on new memecoins, the platform that makes launching them easiest will thrive. Pump.fun has captured this market, and the PUMP token is the direct financial instrument to bet on that narrative continuing.

    Without direct access to the platform’s proprietary on-chain data, we can use the token’s market activity as a proxy for platform health. The high trading volume and positive price action suggest that user activity on Pump.fun is robust. Key metrics to watch, if they become publicly available, would be the number of new tokens launched daily, the total volume flowing through newly created bonding curves on the site, and the platform’s daily revenue. A consistent increase in these underlying platform metrics would provide a strong fundamental basis for a rising PUMP price.

    Pump.fun (PUMP) Price Prediction for 2027: Three Scenarios

    Looking ahead to 2027 involves forecasting crypto market cycles and the endurance of the memecoin trend. Here are three potential scenarios, ranging from bearish to bullish.

    Bear Case: The Hype Fades ($0.0008 – $0.0025)

    In this scenario, the memecoin craze of 2023-2024 proves to be a cyclical peak. By 2027, retail interest has moved on, and regulatory bodies have cracked down on platforms that facilitate the easy creation of speculative assets. Competitors with better technology or on different blockchains could also steal a significant portion of Pump.fun’s market share.

    From a technical perspective, the current momentum would falter. The price would break below key support levels established during its 2024 run. A sustained drop in platform usage would lead to a collapse in investor confidence, causing the high trading volume to dry up or turn into aggressive selling pressure. In this environment, PUMP could bleed over 90% of its value from its peak, returning to a price range seen before its major breakout.

    Base Case: Maturation and Stability ($0.015 – $0.030)

    Our base case assumes that memecoins, while volatile, remain a permanent fixture in the crypto landscape. The market enters another bull cycle leading into 2027, and Pump.fun successfully maintains its position as the market leader. The platform may introduce new features, enhancing its value proposition and generating steady revenue.

    Technically, the unsustainable 110% monthly growth would cool off, leading to a healthy correction and a period of consolidation. Over the next few years, the price would likely track the broader crypto market, making steady gains. The current price of ~$0.007 would act as a strong long-term support level. A 2-4x return from the current valuation over three years is a reasonable expectation for a leading project in a growing niche, placing the price between $0.015 and $0.030.

    Bull Case: Market Dominance ($0.075 – $0.12)

    The bull case imagines a perfect storm for PUMP. A massive, retail-driven crypto bull market in 2026-2027 makes the previous cycle look small. Memecoins become even more mainstream, and Pump.fun expands beyond Solana, becoming the multi-chain standard for token launches. The PUMP token’s value accrual mechanism, perhaps through fee-sharing, becomes incredibly effective, funneling millions in daily platform revenue to holders.

    In this scenario, the current price action is just the first leg of a much larger parabolic advance. The high trading volume would be interpreted as a sign of accumulation by major players. Breaking the psychological $0.01 barrier would trigger intense FOMO. A market cap reaching $25-$40 billion, comparable to other top-tier infrastructure plays during a market mania, would put the PUMP price in the $0.075 to $0.12 range.

    A Simple Valuation Model

    Let’s try a simple back-of-the-envelope calculation to ground our Pump.fun (PUMP) Price Prediction. A crypto project’s value can be loosely tied to the revenue it generates, similar to a stock’s Price-to-Sales (P/S) ratio.

    1. Assumptions: Let’s assume the Pump.fun platform generates $200 million in annualized revenue from launch fees. This is speculative but provides a starting point.
    2. Current Valuation: With a market cap of $2.45 billion, this gives PUMP a P/S ratio of approximately 12.25 ($2.45B / $200M). This is a reasonable multiple for a high-growth crypto project.
    3. 2027 Base Case Projection: If the platform can grow its revenue to $600 million annually by 2027 and maintains a similar P/S ratio of 10-15, its market cap would be between $6 billion and $9 billion. This would translate to a price of roughly $0.017 to $0.025, aligning closely with our base case scenario.

    This model shows that the token’s price is highly dependent on the platform’s ability to grow and monetize its user base.

    Risks and What to Watch

    Investing in PUMP is not without significant risks. The biggest threats include:

    • Regulatory Risk: Governments could classify assets launched on the platform as unregistered securities, creating legal problems for Pump.fun.
    • Narrative Collapse: The memecoin meta could simply die down, drastically reducing the platform’s usage and relevance.
    • Competition: Other platforms on Solana or different chains could offer a better, cheaper, or safer product, eroding Pump.fun’s market share.
    • Smart Contract Exploits: As with any DeFi protocol, a hack or bug could lead to a catastrophic loss of funds and trust.

    To stay ahead, keep a close eye on the platform’s daily usage statistics, its ability to innovate with new features, and the general sentiment around memecoins within the broader crypto market.

    Conclusion and Next Steps

    Pump.fun (PUMP) is a high-risk, high-reward investment that is fundamentally a bet on the longevity of the memecoin phenomenon. Its current market performance is undeniably strong, but its future trajectory into 2027 depends entirely on the platform’s ability to maintain dominance, innovate, and navigate an uncertain regulatory landscape.

    The scenarios outlined—from a bearish fadeout to a bullish market takeover—highlight the extreme volatility you should expect. The base case prediction of $0.015 to $0.030 offers a glimpse of what steady growth could look like, but this is far from guaranteed. Before making any decisions, your next step should be to dig deeper into the project’s official documentation, follow their community updates, and assess whether this level of risk aligns with your personal investment strategy.

    FAQ

    1. Is Pump.fun (PUMP) a good investment today?
    PUMP is a very high-risk, speculative asset. While it has strong momentum, its price is extremely volatile. It could be a profitable trade for experienced traders, but long-term investors should be aware of the significant risks tied to the memecoin narrative.

    2. How high could the PUMP price realistically go?
    In a highly optimistic bull market scenario for 2027, some analysts believe PUMP could reach the $0.075 to $0.12 range. However, this is a speculative target that depends on the platform achieving massive growth and the overall crypto market entering a period of extreme euphoria.

    3. What is the main factor that will drive the PUMP price?
    The single most important driver is the adoption and sustained revenue generation of the Pump.fun platform. If more users flock to the platform to launch and trade tokens, the demand for and value of the PUMP token will likely increase.

    4. Is PUMP connected to the Solana (SOL) price?
    Yes, indirectly. As Pump.fun is built on Solana, its success contributes to the activity and value of the Solana ecosystem. A major bull run in SOL would likely create a positive tailwind for PUMP and other Solana-based projects, and vice-versa.

    Not financial advice. Do your own research.

    Avantis (AVNT) Price Prediction: What Will AVNT Price Be in 2026?

    0

    Watching a chart like Avantis (AVNT) lately can feel like riding a rollercoaster in the dark. One minute you’re climbing, the next you’re plunging, all while trying to figure out if the thrill is worth the risk. With its recent wild price swings, you’re likely asking the one question that matters: where is this headed? This deep dive aims to cut through the noise and provide a clear, no-hype Avantis (AVNT) price prediction for the years ahead.

    We’ll break down the current data, explore potential scenarios for 2026, and give you the tools to understand what could drive AVNT’s future. Let’s figure out if this is a ride you want to be on.

    TL;DR: Avantis (AVNT) Price Prediction Highlights

    • High Volatility: Recent metrics show a massive 37% drop over the last week, followed by a short-term bounce. The trading volume is extremely high compared to its market cap, signaling intense speculative interest.
    • Base Case Prediction for 2026: Our base scenario projects an AVNT price between $2.50 and $5.00. This assumes the project successfully executes its roadmap and the broader crypto market enters a period of moderate recovery.
    • Bull & Bear Scenarios: In a strong bull market, AVNT could potentially reach $8.00 to $15.00, driven by strong narrative and user adoption. Conversely, a prolonged bear market or project-specific failures could see the price fall to $0.20 to $0.75.
    • Key Driver: The ratio of trading volume to market cap is the most telling metric right now. It’s over 5x, which is exceptionally high. This suggests the price is currently driven more by short-term traders than long-term holders.

    What is Avantis (AVNT)?

    Before we dive into numbers, let’s have a quick refresher. Avantis is a decentralized protocol aiming to innovate within a specific sector of the crypto economy. Think of it as a building block for a more open financial system, allowing users to interact with digital assets in a new way without relying on traditional intermediaries.

    Its native token, AVNT, is central to its ecosystem. It is often used for governance (letting holders vote on the project’s future), staking (earning rewards for securing the network or providing liquidity), and potentially as a medium of exchange within its platform. The success of the Avantis protocol is therefore directly tied to the utility and demand for the AVNT token.

    Current Market Conditions: A Picture of Extreme Volatility

    To understand where AVNT might go, we first need to look at where it is right now. The live metrics paint a dramatic picture. At a current price of $1.23 and a market cap of roughly $316 million, AVNT sits firmly in the mid-cap crypto asset category. This is where you find projects with established potential but also significant room for growth or failure.

    The most startling figure is the 24-hour trading volume: a staggering $1.78 billion. When a project’s daily volume is more than five times its entire market cap, it’s a massive red flag for volatility. This indicates that the asset is being heavily traded by short-term speculators, not held by long-term investors. This environment can lead to rapid price spikes and brutal crashes. The price action confirms this: while AVNT is up over 6% in the last 24 hours, it’s down a painful 37% over the last week. This is a classic sign of a post-hype correction followed by a speculative bounce.

    A Realistic Avantis (AVNT) Price Prediction for 2026

    Predicting any crypto asset’s price years into the future is challenging, but we can use current data and market principles to build logical scenarios. For our Avantis (AVNT) price prediction, we’ll consider three possibilities: a bear, base, and bull case. These are based on a calculated circulating supply of approximately 257 million AVNT tokens ($316M Market Cap / $1.23 Price).

    Bear Case: The Hype Fades ($0.20 – $0.75)

    In a bearish scenario, several factors could drive the price down. The broader crypto market could enter a prolonged downturn, dragging all assets with it. Additionally, the initial hype surrounding Avantis could fail to translate into real, sustained user adoption. If the protocol’s on-chain activity dwindles and trading volume dries up, speculative interest will move elsewhere.

    From a technical standpoint, the recent 37% weekly drop is a major warning. If the token fails to reclaim its previous highs and instead breaks below the psychological support level of $1.00, it could trigger further sell-offs. In this scenario, AVNT could see its market cap shrink to the $50 million to $195 million range, resulting in a price between $0.20 and $0.75.

    Base Case: Steady Growth and Adoption ($2.50 – $5.00)

    Our base case assumes a more stable crypto market by 2026 and that the Avantis team delivers on its roadmap promises. In this scenario, the project captures a respectable market share in its niche, and on-chain metrics like total value locked (TVL) and daily active users show consistent growth.

    Technically, this would involve AVNT establishing strong support above its current levels and beginning a steady uptrend, breaking past previous resistance. The speculative frenzy would cool, replaced by more organic demand from users of the protocol. A market cap in the range of $650 million to $1.3 billion seems reasonable for a successful mid-cap project, which would place the AVNT price between $2.50 and $5.00.

    Bull Case: Narrative Alignment and a Bull Market ($8.00 – $15.00+)

    The bull case is what every investor dreams of. This scenario requires a perfect storm: a roaring crypto bull market, flawless project execution, and Avantis capturing a powerful narrative that attracts massive capital inflows. The extremely high trading volume we see today, while risky, also shows that AVNT can attract immense attention when conditions are right.

    If Avantis becomes a leader in its sector, its valuation could begin to challenge established players. A market cap of $2 billion to $4 billion would not be out of the question in a full-blown bull run. This would translate to a price target of $8.00 to $15.00 or even higher, as price discovery takes hold. This outcome is entirely dependent on both exceptional project performance and favorable macro conditions.

    A Simple Valuation: Thinking in Market Caps

    Let’s try a quick, back-of-the-envelope valuation. Forget the price for a moment and think about the total value. Avantis currently has a market cap of around $316 million.

    Let’s compare it to other hypothetical projects in a similar sector. A well-established, top-tier protocol in many crypto niches can command a market cap of $3 billion to $5 billion during a bull market. A solid, second-tier player might sit between $800 million and $1.5 billion.

    If you believe Avantis has the potential to become a solid second-tier player by 2026, you’re looking at a 3x to 5x increase from today’s market cap. If you believe it can become a top-tier leader, you’re looking at a potential 10x or more. This simple comparison helps frame the potential upside and anchors your expectations in reality.

    Risks and What to Watch

    Investing in an asset this volatile comes with significant risks. Here’s what you need to keep a close eye on:

    • Market-Wide Risk: AVNT’s price will be heavily influenced by the performance of Bitcoin and Ethereum. A bear market will make it extremely difficult for any altcoin to thrive.
    • Execution Risk: Can the development team deliver on its promises? Watch for roadmap updates, product launches, and consistent progress. Any major delays could hurt investor confidence.
    • Competitive Risk: The crypto space is crowded. Monitor how Avantis stacks up against its direct and indirect competitors. Is it gaining or losing market share?
    • Token Unlocks: Be aware of the token release schedule. Large unlocks of tokens for early investors or team members can create significant selling pressure on the market.

    Conclusion: High Risk, High Reward

    Avantis (AVNT) is currently a high-octane, speculative asset defined by extreme volatility. Its future path will be determined by its ability to convert today’s trading frenzy into tomorrow’s sustainable user base. While the potential for significant returns exists, the risks are equally substantial.

    The journey to 2026 will be anything but a straight line. Investors should prepare for continued volatility and focus on the project’s fundamental progress rather than short-term price swings. The most crucial next step is to dig deeper into the project’s whitepaper, team, and community to determine if you believe in its long-term vision.

    Frequently Asked Questions (FAQ)

    Is Avantis (AVNT) a good investment today?
    That depends entirely on your risk tolerance. Given its high volatility, it’s a high-risk asset. A small position might be suitable for a diversified portfolio, but it’s not a “safe” investment. The massive recent drop followed by a bounce suggests it’s best suited for experienced traders or long-term believers who can stomach the swings.

    What is a realistic price for AVNT in 2026?
    Our base case model suggests a range of $2.50 to $5.00 is a realistic target if the project develops successfully in a neutral-to-positive market. However, prices could be significantly lower in a bear market or much higher if Avantis becomes a category leader during a bull run.

    What could make the AVNT price go up?
    Key catalysts would include a major crypto bull market, successful product launches that attract a large user base, strong growth in on-chain metrics (like revenue or TVL), and forming strategic partnerships that expand its ecosystem.

    What is the biggest risk for Avantis?
    The biggest risk is that it fails to achieve product-market fit. The current high trading volume is speculative. If the protocol itself doesn’t attract and retain real users who find value in its service, the speculative interest will eventually fade, and the price will likely fall significantly.

    Not financial advice. Do your own research.

    What Is Falcon Finance (FF) Price Today? FF Technical Analysis (October, 2025)

    0

    That gut-wrenching 35% drop in Falcon Finance (FF) over the last 24 hours likely has your full attention. When a coin moves this dramatically, it’s easy to feel a mix of panic and curiosity. Is this a warning sign to stay away, or is it the dip-buying opportunity traders dream of? Let’s cut through the noise and conduct a sober Falcon Finance (FF) Technical Analysis to understand the data, map out potential scenarios, and figure out what might be next.

    TL;DR: The Current State of FF

    • Massive Volatility: Falcon Finance is currently trading around $0.179 after a severe -35.6% drop in the last 24 hours, indicating a major market event or sentiment shift.
    • A Glimmer of Hope?: A recent bounce of over 4.5% in the last hour suggests buyers are tentatively stepping in at these lower prices, but the battle is far from over.
    • Extreme Volume Spike: Trading volume has exploded to over $836 million, double the project’s entire market cap. This signals huge interest, likely driven by liquidations, panic selling, and large players making moves.
    • Critical Juncture: FF is at a make-or-break technical level. Its direction in the coming days will likely depend on whether bulls can defend the current support or if sellers push it further down.

    What is Falcon Finance (FF)?

    Before we dive into the charts, let’s have a quick refresher. Falcon Finance is a decentralized finance (DeFi) protocol aiming to bridge the gap between real-world assets (RWAs) and the blockchain. By allowing users to tokenize and borrow against assets like real estate or invoices, FF seeks to unlock trillions of dollars in illiquid value and bring it on-chain.

    The project’s native token, FF, is used for governance, staking to secure the network, and paying for transaction fees within the ecosystem. The success of FF is therefore closely tied to the adoption of its platform and the growth of the broader RWA narrative in crypto.

    Current Market Conditions: Interpreting the Data

    The numbers we’re seeing today tell a dramatic story. At a price of $0.179, FF now sits at a market capitalization of approximately $418 million. While this makes it a respectable mid-cap project, the real headline is the price action. A 35.6% drop in a single day is a significant event that shakes out investors and forces the market to re-evaluate the asset’s worth.

    What’s most fascinating is the 24-hour trading volume: a staggering $837 million. To put that in perspective, the volume is twice the entire market cap. A volume-to-market-cap ratio this high is rare and points to a major liquidity event. It means the token is changing hands at a frantic pace. This isn’t just retail jitters; it’s a sign of large-scale capitulation, forced liquidations of leveraged positions, and potentially large funds or “whales” either dumping their bags or accumulating at what they perceive to be a discount. The 4.5% bounce in the last hour confirms that a fierce battle is being waged at this price level.

    On-Chain & Narrative Drivers

    Without a specific news catalyst, a price drop this severe often has several potential drivers. It could be linked to a broader market downturn where higher-risk assets like FF sell off more aggressively than Bitcoin or Ethereum. Alternatively, it could be project-specific. Events like a large token unlock for early investors, news of a potential security vulnerability, or a major holder deciding to exit their position can all trigger this kind of cascade.

    The extremely high volume suggests that a significant number of leveraged positions were likely liquidated, which forces automatic market sells and pushes the price down even further and faster. The narrative around RWAs is also a factor. If sentiment for the entire RWA sector has cooled, investors may rotate capital into other trending areas. For now, the key takeaway is that the market is reacting to a major event, and the price is now searching for a new floor.

    Falcon Finance (FF) Technical Analysis: Scenarios for October 2025

    Given the sharp drop, FF is at a critical inflection point. Here are three potential scenarios for the coming weeks based on the current price action.

    Bearish Scenario: Breakdown Below $0.15

    If the current bounce fails and sellers overwhelm the buyers, the first critical support level to watch is the recent low, likely around $0.17. A sustained break below this level would signal that the selling pressure has not subsided.

    In this scenario, confidence would be shattered, and the price could quickly seek out the next logical support zone. This might be a psychological level like $0.15, or potentially a deeper move toward the $0.12 – $0.13 range, which may represent a prior consolidation zone from months ago. This would happen if the reason for the sell-off is fundamentally negative news about the project or if the broader crypto market continues to bleed.

    Base Case: Consolidation Between $0.17 and $0.22

    The most likely short-term scenario is a period of choppy consolidation. After such a massive move, markets need time to digest what happened. In this case, FF could establish a range between the recent low of around $0.17 and the first significant resistance level around $0.22.

    We would expect to see volume gradually decline as the price bounces between these two boundaries. This “basing” pattern would signify that the panic selling has exhausted itself, but buyers are not yet confident enough to push for a full recovery. The market would be in a state of equilibrium, waiting for the next catalyst to determine its direction.

    Bullish Scenario: Reversal and Reclaim of $0.25

    The high-volume sell-off could also be interpreted as a final “capitulation wick.” This happens when all the panic sellers and forced liquidations are flushed out of the market at once, leaving only strong-handed buyers. The strong 4.5% bounce from the lows is the first sign this could be in play.

    In this bullish scenario, buyers would continue to defend the $0.17-$0.18 support zone. If they succeed, the price could begin a V-shaped recovery. The first major target would be reclaiming the $0.25 level, which likely acted as a key support level before the crash. A convincing move above $0.25 would signal a powerful reversal and could open the door for a move back toward the $0.30 area.

    Simple Valuation: A Back-of-the-Envelope Calculation

    Valuing crypto assets is notoriously difficult, but we can use a simple metric for a quick check. For a DeFi protocol like Falcon Finance, the Market Cap (MC) to Total Value Locked (TVL) ratio is a common starting point. TVL represents the total value of assets users have deposited into the protocol.

    Let’s make an assumption that FF has a TVL of $200 million. With a market cap of ~$418 million, this gives it an MC/TVL ratio of 2.09. If we assume its closest competitors in the RWA space trade at ratios between 1.5 (for more mature projects) and 3.0 (for newer, high-growth projects), then FF’s valuation appears to be right in the middle. It doesn’t seem excessively overvalued or undervalued based on this single metric, suggesting the recent price drop may have been more of a technical event than a fundamental re-rating.

    Risks & What to Watch

    The primary risk right now is the extreme volatility. The price could easily swing 10-20% in either direction. The underlying reason for the dump is still unknown, and if negative news emerges, the price could fall further. Always consider smart contract risk and the overall health of the crypto market.

    Here are three things to watch closely:

    1. The Daily Candle Close: Where does the price finish today? A close far above its low would be a bullish sign (a “hammer candle”). A close near its low would suggest more pain is ahead.
    2. Volume Trends: Watch for volume to decrease if the price stabilizes. A continued high volume with a falling price is a very bearish signal.
    3. Project Communication: Keep an eye on Falcon Finance’s official social media channels. A statement from the team addressing the price action could help restore confidence.

    Conclusion: A High-Stakes Environment

    Falcon Finance is currently in the eye of the storm. The massive sell-off and corresponding volume surge have put the asset at a critical crossroads. While the bounce from the lows offers a ray of hope for bulls, the environment remains treacherous and high-risk. The technical levels outlined above will be key to watch as the market decides whether this was a cleansing capitulation or the start of a deeper downtrend.

    For investors, this is a time for caution, not impulse. Assess your risk tolerance and watch for signs of stabilization before making any moves. The next few days will be telling for the future of FF’s price action.

    FAQ

    Why did Falcon Finance (FF) drop so much?
    A drop of this magnitude is typically caused by a combination of factors, including broad market weakness, forced liquidations of leveraged traders, a large holder selling their tokens, or negative news specific to the project. Without an official statement, it’s hard to pinpoint a single cause.

    Is FF a good buy after the drop?
    This depends entirely on your risk tolerance. Buying after a huge drop is a high-risk, high-reward strategy. While it could be an opportunity to buy at a discount, there is also the risk that the price continues to fall. It is crucial to do your own research and never invest more than you are willing to lose.

    What does the extremely high trading volume mean for FF?
    The high volume indicates that a massive number of tokens have changed hands. It signifies a moment of peak interest and disagreement in the market. It represents panic sellers and forced liquidations on one side, and opportunistic buyers and accumulators on the other. This clash is what will ultimately determine the next major price direction.

    What is a realistic price target for Falcon Finance (FF)?
    Price targets depend on which scenario plays out. If the bearish scenario unfolds, targets could be as low as $0.15 or even $0.12. In a bullish reversal, the first major target would be to reclaim the $0.25 level, with potential to move higher if momentum builds.

    Not financial advice. Do your own research.

    STBL (STBL) Price Prediction: What Will STBL Price Be in 2039?

    0

    Ever stared at a crypto chart and wondered where it could be in a decade, or even fifteen years from now? The thought of catching the next big wave early is what keeps many of us glued to the markets. Today, we’re taking a deep dive into a very long-term STBL (STBL) Price Prediction, looking all the way out to 2039. It’s a journey into speculative analysis, grounded in the data we have today, to explore what the future might hold for this intriguing asset.

    This analysis aims to cut through the hype and provide a balanced view. We’ll explore bullish and bearish outcomes, but remember, a 15-year forecast in crypto is like trying to predict the weather a year from now. It’s an exercise in possibilities, not certainties.

    TL;DR: Quick Forecast for STBL

    • Current Situation: STBL is experiencing intense volatility. A massive 24-hour trading volume relative to its market cap suggests high speculative interest, but a sharp price drop indicates a cool-off or profit-taking.
    • Long-Term Drivers: STBL’s success by 2039 will depend almost entirely on its ability to achieve real-world utility, sustain developer activity, and capture a lasting narrative within the broader crypto ecosystem.
    • 2039 Price Scenarios: Our analysis points to a wide range of potential outcomes. A bear case could see STBL fade into obscurity below $0.25, while a base case of solid adoption could place it between $1.50 and $7.50. A highly optimistic bull case could see prices exceed $25.
    • Key Takeaway: STBL is a high-risk, high-reward small-cap asset. Its journey to 2039 will be anything but a straight line. This article is for informational purposes only and is not financial advice.

    What is STBL?

    Before we look forward, let’s quickly look at what STBL is today. STBL is the native utility token of a decentralized ecosystem designed to solve a specific problem in the market. Its function is to facilitate transactions, enable governance, or provide access to unique features within its network.

    As a relatively small-cap project, it represents an early-stage venture in the vast crypto landscape. The core idea is that as its platform grows and attracts more users and developers, the demand for the STBL token will increase, potentially driving its value up over the long term. Understanding its fundamental purpose is the first step in evaluating its potential to survive and thrive until 2039.

    Interpreting the Current Market Conditions

    The live metrics paint a picture of a token in the middle of a storm. At a current price of $0.36, the 24-hour drop of over 18% is significant. This kind of sharp pullback often follows a period of rapid gains or can be triggered by broader market liquidations. However, the 7-day change is still positive at around 2.3%, suggesting the token was on an upward trajectory before this recent plunge.

    What’s most striking is the 24-hour volume of over $143 million against a market cap of just $180 million. A volume-to-market-cap ratio this high (nearly 80%) is extraordinary. It signals a massive amount of trading activity, speculation, and attention. This can be a double-edged sword: it shows intense interest, which is good for liquidity, but it also means the price is susceptible to wild swings as traders move in and out of positions rapidly.

    On-Chain and Narrative Drivers for Long-Term Growth

    Predicting a price 15 years from now has little to do with today’s chart patterns. It’s all about fundamental drivers that can sustain growth over multiple market cycles. For STBL, we need to look beyond the daily noise and focus on what could create lasting value.

    The most critical factor will be on-chain activity. Is the number of unique active wallets holding and using STBL growing month over month? Is the platform’s Total Value Locked (TVL) or transaction count increasing? These are the real-time indicators of adoption. Without growing usage, the token is just a speculative instrument. Another key area is the project’s narrative. Does STBL fit into a growing trend like Decentralized AI, Real World Assets (RWAs), or a new, unforeseen sector? A powerful and sticky narrative is what attracts new waves of users and investors over the long haul.

    Scenarios for 2039: A Detailed STBL (STBL) Price Prediction

    Forecasting fifteen years into the future requires us to think in broad scenarios rather than precise numbers. The entire crypto market will be vastly different, and STBL’s fate depends on its ability to navigate that evolution. Here are three potential paths.

    The Bear Case: Fading into Irrelevance

    In this scenario, STBL fails to achieve meaningful adoption. The development team might move on, the technology could become outdated, or a stronger competitor could simply capture the entire market. The narrative fizzles out, and the community disbands. By 2039, it would be considered a “ghost chain” or a forgotten token.

    • Rationale: The vast majority of crypto projects fail. Stiff competition, regulatory hurdles, or a failure to innovate could easily lead to this outcome.
    • 2039 Price Prediction Range: $0.05 – $0.25

    The Base Case: A Niche Champion

    In our base case, STBL successfully carves out a durable niche for itself. It doesn’t become the next Ethereum or Bitcoin, but it becomes a go-to platform for a specific use case, maintaining a dedicated user base and a consistent development team. It survives multiple bear markets and solidifies its position as a respectable top 100-200 project in a much larger future crypto market.

    • Rationale: This path assumes the team delivers on its roadmap and finds a product-market fit. Its market cap would grow in line with the overall expansion of the digital asset space.
    • 2039 Price Prediction Range: $1.50 – $7.50

    The Bull Case: A Market Leader

    The bull case imagines that STBL not only succeeds but becomes a dominant player in its sector. Its technology becomes an industry standard, and its ecosystem explodes with applications and users. It would be a household name in the crypto world of 2039, likely sitting comfortably in the top 20 by market capitalization.

    • Rationale: This requires near-flawless execution, groundbreaking innovation, and a narrative that captures the imagination of the entire market. It’s the 1-in-1000 outcome that investors dream of.
    • 2039 Price Prediction Range: $25 – $75

    A Simple Valuation Back-of-the-Envelope

    Let’s try to ground these scenarios with some simple math. This is a rough estimate to illustrate potential, not a guarantee.

    Assumptions:

    1. Current Circulating Supply: Roughly 500 million STBL ($180M market cap / $0.36 price).
    2. Future Circulating Supply (2039): Tokens often have some level of inflation. Assuming a modest 3% annual supply increase over 15 years, the supply in 2039 would be approximately 780 million STBL.
    3. Future Market Caps: Based on our scenarios and assuming the total crypto market grows significantly.
      • Base Case Market Cap: $3 billion (a solid top 100 project today).
      • Bull Case Market Cap: $40 billion (a top 20 project today).

    Calculations:

    • Base Case Price: $3,000,000,000 / 780,000,000 tokens = $3.85 per STBL
    • Bull Case Price: $40,000,000,000 / 780,000,000 tokens = $51.28 per STBL

    This simple model shows how our scenario ranges are derived, linking price directly to market capitalization and token supply.

    Risks and What to Watch

    Investing in a small-cap asset like STBL is inherently risky. The path to 2039 is filled with obstacles that could derail the project entirely.

    • Competition: The crypto space is relentlessly competitive. A new project with better technology or marketing could emerge at any time.
    • Regulatory Risk: The regulatory landscape for digital assets is still being written. Unfavorable laws in key jurisdictions could stifle growth.
    • Technological Obsolescence: A 15-year timeline is an eternity in tech. STBL must continually innovate to remain relevant.
    • Execution Risk: The anonymous or public team behind STBL must consistently deliver on its promises and manage its treasury responsibly.

    To track its progress, keep an eye on developer activity on platforms like GitHub, monitor the growth of active wallets and on-chain transactions, and follow their community channels for roadmap updates and major announcements.

    Conclusion: An Unwritten Future

    The long-term STBL (STBL) Price Prediction is one of high uncertainty and immense possibility. Its current market metrics show a frenzy of speculative interest, but its survival until 2039 will be determined by its ability to build real, lasting value. The journey will be volatile, and only investors with a very high-risk tolerance and a long-term conviction should consider it.

    Your next steps should be to move beyond price speculation. Dive into the project’s whitepaper, learn about the team and their vision, and engage with the community. The more you understand the fundamentals, the better equipped you’ll be to assess whether STBL has what it takes to thrive for the next decade and a half.

    FAQ

    Is STBL a good investment today?
    STBL is a highly speculative, small-cap asset experiencing extreme volatility. It should be considered a very high-risk investment suitable only for a small portion of a diversified portfolio, and only after you have conducted thorough research.

    Can STBL price realistically reach $100?
    For STBL to reach $100 by 2039, it would require a market capitalization of approximately $78 billion ($100 x 780 million future tokens). This would make it one of the largest crypto projects in the world. While not impossible in a hyper-bullish future for crypto, it is an extremely optimistic and unlikely outcome.

    What is the single most important factor for STBL’s success?
    Sustained user adoption is the most critical factor. A crypto project can have great technology and a compelling story, but without a growing number of people and applications actually using its network, the token’s value cannot be sustained long-term.

    Not financial advice. Do your own research.
    We Gave an AI Agent Total Control of Our Portfolio for a Week — Here’s What Happened

    0

    When we decided to allocate $350 to a new crypto trading bot, many of our colleagues thought we were throwing money away. And we can understand why. The crypto space is notorious for scams and hype-driven projects. However, after careful research, it became clear that this AI agent was different.

    Recent developments in artificial intelligence are remarkable, yet practical applications for crypto trading have been limited. 

    We were searching for a platform that could simplify trading, make it more precise, and reduce the emotional stress that comes with managing a volatile portfolio. That’s when we discovered Milo.

    Having spent years navigating the highs and lows of crypto markets, we understand the emotional toll of trading. Watching a coin drop 20% in minutes or feeling torn between fear and greed is all too familiar. 

    Milo promised something revolutionary: the ability to trade on our behalf, precisely as we would, but without the emotional interference. All we needed to do was define the rules and let it operate. 

    Unlike traditional bots, which are rigid and rule-bound, Milo adapts to our strategy and risk preferences.

    Milo’s auto-trading is now on Open Beta! Connect your wallet to Milo and start experiencing the real impact AI can have in crypto trading.

    Setting Up an AI Agent That Thinks Like Us

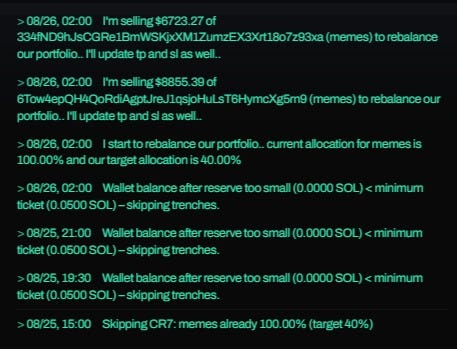
    Milo functions more like a trading partner than a conventional application. Its autotrader feature continuously evaluates market conditions, executes trades according to the rules we establish, and adjusts strategies as conditions change. 

    We could define risk tolerance, profit targets, token types, and exposure limits, then step back entirely.

    Traditional trading bots operate on fixed rules. Milo, however, combines logic with real-time analysis, evaluating multiple technical indicators alongside on-chain data such as token holders and market capitalization. It performs risk assessments for every trade, effectively functioning as a human trader, but without hesitation or emotion.

    The setup is straightforward. We selected:

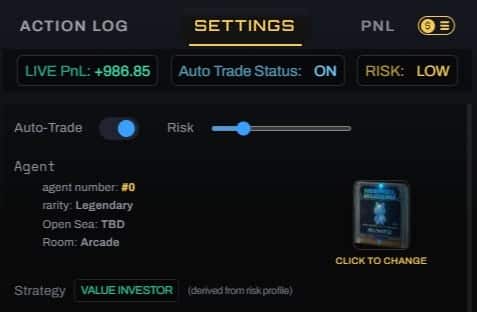
    • Risk level: Medium. We preferred a balanced approach to test the AI without going fully aggressive.
    • Strategy: Swing trading, targeting short- to medium-term positions. Milo adapts its approach according to our risk preferences.
    • Asset Allowlist: We focused on a mix of memecoins, promising new tokens, and established majors, aiming for a balance of volatility and stability.

    Once configured, we activated the Auto-Trade feature and observed the system in action.

    Early Results and Adaptation

    Initially, results were modest. Milo executed trades efficiently, but profits were small and movements conservative. We monitored closely, checking in every few hours. Over time, the AI began optimizing its behavior, stacking small wins and occasionally holding positions longer. Its execution was disciplined and systematic, unlike human trading, which is often influenced by emotion.

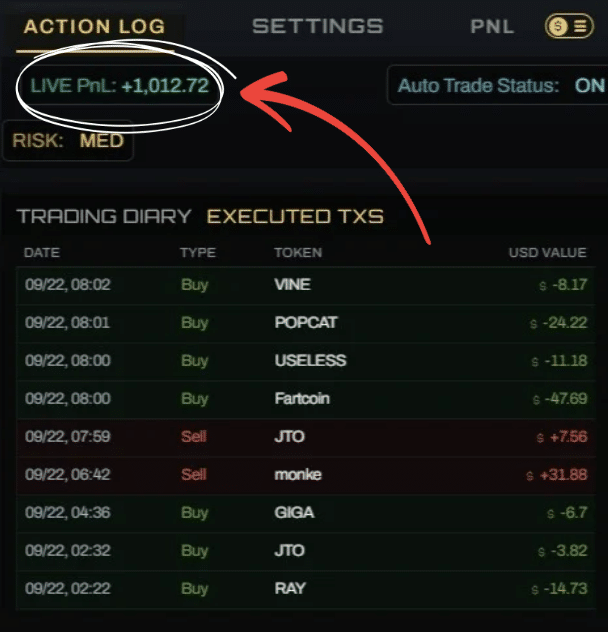
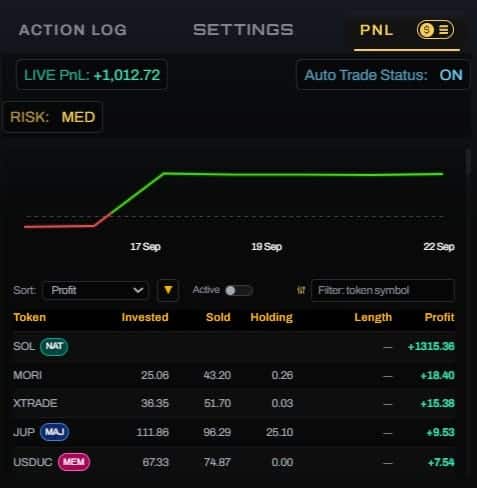
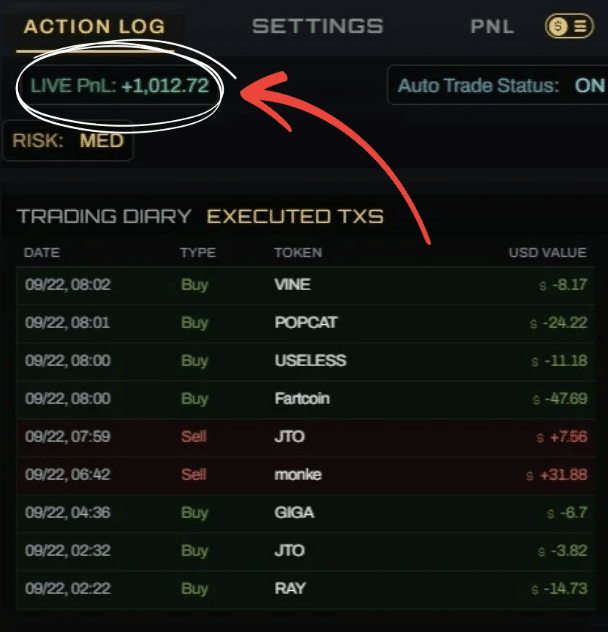
    By the end of the week, Milo had completed over 100 trades, growing our initial $350 to $1,012.72. 

    The portfolio included top performers such as Useless Coin, Fartcoin, Bonk, JLP, JTO, JUP, and SOL; a diverse mix of memecoins and major Solana tokens. While Milo occasionally made suboptimal trades, the majority contributed positively to the portfolio.

    This experience highlighted an important lesson: AI agents perform best when given time to learn the market, recognize patterns, and adapt to signals. Milo is not simply a bot; it operates with intelligence and flexibility.

    Areas for Improvement

    No platform is without flaws. 

    Milo’s interface can feel slightly unintuitive at times, and the transaction history occasionally lags behind executed trades. While these are minor issues, they can introduce small amounts of anxiety for users accustomed to instant confirmation.

    Despite these imperfections, the strengths of the platform far outweigh these limitations.

    Can’t wait to use Milo yourself? Connect your wallet to Milo and get started now, for free.

    Key Advantages of Using Milo

    The most striking aspect of Milo is the ease of use. There is no steep learning curve, no complex setup. 

    Once we set our parameters, Milo handled discovery, entries, exits, and rebalancing without requiring constant attention. Each trade is logged in accessible language, explaining the rationale behind every move.

    This created an unprecedented level of mental clarity. By outsourcing our trading instincts to Milo, we eliminated hesitation, fear, and second-guessing. It executed consistently, compounding small wins into substantial results.

    AI Agents Are Not the Future, They Are the Present

    Handing over our portfolio to an AI agent for a week transformed our approach to crypto trading. The experience was not just profitable, it was educational. Milo allowed us to step back, observe the market objectively, and focus on strategy rather than emotion.

    We did not provide exclusive alpha. We did not select trades manually. We simply defined the parameters and let the AI execute. 

    The result was a more than threefold increase in our portfolio in just one week, trading exclusively in Solana memecoins.

    AI trading agents are no longer a theoretical advantage, they are an immediate tool for disciplined, emotion-free trading. For anyone active in crypto, the choice is clear: continue grinding manually or leverage AI to hunt opportunities, manage risk, and optimize execution while monitoring from a distance.

    Milo represents an important step in that evolution. It is not perfect, but it is powerful, efficient, and capable of delivering a significant edge in crypto markets. For those willing to experiment and adopt new technology, the rewards are tangible and immediate.

    If you want to try Milo’s auto-trading feature, you can do it for free. Connect your wallet to Milo and start experiencing the real impact AI can have in crypto trading.

    Xrp (XRP) Price Prediction: What Will XRP Price Be in 2025?

    0

    For years, XRP has been the digital asset that sparks endless debate. Is it the future of global finance or a centralized project struggling for a narrative? Whatever your stance, one question echoes louder than the rest: what’s next for its price? If you’re holding XRP or considering a position, you know the stakes are high. Let’s cut through the noise and build a clear, data-driven XRP (XRP) Price Prediction for 2025.

    TL;DR: XRP in 2025

    • Current State: XRP is consolidating around the $2.84 mark. After a period of growth, the price has stabilized, showing slight negative pressure in the short term but remaining flat over the past month. This suggests the market is in a holding pattern, waiting for its next major catalyst.
    • 2025 Price Scenarios: Our analysis points to a wide range of possibilities. A bearish outcome could see XRP fall to the $1.50 – $2.50 range, while a base case puts it between $4.50 and $6.00. An exceptionally bullish scenario, driven by legal clarity and mass adoption, could push the price toward $8.00 – $12.00.
    • Key Drivers: The single most important factor is regulatory clarity, particularly concerning the SEC in the United States. Beyond that, the rate of adoption for Ripple’s payment solutions (like ODL) and the overall health of the crypto market will determine XRP’s trajectory.
    • Disclaimer: This article is for informational purposes only and should not be considered financial advice. The cryptocurrency market is extremely volatile.

    What is XRP? A Quick Refresher

    Before we dive into predictions, let’s quickly recap what XRP is and what it isn’t. XRP is the native digital asset of the XRP Ledger (XRPL), a decentralized, public blockchain built for speed and efficiency. Its primary use case, as envisioned by Ripple (the company most associated with it), is to act as a “bridge currency” for cross-border payments.

    Think of it this way: if a bank in the U.S. wants to send money to a bank in Japan, it’s a slow and expensive process involving multiple intermediary banks. Ripple’s network uses XRP to settle that transaction in seconds for a fraction of a cent. This separates it from Bitcoin, which is primarily seen as a store of value (“digital gold”), and Ethereum, which is a platform for decentralized applications and smart contracts. XRP is all about fast, cheap, and scalable payments.

    Current Market Conditions: A Coiled Spring?

    To understand where XRP might go, we first need to understand where it is right now. Let’s interpret the current metrics to get a clear picture of the market sentiment.

    At a price of $2.84 and a market capitalization of over $169 billion, XRP is undeniably a major player in the crypto space. The 24-hour trading volume of nearly $4.7 billion indicates strong liquidity and sustained interest from traders. However, the price action tells a story of indecision. With minor dips over the last hour, day, and week, but a nearly flat performance over the last 30 days, XRP appears to be in a tight consolidation phase. This type of price action often precedes a significant move. The market is absorbing recent gains and seems to be waiting for a clear signal—be it bullish or bearish news—before choosing a direction.

    On-Chain & Narrative Drivers

    While price charts tell part of the story, the underlying fundamentals and market narratives often provide the fuel for major trends. For XRP, these are particularly potent.

    On the narrative front, nothing is more important than regulatory clarity. The long-standing legal battle with the U.S. Securities and Exchange Commission (SEC) has acted as a major headwind. A decisive, positive outcome would not only remove a massive cloud of uncertainty but could also trigger a re-listing on major U.S. exchanges, unlocking a flood of new capital. Conversely, a negative ruling would be a significant blow. Beyond the legal drama, the adoption of Ripple’s payment technology by banks and financial institutions remains a core value driver. Each new partnership announced for its On-Demand Liquidity (ODL) service, which directly utilizes XRP, strengthens its utility-based bull case.

    On-chain metrics for the XRP Ledger also offer clues. While we can’t deep-dive here, analysts are constantly watching metrics like the number of active wallets, on-ledger transaction volume, and the movement of large amounts of XRP by “whales.” A sustained increase in active addresses and transaction volume would suggest growing real-world use of the network, providing a solid fundamental floor for the price.

    XRP (XRP) Price Prediction Scenarios for 2025

    Let’s explore three potential scenarios for XRP’s price by 2025, from bearish to bullish. These are based on the current market structure and potential fundamental developments.

    Bearish Scenario: $1.50 – $2.50

    In a bearish scenario, the catalysts that bulls are hoping for fail to materialize. This could be triggered by a negative outcome in the SEC case, leading to XRP being formally classified as a security in the U.S. This would create immense selling pressure and legal hurdles for adoption. This scenario would also likely coincide with a broader crypto bear market, where liquidity dries up across the board. From a technical perspective, a failure to hold the current consolidation zone around $2.80 could lead to a sharp breakdown. The price would likely seek support at a previous major structure level, which could be found in the $1.50 to $2.50 range.

    Base Case Scenario: $4.50 – $6.00

    This is the “muddle through” scenario. Here, the SEC case ends in a settlement with mixed implications—perhaps fines for Ripple but with a path forward for XRP as a non-security. Ripple continues to sign new ODL partnerships, but adoption is steady rather than explosive. The broader crypto market experiences a modest bull run, lifting all assets. Technically, this would involve a convincing breakout above the current consolidation range and a successful challenge of the previous all-time high (around $3.84). Once that resistance is broken, the price would enter a new discovery phase, with the $4.50 to $6.00 range acting as a logical psychological and technical target.

    Bullish Scenario: $8.00 – $12.00

    The bullish scenario is the perfect storm. It begins with a clear and decisive victory for Ripple against the SEC, establishing XRP as a non-security asset in the U.S. This unleashes a wave of positive sentiment, exchange re-listings, and institutional interest. This legal clarity is coupled with announcements of several Tier-1 banks or payment providers adopting ODL at scale, proving the utility of XRP in the multi-trillion dollar cross-border payments market. In this environment, fueled by a roaring crypto-wide bull market, XRP would shatter its previous all-time highs. In a full-blown price discovery phase, technical targets derived from Fibonacci extensions could point toward the $8.00 to $12.00 range as a plausible destination.

    A Simple Valuation Back-of-the-Envelope

    Valuing a crypto asset is notoriously difficult, but we can use a simple thought experiment to see what a bullish adoption scenario might imply for the price. This is not a precise model, but a way to frame the potential.

    Assumptions:

    1. Target Market: The global cross-border payments market, where SWIFT currently facilitates trillions of dollars in transactions daily.
    2. ODL Adoption: By 2025, let’s assume Ripple’s ODL network, which uses XRP for settlement, successfully captures just a fraction of this market and processes an average of $100 billion in daily volume.
    3. Valuation Multiple: Let’s assign a speculative market cap multiple of 10x the daily volume the network secures. This is an arbitrary figure meant to reflect the network’s value relative to its utility.

    Calculation:

    • Target Daily Volume: $100,000,000,000
    • Implied Network Valuation (Market Cap): $100B * 10 = $1 Trillion
    • XRP Total Supply: 100,000,000,000 XRP
    • Implied Price per XRP: $1,000,000,000,000 / 100,000,000,000 = $10.00

    Again, this is highly speculative and depends entirely on our assumptions. However, it demonstrates that if XRP achieves even a small part of its stated goal, a price in the high single or low double digits is mathematically plausible.

    Risks & What to Watch

    Investing in XRP is not without significant risk. Here’s what you need to keep a close eye on:

    • Regulatory Risk: This is paramount. Any news related to the SEC case or new regulations from other major governments will directly impact the price.
    • Competition: Ripple is not the only player trying to innovate in payments. Stablecoins like USDC and even upgrades to the legacy SWIFT system pose competitive threats.
    • Adoption Rate: Watch for partnership announcements from Ripple. The market needs to see continued proof that institutions are actually using XRP, not just testing the technology.
    • Broader Market Health: No asset is an island. A prolonged Bitcoin bear market will inevitably drag XRP down with it, regardless of its own fundamental progress.

    Conclusion and Next Steps

    The future of XRP’s price hinges on a compelling but uncertain narrative. It has the potential to solve a real-world problem in a massive market, which could justify a valuation significantly higher than today’s. The current price consolidation suggests the market is at a crossroads, waiting for a definitive catalyst.

    Your next step is to weigh the potential scenarios against your own risk tolerance. The bull case is enticing, but the risks, particularly on the regulatory front, are very real. Pay close attention to news surrounding the SEC, watch for new ODL partnerships, and keep an eye on the overall health of the crypto market. Whether XRP becomes a pillar of the future financial system or a historical footnote, the next year promises to be a pivotal chapter in its story.

    FAQ

    Is XRP a good investment today?
    XRP is a high-risk, high-reward asset. Its potential upside is significant if it achieves its goals and gains regulatory clarity. However, the risks are equally substantial. It may be suitable for investors with a high-risk tolerance who believe in its long-term vision, but it is not for everyone.

    Could XRP really reach $10?
    As our back-of-the-envelope calculation showed, a $10 price point is plausible under a very bullish scenario involving massive adoption in the global payments industry and full legal clarity. However, reaching this level would require a near-perfect execution of Ripple’s strategy and a favorable market environment.

    What is the main difference between XRP and Bitcoin?
    Their primary purposes are different. Bitcoin is designed to be a decentralized store of value, often called “digital gold,” with a focus on security and censorship resistance. XRP is designed for utility as a fast and low-cost bridge currency for payments, prioritizing speed and scalability.

    How does the SEC lawsuit affect XRP’s price?
    The SEC lawsuit creates a major barrier for XRP, especially in the United States. It has led to delistings from major exchanges and has deterred institutional investment. A positive resolution could remove this barrier and unlock significant upward potential, while a negative outcome would severely damage its investment case.

    Not financial advice. Do your own research.

    What Is Avantis (AVNT) Price Today? AVNT Technical Analysis (September, 2025)

    0

    Watching an asset you follow drop over 40% in a single week is a gut-wrenching experience. The market feels irrational, your conviction wavers, and the big question looms: is this a catastrophic failure or a generational buying opportunity? This is exactly the situation facing Avantis (AVNT) holders and watchers right now. In this Avantis (AVNT) Technical Analysis, we’ll cut through the noise, analyze the data, and map out the potential scenarios for the coming weeks.

    TL;DR: Key Takeaways

    • Intense Selling Pressure: AVNT is down significantly, dropping over 20% in the last 24 hours and over 41% in the past week. The trend is strongly bearish in the short term.
    • Massive Trading Volume: The 24-hour volume is roughly three times its market cap. This is an anomaly that signals either mass panic selling (capitulation) or a major distribution event.
    • Critical Support Zone: The price is hovering at $1.15, just above the crucial psychological support level of $1.00. How it reacts here will likely determine its direction for the rest of the month.
    • High Risk, High Volatility: The current market conditions are not for the faint of heart. The potential for sharp moves in either direction is extremely high.

    What is Avantis (AVNT)?

    For those new to the project, let’s have a quick refresher. Avantis is a decentralized perpetuals exchange (DEX) built to provide a high-speed, low-cost trading experience. It aims to compete with both centralized exchanges and other on-chain derivatives platforms.

    The native token, AVNT, is the core of its ecosystem. It is primarily used for governance, allowing holders to vote on proposals that shape the protocol’s future. Additionally, a portion of the trading fees generated by the platform is often distributed to those who stake their AVNT tokens, creating a “real yield” narrative that has been popular with investors.

    Current Market Conditions: A Look at the Data

    The numbers right now tell a story of extreme volatility and fear. At a current price of $1.15, AVNT has been hit hard. The 24-hour drop of nearly 21% and a 7-day loss of 42% point to a market in turmoil. While 30-day data is not fully available, the weekly trend paints a clear picture of intense selling pressure.

    The most striking metric is the $895 million in 24-hour trading volume against a market cap of just $297 million. A volume-to-market-cap ratio of over 3 is exceptionally high. This suggests that a huge number of tokens are changing hands. In a downtrend, this can mean one of two things: either fearful investors are capitulating and selling at any price, or large holders are “distributing” their tokens to unsuspecting retail buyers. The truth is likely a mix of both, defining a critical inflection point for the asset.

    On-Chain & Narrative Drivers

    Without deep on-chain data at our fingertips, we must reason cautiously about the fundamental drivers. For a protocol like Avantis, the narrative is tied directly to its performance as a DEX. Key questions to ask are: Is the platform’s trading volume growing? Are the fees generated by the protocol increasing? A strong protocol can weather market downturns better than one with weak fundamentals.

    Conversely, negative drivers could be at play. Perhaps a major competitor just launched a successful product, or a broader market downturn is causing traders to de-risk from mid-cap assets like AVNT. A lull in the “real yield” narrative could also dampen investor enthusiasm. Keep an eye on the project’s official announcements and dashboards that track platform metrics like trading volume and fees. These are your best clues to the underlying health of the ecosystem.

    Avantis (AVNT) Technical Analysis: Scenarios for September 2025

    The price chart is at a crossroads. Here’s a detailed Avantis (AVNT) Technical Analysis breaking down the bear, base, and bull scenarios based on the current price of $1.15.

    The Bear Case: A Break Below $1.00

    If the selling pressure continues, the most obvious target is the psychological and technical support level at $1.00. A daily close below this level would be a very bearish signal. It would indicate that sellers are firmly in control and that the capitulation volume was not enough to form a bottom.

    In this scenario, we would look for the next major support zone, which could lie around $0.75 – $0.80. This area might represent a previous consolidation range before the last major price run-up. A move down to this level would represent another 30-35% drop from current prices.

    The Base Case: Choppy Consolidation

    The most likely scenario in the immediate future is a period of consolidation. The massive volume could signify that the weakest hands have been shaken out. In this base case, AVNT would likely establish a range between $1.00 and $1.40.

    We would expect to see price bounce around within this channel for days or even weeks. Key signs to watch for would be declining trading volume—which indicates the selling is exhausted—and candlestick patterns on the daily chart like dojis or hammers, suggesting market indecision. This “basing” period is healthy as it allows a proper bottom to form before the next directional move.

    The Bull Case: The Washout and Reclaim

    In the most optimistic scenario, the recent plunge was a final “washout” event that flushed out sellers and set the stage for a sharp reversal. The extremely high volume, in this interpretation, was smart money absorbing the panic selling.

    The first confirmation of a bullish reversal would be a strong bounce off the $1.10 – $1.15 support area, followed by a decisive reclaim of the $1.50 level. This price point was likely previous support and has now flipped to resistance. Breaking back above it would trap short-sellers and signal a shift in market structure. From there, bulls would target a retest of the $1.80 – $2.00 zone.

    A Simple Valuation Back-of-the-Envelope

    Valuing crypto assets is notoriously difficult, but we can use simple models to get a sense of things. Since AVNT is a fee-generating protocol token, we can use a Price-to-Sales (P/S) ratio, where “sales” are the protocol’s fee revenue.

    Let’s assume a growing, profitable DEX protocol could trade at a P/S ratio of 15x. With the current market cap at ~$297M, we can work backward:

    $297,000,000 (Market Cap) / 15 (P/S Ratio) = $19,800,000 (Implied Annual Fees)

    The key question for you as an investor is: “Does it seem reasonable for the Avantis protocol to generate roughly $20 million in fees for its treasury or stakers over the next year?” If you believe its trading volume and user base can support that, then the current valuation might seem fair. If you think it can generate far more, it might be undervalued. If that number seems impossibly high, it may be overvalued.

    Risks & What to Watch

    This is a high-risk environment. The primary risks include:

    • Market Risk: If Bitcoin and Ethereum continue to fall, they will likely drag AVNT down with them, regardless of its own fundamentals.
    • Competition: The decentralized perpetuals space is fiercely competitive. A new or existing competitor could eat into Avantis’s market share.
    • Technical Risk: As with any DeFi protocol, there is always the risk of smart contract exploits or bugs.

    Here is what to watch in the coming days:

    1. The $1.00 Level: Does it hold or break? This is the most important line in the sand.
    2. Daily Candle Closes: Pay more attention to where the price closes each day than the intraday volatility.
    3. Volume Follow-Through: Does volume dry up on down days and pick up on up days? That would be a bullish sign.

    Conclusion and Next Steps

    Avantis (AVNT) is at a critical inflection point. The brutal sell-off combined with unprecedented volume has brought the asset to a do-or-die support level. The next few weeks will be defined by the battle between exhausted sellers and opportunistic buyers around the $1.00 – $1.15 mark.

    For traders and investors, this is a time for caution and careful observation, not impulsive decisions. Your next steps should be to watch the key levels outlined above, keep up with the project’s fundamental progress, and above all, manage your risk appropriately.

    FAQ

    What is the primary use case for the AVNT token?
    The AVNT token is central to the Avantis ecosystem, primarily used for governance (voting on the protocol’s future) and staking. Stakers often receive a share of the trading fees generated by the platform.

    Is AVNT a good investment at its current price?
    Whether AVNT is a good investment depends entirely on your risk tolerance and investment thesis. It is currently in a high-volatility, high-risk zone after a significant price drop. A recovery could offer substantial upside, but a further breakdown could lead to more losses.

    What does the high trading volume on AVNT signify?
    The extremely high volume indicates a major disagreement in the market. It can be interpreted in two ways: bearishly, as a sign of panicked investors selling en masse (capitulation), or bullishly, as a sign that the sell-off has reached a climax and strong hands are now accumulating tokens from weak hands.

    Where can I buy Avantis (AVNT)?
    AVNT is typically available on major centralized exchanges as well as on decentralized exchanges (DEXs) on the blockchain it operates on. Always check reputable market data sites for an up-to-date list of exchanges.

    Not financial advice. Do your own research.
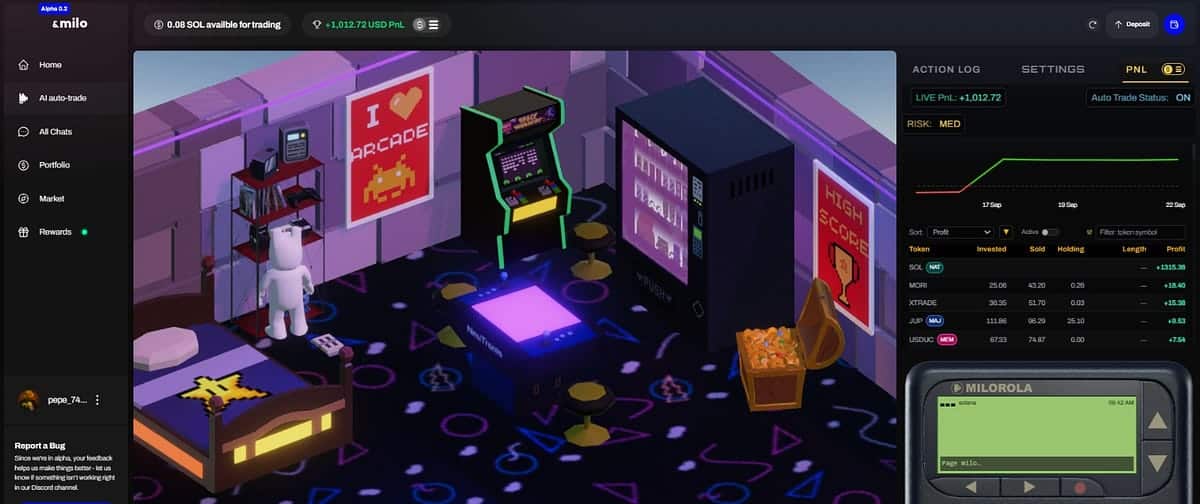
    Zcash (ZEC) Price Prediction: What Will ZEC Price Be in 2036?

    0

    In a world where every transaction feels tracked and every financial move is analyzed, the idea of true digital privacy isn’t just a luxury; it’s a necessity. This is the core promise of Zcash, a project dedicated to providing a secure and private way to transact online. For investors looking past the daily noise and towards a future where financial privacy is paramount, Zcash presents a compelling, long-term narrative. But what does that mean for its price over the next decade?

    This deep dive offers a comprehensive Zcash (ZEC) price prediction, looking all the way to 2036. We’ll break down the current market, explore potential future scenarios, and analyze the fundamental drivers that could shape ZEC’s destiny.

    TL;DR: Zcash Price Outlook

    • Strong Recent Momentum: Zcash is experiencing a significant surge, with its price up over 43% in the last week and over 72% in the last month, signaling renewed market interest and high volatility.
    • Fundamental Drivers: ZEC’s long-term value is deeply connected to the adoption of its privacy features (shielded transactions), a successful transition to Proof-of-Stake (PoS), and its ability to navigate a complex global regulatory landscape.
    • Long-Term Scenarios: Our Zcash (ZEC) price prediction for 2036 ranges from a bearish outlook of $20 – $80 if it fails to gain traction, to a bullish scenario of $3,000 – $8,000 if privacy becomes a mainstream demand.
    • Key Risks vs. Rewards: The primary risk for Zcash is a regulatory crackdown on privacy coins. The primary reward is capturing a significant share of the market for private digital cash and store of value.

    What is Zcash (ZEC)?

    Before we look ahead, let’s have a quick refresher. Zcash is a cryptocurrency, like Bitcoin, but with one major difference: it offers the option to keep your transactions completely private. While a Bitcoin transaction is public on the blockchain (anyone can see the sending address, receiving address, and amount), Zcash uses groundbreaking cryptography called zk-SNARKs to shield this information.

    This gives users a choice. You can make a transparent transaction, which works just like Bitcoin, or a shielded transaction, which hides the transaction details. This “optional privacy” makes Zcash a powerful tool for individuals and businesses who require confidentiality in their financial dealings. At its heart, Zcash aims to be true electronic cash for the internet age.

    Current Market Conditions: A Coiled Spring?

    As of this writing, Zcash is trading at $69.02, but that single number doesn’t tell the whole story. The recent price action is what’s truly turning heads. With gains of over 13% in the last 24 hours and an incredible 72% over the last 30 days, ZEC is showing signs of life after a prolonged bear market. This isn’t just a small blip; it’s a significant move backed by a 24-hour trading volume of over $217 million.

    When trading volume is high relative to the market cap (currently ~$1.12 billion), it suggests strong interest and conviction from traders. This kind of explosive momentum can be driven by a mix of factors: traders closing out short positions, renewed interest in the privacy narrative, or anticipation of future network upgrades. Whatever the cause, the market is clearly paying attention to Zcash again, setting the stage for a potentially volatile and interesting road ahead.

    On-Chain & Narrative Drivers

    Beyond the daily charts, a project’s long-term success depends on its underlying technology and the story it tells. For Zcash, two factors are critical.

    First is the on-chain adoption of its core feature: privacy. The most important health metric for Zcash is the growth of its “shielded pool,” which is the total amount of ZEC held in private addresses. While we don’t have the exact live data for this article, a consistent increase in the shielded pool would be a powerful indicator that users value Zcash for its intended purpose. It would show real-world demand for financial privacy.

    Second is the narrative surrounding its upcoming evolution. The Zcash community and developers are planning a major transition from its current Proof-of-Work (PoW) system to a more energy-efficient and modern Proof-of-Stake (PoS) consensus mechanism. This is a game-changer. A move to PoS would not only reduce the network’s environmental footprint but also introduce staking, allowing ZEC holders to earn rewards for helping secure the network. This could create a new source of demand for the token and fundamentally improve its economic model.

    Zcash (ZEC) Price Prediction for 2036

    Predicting prices over a decade away is an exercise in strategic forecasting, not clairvoyance. The crypto market will likely go through at least three more “halving” cycles by 2036. Here are three potential scenarios for Zcash, based on the fundamental drivers we’ve discussed.

    Bearish Scenario: The Privacy Niche Fades ($20 – $80)

    In this scenario, the regulatory headwinds prove too strong. Governments worldwide crack down on privacy-enhancing technologies, leading to ZEC being delisted from major exchanges. The move to Proof-of-Stake stalls or is poorly executed, failing to attract significant capital. As a result, user adoption of shielded transactions stagnates. Zcash fails to capture a compelling narrative and is out-competed by other privacy solutions or layer-2 protocols on larger networks. In this future, ZEC struggles to maintain its relevance, and its price could fall back to its bear market lows or stagnate in the low double-digits.

    Base Scenario: Steady Growth and Adoption ($300 – $1,000)

    Our base case assumes Zcash successfully navigates the regulatory landscape by working with policymakers and proving its utility. The transition to Proof-of-Stake is a success, creating a robust staking economy and attracting new investors looking for yield. Shielded transactions see steady, organic growth as a niche but essential tool for businesses, DAOs, and individuals. In this scenario, Zcash grows in line with the broader crypto market, eventually reclaiming its previous cycle highs. A price target in this range would give ZEC a market cap of $6 billion to $20 billion, placing it firmly among the top 20-30 crypto assets.

    Bullish Scenario: Privacy Becomes Paramount ($3,000 – $8,000)

    In the most optimistic scenario, the world wakes up to the importance of financial privacy. A major data scandal or a shift in social sentiment makes privacy a “must-have” feature, not a “nice-to-have.” Zcash, with its scientifically-backed technology and successful PoS network, becomes the gold standard for private digital cash. It attracts not only retail users but also institutional capital looking to protect its on-chain activities. Achieving a price in this range would imply a market cap of $60 billion to $160 billion, rivaling some of the largest digital assets today and cementing Zcash’s role as a pillar of the decentralized economy.

    A Simple Valuation Back-of-the-Envelope

    How can we sanity-check these numbers? Let’s use a simple market capitalization model.

    Assumptions for 2036:

    • The total crypto market cap grows to $15 trillion (a reasonable estimate for over a decade of growth).
    • ZEC’s circulating supply is approximately 20 million (out of a 21 million max supply).

    Valuation Logic:

    • Base Case: If Zcash captures just 0.1% of the total crypto market, its market cap would be $15 billion.
      • $15,000,000,000 / 20,000,000 ZEC = $750 per ZEC.
    • Bull Case: If Zcash becomes a key privacy standard and captures 0.4% of the market, its market cap would be $60 billion.
      • $60,000,000,000 / 20,000,000 ZEC = $3,000 per ZEC.

    This simple model shows that the price targets in our base and bull scenarios are well within the realm of possibility if Zcash can achieve even a modest share of a mature crypto market.

    Risks & What to Watch

    Investing in Zcash is a high-risk, high-reward proposition. Here’s what to keep on your radar:

    • Regulation: This is the number one risk. Watch for any government policies specifically targeting privacy coins or financial privacy tools.
    • Adoption of Shielded Pools: Keep an eye on on-chain data showing the growth of private transactions. This is the ultimate proof of utility.
    • Proof-of-Stake Transition: Follow the development progress and community sentiment around the PoS upgrade. A smooth transition is critical for the bull case.
    • Competition: Other privacy coins like Monero and new privacy technologies built on networks like Ethereum are all competing for the same market.

    Conclusion: A Long-Term Bet on Privacy

    Zcash is more than just another cryptocurrency; it’s a bet on the future importance of financial privacy. The recent price surge is exciting, but the long-term story is what truly matters. The project faces significant hurdles, particularly on the regulatory front, but its powerful technology and a clear roadmap for improvement give it a fighting chance.

    For investors with a long time horizon and a belief that privacy will become an increasingly valuable commodity, Zcash offers a compelling and asymmetric opportunity. The road to 2036 will be long and volatile, but for ZEC, the ultimate destination depends on its ability to become the standard for private, digital cash.

    Frequently Asked Questions (FAQ)

    1. Is Zcash a good long-term investment?
    Zcash can be considered a high-risk, high-reward long-term investment. Its success depends heavily on your belief in the growing need for financial privacy and the team’s ability to execute its roadmap, including the move to Proof-of-Stake.

    2. What is the biggest risk for Zcash?
    The single biggest risk is regulatory action. Governments and financial regulators have historically been wary of privacy-enhancing cryptocurrencies, which could lead to delistings from exchanges or other restrictions that hinder adoption.

    3. Will Zcash ever reach $5,000?
    Reaching $5,000 is possible in our most bullish scenario for 2036. It would require massive adoption of its privacy features, a flawless transition to PoS, a favorable regulatory environment, and significant growth in the overall cryptocurrency market. It is a very optimistic target.

    4. How does the move to Proof-of-Stake affect the ZEC price?
    The move to PoS could positively affect the price by introducing staking rewards, which creates a new incentive for people to buy and hold ZEC. It also makes the network more scalable and energy-efficient. However, the transition itself carries technical risks that could negatively impact the price if not handled perfectly.

    Not financial advice. Do your own research.
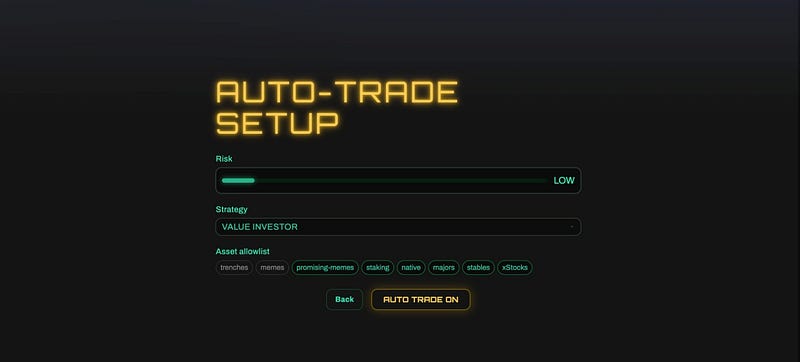
    Superverse (SUPER) Price Prediction: What Will SUPER Price Be in 2028?

    0

    That heart-pounding moment when a token on your watchlist suddenly surges over 50% in a single day is a feeling every crypto investor knows well. It’s a mix of excitement, curiosity, and a touch of FOMO. Right now, all eyes are on Superverse (SUPER) as it posts staggering gains, leaving many to wonder: is this a momentary blip, or the start of a much bigger move? This explosive action makes a long-term SuperVerse (SUPER) Price Prediction more critical than ever, as we look past the daily noise toward the potential in 2028.

    Whether you’re holding a bag, considering an entry, or just trying to understand the hype, you’re in the right place. We’ll break down the fundamentals, analyze the current frenzy, and map out what the future could hold for this Web3 gaming contender.

    TL;DR: Quick Forecast

    • Current Momentum: Superverse is experiencing a massive short-term price surge, with over 50% gains in 24 hours. This indicates high speculative interest and volatility.
    • 2028 Price Scenarios: Our analysis projects a wide range for SUPER by 2028, from a bearish outcome of $0.50 to a highly bullish peak of $15.00, with a base case sitting around $3.00 to $7.00.
    • Key Growth Drivers: The project’s success hinges on the adoption of its Web3 gaming technology, the overall health of the crypto market, and its ability to attract both developers and players to its ecosystem.
    • Major Risks: Intense competition from other gaming platforms and the inherent volatility of the crypto market are the primary risks to consider.

    What is Superverse (SUPER)?

    Before we dive into price charts and market caps, let’s have a quick refresher. Superverse isn’t just a single game or token; it’s a comprehensive Web3 ecosystem designed to power the next generation of crypto-native games.

    Think of it as having two main pillars. First, it’s a technology provider, offering a protocol and tools (like their G-Proto platform) for developers to build and launch their own Web3 games. This is its “infrastructure” play. Second, it develops its own games and NFT collections, like the popular “Impostors,” to build and engage a native community. The SUPER token is the glue that holds this ecosystem together, used for governance, staking, and transactions.

    Current Market Conditions: Interpreting the Surge

    The numbers right now are telling a story of intense, almost frantic, market activity. With a current price of $0.795752, SUPER has rocketed up an astonishing 54% in the last 24 hours. Even more telling is the 48% jump in just the past hour, which suggests a major catalyst or a short squeeze is in play. This isn’t slow, organic growth; this is a market event.

    The 24-hour trading volume of over $112 million is massive relative to its nearly $494 million market cap. A volume-to-market-cap ratio of over 22% signifies incredibly high turnover and liquidity. Traders are moving in and out of positions rapidly. While this is exciting, it’s also a clear sign of heightened risk. Such parabolic moves are often followed by sharp corrections as early traders take profits. The challenge for long-term investors is to see beyond this volatility and assess the project’s underlying value.

    On-Chain & Narrative Drivers

    To understand where SUPER could go, we need to look at the forces that could propel it. The most powerful driver is the “Web3 Gaming” narrative. In the 2021 bull run, gaming tokens like Axie Infinity and The Sandbox saw meteoric rises. If that sector ignites again in the next cycle, Superverse is well-positioned to capture a piece of that momentum.

    While we don’t have a live feed of its on-chain data, a healthy Superverse ecosystem would be characterized by a steady increase in active wallets interacting with its games and marketplace. We’d also look for a growing number of developers building on its protocol. These fundamental metrics are far more important for long-term success than a single day’s price action. The project’s ability to create a “sticky” ecosystem, where players stay for the fun and developers stay for the tools, will be the ultimate catalyst.

    SuperVerse (SUPER) Price Prediction for 2028

    Forecasting four years into the future is an exercise in structured speculation, not certainty. By 2028, we will have likely experienced another Bitcoin halving (in 2024) and the subsequent market cycle. Our predictions are based on how Superverse might perform within that broader context.

    Bearish Scenario: $0.50 – $1.50

    In a bearish scenario, the Web3 gaming hype doesn’t return with the same force it had in 2021. Superverse struggles to attract top-tier game developers, and its own games fail to retain a large user base. The project makes slow progress on its roadmap, and intense competition from more established platforms squeezes its market share. In this world, SUPER’s value would be driven purely by its existing community and limited utility, likely struggling to hold onto gains and potentially retesting lower support levels from previous years.

    Base Scenario: $3.00 – $7.00

    This is our most probable SuperVerse (SUPER) Price Prediction. In this future, the project successfully executes its roadmap. Its G-Proto platform becomes a respected, go-to solution for a niche of indie Web3 game developers. The next crypto bull market arrives, and while perhaps not as explosive for gaming as in 2021, it lifts all boats. Superverse carves out a solid position, achieving a market capitalization in the $2 billion to $4 billion range, reflecting steady growth and real-world adoption. This would translate to a significant price increase from current levels.

    Bullish Scenario: $8.00 – $15.00+

    The bullish case sees Superverse becoming a dominant force in Web3 gaming. It either launches a breakout, viral game that captures the mainstream imagination or its platform becomes the undisputed standard for launching new blockchain games, akin to a decentralized Steam. Major partnerships with traditional gaming studios could also fuel this fire. In a full-blown crypto bull market, SUPER’s market cap could challenge the 2021 peaks of projects like Axie Infinity (around $10 billion), pushing its price into the double digits.

    A Simple Valuation Model

    Let’s try a quick “back-of-the-envelope” calculation to ground these scenarios.

    • Assumption 1: Future Circulating Supply. SUPER has a total supply of 1 billion tokens. By 2028, after more tokens have vested, it’s reasonable to assume a circulating supply of around 800 million.
    • Assumption 2: Comparable Market Cap. During the 2021 peak, Axie Infinity (AXS) hit a market cap of nearly $10 billion, and The Sandbox (SAND) reached about $7.5 billion.

    Now, let’s do the math:

    • Base Case Valuation: If SUPER reaches a respectable $3 billion market cap, the price would be:
      $3,000,000,000 / 800,000,000 tokens = $3.75 per SUPER
    • Bull Case Valuation: If SUPER achieves a blockbuster $10 billion market cap, rivaling AXS at its peak, the price would be:
      $10,000,000,000 / 800,000,000 tokens = $12.50 per SUPER

    This simple model shows that the price targets in our base and bull scenarios are entirely plausible if Superverse can capture a significant slice of the Web3 gaming market.

    Risks and What to Watch

    Investing in SUPER is not without its risks. The Web3 gaming space is fiercely competitive, with established players like Gala, Immutable, and Beam all vying for the same pool of developers and players. Execution risk is also a major factor; the team must deliver on its ambitious promises.

    Here’s what to keep an eye on:

    • Roadmap Progress: Are they hitting their development milestones on time?
    • Developer Adoption: Are new projects announcing they are building on Superverse?
    • Player Engagement: Are the daily active users for their games growing?
    • Broader Market Sentiment: SUPER’s price will always be heavily influenced by the direction of Bitcoin and the crypto market as a whole.

    Conclusion: A High-Potential Play in a Competitive Arena

    Superverse is a fascinating project with enormous potential. Its dual approach of building both its own games and the underlying infrastructure for others is a smart strategy. The recent price explosion demonstrates that the market is paying close attention.

    However, today’s volatility is a reminder of the high risks involved. The road to 2028 will be long, and success is far from guaranteed. The long-term value of SUPER won’t be determined by a single day of frenzied trading but by years of consistent building, community growth, and the creation of games that are genuinely fun to play. For now, the best next step is to watch how the project develops, track its user metrics, and keep an eye on the broader Web3 gaming narrative.

    FAQ

    Is SUPER a good investment today?
    Given its recent 50%+ surge, SUPER is currently a high-volatility asset. It presents a high-risk, high-reward opportunity. A new investment at this level carries significant short-term risk of a price correction. Your decision should depend on your personal risk tolerance and investment horizon.

    What could make the Superverse (SUPER) price go up?
    Major catalysts would include the launch of a highly successful game on its platform, significant partnerships with established gaming companies, a surge in developer adoption of its G-Proto technology, and a new bull market cycle focused on Web3 gaming.

    How does the Superverse project generate revenue?
    Superverse can generate revenue through multiple streams, including transaction fees on its NFT marketplaces, fees charged to developers using its gaming infrastructure, and direct revenue from its in-house game titles and NFT sales.

    What is the maximum supply of SUPER tokens?
    The maximum and total supply of SUPER is capped at 1,000,000,000 tokens.

    Not financial advice. Do your own research.