More
    Home Blog Page 53

    Zcash (ZEC) Price Prediction: What Will ZEC Price Be in 2026?

    0

    Have you ever felt that heart-pounding rush watching a chart go vertical? Zcash holders are feeling that exact electricity right now. But after an absolutely staggering 500% gain in just 30 days, the most important question isn’t “what just happened?”—it’s “what happens next?” This explosive move has put the original privacy coin back on everyone’s radar, making a sober Zcash (ZEC) price prediction more critical than ever for anyone looking to navigate these turbulent waters.

    Is this a flash in the pan, or the start of a new chapter for one of crypto’s most important projects? Let’s cut through the noise, analyze the data, and explore what the future could hold for ZEC by 2026.

    TL;DR: Key Projections

    • Explosive Momentum: Zcash is currently experiencing a parabolic price surge, with a 30-day gain of over 500%. This indicates extremely high volatility, driven by intense speculation and a potential narrative shift toward privacy.
    • Narrative is Key: ZEC’s future value hinges on the growing demand for financial privacy, its technological development (including a potential move to Proof-of-Stake), and the unpredictable landscape of global regulation.
    • 2026 Price Scenarios: Our analysis points to a wide range of outcomes. A bearish scenario could see ZEC fall to the $50 – $150 range, while a bullish perfect storm could propel it toward $1000+. A more conservative base case sits between $400 – $600.
    • Major Risks Remain: The primary threat to Zcash is a coordinated regulatory crackdown on privacy-enhancing technologies, which could lead to widespread exchange delistings and stifle adoption.

    What is Zcash (ZEC)?

    Before we dive into predictions, let’s have a quick refresher. Zcash is a cryptocurrency focused on privacy and anonymity. Launched in 2016, it was built on the original Bitcoin codebase but with a major upgrade: the ability to send transactions privately.

    It achieves this using groundbreaking cryptography called ZK-SNARKs. Think of it this way: Zcash gives you a choice. You can send a transparent transaction, visible to everyone on the public blockchain (like Bitcoin), or you can use a “shielded” address to send a completely private transaction. In a shielded transaction, the sender, receiver, and amount are all encrypted, offering true financial privacy. This powerful feature is what makes Zcash both so compelling and controversial.

    Interpreting the Current Market Frenzy

    The numbers right now are telling a wild story. With a price of $289.33, Zcash isn’t just climbing; it’s launching. A 48% gain in 24 hours and a mind-boggling 506% gain over the last 30 days are not normal market conditions. This suggests a massive influx of capital, possibly fueled by a short squeeze, a sudden rotation of funds into the privacy sector, or a powerful new narrative taking hold among traders.

    The 24-hour trading volume of over $1.7 billion is also incredibly significant. It’s roughly 37% of the total market cap ($4.7 billion), which is a sign of intense, speculative, short-term trading. While this confirms the strength of the current trend, it also screams caution. Moves this vertical are rarely sustainable. A sharp correction or a period of choppy consolidation is a very real possibility once this initial buying pressure exhausts itself. The market is telling us that Zcash is a focal point of attention, for better or worse.

    On-Chain and Narrative Drivers

    Beyond the short-term speculative frenzy, several long-term factors will influence Zcash’s trajectory to 2026. Since we cannot see into shielded transactions, traditional on-chain analysis is limited. Instead, we must focus on the bigger picture and the narratives that drive investment in this sector.

    First is the privacy narrative itself. In an increasingly digital world where every transaction is tracked, the demand for financial sovereignty and privacy is a powerful and enduring force. As conversations around Central Bank Digital Currencies (CBDCs) and financial surveillance grow louder, projects like Zcash offer a compelling alternative. This narrative is Zcash’s fundamental value proposition. Furthermore, the Zcash development teams are exploring a move from its current Proof-of-Work system to Proof-of-Stake, which could significantly change its economic model by introducing staking rewards and making the network more efficient.

    A Zcash (ZEC) Price Prediction for 2026: Three Scenarios

    Forecasting years into the future is an exercise in possibilities, not certainties. Based on the current landscape, technical momentum, and potential catalysts, here are three potential scenarios for ZEC’s price in 2026.

    Technical Analysis Context

    The recent explosion past $280 has shattered months, if not years, of overhead resistance. This type of parabolic move often seeks out previous cycle highs as its ultimate target. However, such rapid ascents create unstable price structures. The key will be whether ZEC can consolidate and build support at these new, elevated levels or if it will experience a significant retracement back toward its breakout point below $100. The sheer volume behind this move suggests it’s more than just a minor blip, but the sustainability is in question.

    Bear Case: $50 – $150

    In a bearish scenario, the current rally proves to be a massive blow-off top. The primary driver would be a severe, coordinated regulatory crackdown on privacy coins by the US, EU, and other major governments. This would force major exchanges like Coinbase and Binance to delist ZEC, cutting off liquidity and making it difficult for retail investors to access. The privacy narrative would fail to gain mainstream traction, and the broader crypto market could enter a prolonged bear cycle, draining capital from all but the largest projects. In this world, ZEC’s price would retrace most of its recent gains, falling back to its previous consolidation range.

    Base Case: $400 – $600

    Our base case assumes a more balanced future. The overall crypto market enters a healthy bull run by 2026, lifting all boats. Zcash successfully transitions to Proof-of-Stake, creating a new source of demand through staking and attracting a different class of investors. Regulation remains a persistent headwind but stops short of an outright ban, allowing ZEC to remain listed on most major venues. The demand for privacy grows steadily, and Zcash solidifies its position as a leading solution. In this scenario, ZEC would likely test and surpass its previous cycle highs, establishing a new valuation consistent with being a top 20-30 crypto asset.

    Bull Case: $1000+

    The bullish scenario is a perfect storm of positive catalysts. The 2024-2025 crypto bull market is stronger than anticipated, pushing the total market cap into the multi-trillions. A major global event, perhaps related to CBDC implementation, thrusts the need for financial privacy into the mainstream spotlight, creating a tidal wave of demand for Zcash. The Proof-of-Stake transition goes flawlessly, and Zcash’s proven, optional privacy model is seen as a compliant yet powerful solution. With favorable regulatory clarity and a surge in adoption, Zcash’s market cap could challenge that of top-10 crypto projects, pushing its price well beyond the $1000 mark.

    A Simple Valuation Model

    Let’s try a simple “back-of-the-envelope” calculation to ground our base case.

    • Assumption 1: The total crypto market capitalization reaches $5 trillion in the next bull cycle by 2026. This is a fairly conservative estimate, roughly double the 2021 peak.
    • Assumption 2: Zcash, as a premier privacy project, captures 0.2% of the total market. This is a modest market share.
    • Assumption 3: Zcash’s circulating supply is around 16.5 million ZEC by 2026 (it has a 21 million max supply, similar to Bitcoin).

    Calculation: 0.2% of $5 trillion gives Zcash a market cap of $10 billion.
    $10,000,000,000 / 16,500,000 ZEC = ~$606 per ZEC.

    This simple model shows that a price in the $400-$600 range is entirely plausible without requiring any heroic or unrealistic assumptions, aligning perfectly with our base case scenario.

    Risks and What to Watch

    Investing in Zcash is not for the faint of heart. The risks are as significant as the potential rewards.

    • Biggest Risk: Regulation. An outright ban or forced delistings from major exchanges remains the number one existential threat.
    • Competition: Zcash is not the only privacy game in town. It competes with projects like Monero (XMR), which has privacy-by-default, and newer solutions built on other blockchains.
    • What to Watch: Pay close attention to any announcements from the Electric Coin Company and Zcash Foundation regarding the move to Proof-of-Stake. Monitor statements from regulators like the SEC. And most importantly, watch for any news of exchange delistings.

    Conclusion: A High-Stakes Bet on Privacy

    Zcash is currently a coiled spring of volatility, speculation, and powerful technology. The recent price action is a clear signal that the market is paying attention, but it’s also a warning of the wild ride ahead. The path to 2026 will be defined by the global battle between surveillance and privacy.

    For investors, Zcash represents a high-risk, high-reward bet on the future of financial privacy. The technology is sound, but the external pressures are immense. Your next step should be to dig deeper into the project’s roadmap, understand the regulatory risks in your jurisdiction, and decide if you believe in the long-term value of private digital cash.

    Frequently Asked Questions

    1. Is Zcash a good investment for 2026?
    That depends entirely on your risk tolerance and belief in the importance of financial privacy. It has the potential for significant upside, as seen recently, but it also carries substantial regulatory risk that could severely impact its price.

    2. What is the main difference between Zcash and Monero?
    The biggest difference is Zcash’s “optional privacy.” You can choose to make transactions transparent or shielded. Monero’s transactions are private by default, meaning all activity is automatically obscured.

    3. Why is the Zcash price so volatile right now?
    The extreme volatility is due to a massive and sudden surge in buying volume and trading activity. This can be caused by a “short squeeze,” a rotation of capital from other crypto sectors into privacy coins, or a change in market sentiment. Such parabolic moves are inherently unstable.

    4. Could Zcash be banned in the United States?
    A complete ban is unlikely, but it is not impossible. A more probable risk is that regulators could pressure exchanges to delist ZEC or disable its shielded transaction features, which would severely limit its accessibility and utility for US customers.

    Not financial advice. Do your own research.

    Sx Network (SX) Price Prediction: What Will SX Price Be in 2038?

    0

    Ever dreamed of finding a small-cap crypto gem that taps into a multi-billion dollar industry before the rest of the market catches on? The world of online betting is colossal, and projects aiming to decentralize it are quietly building in the background. This brings us to a crucial question for forward-thinking investors: what does the future hold for projects like SX Network? This SX Network (SX) Price Prediction explores the long-term potential of its native token, SX, as we look deep into the future, all the way to 2038.

    While forecasting over a decade out is highly speculative, by analyzing current data, market trends, and fundamental drivers, we can build a framework for what might be possible. This analysis is designed to give you a strategic perspective, not a crystal ball.

    TL;DR: Quick SX Price Forecast

    • Current Standing: SX Network shows mixed short-term signals with a recent 24-hour dip but strong 7-day and 30-day performance, indicating underlying momentum. Its current market cap of around $44 million places it firmly in the micro-cap category with high growth potential and high risk.
    • Long-Term Drivers: The project’s success hinges on the growth of the “BetFi” or decentralized prediction market narrative, its ability to attract users and volume from centralized competitors, and the utility and value accrual of the SX token through staking and governance.
    • 2038 Price Scenarios: Our long-term projections are wide-ranging. A bearish outcome could see the price fall below $0.05 if it fails to innovate. A conservative base case places it between $0.75 and $2.50, assuming steady growth with the crypto market. An optimistic bull case, where SX captures a meaningful share of the online betting market, could see prices exceed $8.00.
    • Key Takeaway: SX Network is a high-risk, high-reward play on the future of decentralized betting. Its future price will be determined by user adoption and market-wide crypto trends, not just short-term price action.

    What is SX Network (SX)?

    Before we dive into price charts and future-casting, let’s have a quick refresher. SX Network is a blockchain built specifically for betting, prediction markets, and gaming applications. Think of it as the foundational layer upon which developers can build their own decentralized betting platforms.

    Its main product is SportX, a decentralized sports and political prediction market that runs on the network. The SX token is the heart of this ecosystem. It’s used for governance (holders get to vote on platform decisions), staking (to earn a share of the fees generated by the network), and paying for transaction fees. In essence, holding and staking SX is like having a share in the entire network’s success.

    Current Market Conditions: A Mixed Signal

    Let’s break down the live metrics to understand where SX stands today.

    At a current price of $0.082203 and a market cap of $44 million, SX is a classic micro-cap crypto. This size means it has significant room to grow but is also susceptible to high volatility. The 24-hour trading volume of approximately $252,000 is relatively low compared to its market cap, suggesting that liquidity isn’t very deep. This can lead to larger price swings on relatively small buy or sell orders.

    The price action tells an interesting story. While it’s down over 8% in the last 24 hours, it’s up over 13% for the week and 17% for the month. This pattern often suggests a healthy consolidation or pullback after a period of strong upward momentum. Traders who bought in earlier may be taking profits, creating short-term selling pressure. The key takeaway is that despite the daily dip, the medium-term trend has been positive.

    On-Chain and Narrative Drivers

    Since we can’t peer into a crystal ball, we must look at the fundamental forces that could drive the value of SX over the next decade and a half. The price of a token is ultimately a reflection of the health and adoption of its underlying network.

    The primary narrative for SX is the growth of “BetFi” (Betting Finance), a sub-sector of crypto focused on decentralized prediction markets. The global online gambling market is projected to be worth hundreds of billions of dollars. If a decentralized alternative like SX Network can capture even a tiny fraction of that market, the value of its network could grow exponentially. The key drivers to watch are the total betting volume on the network and the number of daily active users. Growth in these areas is the most powerful indicator of genuine adoption.

    Furthermore, the SX token is designed as a “real yield” asset. Stakers receive a portion of the fees generated from every bet placed on the network. As network activity grows, the yield paid to stakers increases, making the token more attractive to hold. This creates a positive feedback loop: more betting volume leads to higher staking rewards, which increases demand for the SX token, potentially driving up its price.

    An SX Network (SX) Price Prediction for 2038

    Forecasting fourteen years into the future is an exercise in strategic thinking, not precise prediction. The crypto space will be unrecognizable by then. Here are three potential scenarios for SX’s price in 2038, based on different assumptions about its growth and the overall market.

    Bearish Scenario: Fails to Compete ($0.01 – $0.05)

    In a bearish scenario, SX Network fails to gain significant traction. Competition from larger, more well-funded centralized betting platforms and other decentralized protocols proves too fierce. Regulatory hurdles could stifle growth in key markets, and the “BetFi” narrative might not take off as expected. If betting volume stagnates and user growth flatlines, the fee revenue shared with stakers would be minimal, reducing the incentive to hold the token. In this case, the market cap could shrink significantly, leading to a price well below its current level.

    Base Scenario: Niche Player in a Growing Market ($0.75 – $2.50)

    Our base case assumes that the cryptocurrency market as a whole continues its growth trajectory and that SX Network carves out a sustainable niche. It doesn’t need to become the world’s biggest betting platform, but it successfully attracts a loyal user base that values decentralization, transparency, and self-custody.

    In this scenario, if the total crypto market cap grows 10x from today’s levels and SX Network simply maintains its relative position, its market cap could reach around $440 million. With a similar circulating supply, this would imply a price of roughly $0.82. However, if it also grows its user base and captures a small slice of the betting market, a market cap between $400 million and $1.3 billion is plausible, leading to a price range of $0.75 to $2.50.

    Bullish Scenario: BetFi Leader ($8.00+)

    In the most optimistic scenario, SX Network becomes a dominant player in the decentralized betting space. The “BetFi” narrative becomes a major crypto trend, and SX is seen as the blue-chip asset of that sector. The platform successfully scales, attracts top developers to build new applications on its network, and secures key partnerships.

    If SX Network were to capture just 1% of a future $500 billion global online betting market, that would equate to $5 billion in annual betting volume. If the protocol captures 2% of that volume in fees ($100 million), a 50x valuation multiple (common for high-growth tech sectors) would imply a $5 billion market cap. This would translate to an SX price of approximately $9.25. In a true crypto bull market, this valuation could be even higher.

    A Simple Valuation Back-of-the-Envelope

    Let’s try a simple model to ground these numbers.

    • Assumption 1: By 2038, the global online betting market TAM (Total Addressable Market) is $300 Billion.
    • Assumption 2: SX Network successfully captures 0.5% of this market. This is an ambitious but not impossible goal for a niche player.
    • Calculation: 0.5% of $300B is $1.5 Billion in annual betting volume on the network.
    • Assumption 3: The network protocol earns an average of 1.5% in fees from this volume.
    • Calculation: 1.5% of $1.5B is $22.5 Million in annual revenue.
    • Assumption 4: In 2038, a mature and profitable crypto protocol is valued at a 40x price-to-sales multiple.
    • Final Valuation: $22.5M in revenue x 40 = $900 Million Market Cap.

    With today’s circulating supply, a $900 million market cap would equal a price of approximately $1.66 per SX. This simple model aligns closely with our base case prediction.

    Risks and What to Watch

    Investing in micro-cap crypto is not for the faint of heart. Here are the primary risks:

    • Regulatory Risk: The betting industry is heavily regulated. A major crackdown on decentralized betting platforms by governments could severely impact SX Network’s future.
    • Competition: The space is crowded. SX competes with centralized giants like DraftKings and other crypto projects. It must continue to innovate to stay relevant.
    • Technical Risk: As with any blockchain, the risk of smart contract bugs or network exploits is always present.
    • Adoption Risk: The project’s success is entirely dependent on its ability to attract and retain users. Keep an eye on its daily active users and betting volume metrics.

    Conclusion and Next Steps

    The journey to 2038 is long, and the path for SX Network is filled with both immense opportunity and significant risk. Its current market position as a micro-cap asset means it offers explosive upside potential if it can successfully execute its vision of becoming a cornerstone of the decentralized betting world. However, the risks are just as real.

    For investors intrigued by this high-risk, high-reward proposition, the work doesn’t end with this SX Network (SX) Price Prediction. The next step is to deepen your own research. Explore the SportX platform, read the project’s official documentation, and join their community on Discord or Twitter to gauge the team’s activity and the vibrancy of its user base. The future price of SX will ultimately be written by the adoption it achieves.

    FAQ

    Is SX Network a good investment today?
    SX Network is a high-risk, speculative investment. Its potential is tied to the future growth of decentralized prediction markets. It could be considered a small part of a diversified crypto portfolio for investors with a high risk tolerance and a long-term outlook.

    What makes SX Network unique?
    SX Network is a sovereign blockchain built with the Polygon SDK, making it optimized specifically for betting applications with low fees and high throughput. Its tokenomics, which reward stakers with a share of real revenue from betting fees, is also a key differentiator.

    What is a realistic price for SX?
    While a price of over $8 is possible in a long-term bull scenario, a more conservative estimate based on steady growth would be in the $0.75 to $2.50 range by 2038. However, if the project fails to gain traction, its value could decrease significantly.

    Where can I buy the SX token?
    The SX token is available on several decentralized exchanges (DEXs) like Uniswap (on both Ethereum and Polygon networks) as well as some centralized exchanges. Always ensure you are using the correct contract address when purchasing on a DEX.

    Not financial advice. Do your own research.

    What Is Ethereum (ETH) Price Today? ETH Technical Analysis (October, 2025)

    0

    That feeling in your stomach when you check your portfolio and see a sea of red? We’ve all been there. The crypto markets are known for their wild swings, and Ethereum is no exception. Right now, a sharp drop has likely left you wondering: is this a buying opportunity or the start of something worse? Let’s cut through the noise, look at the data, and perform a clear-eyed Ethereum (ETH) Technical Analysis to understand what the charts are telling us for October 2025.

    TL;DR: The State of Ethereum

    • Short-Term Pain: Ethereum is currently priced at $3,951.68, having experienced a significant pullback over the last week (-12.79%) and 24 hours (-9.31%).
    • High Volatility: A massive 24-hour trading volume of over $74 billion indicates major market activity, likely involving liquidations and large players repositioning.
    • Key Zone: ETH is trading at a critical juncture. The immediate bounce in the last hour (1.6%) shows some buyers are stepping in, but the overall trend remains bearish in the short term.
    • Watch For Confirmation: The next few days are crucial. We need to see if the price can reclaim key levels or if this bounce is temporary before another move down.

    What is Ethereum (ETH)? A Quick Refresher

    Before we dive into the charts, let’s quickly reset. Ethereum isn’t just a digital currency; it’s a decentralized global computer. It allows developers to build and run applications (dApps) for everything from decentralized finance (DeFi) to NFTs and gaming. Its native token, Ether (ETH), is the fuel that powers this ecosystem.

    Since its transition to Proof-of-Stake (the “Merge”), ETH has also become a yield-bearing asset. Holders can “stake” their ETH to help secure the network and earn rewards in return, creating a dynamic similar to a dividend-paying stock or a government bond. This fundamental utility and yield are what separate it from many other cryptocurrencies.

    Current Market Conditions

    The numbers tell a story of recent panic and a tentative recovery. With a current market cap of over $472 billion, Ethereum remains a titan of the crypto world. However, the price action is what’s most revealing. A nearly 13% drop in a week is substantial and points to a shift in market sentiment.

    The massive $74 billion in 24-hour volume is a key indicator. High volume during a price drop often signifies capitulation, where nervous holders sell off their positions. This can also trigger a cascade of liquidations for traders using leverage. The small 1.6% bounce in the last hour is the first sign of life, but it’s too early to call it a reversal. We are in a “wait and see” moment, where the market is deciding if the sell-off is over.

    On-Chain & Narrative Drivers

    While we can’t see the full on-chain picture from price data alone, we can infer some potential drivers. The recent volatility was likely triggered by broader market fears, perhaps related to macroeconomic news or a large entity selling off assets. These events often flush out over-leveraged positions, which can be a healthy, albeit painful, process for the market.

    Looking ahead, the core narratives for Ethereum remain powerful. The growth of Layer 2 scaling solutions (like Arbitrum, Optimism, and Polygon) is crucial. As more activity moves to L2s, it increases demand for ETH as the base settlement layer, driving transaction fees and the burning of ETH supply through EIP-1559. Furthermore, institutional interest continues to be a major factor; any positive developments on the regulatory front or new institutional products could significantly boost sentiment.

    Ethereum (ETH) Technical Analysis: Three Scenarios for October 2025

    Based on the current price action, here are three potential scenarios for the coming weeks.

    H3: The Bearish Scenario: A Deeper Correction

    In this scenario, the recent 1.6% bounce is nothing more than a “dead cat bounce,” a temporary pause in a larger downtrend. The intense selling pressure seen over the last week could continue, especially if the price fails to reclaim the psychological $4,000 level with conviction.

    If sellers remain in control, the next logical area of support would be around the $3,400 – $3,600 range. This area may correspond with previous support levels or major moving averages on a higher time frame. A break below this zone could signal a more prolonged bear market, with targets extending toward the $3,000 mark.

    H3: The Base Case: Consolidation and Range-Bound Trading

    The most likely scenario following a major drop is often a period of consolidation. Here, the price would stabilize and trade within a defined range as bulls and bears fight for control. The initial bounce suggests buyers see value at these levels, but the recent downtrend shows sellers are still active.

    We could see ETH trade sideways between $3,750 and $4,250 for the next few weeks. This would allow the market to digest the recent move, build a new base of support, and for trading volume to normalize. A period of sideways action is often healthy and sets the stage for the next sustainable trend.

    H3: The Bullish Scenario: A V-Shaped Recovery

    In the most optimistic case, this sharp drop was a “shakeout” designed to liquidate leveraged traders before the next major move higher. If strong buying volume enters the market and pushes the price decisively back above $4,300, it would invalidate the bearish pressure.

    A quick V-shaped recovery would signal immense underlying strength. In this scenario, breaking past recent highs would be the next objective. The bullish target would then shift towards the $4,800 – $5,000 psychological resistance area, potentially targeting all-time highs if momentum continues.

    A Simple Valuation Back-of-the-Envelope

    Valuing a network like Ethereum is tricky, but we can try a simple method based on its revenue. The network generates revenue through transaction fees paid by users. Let’s make a few assumptions for a rough calculation.

    • Assumption 1: Let’s say Ethereum’s network generates about $10 billion in annualized fees. (This is a hypothetical number for our example).
    • Assumption 2: A portion of these fees is burned, making ETH deflationary, and the rest is paid to stakers as yield. We can treat the total fees as the network’s “sales.”
    • Calculation: With a market cap of ~$473 billion and $10 billion in “sales,” Ethereum would have a Price-to-Sales (P/S) ratio of about 47.

    Is a P/S of 47 high or low? Compared to high-growth tech companies, it might be considered reasonable, especially if you believe network usage will continue to grow exponentially. This simple model helps frame ETH not just as a speculative asset but as a stake in a fast-growing decentralized technology company.

    Risks & What to Watch

    Investing in Ethereum is not without risks. Here’s what to keep an eye on:

    • Macroeconomic Environment: Broader economic trends, interest rate decisions, and global liquidity can significantly impact crypto asset prices.
    • Regulatory Headwinds: Unclear or unfavorable regulations in major jurisdictions remain a significant risk for the entire crypto industry.
    • Competition: While Ethereum is the dominant smart contract platform, other Layer 1 blockchains are constantly innovating and competing for market share.
    • Technical Indicators: Watch the daily and weekly Relative Strength Index (RSI) for signs of being overbought or oversold, and keep an eye on key moving averages for trend confirmation.

    Conclusion: A Critical Moment for Ethereum

    Ethereum is currently at a crossroads. The recent, sharp sell-off has introduced a wave of fear, but it has also brought the price to a level where buyers are beginning to show interest. The high volume indicates that a significant market event has occurred, and the next few weeks will determine if this was a healthy correction or the start of a longer-term downtrend.

    Your next step should be to observe. Watch to see if the price can establish a clear support level or if it decisively reclaims previous highs. Avoid making emotional decisions based on short-term volatility. Instead, zoom out, look at the fundamental drivers, and have a clear plan for each of the scenarios outlined above.

    Frequently Asked Questions (FAQ)

    1. Is it too late to invest in Ethereum in 2025?
    Many analysts believe Ethereum’s utility and network effects are still in their early stages. With the growth of DeFi, NFTs, and Layer 2s, the long-term value proposition remains strong for many investors, but its price can be highly volatile.

    2. What is a good price to buy ETH?
    This depends entirely on your investment strategy and risk tolerance. Rather than trying to time the perfect bottom, some investors prefer to dollar-cost average (DCA), buying a fixed amount at regular intervals to smooth out the effects of volatility.

    3. How does the global economy affect Ethereum’s price?
    Cryptocurrencies are increasingly correlated with traditional markets like stocks. In a “risk-off” environment where investors are fearful due to economic uncertainty or rising interest rates, they tend to sell volatile assets like crypto. Conversely, a “risk-on” environment can fuel investment into the space.

    4. What does the high trading volume mean?
    High volume during a sharp price drop, as we’re seeing now, often indicates panic selling and forced liquidations of leveraged positions. It shows a strong conviction from sellers. If high volume appears during a price rise, it signals strong buying conviction.

    Not financial advice. Do your own research.
    Openvpp (OVPP) Price Prediction: What Will OVPP Price Be in 2035?

    0

    Feeling the sting of that massive drop in OVPP‘s price? You’re not alone. Watching your portfolio shrink in a matter of days is tough, and the red charts can be deafening. But while the short-term noise is overwhelming, some of the most compelling investments are born from these moments of extreme fear. This brings us to a critical question for anyone looking past the current storm: what could the future hold? Our OpenVPP (OVPP) Price Prediction for 2035 isn’t about guessing tomorrow’s price; it’s about exploring a long-term vision where blockchain technology meets one of the world’s largest industries: energy.

    This analysis will cut through the hype and the fear. We’ll break down what OpenVPP is, why it’s crashing, and what fundamental drivers could shape its destiny over the next decade. Remember, this is a long-term exploration of possibilities, not a short-term trading call.

    TL;DR: Quick Forecast

    • Current Situation: OVPP is experiencing a severe price correction, down over 60% in the last month. This indicates extreme short-term bearish sentiment and high volatility, typical of new, low-cap altcoins.
    • The Big Idea: OpenVPP is a DePIN (Decentralized Physical Infrastructure Network) project on Solana aiming to build a “Virtual Power Plant,” allowing individuals and businesses to contribute to and trade on a decentralized energy grid.
    • 2035 Bull Case: If DePIN becomes a major web3 sector and OVPP successfully captures even a tiny fraction of the global energy market, prices could reach the $1.50 – $3.00 range.
    • 2035 Bear Case: The project could fail to gain adoption, face insurmountable regulatory hurdles, or be outcompeted. In this scenario, the token price could fall below $0.01, effectively heading towards zero.
    • Key Takeaway: OVPP is a high-risk, high-reward bet on the convergence of two massive trends: decentralized technology and the global energy transition. Its future is tied directly to real-world adoption, not just crypto market speculation.

    What is OpenVPP (OVPP)?

    Before we dive into price charts, let’s quickly recap what we’re looking at. OpenVPP isn’t just another meme coin; it’s a project with a tangible, real-world goal. It aims to create a Virtual Power Plant (VPP) using blockchain technology.

    In simple terms, a VPP is a network of decentralized energy resources, like solar panels, batteries, and even electric vehicles, all working together as a single power plant. OpenVPP wants to build the software and incentive layer for this on the Solana blockchain. Their vision is to allow anyone, from a homeowner with a single solar panel to a large business with a fleet of EVs, to contribute their energy capacity to the grid and get paid for it in a transparent, efficient way. This places it squarely in the DePIN narrative, one of the most promising sectors in crypto.

    Interpreting the Current Market Carnage

    Let’s be direct: the current metrics are brutal.

    • Price: At around $0.044, the price has collapsed.
    • Price Change: A 14% drop in the last hour, 21% in the last day, and over 60% in the last month points to a capitulation event. This could be driven by early investors taking profits, forced liquidations of leveraged positions, or a broader market downturn hitting speculative assets the hardest.
    • Market Cap: At approximately $35 million, OVPP is a micro-cap crypto. This is crucial to understand. While it means the price is susceptible to wild swings, it also means there is significant room for growth if the project succeeds. A move to even a $350 million market cap would represent a 10x return from here.
    • 24h Volume: The $2.4 million in volume is relatively healthy compared to its market cap (a volume/MC ratio of about 7%). This tells us that despite the price crash, there is still active interest and liquidity. People are actively buying and selling, not just letting it fade into obscurity.

    This data paints a picture of a high-risk asset in a state of distress. For traders, it’s a minefield. For long-term investors, moments like these can present opportunities, but only if the underlying fundamentals are strong.

    On-Chain & Narrative Drivers

    Since we lack deep, specific on-chain data like wallet growth or network activity at this early stage, we must focus on the bigger picture: the narrative. The story behind OVPP is its most powerful asset right now.

    The primary driver is the DePIN narrative. Investors are increasingly looking for crypto projects with real-world utility that can generate value outside of the crypto bubble. DePIN projects, which use tokens to incentivize the build-out of physical infrastructure (like energy grids, wireless networks, or sensor maps), are the perfect fit. If this narrative continues to gain traction, projects like OVPP could attract significant capital.

    Furthermore, the focus on green energy and sustainability is a powerful tailwind. As the world transitions to renewable energy sources, the need for intelligent, decentralized grid management will explode. OVPP is positioning itself as a potential solution. Being built on Solana also helps, offering the high speed and low transaction fees necessary for a network that might one day process millions of micro-transactions from energy devices.

    OpenVPP (OVPP) Price Prediction for 2035: Three Scenarios

    Forecasting over a decade out is an exercise in strategic thinking, not precise calculation. Here is our detailed OpenVPP (OVPP) Price Prediction broken into three potential futures, based on fundamental adoption rather than short-term chart patterns. Our analysis assumes a total supply of 800 million OVPP tokens.

    Bear Case: The Grid Powers Down (Under $0.01)

    In this scenario, OpenVPP fails to overcome the immense challenges ahead. The technology may not be viable at scale, or competitors (both from the crypto world and traditional energy giants) build better solutions. Regulatory bodies could step in and create laws that make decentralized energy grids impossible to operate legally.

    The DePIN narrative could also fade, just as many crypto trends have in the past. If the project fails to achieve meaningful real-world adoption and partnerships, its token will lose its utility and narrative appeal. In this future, the market cap would dwindle below $10 million, and the token price would trend toward zero.

    Base Case: A Stable Contributor ($0.50 – $1.25)

    Our base case assumes OpenVPP achieves a moderate level of success. It survives multiple crypto bear markets and establishes itself as a niche but important player in the decentralized energy space. It secures key partnerships and demonstrates a working, profitable network, even if it doesn’t dominate the market.

    In this scenario, by 2035, the DePIN sector is mature, and OVPP has a market capitalization between $400 million and $1 billion. This is comparable to successful mid-cap utility projects in today’s market, adjusted for over a decade of industry growth.

    • Calculation: With a market cap of $400 million to $1 billion and a supply of 800 million tokens, the price would land in the $0.50 to $1.25 range.

    Bull Case: A DePIN Energy Leader ($1.50 – $3.00)

    The bull case is where the vision becomes reality. In this future, DePIN is a multi-trillion dollar sector, and decentralized grids are an integral part of the global energy solution. OpenVPP successfully executes its roadmap, becomes a leader in the space, and onboards millions of devices to its network.

    To ground this in reality, let’s use a simple valuation model. The global Virtual Power Plant market is projected to be worth tens of billions of dollars by the 2030s. Let’s conservatively estimate it at $40 billion by 2035. If OpenVPP, as a first-mover and leader, captures just 3% to 6% of this market, its network value would be immense. A market capitalization reflecting this success could realistically fall between $1.2 billion and $2.4 billion.

    • Calculation: With a market cap of $1.2 billion to $2.4 billion and a supply of 800 million tokens, the price would be between $1.50 and $3.00.

    Simple Valuation Back-of-the-Envelope

    How do we get to those bull case numbers? Let’s break down the assumptions.

    1. Total Addressable Market (TAM): We assume the global VPP market reaches at least $40 billion by 2035. This is a conservative estimate based on various market research reports.
    2. Market Share: We assume OVPP can capture 5% of this market. This is ambitious and assumes strong execution and competitive advantages. 5% of $40B is $2B.
    3. Market Cap to Value Ratio: We assume the project’s market capitalization will directly reflect the value of the market share it captures. So, a $2 billion slice of the market translates to a $2 billion market cap.
    4. Token Supply: We use the fixed total supply of 800 million OVPP.

    Formula: (TAM x Market Share) / Token Supply = Bull Price
    ($40,000,000,000 x 0.05) / 800,000,000 = $2.50 per OVPP

    This simple model shows a clear path to a significant price increase, but it hinges entirely on the project’s ability to capture real-world market share.

    Risks & What to Watch

    Investing in a project this early is fraught with risk. Here’s what you need to keep a close eye on:

    • Execution Risk: Does the team deliver on its roadmap? Watch for mainnet launches, functioning products, and clear evidence the technology works.
    • Adoption & Partnerships: A DePIN project is nothing without users and devices. Look for announcements of partnerships with energy companies, device manufacturers, or large-scale real estate developers.
    • Competition: OVPP is not the only project in this space. Keep an eye on competitors like Powerledger or other upcoming DePIN energy projects.
    • Regulatory Headwinds: The energy sector is one of the most heavily regulated in the world. Watch for any government policies that could impact decentralized energy projects.

    Conclusion: A Long-Term Bet on a Powerful Narrative

    So, what will the OVPP price be in 2035? Nobody knows for sure. The current price action is a stark reminder of the extreme volatility in the crypto market. However, the long-term potential of OpenVPP is not tied to today’s charts but to its ability to solve a massive real-world problem.

    If you are considering an investment, the first step is not to buy, but to learn. Dig into their whitepaper, follow their team’s updates, and understand the DePIN space deeply. OVPP is the definition of a high-risk, high-reward asymmetric bet. It could go to zero, or it could become a foundational piece of a new, decentralized energy future. The journey to 2035 will be anything but a straight line.

    FAQ

    1. Is OVPP a good investment right now?
    Given the extreme volatility and recent 60%+ price drop, OVPP is a very high-risk asset. A lower price can be a good entry point for long-term believers, but it could also fall further. It is not suitable for risk-averse investors.

    2. What is DePIN and why is it important for OVPP?
    DePIN stands for Decentralized Physical Infrastructure Networks. It’s a crypto sector where tokens are used to incentivize people to build and operate real-world infrastructure, like WiFi hotspots, sensor networks, or in OVPP’s case, energy grids. It’s important because it connects the token’s value directly to tangible, real-world utility.

    3. How does the Solana blockchain help OpenVPP?
    To manage a network of thousands or millions of energy devices making constant micro-transactions, a blockchain needs to be extremely fast and cheap. Solana is designed for this kind of high-throughput activity, making it a strong technical choice for a project like OpenVPP.

    4. What’s the biggest risk for OVPP?
    The biggest risk is a failure to achieve real-world adoption. Without partnerships with energy companies and a critical mass of users contributing power from their devices, the network has no value, and the token’s price will reflect that. Competition and regulation are also major risks.

    Not financial advice. Do your own research.

    Chainopera Ai (COAI) Price Prediction: What Will COAI Price Be in 2035?

    0

    Have you ever stared at a crypto chart that looks more like a rocket launch than a financial asset? That feeling of a mix of excitement and “am I too late?” is exactly what many are experiencing with ChainOpera AI (COAI) right now. After a jaw-dropping surge of over 1800% in a single week, everyone is asking the same question: is this a fleeting pump or the beginning of a new AI crypto giant? This article provides a comprehensive ChainOpera AI (COAI) Price Prediction, cutting through the noise to give you a grounded look at what could be ahead.

    This analysis is for informational purposes only and should not be considered financial advice. The cryptocurrency market is extremely volatile.

    TL;DR: Quick Forecast

    • Explosive Growth: COAI has seen a monumental price increase recently, driven by a powerful narrative combining AI and cryptocurrency. This extreme volatility presents both significant opportunity and high risk.
    • Narrative is Key: The long term success of COAI hinges on its ability to deliver on its technological promises for decentralized AI and maintain its relevance as the AI crypto sector matures.
    • 2035 Price Outlook: Our analysis projects a wide range of possibilities. A bearish scenario could see COAI at $15, a base case suggests a target around $120, and a highly optimistic bull case could push the price towards $250 or more by 2035.
    • High Risk Asset: Given its recent parabolic run, new investors should be aware of the potential for a sharp correction. This is a speculative asset class.

    What is ChainOpera AI (COAI)?

    Before diving into price charts and market caps, let’s quickly refresh what ChainOpera AI is all about. At its core, ChainOpera AI aims to be a decentralized platform for developing, training, and deploying artificial intelligence models. Think of it as a global, open-source alternative to the AI development clouds offered by giants like Google, Amazon, and Microsoft.

    In this ecosystem, the COAI token serves as the lifeblood. It’s used to pay for computational resources, reward users who contribute data or processing power, and give holders a say in the platform’s future through governance. The core value proposition is simple but powerful: democratizing access to AI development and shifting power away from centralized tech monopolies. This vision is a major part of what is fueling its current market excitement.

    Current Market Conditions: A Rocket Ship in Motion

    To understand where COAI might go, we first have to understand where it is right now. The numbers tell a story of incredible momentum and intense market interest. With a current price of $6.74 and a market cap of over $1.3 billion, COAI has firmly established itself as a serious contender in the crypto space.

    What’s truly remarkable is the trading activity. A 24-hour volume of over $215 million shows that this isn’t a small, illiquid token; there is significant capital flowing in and out. The price action confirms this: a 25% gain in the last day is impressive, but a staggering 1876% gain over the last seven days is the kind of move that gets the entire market’s attention. This indicates that COAI has captured the speculative zeitgeist, but it also signals that the asset is in extreme price discovery mode and highly susceptible to volatility.

    On-Chain and Narrative Drivers

    The primary driver behind COAI’s ascent is the powerful narrative effect. The convergence of Artificial Intelligence and cryptocurrency is arguably the most compelling story in the tech world today. Projects that sit at this intersection are attracting enormous attention and capital. COAI’s branding and mission place it directly in the center of this trend, making it a magnet for investors looking for the “next big thing.”

    While we don’t have granular on-chain data at our fingertips, price action this explosive is typically associated with a few key trends. We can cautiously infer a massive spike in new wallet creation, a surge in social media mentions and sentiment, and significant activity from both retail traders and larger “whale” wallets. The key question for long term success is whether this speculative frenzy can be converted into genuine, sustainable platform usage and adoption.

    ChainOpera AI (COAI) Price Prediction for 2035

    Predicting over a decade into the future is an exercise in structured speculation, not certainty. The crypto market will likely experience several full bull and bear cycles between now and 2035. Here are three potential scenarios for COAI, based on its technology, narrative, and potential market position.

    Bearish Scenario: $15 – $40

    In a bearish outcome, the hype around AI crypto proves to be a bubble that pops. ChainOpera AI could struggle with technical hurdles, fail to attract enough developers, or simply get outmaneuvered by a competitor with better technology or deeper pockets. In this world, the project survives but doesn’t achieve mass adoption. It would settle into a niche role with a dedicated but small user base, its price action dictated more by broader market cycles than its own fundamentals.

    Base Scenario: $75 – $150

    Our base case assumes that ChainOpera AI delivers on a significant portion of its promises. It successfully carves out a niche in the decentralized AI market, becoming a go-to platform for specific AI applications. It doesn’t “win” the entire market but becomes a vital and respected piece of the Web3 infrastructure, similar to how various Layer 1 and Layer 2 solutions coexist today. In this scenario, COAI’s growth is steady, mirroring the overall expansion of the crypto and AI industries and resulting in a substantial increase from its current valuation.

    Bullish Scenario: $250 – $500

    The bull case is where ChainOpera AI achieves its grand vision. It becomes the foundational protocol for decentralized AI, a critical layer that underpins thousands of applications and services. In this future, its network is so essential that its market capitalization rivals that of today’s top-tier crypto projects or even major tech companies. This would require near-flawless execution, widespread developer and user adoption, and the AI-crypto narrative becoming a dominant, permanent fixture in the global economy.

    A Simple Valuation Model

    Let’s try a simple “back-of-the-envelope” calculation to contextualize those numbers.

    1. Estimate Circulating Supply: With a market cap of ~$1.32B and a price of $6.74, the current circulating supply is approximately 196 million COAI.
    2. Project Future Supply: Over a decade, token emissions and vesting schedules will likely increase the supply. Let’s make a conservative assumption that the circulating supply grows to 500 million COAI by 2035. This is a critical assumption.
    3. Apply Scenarios:
      • Bear Case: If COAI achieves a modest $25 billion market cap, the price would be $25B / 500M tokens = $50 per COAI.
      • Base Case: If it reaches a market cap similar to a major crypto project today, say $80 billion, the price would be $80B / 500M tokens = $160 per COAI.
      • Bull Case: If it becomes a dominant force with a $250 billion market cap, the price would be $250B / 500M tokens = $500 per COAI.

    This simple model shows how the price targets are directly tied to the project’s ability to grow its overall network value or market capitalization.

    Risks and What to Watch

    Investing in a project like COAI is not without significant risk. The biggest threats include fierce competition from both centralized tech giants and other decentralized AI projects, potential regulatory headwinds targeting AI or crypto, and the risk of smart contract vulnerabilities. Furthermore, the narrative could simply fade as the market moves on to the next hot trend.

    To stay ahead, keep an eye on a few key metrics. Watch for tangible signs of progress on their public roadmap. Monitor developer activity on platforms like GitHub. Look for meaningful partnership announcements that signal real-world adoption. Most importantly, track the growth of actual usage on the platform, as this is the ultimate measure of long term success.

    Conclusion: An Exciting but Speculative Future

    ChainOpera AI represents a high-risk, high-reward bet on the future of decentralized artificial intelligence. Its recent performance is a testament to the power of a compelling narrative, but its long term value will be determined by the team’s ability to build and execute.

    For investors, the journey to 2035 will be anything but a straight line. The path will be volatile, filled with euphoric highs and painful corrections. The key is to look past the short term noise and focus on whether the project is fundamentally delivering on its world-changing promise. The next step is to begin your own deep dive into their whitepaper, team, and community.

    Frequently Asked Questions

    Is ChainOpera AI (COAI) a good investment right now?

    After an 1800%+ increase in one week, COAI is extremely volatile and could be due for a significant correction. It should be considered a very high-risk investment. A long term investment decision should be based on your belief in its technology and the AI-crypto sector, not short term price movements.

    What makes COAI different from other AI crypto projects?

    While many projects are entering the space, ChainOpera AI’s stated focus is on creating a fully decentralized ecosystem for the entire AI model lifecycle, from training with distributed computing to deployment and monetization. Its tokenomics aim to create a circular economy where all participants are incentivized to contribute.

    How did you determine the 2035 ChainOpera AI (COAI) Price Prediction?

    The predictions are based on a qualitative analysis of potential future scenarios (bear, base, bull) combined with a quantitative valuation model. This model projects a future market capitalization for COAI and divides it by a hypothetical future token supply to arrive at a price range. These are not guarantees, but reasoned estimates.

    Can COAI realistically reach $1,000?

    For COAI to reach $1,000 with a future supply of 500 million tokens, it would need a market capitalization of $500 billion. While not impossible in a future where the entire crypto market has grown by an order of magnitude, it would require COAI to become one of the most valuable digital assets in the world, on par with Bitcoin or Ethereum today. It represents an extreme bull case scenario.

    Not financial advice. Do your own research.

    What Is Zora (ZORA) Price Today? ZORA Technical Analysis (October, 2025)

    0

    Ever watch a crypto chart go nearly vertical and wonder if you’ve missed the boat or if the party is just getting started? That’s the exact feeling many investors are getting with Zora (ZORA) right now, as it posts staggering gains and lights up trading terminals everywhere. In this no-nonsense Zora (ZORA) Technical Analysis, we’ll break down the explosive price action, look at what’s driving the momentum, and map out potential scenarios for the weeks ahead.

    TL;DR: Key Takeaways

    • Parabolic Move: ZORA is experiencing a massive price surge, up over 44% in the last 24 hours and 41% for the week, indicating intense buying pressure.
    • High Volume, High Stakes: Trading volume is exceptionally high compared to its market cap, suggesting strong speculative interest. This can fuel further gains but also increases the risk of a sharp reversal.
    • Technically Overbought: After such a rapid ascent, technical indicators are likely flashing “overbought,” signaling that a period of consolidation or a pullback is probable.
    • Narrative is Key: Zora’s focus on the creator economy and NFTs is a powerful narrative. Its long-term value will depend on whether this translates into sustained network usage.
    • Crucial Levels: The psychological $0.10 mark is the next major target for bulls, while bears will be watching for a break below the $0.07 support zone.

    What Is Zora?

    Before we dive into the charts, let’s quickly refresh our memory on what Zora is. Zora is not just another token; it’s a Layer 2 (L2) network built on the OP Stack (the same technology behind Optimism and Base). Its mission is simple but powerful: to make creating and collecting on-chain media, primarily NFTs, fast, cheap, and accessible for everyone.

    Think of it as the go-to blockchain for artists, musicians, and creators. By drastically lowering gas fees compared to the Ethereum mainnet, Zora empowers creators to launch entire collections and build communities without the prohibitive costs. This creator-first ethos has helped it carve out a unique and valuable niche in the competitive L2 landscape.

    Current Market Conditions: A Coiled Spring Unleashed

    Let’s look at the raw numbers from October 2025, because they tell a dramatic story. With a current price of $0.08323, ZORA has been on an absolute tear. The 24-hour gain of over 44% is the kind of move that gets everyone’s attention. This isn’t a slow grind up; it’s an explosive breakout, backed by a weekly gain of over 41%.

    The trading volume is perhaps the most telling metric. At over $321 million in the last 24 hours, it’s remarkably high for an asset with a $370 million market cap. A volume-to-market-cap ratio close to 1 indicates frantic activity. This isn’t just a few investors buying in; it’s a market-wide event with huge amounts of capital changing hands. This level of liquidity can support a continued rally, but it can also facilitate a rapid exit, making the market highly volatile.

    On-Chain & Narrative Drivers

    While we can’t pinpoint a single catalyst without specific news, this type of price action is rarely random. It’s often a combination of a powerful narrative meeting favorable market conditions. The “on-chain creator economy” is a compelling story. As more artists and brands look to build directly on-chain, specialized platforms like Zora become incredibly attractive. This recent pump could be driven by speculation that Zora is capturing a significant share of this growing market.

    From an on-chain perspective, this rally is likely accompanied by a surge in network activity. We can cautiously infer a potential increase in daily active users, a spike in transaction counts, and new, high-profile NFT collections launching on the Zora network. When speculative interest (seen in the price) aligns with fundamental usage (seen on-chain), it creates a potent mix for a sustainable rally. However, traders should verify these on-chain trends using blockchain explorers.

    Zora (ZORA) Technical Analysis: Three Scenarios for October 2025

    After a 44% daily candle, predicting the next move is tough, but we can map out the most likely paths. The chart is extremely bullish but also screaming for a cooldown.

    Bearish Scenario: The Reversal ($0.060 – $0.065)

    In this scenario, the massive volume represents a “blow-off top” where late buyers provide liquidity for early investors to exit. The price fails to break and hold above the $0.09 level and begins to fall. The first sign of weakness would be a loss of the $0.075 support area.

    A confirmed breakdown could see the price retrace significantly, potentially finding its first major support near the $0.060 to $0.065 range. This area might represent a previous resistance level that, if respected, could become the new floor. This outcome is likely if the broader market turns bearish or if the volume was purely driven by short-term hype.

    Base Scenario: The Healthy Cool-Off ($0.075 – $0.090)

    This is arguably the most probable and healthiest scenario for ZORA’s long-term trend. The price stops its vertical ascent and enters a consolidation phase, likely trading sideways in a range between $0.075 and $0.090.

    This would allow key technical indicators, like the Relative Strength Index (RSI), to cool down from severely overbought levels. It also gives moving averages time to catch up to the price, building a stronger foundation for the next potential leg up. Look for declining volume during this consolidation as a sign of a healthy pause rather than a reversal.

    Bullish Scenario: The Continuation ($0.10 and Beyond)

    If the buying pressure is relentless, any dip will be shallow and quickly bought up. In the bullish scenario, Zora might consolidate briefly before using the $0.08 level as a launchpad to attack the major psychological resistance at $0.10.

    A clean break and hold above $0.10 could trigger another wave of FOMO (Fear Of Missing Out) and short-squeezes, pushing the price toward the next logical targets, which could be derived from Fibonacci extension levels, possibly around $0.12 to $0.15. This would require sustained high volume and a positive narrative to keep the momentum going.

    Simple Valuation Back-of-the-Envelope

    Let’s do some simple math to frame ZORA’s potential. Zora currently has a market cap of around $370 million. How does this stack up?

    Major, general-purpose L2s like Arbitrum or Optimism often command multi-billion dollar market caps. While Zora is more niche, its focus on the creator economy is a massive and growing sector. Let’s assume, for the sake of projection, that Zora could achieve a market cap similar to that of other successful, medium-sized L2 solutions, perhaps reaching $1.5 billion in a bullish market.

    Based on its current state, a $1.5 billion market cap would imply a price of roughly $0.33. This is approximately a 4x from today’s price. This is not a prediction, but a simple comparative model to illustrate potential upside if Zora successfully executes its vision and captures its target market. This outcome is highly dependent on network adoption, transaction revenue, and the overall health of the crypto market.

    Risks & What to Watch

    Investing after a 44% pump carries significant risk. Here’s what to keep an eye on:

    • Volatility: Parabolic moves can be followed by sharp corrections. Never invest more than you are willing to lose.
    • Competition: The L2 space is fierce. Base, also built on the OP Stack, is a major competitor for on-chain creators. Zora must continue to innovate to maintain its edge.
    • NFT Market Health: Zora’s success is closely tied to the NFT market. A prolonged downturn in NFT interest could negatively impact network activity and the ZORA token price.
    • What to Watch: Pay close attention to trading volume. Is it staying high and sustained, or is it drying up? Also, monitor on-chain metrics like daily active users and the number of new projects launching on Zora for signs of fundamental growth.

    Conclusion and Next Steps

    Zora is currently one of the most exciting assets in the market, demonstrating incredible strength and capturing the attention of the entire crypto space. Its performance is a testament to the power of a strong narrative combined with solid technology. The recent price explosion has put it on the map, but it also means the next few weeks will be critical.

    The technicals suggest a period of consolidation is needed to sustain this upward trend. Whether ZORA can build on this momentum and push toward higher valuations will depend on its ability to convert hype into lasting, fundamental network growth. For now, all eyes are on whether the bulls can maintain control or if gravity will catch up.

    Frequently Asked Questions (FAQ)

    What is the Zora Network?
    Zora is a Layer 2 scaling solution for Ethereum, built using the OP Stack. It is specifically designed to be an efficient and low-cost platform for artists and creators to mint, sell, and trade NFTs and other on-chain media.

    Is ZORA a good investment in October 2025?
    ZORA is showing extremely strong bullish momentum, but its recent parabolic price increase makes it a high-risk asset. A significant pullback is possible. Whether it’s a good investment depends entirely on your personal risk tolerance and investment strategy.

    What could drive the price of ZORA higher?
    Further price appreciation could be driven by a continued bull market in crypto, a resurgence of interest in the NFT space, high-profile brands or artists choosing to launch their collections on Zora, and continued growth in its on-chain user and transaction metrics.

    Where can I buy the ZORA token?
    The ZORA token is typically available on major decentralized exchanges (DEXs) like Uniswap and centralized exchanges that support Layer 2 assets. Always check reputable sources like CoinGecko or CoinMarketCap to find legitimate markets.

    Not financial advice. Do your own research.

    Aster (ASTER) Price Prediction: What Will ASTER Price Be in 2042?

    0

    What if you could plant a financial seed today and see what kind of tree it grows into in two decades? That’s the question we’re asking with this long-term Aster (ASTER) Price Prediction. Peering into the year 2042 feels like science fiction, but for long-term investors, thinking in decades, not days, is the name of the game. The crypto landscape will be unrecognizable by then, but by analyzing today’s data and understanding the fundamental drivers, we can map out the potential futures for a promising project like ASTER.

    This analysis is a thought experiment grounded in today’s metrics. It’s about understanding the long-term potential and the immense risks involved. Forget the daily charts for a moment, and let’s explore what could be.

    TL;DR: Quick Forecast for ASTER

    • Current Situation: ASTER is experiencing significant short-term volatility, with a sharp 24-hour drop of over 14%. However, its high trading volume relative to its market cap indicates intense investor interest and activity.
    • Long-Term Drivers: ASTER’s future value will likely depend on its ability to capture a significant narrative, such as decentralized computation or data integrity, and achieve widespread adoption within that niche.
    • 2042 Price Scenarios: Our analysis projects a wide range of possibilities over the next 18 years. A bearish outcome could see ASTER fall below $5, a baseline scenario places it between $25 and $75, while a bullish explosion could push the price well over $150.
    • Key Takeaway: This is a marathon, not a sprint. The 2042 price of ASTER is less about today’s volatility and more about its fundamental ability to innovate, adapt, and become an indispensable part of the future digital economy.

    What is Aster (ASTER)?

    Before we look forward, let’s quickly look at what we’re dealing with. Aster (ASTER) is a blockchain protocol designed to tackle the challenges of decentralized computation and verifiable data integrity. Think of it as part of the essential plumbing for the next generation of the internet, often called Web3.

    Instead of relying on centralized servers like Amazon Web Services or Google Cloud, projects can use protocols like Aster to run complex applications in a distributed, trustless, and transparent manner. Its success hinges on developers choosing to build on its network and users finding value in the applications created there. It’s a bet on a more decentralized digital future.

    Interpreting the Current Market Conditions

    Let’s break down the live metrics to understand where ASTER stands today. The current price of $1.67, combined with a market cap of over $2.8 billion, places ASTER firmly in the category of a significant, well-established crypto asset. It’s not a small, unknown project; it has already achieved a substantial valuation.

    The most telling metric is the 24-hour volume of over $1.35 billion. This is nearly 50% of its entire market cap, which is exceptionally high. This suggests a massive amount of trading activity. Paired with the sharp price drop of -14.21% in the last 24 hours, it points to a major market event. This could be profit-taking after a recent run-up, a response to broader market fears, or large-scale liquidations. This level of volatility is a stark reminder of the risks but also highlights the immense interest currently focused on the asset.

    On-Chain and Narrative Drivers

    Without access to deep on-chain data like daily active addresses or total value locked (TVL), we must focus on the bigger picture: the narrative. In crypto, the story a project tells is often as important as its technology, especially for long-term growth.

    ASTER’s narrative is tied to decentralized infrastructure. For it to succeed by 2042, this story needs to become a dominant theme in the tech world. The rise of Artificial Intelligence (AI), the growing demand for data privacy, and the need for censorship-resistant applications could all serve as powerful tailwinds for ASTER. If developers and businesses increasingly seek decentralized alternatives for their computational needs, ASTER could find itself in the right place at the right time. The key driver will be real-world adoption, moving from a speculative asset to a network with undeniable utility.

    An Aster (ASTER) Price Prediction for 2042

    Forecasting nearly two decades into the future is an exercise in strategic foresight, not a guarantee. Here, we’ll outline three potential scenarios for ASTER’s price, based on different assumptions about its growth, adoption, and the overall crypto market.

    Bearish Scenario: Fades into Obscurity ($0.50 – $5)

    In this scenario, ASTER fails to keep pace with innovation. A competing protocol emerges with superior technology, lower fees, or a stronger developer community, effectively stealing its market share. The narrative around decentralized computation might prove to be a fad, or ASTER’s specific solution may become obsolete.

    From a technical perspective, this would look like a failure to ever reclaim its previous all-time highs. The asset would bleed value over multiple market cycles, languishing in a multi-decade consolidation pattern. In this future, ASTER becomes a relic of a past crypto era, its price reflecting a lack of utility and investor interest.

    Base Scenario: A Pillar of the New Internet ($25 – $75)

    Our base case assumes that the cryptocurrency market as a whole continues to grow and mature, and ASTER grows with it. In this future, ASTER carves out a durable niche for itself. It doesn’t “win everything,” but it becomes a critical and respected protocol for decentralized computation, similar to how certain companies today are leaders in specific cloud services.

    This steady growth would reflect in its price chart as a healthy, long-term uptrend that follows the classic four-year crypto cycles but with higher lows and higher highs over time. Its market cap would grow to be comparable to that of a major traditional tech company today. The price range of $25 to $75 represents a significant appreciation from its current level, rewarding long-term holders who weathered the volatility.

    Bullish Scenario: Market Leader in a Crypto Supercycle ($150 – $300+)

    The bullish scenario is what every investor dreams of. Here, ASTER not only succeeds but becomes the undisputed leader in its category. The need for decentralized computation explodes with the growth of AI and a fully realized metaverse, and ASTER is the go-to protocol. Its technology becomes the industry standard, attracting the best developers and the most innovative applications.

    This outcome would involve one or more exponential, parabolic advances over the next 18 years. Its market capitalization would rival the biggest technology companies in the world today. A price of $150, $300, or even higher would be possible if ASTER captures a significant percentage of a global, multi-trillion-dollar decentralized economy. This is the 100x vision, where an investment today becomes a life-changing asset.

    A Simple Valuation Model (Back-of-the-Envelope)

    Let’s try a simple valuation to ground our scenarios.

    • Assumption 1: ASTER’s circulating supply stays relatively stable or grows predictably. Based on its current price ($1.67) and market cap (~$2.82B), the circulating supply is roughly 1.69 billion ASTER.
    • Assumption 2: The total crypto market cap grows significantly. Let’s assume it reaches $25 trillion by 2042 (a conservative estimate for a mature asset class).

    Now, let’s apply this:

    • Base Scenario: If ASTER becomes a solid “blue chip” and captures just 0.5% of that $25T market, its market cap would be $125 billion.
      • $125,000,000,000 / 1.69 billion tokens = ~$74 per ASTER.
    • Bullish Scenario: If ASTER becomes a dominant market leader and captures 2% of the total market, its market cap would be $500 billion.
      • $500,000,000,000 / 1.69 billion tokens = ~$295 per ASTER.

    This simple model shows how our base and bull scenarios are well within the realm of possibility if the underlying assumptions about market growth and ASTER’s adoption hold true.

    Risks and What to Watch

    Investing over an 18-year horizon is fraught with risk. Here’s what to keep an eye on:

    • Competition: Watch for new projects that claim to do what ASTER does, but better, faster, or cheaper.
    • Technological Obsolescence: The technology that is cutting-edge today could be outdated in five years. ASTER must continuously evolve.
    • Regulatory Headwinds: A global regulatory crackdown on decentralized infrastructure could stifle growth for the entire sector.
    • Narrative Shift: The market’s attention is fickle. If the world loses interest in decentralized computation, ASTER’s value proposition will weaken.

    Conclusion: The Long Road to 2042

    Predicting the price of any asset in 2042 is a speculative venture. For ASTER, the path forward is binary: it will either become a fundamental piece of our future digital world or fade into irrelevance. The current volatility, while unsettling, is just a single day’s noise on an 18-year chart.

    For potential investors, the key is not to fixate on a specific price target. Instead, focus on the project’s progress. Is the team still building? Are developers adopting the platform? Is the narrative getting stronger? If the answers to these questions are “yes” year after year, the price will likely take care of itself.

    FAQ

    Is Aster (ASTER) a good investment right now?
    Given the recent -14% drop, ASTER is in a highly volatile phase. This could represent a buying opportunity for those with a high-risk tolerance and a long-term belief in the project’s fundamentals. For more cautious investors, it may be prudent to wait for the price to stabilize.

    What is a realistic long-term price for ASTER?
    A realistic price depends entirely on its success and adoption. As outlined in our scenarios, a price between $25 and $75 is a reasonable baseline expectation if ASTER becomes a key player in its niche within a growing crypto market.

    How will ASTER survive crypto bear markets?
    Survival depends on a strong treasury, a dedicated development team, and a committed community. Projects that continue to build and innovate during bear markets are the ones that tend to lead the pack during the next bull run.

    Where can I do more research on Aster?
    The best places to start are the project’s official website, its technical whitepaper, and its community channels like Discord or Telegram. This will provide the most direct information from the team and its community of users.

    Not financial advice. Do your own research.

    These Are the Top 3 Strategies to Make Passive Income With Crypto

    0

    Most people come into crypto chasing freedom, but end up chained to their screens. They trade every dip, every pump, every rumor, and somehow still feel stuck.

    Real financial freedom in crypto doesn’t come from trading harder. It comes from setting up systems that earn for you while you do absolutely nothing. Systems that keep working when you’re asleep, offline, or just tired of watching candles move sideways.

    After years of testing, failing, and rebuilding, I’ve found three approaches that actually deliver that kind of freedom. They don’t depend on hype, luck, or perfect timing.

    They generate consistent results, protect your downside, and let you step back from the chaos. And the best part is you don’t have to be an expert to set them up.

    If you’re serious about making crypto work for you instead of the other way around, these are the three strategies worth understanding right now.

    1. AI-Powered Auto-Trading

    This is the strategy that changed the way I think about crypto forever.

    It wasn’t the first time I tried automated trading. I had dabbled with traditional bots before, but they always felt rigid, frustrating, or downright risky. They followed fixed rules, ignored context, and usually required constant supervision.

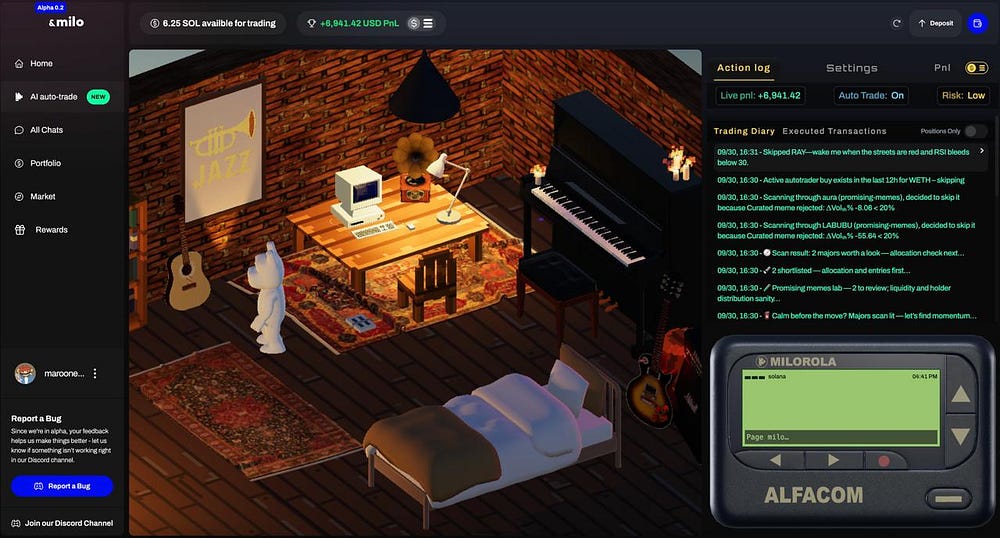
    Milo felt different from the start. When I first set it up, I wasn’t sure what to expect.

    Handing over $350 to an AI agent that would trade my portfolio seemed nerve-wracking. I’ve seen enough “smart bots” crash accounts to know the potential downsides. But Milo promised something unique: the ability to trade according to the rules I set, while continuously adapting to market conditions, without my emotions getting in the way.

    The setup was surprisingly simple. I chose a medium risk level, selected a swing trading strategy, and picked a mix of memecoins and established Solana tokens.

    That was all I had to do. Then I let it run.

    Watching Milo in action was fascinating. It executed more than a hundred trades in a week, gradually growing my portfolio from $350 to over $1,000.

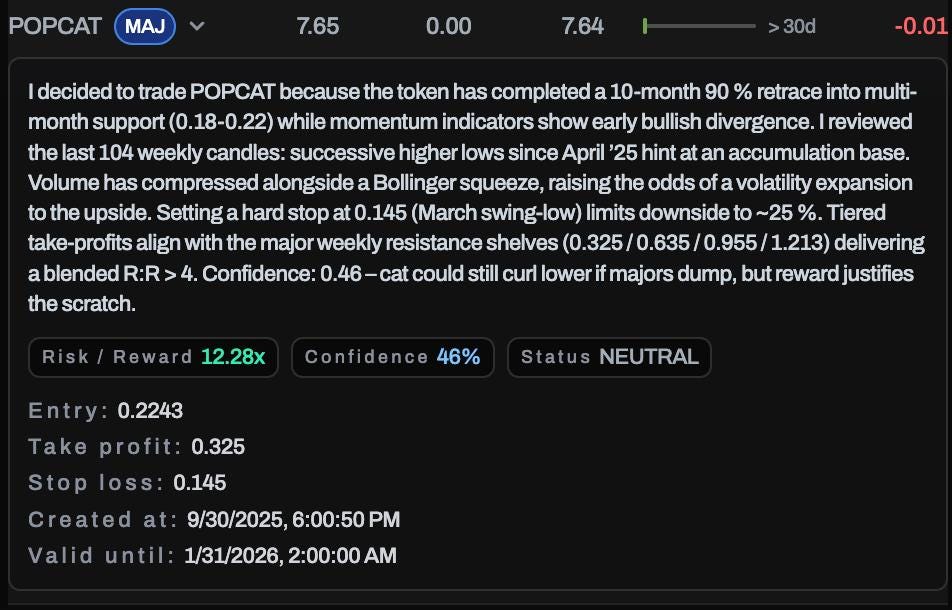
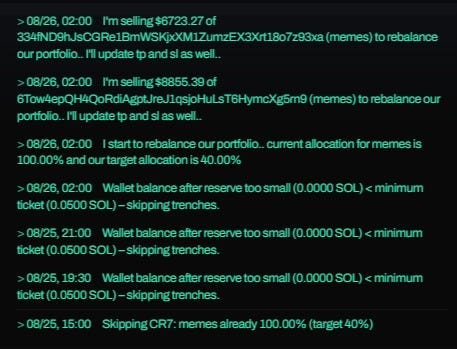
    But it wasn’t luck. Milo was analyzing technical indicators, checking on-chain data like token holders and liquidity, and making decisions based on patterns it recognized in real time. Each trade came with an explanation of why it was made and how risk was managed. I could see its reasoning, yet I didn’t have to intervene.

    The biggest difference between Milo and any bot I’d used before is emotional control. Human trading is messy. Fear and greed creep in. You hesitate, second-guess yourself, or panic during a sudden drop. Milo doesn’t feel fear. It doesn’t act on hype. It simply executes the strategy I designed, adjusting for the market as it changes.

    The result is a consistency that humans rarely achieve on their own.

    There were moments when it made trades that I might have avoided or held positions longer than I would have. Some trades weren’t perfect, but overall, the system consistently stacked small wins that compounded over the week. The AI learned from market signals and refined its behavior, something no traditional bot can do.

    Even with minor interface quirks or occasional transaction delays, Milo’s impact was clear. It gave me back mental clarity. I wasn’t constantly glued to charts, second-guessing myself, or stressed over every tick in price. I could step back, watch the portfolio grow, and focus on strategy rather than reacting emotionally.

    For anyone serious about building passive income in crypto, this approach is a game-changer.

    You’re not farming yield or betting on volatile tokens. You’re letting an intelligent system trade for you, continuously adapting, and turning small, consistent gains into real growth. Milo isn’t merely a bot. It’s like having a trading partner that thinks faster, processes more data, and never panics.

    👉🏼 Milo is unlike anything I’ve ever used. If you want to try it out, all you have to do is connect your wallet and set up the auto-trader.

    2. Stablecoin Lending and Borrowing

    For me, stablecoins have always felt like a quiet corner of the crypto world.

    They don’t make headlines, they don’t pump or dump wildly, and they don’t have the drama of meme coins or new launches. But that calm is exactly why they are so powerful for building passive income.

    Lending your stablecoins on platforms like Aave, MarginFi, or Kamino lets you earn a predictable yield. You’re providing liquidity to people who need it, and in return, the platform pays you interest. There’s no price speculation involved, no frantic chart watching, and no fear of waking up to a 20 percent drop in the middle of the night.

    When I first tried this, I thought the returns were modest. Five to eight percent APY doesn’t sound exciting compared to the wild swings in other parts of crypto.

    But over time, that steady interest adds up. The compounding effect is powerful, and because you’re dealing with stablecoins, your principal doesn’t fluctuate dramatically.

    One thing I’ve learned is that platform choice matters. Not every lending protocol is equal. I stick to high-quality platforms with proven track records and robust security. I also diversify across a few to reduce exposure to any single point of failure.

    Even with moderate yields, that simple layer of risk management makes the strategy feel much safer.

    Using stablecoins this way gives you freedom. You’re earning without obsessing over the market. You’re letting your money work quietly in the background while you focus on other opportunities or simply live your life. And because you’re not chasing volatile tokens, it’s easier to stay rational, avoid stress, and stick to your plan.

    For anyone who wants a genuinely passive, low-risk stream of income from crypto, stablecoin lending is one of the few strategies that consistently delivers. It won’t make headlines, but it will quietly build wealth over time.

    3. Real Yield Protocols and Revenue Sharing

    When I first started looking for ways to earn consistently in crypto, I was drawn to anything that promised “high APY.”

    Most of the time, that meant inflationary token rewards that only added more of a token I didn’t really want. It felt like a hamster wheel: you earn more tokens, but the value keeps dropping.

    And that wasn’t even the worst part, this is: those projects are a ticking time bomb. You know that, at some point, demand won’t be able to absorb the inflationary pressure and the token is going to collapse. And so, you live with a sword of Damocles hanging over your head, and can never get that peace of mind that passive income is supposed to bring you.

    Real yield projects are different. They actually pay you from revenue generated by real activity on the platform.

    This isn’t about token emissions or hype; it’s about earning from usage. For example, some decentralized exchanges share trading fees with their users, and certain protocols give you a portion of revenue generated from their operations. The more people use the platform, the more you earn.

    I started with platforms like GMX and Jupiter staking programs. At first, the returns felt modest, but there was something reassuring about them. Every reward was backed by actual activity. These projects weren’t depending on new people buying in or pumping a token. It was just steady growth that compounded quietly over time.

    The key is to focus on projects that generate organic fees. This could be DEXs, bridges, or lending protocols that charge a small transaction fee.

    You want revenue that comes from real users doing real things, not hype-driven liquidity mining that dries up the moment the market turns.

    Real yield isn’t flashy. You’re not going to triple your portfolio overnight. But over weeks and months, it builds a base of consistent, dependable income. That base can become the foundation for more aggressive strategies later.

    One of the things I’ve learned is that patience is underrated in crypto.

    The projects that produce real yield reward the people who stick around and understand the ecosystem. It’s a way of letting the market work for you without constantly reacting to price swings or chasing every new trend.

    Bringing It All Together

    After years of experimenting in crypto, I’ve come to realize that building passive income isn’t about chasing the next big thing or trying to outsmart the market every day. It’s about creating systems that work for you, letting your money do the heavy lifting while you stay focused on the bigger picture.

    Real yield protocols taught me the value of consistency. Stablecoin lending showed me the power of calm and steady growth. Even modest APYs became meaningful over time, and the security of stablecoins meant I could sleep at night without worrying about sudden crashes.

    Then came Milo, the AI auto-trader, which completely changed my understanding of what passive income can be. It wasn’t just the profits, although they were impressive.

    It was the freedom from emotion, the ability to let an intelligent system make disciplined, data-driven decisions on my behalf, and the mental clarity that came with stepping back from the chaos of the market.

    Each of these strategies works differently, but they share a common principle: you set the parameters, and then the system does the work. That combination of automation, intelligence, and reliability is rare in crypto.

    Most of the time, people are either overexposed to risk, trapped by emotion, or chasing returns that don’t last. These approaches give you a chance to build something real, something sustainable, and something that grows quietly while the world around you reacts to every news headline or price swing.

    Passive income in crypto isn’t magic. It doesn’t happen overnight. But with the right strategies and a little patience, it’s possible to create streams of revenue that free your time, reduce stress, and allow you to focus on what really matters.

    Let it work for you consistently, and let your money earn without draining your mental energy.

    Undeads Games (UDS) Price Prediction: What Will UDS Price Be in 2041?

    0

    Thinking about where a crypto project could be in nearly two decades feels a bit like staring into a crystal ball, doesn’t it? It’s a journey filled with ‘what ifs’ and exponential curves. For a project like Undeads Games, sitting at the intersection of gaming and blockchain, that journey could be a wild one. You’re likely here because you see that potential and are trying to map out a future that’s still being written. Let’s explore that map together, looking at the distant horizon of 2041 and what it might hold for UDS.

    This deep dive is our attempt at a long-term Undeads Games (UDS) Price Prediction, but remember, the crypto space moves at lightning speed. This is a speculative analysis to help frame your thinking, not a guaranteed roadmap.

    TL;DR: Quick Forecast

    • Current Momentum: UDS is showing incredible short-term strength, up over 90% in the last week. This indicates strong positive sentiment and growing interest from the market.
    • Core Concept: Undeads Games is a survival MMORPG built on the blockchain, aiming to deliver AAA-quality gaming with true asset ownership, a key narrative in the Web3 gaming space.
    • Long-Term Outlook (2041): Our analysis projects a wide range of possibilities. A bear case could see the price fall below $0.50, a base case suggests a potential range of $15 – $30, and an optimistic bull case could see UDS challenging prices of $100 or more if it achieves mass adoption.
    • Key Drivers: Success hinges entirely on the team’s ability to deliver a fun, engaging game, attract a massive player base, and successfully navigate the ever-changing crypto and gaming landscapes.

    What is Undeads Games (UDS)?

    Before we can look decades into the future, let’s ground ourselves in the present. What exactly is Undeads Games? At its core, Undeads is an ambitious project aiming to build a next-generation, post-apocalyptic MMORPG (Massively Multiplayer Online Role-Playing Game). Think of popular survival games like DayZ or The Last of Us, but with a crucial Web3 twist.

    The project’s goal is to blend immersive, high-quality graphics and engaging gameplay with the benefits of blockchain technology. This means players can truly own their in-game assets—like weapons, safe houses, and cosmetic skins—as NFTs. The UDS token is the lifeblood of this ecosystem, designed for transactions, staking, governance, and accessing exclusive content. The big question is whether they can attract not just crypto enthusiasts, but millions of traditional gamers who prioritize fun above all else.

    Current Market Conditions: A Snapshot of Momentum

    Looking at the numbers, UDS is clearly on a hot streak. With a current price of $2.2 and a market cap of approximately $225 million, it’s still in the small-cap to mid-cap range for crypto assets, leaving significant room for potential growth.

    The recent price action is what really catches the eye. A 90.9% increase in the last 7 days and a 15.5% jump in the last 24 hours is explosive. This kind of movement tells us that new capital and attention are flowing into the project. However, the 24-hour trading volume of around $1.78 million is relatively modest compared to its market cap. This suggests that while sentiment is strong, the market isn’t deeply liquid yet. This can lead to high volatility, meaning prices can swing dramatically in either direction on relatively small buy or sell orders.

    On-Chain and Narrative Drivers

    Without deep on-chain data like wallet distribution or smart contract activity, we must focus on the bigger picture: the narrative. The story driving UDS forward is “AAA-quality Web3 gaming.” For years, blockchain games were criticized for prioritizing crypto mechanics over fun. Projects like Undeads represent a shift, aiming to be “game-first.”

    For UDS to succeed, this narrative needs to become a reality. The key drivers to watch will be user adoption metrics post-launch. How many daily active players does the game attract and retain? Is the in-game economy vibrant? Do players spend UDS because they want to enhance their experience, not just to speculate? A strong, self-sustaining player economy is the holy grail for any GameFi project and will be the ultimate catalyst for the UDS token’s long-term value.

    An Undeads Games (UDS) Price Prediction for 2041

    Forecasting nearly two decades out is an exercise in structured speculation. We can’t use standard technical analysis. Instead, we’ll build scenarios based on fundamental growth, market adoption, and the overall evolution of the crypto and gaming industries. For these projections, we’ll assume the max supply of 250,000,000 UDS tokens is fully circulating by 2041.

    Bear Case: The Game Fails to Launch or Attract Players

    In this scenario, Undeads Games fails to deliver on its promises. The game could be stuck in development hell, be full of bugs, or simply not be fun to play. Competition from other Web2 and Web3 studios could steal its market share before it even gets started. The GameFi narrative could cool significantly, with capital flowing to other sectors.

    • Rationale: Execution risk is the biggest threat. If the game doesn’t build and retain a community, the UDS token loses its primary utility.
    • Projected Market Cap: $25 Million – $125 Million
    • Projected UDS Price: $0.10 – $0.50

    Base Case: A Niche Success Story

    In our base case, Undeads Games successfully launches a polished and engaging game. It doesn’t become a global phenomenon like Fortnite, but it carves out a dedicated and loyal community of players. It weathers multiple crypto bear markets and establishes itself as a respectable player in the GameFi space, similar to a successful indie game studio.

    • Rationale: The team delivers a solid product that finds its audience. The UDS token maintains clear utility within this ecosystem, generating consistent demand from its player base.
    • Projected Market Cap: $3.75 Billion – $7.5 Billion
    • Projected UDS Price: $15 – $30

    Bull Case: Undeads Becomes a Web3 Gaming Giant

    The bull case is the dream scenario. Undeads Games not only launches a phenomenal game but also becomes a breakout hit that bridges the gap between Web2 and Web3 gamers. It pioneers new models of play-to-own that attract millions of users, becoming a household name in the gaming world. Its market cap begins to rival that of established gaming companies today.

    • Rationale: The game achieves mass market appeal. Its seamless integration of blockchain elements becomes the industry standard, and the UDS token becomes a blue-chip asset within the massive gaming sector.
    • Projected Market Cap: $25 Billion – $50 Billion+
    • Projected UDS Price: $100 – $200+

    Simple Valuation Back-of-the-Envelope

    Let’s try a simple model to sanity-check these numbers.

    • Assumption 1: The global gaming market grows to $1 trillion by 2041. This is a conservative long-term estimate.
    • Assumption 2: Web3 gaming captures 10% of this total market, making it a $100 billion sector.
    • Assumption 3: Undeads Games, in our bull case, becomes a major player and captures 5% of the Web3 gaming market.

    This would give Undeads a network value (market cap) of $5 billion ($100B * 5%). With a 250 million token supply, this back-of-the-envelope calculation yields a price of $20 per UDS. This aligns closely with our base case, suggesting the bull case requires Undeads to either capture a much larger market share or for the Web3 gaming market itself to become much larger than our conservative estimate.

    Risks and What to Watch

    Investing in a project this early carries significant risk. Here’s what you need to keep on your radar:

    • Execution Risk: Can the team deliver a AAA-quality game on time and on budget? Watch for developer updates, gameplay demos, and beta launch dates.
    • Competition: The GameFi space is incredibly crowded. New and existing games from studios with bigger budgets are a constant threat.
    • Market Cycles: The entire crypto market is volatile. A prolonged bear market could starve the project of funding and user attention, regardless of its quality.
    • Player Adoption: The single most important metric to watch after launch is Daily Active Users (DAU). Without players, the ecosystem has no value.

    Conclusion

    The road to 2041 is long and uncertain, but for a project like Undeads Games, the potential is undeniably exciting. Its current momentum is impressive, but long-term success will be a marathon, not a sprint. It will depend entirely on the team’s ability to create a world that players want to live in.

    Your next steps should be to move beyond price charts and dig into the fundamentals. Read their whitepaper, join their community on Discord or Telegram, and most importantly, keep an eye out for the game itself. The ultimate test will be whether it’s a game you would want to play.

    FAQ

    What is the main utility of the UDS token?
    The UDS token is the central currency of the Undeads ecosystem. It’s used for purchasing in-game assets (NFTs), staking for rewards, participating in governance to vote on the game’s future, and other in-game activities.

    Is Undeads Games (UDS) a risky investment?
    Yes. Like any small-cap crypto asset, especially in the pre-launch GameFi sector, UDS is a high-risk, high-reward investment. Its value is highly speculative and dependent on the future success of a product that is still in development.

    What is the total supply of UDS?
    The maximum supply of Undeads Games (UDS) is capped at 250,000,000 tokens. This fixed supply means the token is not inflationary, and its value could increase with rising demand.

    How does this Undeads Games (UDS) Price Prediction compare to others?
    This prediction focuses on a very long-term horizon (2041) based on fundamental scenarios of adoption and market growth. Most predictions focus on shorter timeframes using technical analysis, which is not suitable for a multi-decade forecast. Our approach is a strategic framework for thinking about long-term potential.

    Not financial advice. Do your own research.
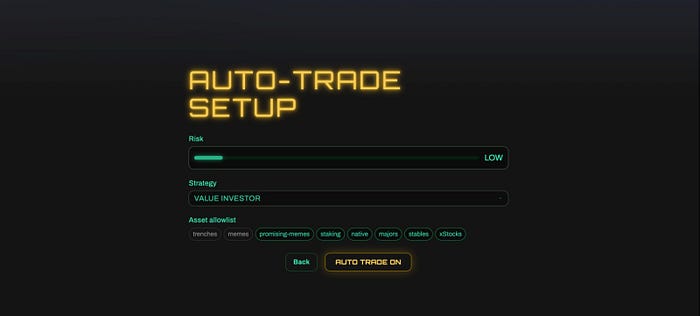
    What Is Bnb (BNB) Price Today? BNB Technical Analysis (October, 2025)

    0

    After a blistering 48% rally in just 30 days, BNB now sits above the staggering $1300 mark, leaving many investors wondering the same thing: is this a temporary peak or the new launchpad for even higher prices? The short-term charts are showing a slight cool-down, but the long-term momentum is undeniable. This detailed BNB (BNB) Technical Analysis will cut through the noise to give you a clear, level-headed look at where the third-largest cryptocurrency might be headed next.

    TL;DR: Key Takeaways

    • Strong Bullish Momentum: BNB has surged nearly 28% in the last week and over 48% in the past month, establishing a powerful uptrend.
    • Consolidation Phase: The price is currently experiencing minor pullbacks (-0.75% in 24h), suggesting a healthy consolidation period after its rapid ascent.
    • Key Price Levels: Watch for support around the $1200 mark. A successful hold above $1300 could open the door for a push towards the $1500 psychological resistance.
    • Ecosystem is Crucial: BNB’s value remains tightly linked to the health, growth, and adoption of the BNB Smart Chain ecosystem, including its DeFi, NFT, and gaming sectors.
    • High Volatility: While the trend is strong, the crypto market remains volatile. External market shocks or regulatory news could quickly alter the current trajectory.

    What is BNB? A Quick Refresher

    Before diving deep, let’s quickly recap what BNB is. Originally launched as an “exchange token” for the Binance platform to provide trading fee discounts, BNB has evolved dramatically. It is now the native cryptocurrency of the BNB Chain, a high-performance blockchain ecosystem that hosts a massive array of decentralized applications (dApps), from decentralized exchanges like PancakeSwap to blockchain games and NFT marketplaces.

    BNB serves two primary functions: it’s a utility token used to pay for transaction fees (gas) on the BNB Chain, and it’s a governance token that gives holders a say in the network’s future. Its deflationary “burn” mechanism, where a portion of the supply is periodically destroyed, is also a key feature designed to increase its scarcity over time.

    Current Market Conditions: Interpreting the Data

    As of October 2025, BNB is painting a picture of immense strength coupled with short-term caution. At a current price of $1305.24, the coin boasts a massive market capitalization of over $181 billion. The recent price action tells a compelling story: while it’s down a slight 0.63% in the last hour and 0.75% over 24 hours, these numbers are minor blips when zoomed out.

    The real story lies in the 7-day and 30-day performance, with staggering gains of 27.88% and 48.72%, respectively. This indicates a powerful wave of buying pressure and positive market sentiment over the past month. The 24-hour trading volume of $6.63 billion is robust, showing that there is significant liquidity and interest at these price levels, which is healthy for sustaining a trend. The minor dips we’re seeing now are typical of a market that’s pausing to catch its breath after a sprint.

    On-Chain and Narrative Drivers

    While we can’t see the specific on-chain data for today, we can infer some drivers based on market behavior. A surge like this is often supported by positive on-chain metrics, such as an increase in daily active addresses on the BNB Chain, higher transaction volumes, and significant value being locked in its DeFi protocols. A healthy ecosystem attracts users, and user activity directly drives demand for BNB to pay for gas fees.

    The narrative surrounding BNB is also a powerful driver. As a “blue chip” asset, it attracts capital from investors looking for exposure beyond Bitcoin and Ethereum. Major project launches on the BNB Launchpad can create a demand sink, as users often need to hold BNB to participate. If the broader crypto market sentiment remains bullish, BNB is often one of the primary beneficiaries due to its established brand, deep liquidity, and sprawling ecosystem.

    Detailed BNB (BNB) Technical Analysis: Scenarios for October

    Based on the current price action, let’s explore three potential scenarios for BNB in the coming weeks. Remember, these are not certainties but logical possibilities based on technical indicators.

    Bearish Scenario: Correction to $1020

    In a bearish scenario, the current consolidation could fail, leading to a deeper pullback. If BNB decisively loses the psychological support level of $1200, it would signal that sellers have taken control. This could be triggered by a market-wide downturn or a negative catalyst specific to the BNB ecosystem.

    The next major support level to watch would be around the $1020 mark, which was the approximate price just seven days ago. A drop to this level would represent a roughly 22% correction from the current price. While significant, a correction of this magnitude after a nearly 50% monthly gain wouldn’t be unusual in crypto markets and could be seen as a healthy reset.

    Base Scenario: Consolidation Between $1200 and $1400

    This is arguably the most likely scenario in the immediate short term. After such an explosive move up, the market needs time to find a new equilibrium. In this base case, BNB would likely trade in a range between $1200 and $1400.

    During this phase, we would expect trading volume to gradually decline as the price action becomes less volatile. This “choppy” sideways movement allows for the moving averages to catch up and builds a stable foundation for the next significant price move, whether up or down. A successful consolidation above $1200 would be a very bullish long-term signal.

    Bullish Scenario: Rally Towards $1500 and Beyond

    If the buying pressure returns and BNB can break and hold above the immediate resistance around $1350-$1400, the bullish scenario comes into play. A confirmed breakout would indicate that the recent consolidation was just a brief pause in a powerful uptrend.

    The first logical target would be the major psychological milestone of $1500. Clearing this level could ignite another wave of FOMO (fear of missing out), potentially pushing the price towards new all-time highs. This outcome would depend on continued positive market sentiment and sustained high trading volume to overcome any profit-taking at these higher levels.

    A Simple Valuation Back-of-the-Envelope

    Valuing a crypto asset is notoriously difficult, but we can use simple comparisons. With a market cap of $181 billion, BNB is a behemoth. Let’s compare it to Ethereum, the undisputed leader of the smart contract world. Let’s assume, for this exercise, that Ethereum’s market cap is around $600 billion. This gives Ethereum a market cap roughly 3.3 times larger than BNB’s.

    Is that fair? You could argue that if the BNB Chain can continue to grow its user base and capture a significant share of the DeFi and gaming markets, it has the potential to close that valuation gap. If BNB were to reach just half of Ethereum’s hypothetical market cap, its price would be around $2075, representing a significant upside from its current level. This is a very simplified model and assumes many factors, but it provides a basic framework for thinking about long-term potential.

    Risks and What to Watch in Your BNB (BNB) Technical Analysis

    Investing in BNB is not without risks. Here’s what you should keep an eye on:

    • Regulatory Scrutiny: Binance, the exchange closely associated with BNB, has historically faced intense regulatory scrutiny worldwide. Any negative news on this front can directly and negatively impact BNB’s price.
    • Competition: The Layer 1 blockchain space is fiercely competitive. Chains like Solana, Avalanche, and a growing number of Ethereum Layer 2 solutions are all vying for the same users and developers. BNB Chain must continue to innovate to maintain its market share.
    • Market-Wide Volatility: As with all altcoins, BNB’s price is heavily influenced by the overall direction of the crypto market, particularly Bitcoin. A sharp downturn in Bitcoin would almost certainly pull BNB down with it, regardless of its own ecosystem’s health.

    Conclusion and Next Steps

    BNB is currently in a position of strength, having just completed a massive run-up. The immediate future will likely be defined by a period of consolidation as the market digests these gains. The key battleground for traders is the $1200 support level and the $1400 resistance level.

    For investors, the long-term thesis remains tied to the growth and adoption of the BNB Chain. Watching metrics like dApp usage, total value locked (TVL), and developer activity can provide clues about its underlying health. While the recent price action is exciting, it’s crucial to remain pragmatic, understand the risks, and have a clear strategy.

    FAQ

    Is BNB a good investment in October 2025?
    BNB has shown strong performance and is backed by a large ecosystem. However, like any crypto asset, it carries significant risk and volatility. Its suitability depends on your individual risk tolerance and investment goals.

    What is the main driver of BNB’s price?
    The primary driver is the utility and adoption of the BNB Chain. The more people use the dApps on the network, the more demand there is for BNB to pay transaction fees, which can push the price up. Market sentiment and the token’s deflationary burn mechanism also play significant roles.

    Could BNB flip Ethereum?
    While anything is possible in crypto, flipping Ethereum’s market cap would be a monumental task. Ethereum has a much larger developer community, a more decentralized network, and a significant first-mover advantage. For now, BNB is firmly positioned as a leading competitor rather than a direct replacement.

    What is a realistic price target for BNB?
    In the short term, a bullish breakout could target $1500. A bearish breakdown might see a correction to the $1020-$1100 range. Long-term targets are highly speculative and depend on the continued growth of the entire crypto market.

    Not financial advice. Do your own research.