Ethereum trades at $1,757 on July 5, 2026, up 11% over the past week but still down roughly 64% from the August 2025 all-time high of $4,946. That is a strange place for a chain that just shipped its most important scaling upgrade in years, absorbed more than $29 billion in cumulative ETH ETF inflows, and now settles most of DeFi and rollup activity on the planet.
The question every serious trader is asking: is this the accumulation zone before the next leg up, or is Ethereum stuck in a long fade while newer L1s eat its lunch? This article works through the Ethereum price prediction 2026 case in full: the current setup, the bull catalysts (Fusaka, ETF flows, deflationary supply), the bear risks (L2 revenue drain, macro, competition), analyst targets from Standard Chartered and Citi, and clear scenario triggers that would change our view.
Key Takeaways
- ETH trades near $1,757, roughly 64% below the August 2025 ATH of $4,946.
- The Fusaka upgrade (activated December 2025) increases blob capacity up to 8x and cuts L2 fees 40 to 60%.
- Standard Chartered set a year-end 2026 target of $7,500, later revised toward the $4,000 range.
- Citi’s institutional target is $3,175. Consensus midpoint sits between $4,000 and $5,000.
- Bull case: ETF flows resume, Fusaka lifts L2 volume, ETH stays deflationary. Bear case: L2 fee drain, sticky supply issuance, and macro liquidity contraction.
- Key triggers to watch: weekly ETF net flows, ETH/BTC ratio, and daily ETH burn rate.
Where Ethereum Stands Today
Before we talk targets, look at the snapshot. Real numbers, no rounding tricks.
| Metric | Value |
|---|---|
| Current Price | $1,756.99 |
| 24h Change | -0.08% |
| 7d Change | +11.22% |
| 30d Change | +4.59% |
| 1y Change | -30.17% |
| Market Cap | $212.0B |
| 24h Volume | $11.6B |
| Rank | #2 |
| All-Time High | $4,946.05 (Aug 24, 2025) |
| % From ATH | -64.48% |
| Circulating Supply | ~120.68M ETH |
Two data points matter most here. First, ETH is up 11% in the last seven days while still down 30% year-over-year. That is a market attempting a bottom, not confirming one. Second, the ratio matters: at $1,757 with $212B in market cap, ETH’s dominance is roughly 12%, well below the 20% level it held during the 2021 cycle top.
For anyone tracking the broader market, our Bitcoin (BTC) Price Prediction 2026 covers how the ETH/BTC ratio has been the single best predictor of ETH’s next major move.
Why Is Ethereum Underperforming Right Now?
Three forces are pressing on ETH’s price at once, and understanding them is the key to reading what happens next.
Force one: L2 revenue extraction. Ethereum’s rollup-centric roadmap worked. Users moved to Arbitrum, Base, Optimism, and dozens of smaller L2s. That is great for scaling and terrible for L1 fees. Fees paid to Ethereum validators dropped sharply in 2025 and 2026, which slowed the burn mechanism and turned ETH slightly inflationary in some weeks.
Force two: ETF flow whiplash. The ETH spot ETFs launched with strong flows in 2024 and pulled in an estimated $29 billion cumulatively through mid-2026. But flows have not been consistent. Several weeks in Q2 2026 saw net outflows, and Standard Chartered analyst Geoffrey Kendrick pointed to those outflows as the reason for cutting his year-end target from $10,000 down to the $4,000 to $7,500 range.
Force three: macro liquidity. The Federal Reserve held rates higher for longer than most bulls expected. Global M2 growth cooled. Risk assets, including crypto, went through a hard correction between March and May 2026. ETH tracks liquidity more tightly than BTC does, and that shows up in the 60-day chart.
Which Catalysts Could Push ETH to $4,000?
1. The Fusaka Upgrade Is Already Live
Fusaka activated on December 3, 2025. The centerpiece is EIP-7594, Peer Data Availability Sampling (PeerDAS), which lets Ethereum scale blob capacity from an initial target of 6 blobs per block up to 48 through subsequent Blob Parameter Only (BPO) forks.
Translation: rollup fees drop 40 to 60%, which pulls transaction volume back onto Ethereum-aligned L2s and away from cheaper competitor L1s. Fidelity Digital Assets’ research note on Fusaka called this a shift where “scaling meets value accrual,” meaning the upgrade both raises usage and increases the base of activity that pays fees back to the L1.
2. Institutional Accumulation Continues Under the Surface
The retail conversation focuses on price. The institutional conversation focuses on supply. Corporate treasuries held roughly 4.10 million ETH ($17.66 billion at current prices) heading into July 2026. BitMine alone accumulated 3.6 million ETH, close to 3% of total supply. That is real coins removed from liquid float.
Cumulative ETH ETF inflows since the July 2024 launch stand near $29 billion. Even with occasional outflow weeks, the trend has been additive. When macro turns, that same pipe reverses fast in ETH’s favor.
3. Deflationary Supply Mechanics Are Structural
EIP-1559 burns a portion of gas fees. When network activity is high, ETH’s supply shrinks. This was the thesis when ETH ran to $4,946 in August 2025. It broke when L2s absorbed most transaction volume. Fusaka’s design brings that value back by cutting L2 blob costs (increasing volume) while widening the base of activity that pays into the burn.
The Bear Case: What the Bulls Do Not Want to Discuss
1. L2 Revenue Drain May Not Reverse
Fusaka lowers L2 costs. That is bullish for user experience. It is not automatically bullish for ETH price. If rollup teams pocket most of the savings rather than pass them to users, and if activity does not scale enough to compensate for lower per-transaction fees, ETH’s burn stays weak and net issuance stays positive.
2. Competition Is Real, Not Marketing
Solana crossed key milestones in 2025 and 2026 for DEX volume and app-level economic activity. Base (an Ethereum L2) increasingly monetizes independently. Newer chains like Hyperliquid captured meaningful perpetuals volume. ETH’s moat is real, but so is the drift of activity to alternatives that do not directly accrue to ETH holders.
3. Macro and Regulatory Overhangs
The Fed’s rate path, dollar strength, and the timing of any liquidity easing all matter more to ETH than to any other single crypto beyond BTC. Add regulatory uncertainty around staking rewards and the possibility of ETF rule changes, and the downside scenarios are not theoretical.
Ethereum Price Prediction 2026: Targets by Timeframe
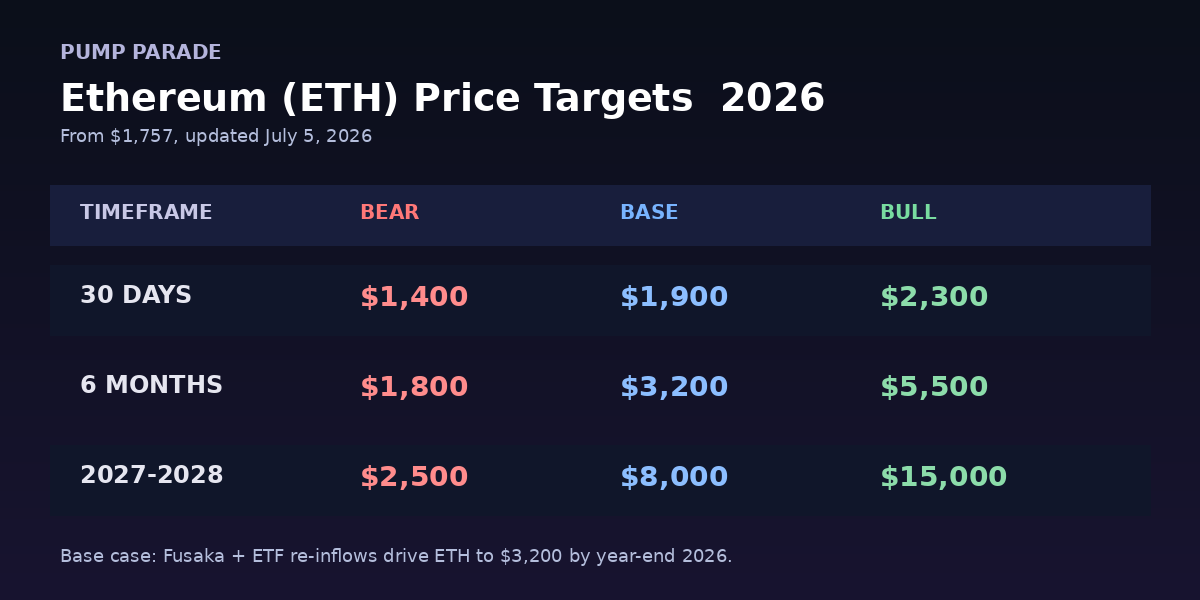
Here is how we think about the setup across three horizons. These are scenario probabilities, not price calls.
30-Day Outlook (Through Early August 2026)
- Bear: $1,400. A rejection at $1,850 followed by a break below the $1,650 support zone.
- Base: $1,900. Range-bound between $1,650 and $2,000 as macro clarifies.
- Bull: $2,300. ETF flows resume, ETH/BTC ratio breaks its 2026 downtrend, momentum builds into a summer rally.
6-Month Outlook (Through End of 2026)
- Bear: $1,800. Macro tightens further, L2 economics do not lift L1 revenue enough, ETF outflows persist.
- Base: $3,200. Fusaka effects show up in fee data, ETH re-deflates, ETFs net positive on the year.
- Bull: $5,500. All three catalysts fire together and ETH reclaims the 2024 rally structure.
Standard Chartered’s Geoffrey Kendrick has publicly targeted $7,500 for end of 2026, later revised toward $4,000 after ETF outflow weakness. Citi’s institutional target sits at $3,175. Consensus across institutional research shops clusters between $4,000 and $5,000 as the base case, with tail scenarios stretching to $9,000 in a full bull cycle.
Long-Term Outlook (2027 to 2030)
- Bear: $2,500. Slow adoption, no full recovery in ETH/BTC ratio.
- Base: $8,000. New ATH by 2028, driven by tokenized RWA growth and continued ETF absorption.
- Bull: $15,000+. Standard Chartered’s own 2030 target sits at $40,000, though that requires everything to break right.
How Does Ethereum Compare to Solana in 2026?
The most common comparison in institutional decks in 2026 is ETH versus SOL. Here is where they stand today:
| Metric | Ethereum (ETH) | Solana (SOL) |
|---|---|---|
| Price | $1,757 | $79.81 |
| Market Cap | $212.0B | $46.4B |
| 7d Change | +11.22% | -2.29% |
| Rank | #2 | #7 |
| Consensus Model | PoS, ~1M validators | PoH + PoS |
| Primary Scaling | L2 rollups + Fusaka | Monolithic + Firedancer/Alpenglow |
| ETF Status | Spot ETF live since 2024 | Spot ETF live |
| % From ATH | -64.5% | Down from ATH |
ETH is the institutional default. SOL is the retail and app-layer default. For a deeper dive into where each ecosystem is pulling ahead, see our writeup on the best DEX aggregator in 2026, which covers how liquidity is fragmenting across the two chains. And for the SOL-side of the setup, our Solana (SOL) Price Prediction 2026 breaks down the Alpenglow catalyst and Firedancer scaling story in detail.
What Would Change Our View
Three explicit triggers. If any of these fires, the base case shifts.
Upside trigger: Weekly ETH ETF net inflows above $500M for three consecutive weeks. That level historically precedes trending moves higher.
Neutral trigger: ETH/BTC ratio reclaims 0.045 and holds. That would confirm the “rotation into ETH” thesis and support the base case toward $3,200.
Downside trigger: ETH weekly burn rate drops below 3,000 ETH for four straight weeks. That signals L2 revenue extraction is winning and would validate the bear case toward $1,400.
Frequently Asked Questions
What is the Ethereum price prediction for 2026?
Consensus institutional targets for Ethereum in 2026 range from $3,175 (Citi) to $7,500 (Standard Chartered), with a midpoint around $4,000 to $5,000. Our base case sits at $3,200 by year-end, bull case at $5,500, bear case at $1,800. Actual outcome depends on ETF flows, Fusaka’s effect on fees, and macro liquidity.
Will Ethereum reach $4,000 in 2026?
Reaching $4,000 in 2026 requires three conditions: ETF net inflows turn consistently positive, Fusaka’s blob scaling translates into higher L1 fee revenue, and macro liquidity does not tighten further. All three are plausible but not guaranteed. Standard Chartered’s revised year-end target sits at $4,000 in their base case.
Is Ethereum a good investment in 2026?
Ethereum offers the strongest institutional access (ETF), the largest L2 ecosystem, and a live scaling upgrade in Fusaka. It also carries real risks: L2 revenue drain, competition from Solana and Hyperliquid, and sensitivity to Fed policy. Whether it fits your portfolio depends on your time horizon and risk tolerance, not on any single price target.
Can ETH hit $10,000 by end of 2026?
Reaching $10,000 by end of 2026 would require ETH to roughly 5.7x from current levels. That is possible in a full risk-on cycle with strong ETF flows and macro easing, but it sits outside every major institutional base case. Standard Chartered originally targeted $10,000 before revising lower on ETF outflows.
Why is Ethereum trading below $2,000?
ETH is below $2,000 for three main reasons: L2 rollups extracted transaction fee revenue from the L1, ETH ETF flows saw multiple outflow weeks in Q2 2026, and macro liquidity tightened as the Fed held rates. The Fusaka upgrade is designed to reverse the first factor.
What is the Fusaka upgrade and how does it affect ETH price?
Fusaka activated December 3, 2025. Its centerpiece EIP-7594 (PeerDAS) increases blob data capacity up to 8x, cutting L2 fees 40 to 60% and pulling more transaction volume back to Ethereum-aligned rollups. The upgrade is bullish for ETH price if higher L2 usage translates into higher L1 fee revenue and stronger ETH burns.
The Honest Take
Ethereum in July 2026 is a coin caught between two stories. The bullish story is real: Fusaka shipped, ETFs pulled in $29 billion, treasuries are accumulating, and the ETH/BTC ratio is closer to a floor than a top. The bearish story is also real: L2 revenue drain is a genuine structural issue, competition from Solana and Hyperliquid is not going away, and macro remains the dominant variable.
Our base case is $3,200 by end of 2026. That is a roughly 80% move from here. It is not a moonshot, and it is not a call to buy. It is what the data supports if the setup we described plays out. Watch ETF flows weekly, watch the ETH/BTC ratio, and watch the burn rate. Those three data points will tell you before price does whether the base case is on track or already broken.
The setup rewards patience and a plan. It punishes ape trades and price-target worship.
Disclaimer
Disclaimer: This article is for informational and educational purposes only and should not be construed as financial, investment, or trading advice. Cryptocurrency markets are highly volatile, and past performance does not guarantee future results. The price predictions and analyses presented here are based on AI models, technical indicators, and available data at the time of writing. They are not guarantees. Always conduct your own research (DYOR) and consult with a qualified financial advisor before making any investment decisions. Pump Parade and its authors do not assume liability for financial losses incurred based on information provided in this article.