

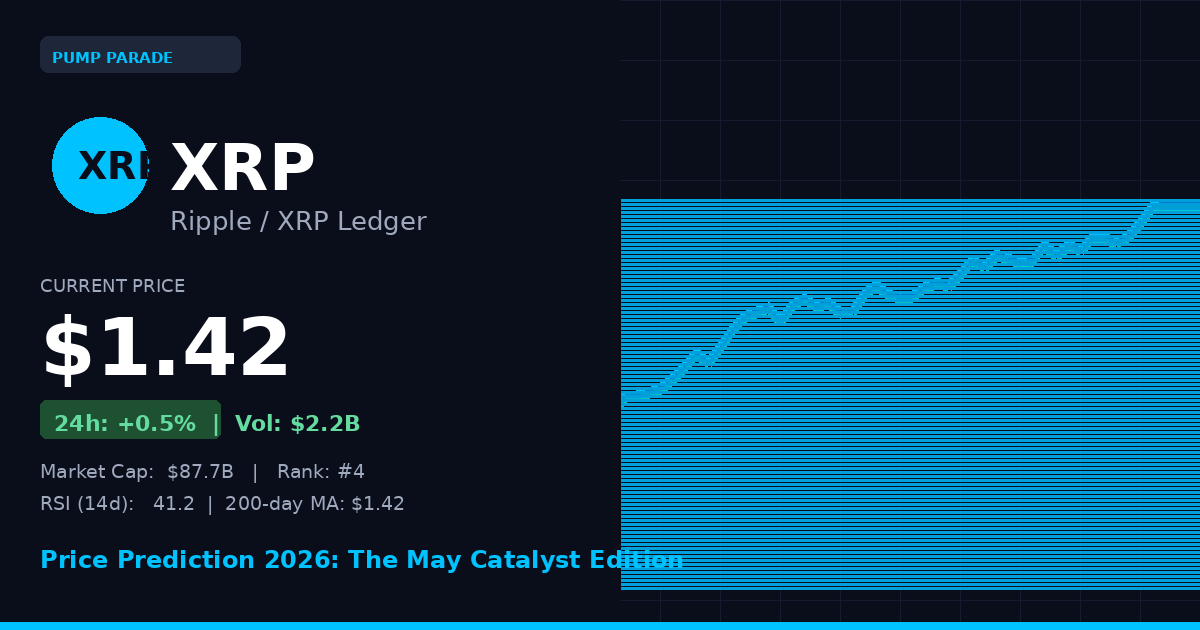
XRP is trading at $1.42 today, May 7, 2026. That puts it sitting right on its 200-day moving average, which is the line traders watch most closely to separate bull markets from bear markets. It has held. Barely.
Here is why that matters right now: today is not a normal Thursday for XRP. GraniteShares is launching its 3x leveraged XRP ETFs on NASDAQ this morning. That makes today the first time U.S. retail traders can get regulated, 3x exposure to XRP through a standard brokerage account. That is a big structural shift. And it arrives while the CLARITY Act, which would formally classify XRP as a digital commodity under federal law, faces its last Senate window before the Memorial Day recess on May 21.
May is the most catalyst-packed month XRP has seen all year. The question is whether the market actually prices those catalysts in, or whether the current neutral setup holds it range-bound.
Our hybrid AI model has been running the numbers. Here is what it found.
What Is XRP?
XRP is the native token of the XRP Ledger (XRPL), an open-source blockchain built by Ripple Labs. The network was designed from the ground up for fast, low-cost cross-border payments. A transaction on XRPL settles in 3 to 5 seconds and costs a fraction of a cent.
Unlike Bitcoin or Ethereum, XRP does not use proof-of-work or proof-of-stake mining. Instead, it uses a federated consensus mechanism. A network of trusted validators agrees on the state of the ledger every few seconds. This makes it energy-efficient and fast, but critics argue it is more centralized.
Ripple holds a large portion of XRP in escrow and releases it gradually. That has been a source of controversy for years, alongside the multi-year SEC lawsuit that alleged XRP was an unregistered security. That case settled in 2025, clearing the regulatory cloud that had kept U.S. institutions on the sidelines.
Key metrics as of May 7, 2026:
- Price: $1.42
- Market cap: $87.7 billion (ranked #4 globally)
- 24-hour trading volume: $2.2 billion
- Circulating supply: approximately 61.8 billion XRP
Technical Analysis
The chart tells a story of consolidation after a big run. XRP surged over 400% from its 2025 lows, riding the wave of SEC settlement news and the broader crypto rally. It peaked near $3.40 earlier this year. Since then, it has pulled back and is now compressing near a key technical level.
Key Support and Resistance
The 200-day moving average sits at $1.42, essentially where XRP is trading right now. This level is critical. Every time XRP has traded above its 200-day MA in past cycles, extended rallies followed. Every time it lost it, the downtrend lasted months.
Immediate support sits at $1.35 to $1.38. Below that, the next meaningful floor is around $1.20. On the upside, $1.65 is the first resistance to clear, followed by a cup-and-handle pattern target at $1.80. A break above $2.10 would shift the technical picture meaningfully bullish.
Momentum Indicators
The 14-day RSI (Relative Strength Index) reads 41.2. RSI measures momentum on a scale of 0 to 100. Below 30 is oversold, above 70 is overbought. At 41.2, XRP is in neutral territory, leaning slightly bearish. There is no momentum build in either direction right now.
The MACD (Moving Average Convergence Divergence), which tracks trend direction and strength, is slightly negative. That means short-term momentum still favors sellers over buyers. Volume has been average, which is consistent with a market waiting for a catalyst rather than acting on one.
The setup is a classic coiled spring. Tight range, neutral indicators, a big catalyst on the calendar. The breakout direction will matter a lot.
The Bull Case for XRP in 2026
The bull case here is unusually concrete. It is not built on speculation. It is built on a specific event calendar.
1. Leveraged ETFs launch today. GraniteShares is listing 3x long and 3x short XRP ETFs on NASDAQ today. This has been delayed five times since April 2. Each delay built more pent-up demand. Once live, these products give retail and institutional traders leveraged XRP exposure without touching a crypto exchange. Historically, new access vehicles drive volume and price discovery upward in the near term.
2. The CLARITY Act could pass before May 21. The Digital Asset Market Clarity (CLARITY) Act would formally classify XRP as a digital commodity under CFTC jurisdiction. That removes the remaining regulatory uncertainty for U.S. banks and asset managers. If it clears the Senate Banking Committee before the Memorial Day recess, XRP gets its biggest fundamental catalyst of the year. The cup-and-handle technical target of $1.80 becomes a near-term minimum in that scenario.
3. Ripple Prime is expanding XRP’s utility. Ripple Prime, the company’s institutional payments arm, recently added XRP as accepted collateral. That increases real-world XRP demand from financial counterparties. It is not hype. It is flow.
4. Spot ETF inflows are building quietly. Spot XRP ETFs recorded $82 million in net inflows during April 2026. That is modest compared to Bitcoin ETF inflows, but the trend is accelerating month over month. Institutional adoption is happening, just slowly.
If all catalysts land, the bull path puts XRP at $2.10 by early June and $4.00 or higher by the end of 2026.
The Bear Case for XRP in 2026
The bear case deserves equal attention. Several risks could keep XRP pinned or push it lower.
1. The CLARITY Act could stall. If the Senate does not schedule a committee vote before May 21, the bill gets shelved until fall at the earliest. That removes XRP’s biggest regulatory tailwind for the entire year. The market would likely price in that disappointment quickly.
2. Ripple’s supply overhang is real. Ripple releases 1 billion XRP from escrow each month. While they do not sell all of it, the overhang suppresses price appreciation compared to tokens with fixed supply. Long-term bulls need to model this into any price target.
3. Bitcoin correlation risk. XRP moves with Bitcoin at roughly 0.75 correlation over 90-day windows. If Bitcoin breaks below the $78,000 support level, XRP will follow lower regardless of its own catalysts. Macro risk is not XRP-specific.
4. The leveraged ETF launch could produce a sell-the-news reaction. Markets often front-run anticipated catalysts, then sell when the event arrives. If today’s ETF launch was already priced in, the price could fade rather than rally.
The bear scenario puts XRP back at $1.20 or lower if the CLARITY Act fails and Bitcoin weakens into summer. At $1.10, XRP would be testing multi-month lows and the bullish thesis would need rebuilding.
For broader context on how regulatory clarity is reshaping the entire payments token landscape, our stablecoin analysis covers the policy battle playing out across digital dollar infrastructure.
XRP Price Predictions by Timeframe
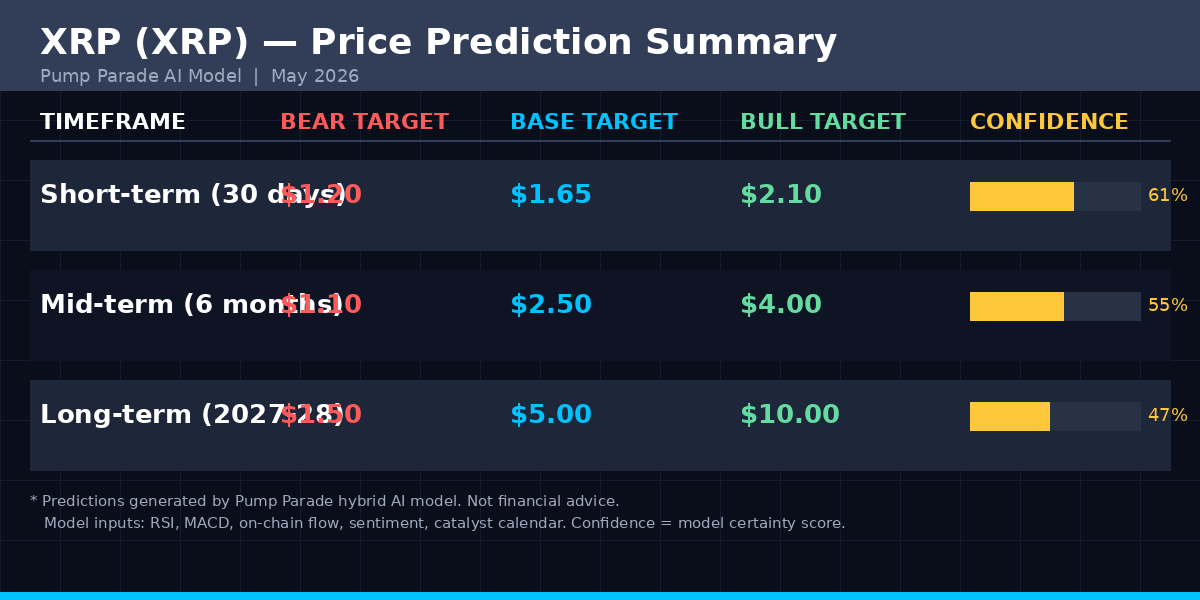
Our hybrid AI model analyzes RSI, MACD, on-chain flows, sentiment data, and the catalyst calendar to generate price probability ranges. Here are the outputs for XRP as of May 7, 2026.
Short-Term (30 Days, June 2026)
The model assigns a 61% confidence score to the base case. The key binary event is the CLARITY Act vote window closing on May 21. If the bill advances, the base target is $1.65, with a bull path to $2.10. If the bill stalls, the bear scenario targets $1.20.
Mid-Term (6 Months, November 2026)
The six-month window captures the full regulatory resolution cycle and Q3 Bitcoin seasonality. The base case puts XRP at $2.50 by late 2026, assuming regulatory clarity and continued ETF inflows. The bull case reaches $4.00 if institutional adoption accelerates. The bear scenario, which assumes stalled legislation and a broader crypto correction, targets $1.10. Model confidence: 55%.
Long-Term (2027 to 2028)
Over a two-year horizon, the model’s confidence score drops to 47%. Long time horizons in crypto introduce too many variables for high certainty. The base case puts XRP at $5.00 by end of 2027, driven by global payment network expansion and deeper institutional integration. The bull case reaches $10.00 if XRP captures meaningful market share in bank-to-bank settlement. The bear case, which assumes regulatory backlash or Ripple supply pressure dominates, puts XRP back near $1.50.
For reference, XRP’s all-time high was $3.84, set in January 2018. A move to $5.00 would be new all-time high territory. That requires sustained institutional demand, not just retail momentum. The data suggests the infrastructure for that demand is being built right now. Whether it arrives on schedule is the central uncertainty.
What to Watch This Month
These are the specific triggers to monitor in May 2026:
- May 7: GraniteShares 3x XRP ETF goes live on NASDAQ. Watch volume and price reaction in the first 48 hours.
- May 15: Jerome Powell exits as Fed Chair. A more crypto-friendly successor could boost all risk assets, XRP included.
- May 21: CLARITY Act Senate deadline. A calendar date from Scott signals the bill is advancing. No date means it is shelved.
- $1.35 support: If XRP loses this level on daily close, risk increases significantly. Watch for volume spike on any break.
- $1.80 resistance: A clean close above $1.80 on high volume would confirm the cup-and-handle breakout and open the path toward $2.10.
The data from CoinGecko’s XRP market page is worth bookmarking for live price, volume, and market cap tracking as these events unfold.
Disclaimer: This article is for informational and educational purposes only and should not be construed as financial, investment, or trading advice. Cryptocurrency markets are highly volatile, and past performance does not guarantee future results. The price predictions and analyses presented here are based on AI models, technical indicators, and available data at the time of writing. They are not guarantees. Always conduct your own research and consult with a qualified financial advisor before making any investment decisions. Pump Parade and its authors do not assume liability for financial losses incurred based on information provided in this article.
About our AI predictions: Pump Parade’s price predictions are generated by machine learning models that analyze technical indicators, on-chain data, and market sentiment. These models have limitations and cannot account for black swan events, regulatory changes, or sudden market shifts. Prediction confidence scores reflect the model’s internal assessment, not guaranteed accuracy.
