

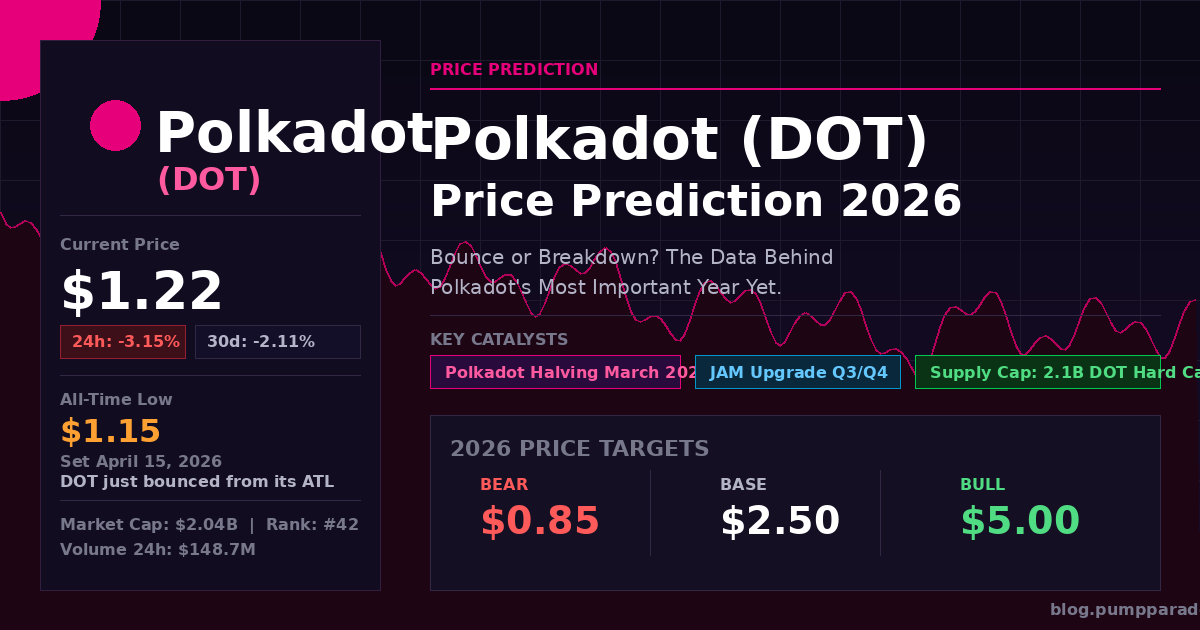
Polkadot (DOT) is trading at $1.22 as of April 30, 2026. Fifteen days ago, it touched $1.15. That was a new all-time low. The question traders are asking right now: is this a bottom, or a pause before another leg down?
Here is why the answer matters more than usual. On March 14, 2026, Polkadot completed its biggest tokenomics overhaul since launch. Annual issuance was cut by 53.6%. A hard supply cap of 2.1 billion DOT was set. This is the closest thing to a “halving” the Polkadot ecosystem has seen. And yet the price is still sitting near all-time lows.
Something has to give. In this article, we break down both paths using real market data and our AI model.
Polkadot: What You Need to Know First
Polkadot is a Layer 0 blockchain network. It connects specialized blockchains called parachains into one shared security model. The goal is interoperability. Rather than building everything on one chain, developers can create custom chains and plug them into the Polkadot relay chain.
Founded by Ethereum co-founder Gavin Wood, Polkadot was one of the most anticipated launches of the 2020 bull cycle. DOT reached a peak of $54.98 in November 2021. Since then, it has lost about 97.8% of its value in USD terms. That is a brutal drawdown by any measure.
Key metrics as of April 30, 2026:
- Current price: $1.22
- All-time low: $1.15 (April 15, 2026)
- All-time high: $54.98 (November 2021)
- Market cap: $2.04 billion (rank: #42)
- 24-hour volume: $148.7 million
- Circulating supply: 1.68 billion DOT
- Max supply: 2.1 billion DOT (hard cap, set March 2026)
For broader context on how layer-1 ecosystems are performing, see our Ethereum (ETH) Price Prediction 2026 analysis.
What Just Changed: Two Big Catalysts in Six Weeks
1. The Polkadot Halving (March 14, 2026)
This is the most important structural change in Polkadot’s history. On March 14, Polkadot governance passed two referendums that slashed annual token issuance by 53.6%. Annual new supply dropped from roughly 120 million DOT to about 56.88 million DOT per year.
The supply was previously uncapped. That is no longer true. The hard cap is now set at 2.1 billion DOT. This mirrors the mechanics of Bitcoin’s halving cycle. Inflation drops immediately from roughly 10% to 3.11%. It then falls by 13.14% of remaining issuance every two years. By the early 2030s, inflation will be below 1%.
In theory, this is deeply bullish. Lower supply growth means each existing DOT becomes relatively more scarce over time. In practice, the market has not priced this in yet. DOT actually fell to its all-time low the month after the halving. That disconnect is worth noting.
2. The Hyperbridge Exploit (April 13, 2026)
Two weeks before DOT hit its all-time low, a hacker exploited a vulnerability in the Hyperbridge gateway contract on Ethereum. The attacker forged a cross-chain message, gained admin access to the bridged DOT token contract, and minted approximately 1 billion tokens.
The revised total realized loss is approximately $2.5 million. That number is relatively small. The attacker could not extract the full notional value because the bridged DOT pool on Ethereum did not have enough liquidity to absorb 1 billion tokens.
Critically, Polkadot confirmed that native DOT on the Polkadot relay chain was not affected. The exploit was limited to DOT bridged through Hyperbridge to Ethereum. Still, the incident shook market confidence and contributed to the price dropping to $1.15.
For current on-chain data and price history, see Polkadot’s CoinGecko page.
Technical Analysis: Where DOT Stands Now
DOT is in a long-term downtrend. The 200-day moving average sits well above the current price. The 50-day moving average is also sloping downward. That is a bearish technical picture on the higher timeframes.
However, a few signals suggest a potential short-term shift:
- ATL bounce: DOT hit $1.15 on April 15 and has recovered about 6% since. Buyers appeared at that level.
- RSI (Relative Strength Index): On the weekly chart, RSI is in deeply oversold territory. Readings this low have historically preceded multi-week relief rallies, even within larger downtrends.
- Volume: The 24-hour volume of $148.7M is moderate relative to the market cap. It does not yet show the kind of capitulation spike that typically marks a genuine bottom.
- Key resistance: The first meaningful resistance sits at $1.40, which was support during the March sell-off. Above that, $1.80 becomes the next target.
- Key support: The $1.15 ATL is the line in the sand. A confirmed break below it would signal continued downside with no historical support levels to reference.
In plain terms: DOT is technically damaged, but it is sitting at a level where a bounce is plausible. It is not a clean setup in either direction yet.
The Bull Case for DOT in 2026
The bull case rests on three overlapping catalysts. Any one of them could move DOT significantly. All three together could be transformational.
The halving effect takes time to show up. Bitcoin’s halving cycle shows that supply reductions typically take 6 to 12 months to show up in price. The Polkadot halving happened in March. If the same dynamic plays out, the second half of 2026 is when the reduced supply pressure becomes most visible.
JAM (Join-Accumulate Machine) is arriving in 2026. JAM is the next major upgrade to Polkadot’s architecture. It is sometimes called Polkadot 3.0. Q3 and Q4 2026 are targeted for critical testing and early deployment phases. Forty-three independent teams are competing for a 10 million DOT prize pool for protocol conformance. That level of developer competition signals genuine technical momentum.
The price-to-fundamentals gap is extreme. At $1.22, DOT is trading at 97.8% below its all-time high. The project is still actively developing, has a $2 billion market cap, and just implemented the most significant tokenomics upgrade in its history. Contrarian buyers see this as a deeply undervalued asset with a clear catalytic roadmap.
In this scenario, our AI model assigns the following targets:
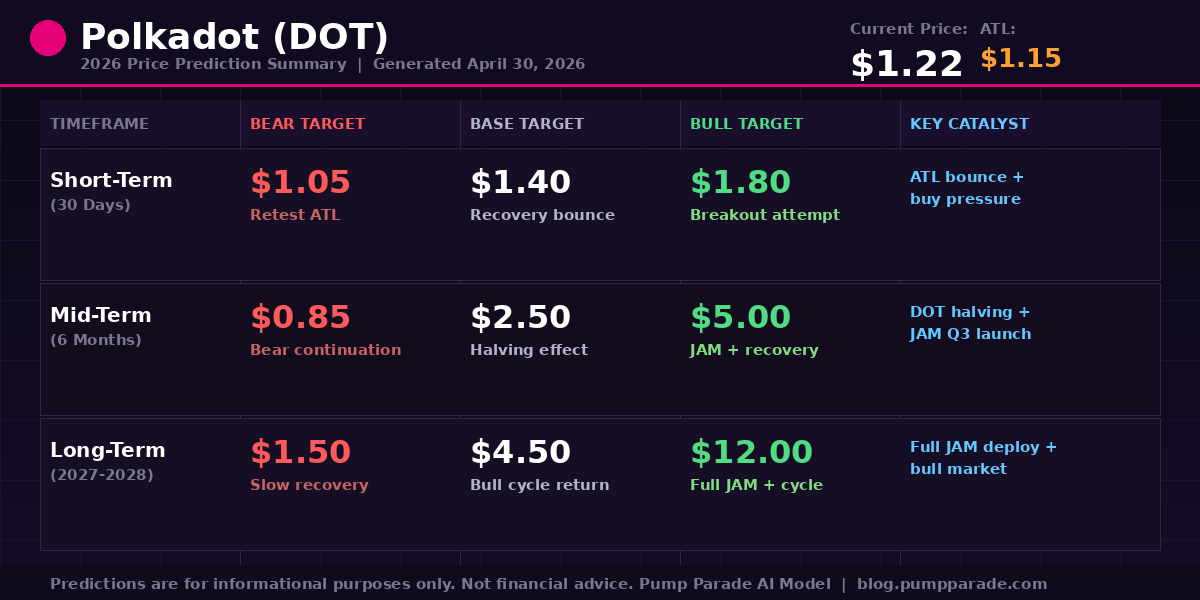
- Short-term (30 days): Recovery to $1.40-$1.80 as the ATL bounce holds and buyers return
- Mid-term (6 months): $2.50-$3.50 as the halving supply reduction starts to matter and JAM enters testnet phase
- Long-term (2027-2028): $4.50-$12.00 if a broader bull market coincides with full JAM deployment
The Bear Case for DOT in 2026
Here is the uncomfortable reality: DOT has been losing ground for over four years. There are legitimate reasons why.
The competitive landscape has shifted. Ethereum L2s have absorbed much of the interoperability narrative that Polkadot once owned. Solana has captured developer mindshare for high-throughput use cases. Polkadot has not broken into the mainstream of DeFi or memecoin culture. The parachain model, while technically sophisticated, has not yet driven the kind of user activity that drives token demand.
The Hyperbridge exploit raised questions. Even though native DOT was unaffected, cross-chain security is now a visible risk factor. Any further bridge incidents would likely accelerate selling.
Macro conditions remain uncertain. The broader crypto market has been choppy in 2026. If Bitcoin enters a sustained decline, altcoins with weaker momentum tend to fall harder. DOT has underperformed BTC and ETH significantly over the past year.
No confirmed floor yet. The ATL at $1.15 was set just 15 days ago. That is too recent to confirm as a structural support level. If selling pressure returns, there is no historical price floor below $1.15 to reference.
In the bear scenario:
- Short-term (30 days): Retest of $1.15 ATL, possible breakdown toward $1.00-$1.05
- Mid-term (6 months): $0.85 if JAM faces delays and macro conditions deteriorate
- Long-term (2027-2028): $1.50 recovery floor in a slow-grind scenario without a major bull market
AI Price Prediction Summary
Our hybrid AI model analyzes technical indicators, on-chain metrics, supply dynamics, and sentiment signals. Here is what it is showing for DOT across three time horizons:
The model assigns a 52% probability to the base case range over the next six months. The key swing factor is whether the JAM upgrade launches on schedule in Q3. A confirmed Q3 mainnet milestone would likely push DOT into the $2.50-$3.50 zone. A delay would reinforce the bear case.
The model also flags that the DOT halving has not yet been priced in. Based on historical patterns from comparable supply-reduction events in other proof-of-stake networks, the peak impact on price tends to arrive 6 to 9 months after the event. That puts the window at September to December 2026.
What to Watch
These are the specific signals that will determine which scenario plays out:
- $1.15 support: This is the ATL. A confirmed weekly close below $1.15 is the clearest bear signal. Watch this level above all others.
- $1.40 resistance: A clean break and hold above $1.40 would be the first technical confirmation of a trend reversal. Bulls need this level to flip to support.
- JAM testnet milestones (Q3 2026): Official announcements from Polkadot Foundation on JAM Toaster and Tart testnet progress are key catalysts. Watch the official Polkadot blog and governance channels.
- Bitcoin correlation: DOT tracks BTC closely in risk-off periods. A sustained BTC rally above $95,000 would likely lift the altcoin market and benefit DOT disproportionately.
- Bridge security: Any further cross-chain security incidents will weigh on DOT. Monitor Hyperbridge’s post-mortem actions and any new bridge audits.
The Bottom Line
Polkadot is at an inflection point. The tokenomics are genuinely improved. The JAM upgrade is the most technically ambitious upgrade in the project’s history. The price is near its all-time low. That combination is either a compelling value setup or a value trap, depending on execution.
The data points toward a cautious bull case for the second half of 2026. But the bear risks are real, and the $1.15 support level is untested enough to deserve serious respect. This is not a “buy and forget” situation. It requires active monitoring of the catalysts outlined above.
As always: size positions accordingly, and do not bet more than you can afford to lose on a single asset with this level of drawdown history.
Disclaimer: This article is for informational and educational purposes only and should not be construed as financial, investment, or trading advice. Cryptocurrency markets are highly volatile, and past performance does not guarantee future results. The price predictions and analyses presented here are based on AI models, technical indicators, and available data at the time of writing. They are not guarantees. Always conduct your own research and consult with a qualified financial advisor before making any investment decisions. Pump Parade and its authors do not assume liability for financial losses incurred based on information provided in this article.
About our AI predictions: Pump Parade’s price predictions are generated by machine learning models that analyze technical indicators, on-chain data, and market sentiment. These models have limitations and cannot account for black swan events, regulatory changes, or sudden market shifts. Prediction confidence scores reflect the model’s internal assessment, not guaranteed accuracy. Use AI predictions as one input among many in your research.
