

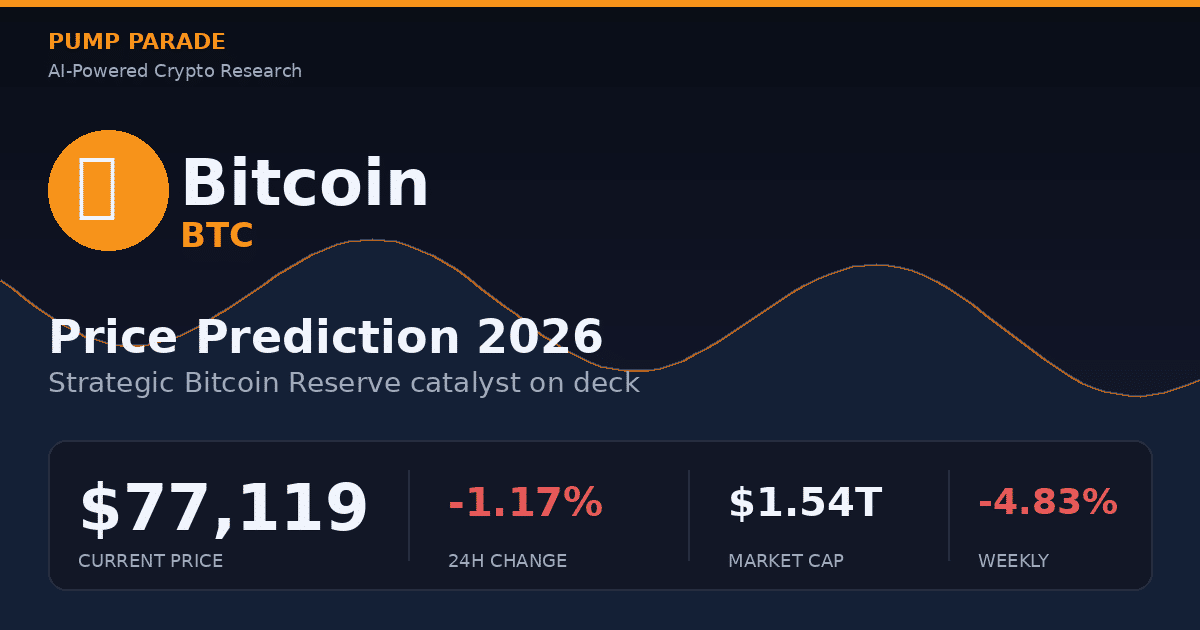
Bitcoin just had its worst week since February. BTC is trading at $77,119, down roughly 4.83% on the week and 1.17% in the past 24 hours. The total market cap sits near $1.54 trillion. Iran-related geopolitical pressure on May 18 forced about $657 million in liquidations and snapped support in a single session.
And yet the bigger story is what is coming next. White House digital assets director Patrick Witt told the Consensus Miami audience that a major update on the Strategic Bitcoin Reserve is due “in the next few weeks.” That clock started ticking on May 6. We are now squarely inside the window where an announcement could land. So the question is simple. Does this dip get bought, or does Bitcoin trade lower from here? Let’s look at the data.
Bitcoin in May 2026: where the price actually sits
Before we get to predictions, let’s set the scene with real numbers. Bitcoin opened the week near $81,070. It then sold off every single session from Monday through Saturday. The Fear and Greed Index has dropped to 28, firmly in fear territory.
Here’s the technical snapshot as of May 19:
- Price: $77,119
- 14-day RSI: 35.2 (approaching oversold)
- MACD: -335.97 (bearish, no reversal yet)
- 200-day moving average: $80,517 (price is below)
- Key supports: $76,500, $75,537 (Strategy average cost), $74,900, $73,500
- Key resistance: $80,000, $81,000, $82,228 (200-day MA)
Translation: BTC is bruised but not broken. The price is sitting on a thick support cluster between $73K and $76K. The 200-day moving average has flipped from a floor into a ceiling. That is the level bulls need to reclaim. Until they do, the trend on the daily is down.
The catalysts that actually matter
1. The Strategic Bitcoin Reserve announcement
This is the headline catalyst. The US government already holds roughly 328,372 BTC, worth about $25 billion, mostly from criminal forfeitures. That makes the Treasury the largest known sovereign Bitcoin holder, sitting on close to 1.56% of total supply.
Patrick Witt has called the recent custody and legal compliance work a “breakthrough.” The framework is reportedly ready. According to CoinDesk’s reporting from Consensus Miami, the next update is imminent. If the announcement includes a real purchase plan, the supply shock is mechanical. If it is just a custody and “no sales” framework, the market reaction will be more muted.
Behind the headline sits Senator Cynthia Lummis’ BITCOIN Act of 2025. That bill would direct the Treasury to buy 200,000 BTC per year for five years, then hold for at least 20 years. If it passes, the first official purchase is estimated for Q4 2026. The market is already pricing in some probability of that path.
2. ETF flows are choppy but still net positive YTD
April was the best month of the year for spot Bitcoin ETF inflows. The category pulled in about $2.44 billion, with BlackRock’s IBIT capturing roughly 70% of that flow. May started strong. Spot Bitcoin ETFs took in $630 million on May 1, then $1.1 billion across two early-month sessions.
Then the music slowed. May 7 saw $268.5 million in net outflows, led by Fidelity’s FBTC and IBIT. ETF flows have been the most reliable directional signal for BTC all year. When they go positive, price follows. When they go negative, dips like this one show up.
For a similar ETF-driven setup playing out in a different corner of the market, see our recent breakdown on Hyperliquid and its ETF catalyst. The mechanics are the same. Institutional rails change who gets to buy.
3. Post-halving supply dynamics
The April 2024 halving keeps doing its quiet work. New supply is roughly half of what it was. Miner sell pressure is structurally lower. When ETF buying returns at scale, those flows hit a thinner book than they did in 2023. That is the supply-side bull case in one sentence.
4. Macro is the swing factor
The bond market and geopolitics drove this week’s selloff. Rising yields and the Iran headlines pulled risk assets lower together. Crypto did not break in isolation. If yields cool and the geopolitical premium fades, BTC should re-rate higher quickly. If they do not, $73K becomes a real test.
Bitcoin technical outlook
The chart is in a corrective phase, not a breakdown. Here is what we are watching:
- Bullish reversal trigger: Daily close back above the 200-day MA at $82,228, ideally with rising RSI and a MACD crossover.
- Range scenario: Price chops between $73,500 and $82,000 while the market waits on the Reserve update. This is the base case for the next few weeks.
- Bearish trigger: A daily close below $73,500 on heavy volume opens the door to $68,000 and the April low.
RSI in the mid-30s is the kind of reading where short-term bounces tend to start. It is not a buy signal on its own. It is a flag that the easy downside has likely been priced in.
Bitcoin price prediction 2026: by timeframe
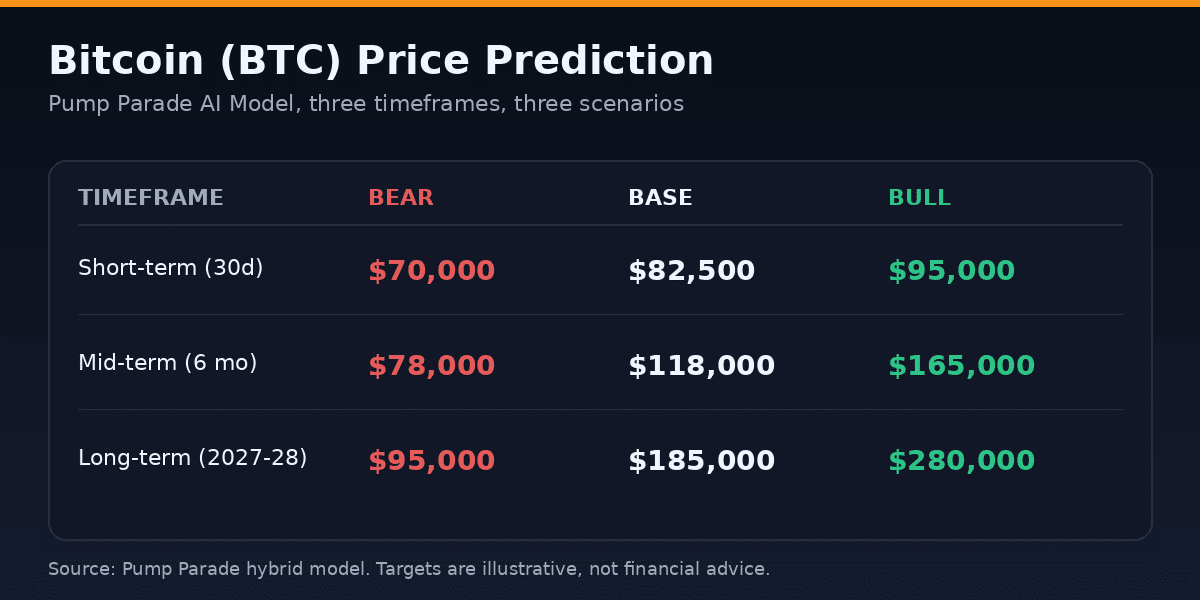
Short-term (next 30 days)
- Bear: $70,000. Macro stays heavy, Reserve announcement underwhelms, BTC tests the April lows.
- Base: $82,500. BTC stabilizes, reclaims the 200-day MA, and the Reserve update lands roughly as expected.
- Bull: $95,000. A strong Reserve announcement plus a return of net ETF inflows triggers a sharp short squeeze.
The most likely path is the base case. RSI is stretched to the downside. The catalyst calendar is loaded. But Bitcoin can still hand out one more flush before the next leg.
Mid-term (6 months, through November 2026)
- Bear: $78,000. The cycle stalls, ETF flows go net negative, the Reserve framework gets delayed.
- Base: $118,000. ETF accumulation resumes, the Reserve framework is signed into law, BTC tracks the standard post-halving timeline.
- Bull: $165,000. Treasury begins active purchases ahead of schedule, macro rates fall, and the cycle accelerates.
The base case aligns with Citigroup’s $112,000 view and is in the same neighborhood as several institutional models. The bull case requires the political and policy stars to align. It is not impossible, but it is not the modal outcome either.
Long-term (2027-2028)
- Bear: $95,000. The four-year cycle ends, BTC enters a multi-year sideways grind.
- Base: $185,000. Standard cycle plays out with deeper ETF integration and slow sovereign buying.
- Bull: $280,000. Fundstrat’s Tom Lee has called for $250K by year-end 2026. Stretched into 2027 with continued ETF inflows and active Treasury buying, $280K becomes the upper bound.
You can read the full live BTC market data on CoinGecko if you want to cross-check our numbers against your own.
The bear case nobody wants to talk about
Every bull cycle has a graveyard of “this time is different” calls. Here is what could go wrong:
- Reserve announcement is a dud. A custody framework with no buy plan is already partially priced in. A miss could trigger a 10% to 15% drop.
- ETF outflows accelerate. If BlackRock’s IBIT starts seeing sustained daily outflows above $200 million, the mechanical bid for BTC weakens fast.
- Macro tail risk. A real bond market dislocation or a deeper geopolitical event can take risk assets down together. BTC is not insulated.
- Cycle exhaustion. Some analysts argue the four-year cycle is over and that this is the start of a longer consolidation. The data does not confirm that yet, but it is not impossible.
The discipline is to hold both pictures in your head at the same time. The setup looks attractive. The risk is also real.
What to watch this week
- Daily ETF flow data, especially IBIT and FBTC
- Any official statement from the President’s Council of Advisors for Digital Assets
- Daily closes relative to $76,500 support and $80,000 resistance
- RSI behavior: a bullish divergence on the 4-hour would be an early reversal signal
- Bond yields and Iran-related headlines as the macro overlay
The Pump Parade take
This is a setup worth monitoring closely, not chasing. Bitcoin is oversold inside a still-intact uptrend, sitting on real support, with a known catalyst due inside the next few weeks. The probability favors a base case in the $80K to $120K range over the next six months. The path is unlikely to be smooth.
If the Reserve announcement lands soft, BTC re-rates higher. If it lands hot, the move is faster. If it lands as nothing, the chart still has work to do. The job is to be positioned for the asymmetry, not to predict the headline.
Disclaimer: This article is for informational and educational purposes only and should not be construed as financial, investment, or trading advice. Cryptocurrency markets are highly volatile, and past performance does not guarantee future results. The price predictions and analyses presented here are based on AI models, technical indicators, and available data at the time of writing, they are not guarantees. Always conduct your own research (DYOR) and consult with a qualified financial advisor before making any investment decisions. Pump Parade and its authors do not assume liability for financial losses incurred based on information provided in this article.
