

SOL at $83: Bargain Buy or Falling Knife?
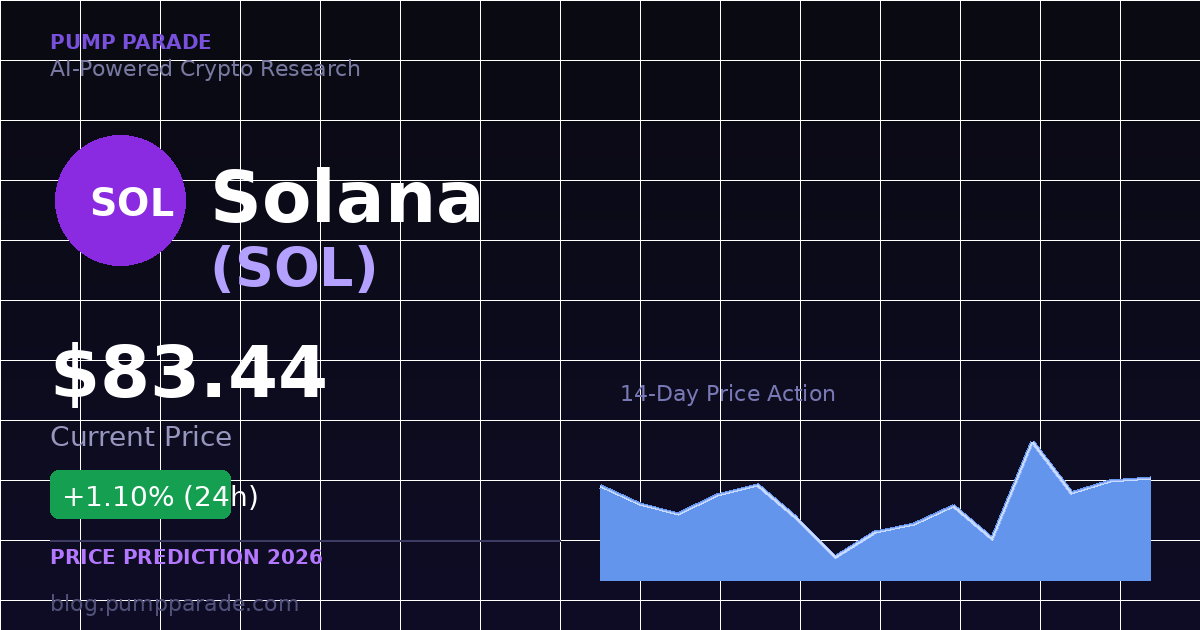
Solana is trading at $83.44 as of April 10, 2026, down roughly 72% from its all-time high of $295 reached in January 2025. Daily trading volume on Solana-based markets sits above $17 billion, making it one of the most liquid ecosystems in crypto outside of Bitcoin and Ethereum.
That disconnect between activity and price tells an interesting story. The network is not slowing down. The ecosystem is not dying. Something else is weighing on the price, and understanding what it is matters if you are trying to figure out whether SOL has a path back to three digits in 2026.
Our hybrid AI model has analyzed on-chain data, technical indicators, and macro conditions. Here is what the data suggests, along with both sides of the trade.
What Is Solana? A Quick Overview
Solana is a high-performance Layer 1 blockchain built for speed and low cost. It uses a hybrid of Proof of Stake and a mechanism called Proof of History (PoH), which lets the network process transactions without requiring validators to communicate timestamps. The result: up to 65,000 transactions per second at sub-cent gas fees.
Founded by Anatoly Yakovenko in 2017, Solana has grown into one of the top five blockchains by market cap. Its ecosystem spans DeFi, NFTs, memecoins, gaming, and increasingly, real-world asset (RWA) tokenization. As of March 2026, RWA tokenization on Solana crossed $2 billion, a milestone driven by partnerships with institutional players like Ondo Finance and State Street.
The circulating supply is approximately 573 million SOL, with a market cap of roughly $47.9 billion at current prices.
Current Price Context: What the Chart Is Telling Us
Over the past two weeks, SOL has traded in a tight band between $76.66 and $88.74. That range tells you the market is undecided. Neither buyers nor sellers have conviction right now.
Key technical observations from Birdeye and on-chain data:
- Support zone: $78 to $81 has held twice in the past 10 days. A close below $76 would signal a more serious breakdown.
- Resistance zone: $87 to $88 is the first hurdle. Above that, the $94 to $96 range is where sellers have been concentrated since February.
- RSI: The Relative Strength Index (RSI, a momentum indicator measuring whether an asset is overbought or oversold) sits near 52. That is squarely neutral. No extreme in either direction.
- Moving averages: SOL is trading below both the 50-day and 200-day moving averages. Until it reclaims the 50-day (currently near $94), the trend remains cautiously bearish on higher timeframes.
The pattern of lower highs since January 2025 is real and worth taking seriously. But the $78 support has held consistently, which is an equally real signal.
The Alpenglow Upgrade: Solana’s Biggest Catalyst in Years
The single most important development for SOL in 2026 is the Alpenglow consensus upgrade.
Here is the short version: Solana currently takes about 12 seconds to finalize a transaction. Alpenglow will cut that to approximately 150 milliseconds, an 80x improvement. The upgrade redesigns the validator coordination protocol using a new mechanism called Votor, a lightweight voting process that finalizes blocks in one or two rounds instead of multiple communication cycles.
The Solana community voted on the proposal with 98.27% approval from participating validators. Mainnet launch is expected in 2026, likely in the second half of the year based on current testnet timelines.
Why does this matter for price? Speed is a competitive moat. At 150ms finality, Solana becomes the fastest finalized Layer 1 by a wide margin. That opens the door for use cases that currently require centralized infrastructure: high-frequency trading platforms, real-time payment rails, and consumer apps that need near-instant confirmation.
The bull case is that Alpenglow is a genuine step-function improvement. Not a marketing upgrade, but a technical one that expands what Solana can do.
The Bull Case for SOL in 2026
The bull case rests on three pillars.
Pillar 1: Alpenglow launch triggers a re-rating. If Alpenglow ships in Q3 or Q4 2026, the narrative around Solana will shift. Developers targeting high-frequency use cases have been waiting for this. A successful mainnet launch could drive a wave of new applications and capital inflows. Historical precedent: Ethereum’s major upgrades have consistently preceded 60 to 90-day rallies.
Pillar 2: RWA tokenization tailwind. Solana’s RWA ecosystem crossed $2 billion in March 2026. That number is still small relative to Ethereum’s, but the growth rate is fast. As institutional players like Ondo Finance and State Street deepen their Solana integration, SOL benefits as the gas and staking asset powering those transactions.
Pillar 3: Bitcoin’s trajectory sets the floor. BTC is currently near $71,000 to $72,000. If Bitcoin follows its historical post-halving pattern and moves toward the $85,000 to $100,000 range by Q4, capital rotation into altcoins tends to follow. SOL has historically outperformed Bitcoin during altcoin seasons by a significant margin.
Bull price targets from our model: $110 to $130 by June 2026, with a high-conviction upside scenario of $180 to $200 if Alpenglow ships cleanly and Bitcoin breaks above $85,000.
The Bear Case for SOL in 2026
The bear case is straightforward and should not be dismissed.
Risk 1: Macro deterioration. Geopolitical tensions and trade policy uncertainty have weighed on risk assets throughout early 2026. If macro conditions worsen, higher rates, wider credit spreads, and equity selloffs would pull crypto lower with them. SOL’s $78 support could become $65, and $65 could become $50 in a severe risk-off environment.
Risk 2: Alpenglow delays or execution risk. Consensus mechanism upgrades are extremely complex. Any security vulnerability, validator coordination issues, or timeline slippage could disappoint the market. The 98% validator approval is encouraging, but approval is not the same as flawless execution.
Risk 3: Competition from Ethereum Layer 2s. Ethereum’s scaling roadmap is progressing. Multiple Layer 2 solutions now offer sub-cent fees and fast finality. If the speed gap between Solana and Ethereum’s ecosystem narrows, the narrative case for SOL weakens.
Risk 4: The lower-highs pattern. The chart has printed lower highs since the January 2025 peak. Until SOL reclaims $95 and holds it, that trend is intact. Breaking a trend of this duration requires a catalyst, not just optimism.
Bear price targets: $65 to $72 in a deteriorating macro scenario. A breakdown below $76 would likely test the $65 range quickly.
AI Price Prediction Summary
Our hybrid model combines technical indicators, on-chain metrics, and sentiment signals to generate probabilistic price ranges. These are scenario-weighted outputs, not guarantees.
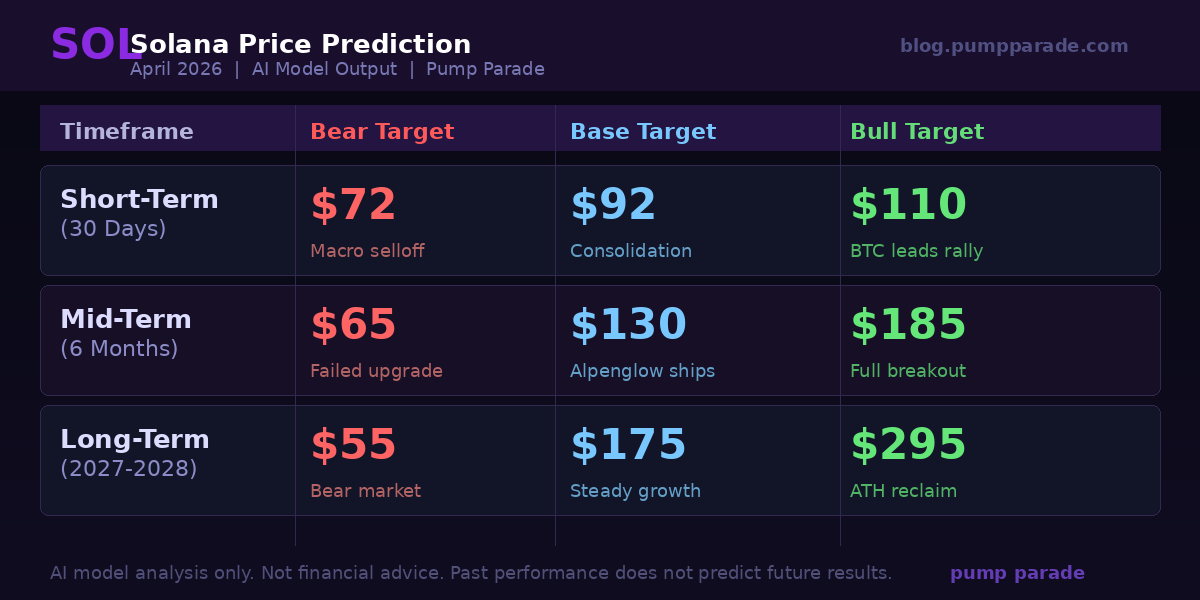
Short-Term Prediction (30 Days)
SOL is in a consolidation phase with neutral momentum. The 30-day base case is range-bound price action between $80 and $95, with a breakout attempt toward $100 if Bitcoin shows strength.
- Bear target: $72
- Base target: $92
- Bull target: $110
Mid-Term Prediction (6 Months)
The six-month window is where Alpenglow becomes a swing factor. A successful upgrade announcement or testnet milestone should act as a catalyst. Our model assigns 55% probability to the base case, 25% to the bear, and 20% to the bull.
- Bear target: $65
- Base target: $130
- Bull target: $185
Long-Term Prediction (2027-2028)
Longer-term price targets depend heavily on whether Solana can capture meaningful market share in RWA tokenization and high-frequency DeFi. The 2028 Bitcoin halving cycle is also a significant variable for the entire crypto market.
- Bear target: $55
- Base target: $175
- Bull target: $295 (reclaim of all-time high)
What to Watch
These are the specific signals worth monitoring over the next 90 days:
- Alpenglow testnet progress. Any announcement of mainnet launch timing will move the price. Watch Solana Foundation announcements and validator communications.
- Bitcoin above $80,000. BTC sustaining above $80K creates the conditions for altcoin rotation. SOL tends to outperform in those environments.
- The $78 support level. This is the line. A weekly close below $78 changes the near-term picture significantly.
- $88 to $94 resistance. A clean break and retest above $88 would be the first signal that the lower-highs pattern is breaking.
- RWA tokenization milestones. Watch for Solana ecosystem announcements around institutional partnerships or new RWA products. Each additional $1 billion in RWA added is a credibility signal for the network.
If you are researching Solana’s memecoin ecosystem alongside the broader price outlook, check out our guide on Solana Memecoins: How to Find Massive Crypto Moonshots. It covers how the Solana ecosystem works at the retail trading layer and what drives memecoin cycles on the network.
The Bottom Line
SOL at $83 is not obviously cheap, and it is not obviously expensive. The network is among the most active in crypto. The upcoming Alpenglow upgrade is a legitimate technical catalyst. The RWA tokenization story is gaining traction with real institutional money.
But the chart is still printing lower highs, macro uncertainty is real, and complex upgrades carry execution risk. The data supports cautious optimism for a recovery toward $130 by October 2026. Blind confidence is not warranted.
The setup is worth monitoring. It is not a layup.
Disclaimer: This article is for informational and educational purposes only and should not be construed as financial, investment, or trading advice. Cryptocurrency markets are highly volatile, and past performance does not guarantee future results. The price predictions and analyses presented here are based on AI models, technical indicators, and available data at the time of writing. They are not guarantees. Always conduct your own research (DYOR) and consult with a qualified financial advisor before making any investment decisions. Pump Parade and its authors do not assume liability for financial losses incurred based on information provided in this article.
About our AI predictions: Pump Parade’s price predictions are generated by machine learning models that analyze technical indicators, on-chain data, and market sentiment. These models have limitations and cannot account for black swan events, regulatory changes, or sudden market shifts. Prediction confidence scores reflect the model’s internal assessment, not guaranteed accuracy. Use AI predictions as one input among many in your research.
